
A Comparative Analysis on the Environmental Impact of Selected Methods for Determining the Profile of Fatty Acids in Cheese

Abstract
:1. Introduction
2. Results and Discussion
2.1. Optimization of GC-FID Conditions
2.2. Comparison of Preparation Methods for FAME Determination
2.3. Assessment of the Method of Greenness
3. Materials and Methods
3.1. Cheese Sample
3.2. Chemical and Reagents
3.3. Lipid Extraction and FAME Preparation
- Method A [20]: 50 mg of cheese was mixed with 1 mL of n-hexane and 0.2 mL of KOH/MeOH (0.2 M). The sample was vortexed for 3 min and allowed to rest for 15 min, and 1 mL of HCl/MeOH (10%) was added. The sample was vortexed for 10 s and incubated (50 °C/10 min). After cooling, 2 mL of ultrapure water and 2 mL of n-hexane were added to the sample. The sample was mixed for 10 s and centrifuged for 5 min, and then a 0.5 g of anhydrous sodium sulfate was added. The sample was vortexed for 30 s and centrifuged for 5 min. The n-hexane phase was collected. The total time of sample preparation was about 60 min.
- Method B [21]: 1 g of cheese was added to 0.4 mL of ammonia (25%), 1 mL of EtOH (95%), and 5 mL of n-hexane. After centrifugation, the upper layer was collected and the sample was re-extracted with 1 mL of EtOH (95%) and 5 mL of n-hexane. The sample was centrifuged, the upper layer was collected, and the sample was extracted again using 5 mL of n-hexane. All the obtained phases were collected. The upper phases obtained during each extraction were pooled together, dried under nitrogen, and dissolved in 1 mL of n-hexane. The total time of sample preparation was about 60 min.
- Method C [22]: 1 g of cheese was mixed (250 rpm; 3 min) with 4 mL of MeOH, 2 mL of dichloromethane, and 1 mg of BHT. Then, 2 mL of dichloromethane and 2 mL of distilled water were added to the sample and gently shaken for 20 s, followed by centrifugation (2800 rpm; 15 min). The apolar layer was collected in a glass vial, and the sample was evaporated with nitrogen (40 °C; 25 min). Afterward, 100 µL of KOH/MeOH (0.2 M) was added to the sample. The mixture was incubated (95 °C; 20 min) and cooled to stop the derivatization reaction, and 1 mL of n-hexane was added. The total time of sample preparation was about 90 min.
- Method D [23]: 1 g of cheese was homogenized in 15 mL of chloroform–methanol (2:1; v/v). The mixture was shaken mechanically (20 min) and centrifuged (7300 rpm; 5 min). Then, the mixture was filtered, and then 15 mL of chloroform–methanol and 3 mL of KCl (0.74%) were added to the filtrates. After centrifugation (7300 rpm; 5 min), the chloroform layer was collected and mixed with 3 g of anhydrous sodium sulfate. Then, the mixture was filtrated and the extract was concentrated by removing chloroform in a rotary evaporator and dried over a gentle stream of nitrogen. Then, 100 mg of the obtained fat was weighed in a test tube and dissolved in 5 mL of n-hexane. Next, 0.2 mL of KOH/MeOH (0.2 M) was added to the mixture and shaken vigorously with a vortex mixer (1 min). After an additional reaction time of 5 min, 0.5 g of anhydrous sodium hydrogen sulfate was added and mixed again. The sample was centrifuged (3 min) and the extract was collected. The total time of sample preparation was about 95 min.
- Method E [24]: 2.5 g of cheese was added to a 25 mL of chloroform–methanol (2:1; v/v) and BHT (0.001%). The mixture was homogenized (2500 rpm; 30 min) and ultrasonicated (Amplifier 35%; 20 min), and 10 mL of saturated NaCl solution was added. The suspension was then centrifuged (20 min; 4000 rpm). The chloroform layer was removed using a rotary evaporator. Then, 100 mg of the obtained fat was weighed in a test tube and dissolved in 5 mL of n-hexane. Next, 0.2 mL of KOH/MeOH (0.2 M) was added to the mixture and shaken vigorously with a vortex mixer (1 min). After an additional reaction time of 5 min, 0.5 g of anhydrous sodium hydrogen sulfate was added and mixed again. The sample was centrifuged (3 min) and the extract was collected. The total time of sample preparation was about 100 min.
- Method F [25]: The 3 g samples were homogenized (1 min) with 30 mL of MeOH. Then, 30 mL of chloroform was added, and the mixture was homogenized (2 min). The prepared mixture was filtered into a glass cylinder. The solid residue was mixed in 60 mL of chloroform–methanol (2:1; v/v) and homogenized again for 3 min. The mixture was transferred to the same cylinder. Next, NaCl (0.88%) in water was added to the total filtrate (in the amount constituting ¼ of the filtrate volume), then shaken and left overnight. The lower layer was mixed with H2O/MeOH (1:1; v/v). The washing procedure was repeated. The remaining layer was dehydrated with anhydrous sodium sulfate and the mixture was evaporated. Then, 100 mg of the obtained fat was weighed in a test tube and dissolved in 5 mL of n-hexane. Next, 0.2 mL of KOH/MeOH was added to the mixture and shaken vigorously with a vortex mixer (1 min). After an additional reaction time of 5 min, 0.5 g of anhydrous sodium hydrogen sulfate was added and mixed again. The sample was centrifuged (3 min) and the extract was collected. The total time of sample preparation was about 26 h.
3.4. GC Analysis
3.5. Statistical Analysis
4. Conclusions
Supplementary Materials
Author Contributions
Funding
Institutional Review Board Statement
Informed Consent Statement
Data Availability Statement
Conflicts of Interest
References
- González-Martín, M.I.; Vivar-Quintana, A.M.; Revil-la, I.; Salvador-Esteban, J. The determination of fatty acids in cheeses of variable composition (cow, ewe’s, and goat) by means of near-infrared spectroscopy. Microchem. J. 2020, 156, 104854. [Google Scholar] [CrossRef]
- Zhang, R.H.; Mustafa, A.F.; Zhao, X. Effects of feeding oilseeds rich in linoleic and linolenic fatty acids to lactating ewes on cheese yield and on fatty acid composition of milk and cheese. Anim. Feed Sci. Technol. 2006, 127, 220–233. [Google Scholar] [CrossRef]
- Feeney, E.L.; Lamichhane, P.; Sheehan, J.J. The cheese matrix: Understanding the impact of cheese structure on aspects of cardiovascular health—A food science and a human nutrition perspective. Int. J. Dairy Technol. 2021, 74, 656–670. [Google Scholar] [CrossRef]
- Paszczyk, B.; Łuczyńska, J. The Comparison of Fatty Acid Composition and Lipid Quality Indices in Hard Cow, Sheep, and Goat Cheeses. Foods 2020, 9, 1667. [Google Scholar] [CrossRef]
- Cardin, M.; Cardazzo, B.; Mounier, J.; Novelli, E.; Coton, M.; Coton, E. Authenticity and Typicity of Traditional Cheeses: A Review on Geographical Origin Authentication Methods. Foods 2022, 11, 3379. [Google Scholar] [CrossRef]
- Ganesan, B.; Weimer, B.C.; Qian, M.C.; Burbank, H.M. Compounds associated with cheese flavor. In Improving Flavour Cheese; Woodhead Publishing: Cambridge, UK, 2007; pp. 26–51. [Google Scholar]
- Giaccone, D.; Revello-Chion, A.; Galassi, L.; Bianchi, P.; Battelli, G.; Coppa, M.; Tabacco, E.; Borreani, G. Effect of milk thermisation and farming system on cheese sensory profile and fatty acid composition. Int. Dairy J. 2016, 59, 10–19. [Google Scholar] [CrossRef]
- Zamuz, S.; Pateiro, M.; Conte-Junior, C.A.; Domínguez, R.; Nawaz, A.; Walayat, N.; Lorenzo, J.M. Fat and fatty acids. In Food Lipids: Sources Health Implic. Future Trends; Academic Press: Cambridge, MA, USA, 2022; pp. 155–172. [Google Scholar]
- Ballester-Caudet, A.; Campíns-Falcó, P.; Pérez, B.; Sancho, R.; Lorente, M.; Sastre, G.; González, C. A new tool for evaluating and/or selecting analytical methods: Summarizing the information in a hexagon. TrAC Trends Anal. Chem. 2019, 118, 538–547. [Google Scholar] [CrossRef]
- Gałuszka, A.; Migaszewski, Z.M.; Konieczka, P.; Namieśnik, J. Analytical Eco-Scale for assessing the greenness of analytical procedures. TrAC Trends Anal. Chem. 2012, 37, 61–72. [Google Scholar] [CrossRef]
- Jurjeva, J.; Koel, M. Implementing greening into design in analytical chemistry. Talanta Open 2022, 6, 100136. [Google Scholar] [CrossRef]
- Mohamed, D.; Fouad, M.M. Application of NEMI, Analytical Eco-Scale and GAPI tools for greenness assessment of three developed chromatographic methods for quantification of sulfadiazine and trimethoprim in bovine meat and chicken muscles: Comparison to greenness profile of reported HPLC methods. Microchem. J. 2020, 157, 104873. [Google Scholar]
- Narloch, I.; Wejnerowska, G. Comparison of the Effectiveness and Environmental Impact of Selected Methods for the Determination of Fatty Acids in Milk Samples. Molecules 2022, 27, 8242. [Google Scholar] [CrossRef] [PubMed]
- Pena-Pereira, F.; Wojnowski, W.; Tobiszewski, M. AGREE—Analytical GREEnness Metric Approach and Software. Anal. Chem. 2020, 92, 10076–10082. [Google Scholar] [CrossRef]
- Płotka-Wasylka, J. A new tool for the evaluation of the analytical procedure: Green Analytical Procedure Index. Talanta 2018, 181, 204–209. [Google Scholar] [CrossRef]
- Wojnowski, W.; Tobiszewski, M.; Pena-Pereira, F.; Psillakis, E. AGREEprep—Analytical greenness metric for sample preparation. TrAC Trends Anal. Chem. 2022, 149, 116553. [Google Scholar] [CrossRef]
- Comparison of 37 Component FAME Standard on Four Capillary GC Columns; Bulletin 907; Supelco: Bellefonte, PA, USA, 1996.
- da Silva, W.L.G.; Oliveira, A.G.; Tubino, M. Response Factor in GC-FID Methyl Ester Analysis in Several Biodiesels: A Comparative Study of the EN 14103:2011 and ABNT 15764:2015 Methods versus a Proposed GC-FID Procedure for Individual Ester Determination. J. Braz. Chem. Soc. 2022, 33, 260–267. [Google Scholar] [CrossRef]
- Singh, D.; Chopra, A.; Kumar, R.; Sastry, M.I.S.; Patel, M.B.; Basu, B. Response factor correction for estimation of ester content in biodiesel. Chromatographia 2014, 77, 165–169. [Google Scholar] [CrossRef]
- Sant’Ana, A.M.S.; Bessa, R.J.B.; Alves, S.P.; Medei-ros, A.N.; Costa, R.G.; de Sousa, Y.R.F.; Bezerril, F.F.; Malveira Batista, A.S.; Madruga, M.S.; Queiroga, R.C.R.E. Fatty acid, volatile and sensory profiles of milk and cheese from goats raised on native semiarid pasture or in confinement. Int. Dairy J. 2019, 91, 147–154. [Google Scholar] [CrossRef]
- Campione, A.; Pauselli, M.; Natalello, A.; Valenti, B.; Pomente, C.; Avondo, M.; Luciano, G.; Caccamo, M.; Morbidini, L. Inclusion of cocoa by-product in the diet of dairy sheep: Effect on the fatty acid profile of ruminal content and on the composition of milk and cheese. Animal 2021, 15, 100243. [Google Scholar] [CrossRef]
- Margalho, L.P.; Kamimura, B.A.; Pimentel, T.C.; Balthazar, C.F.; Araujo, J.V.A.; Silva, R.; Conte-Junior, C.A.; Raices, R.S.L.; Cruz, A.G.; Sant’Ana, A.S. A large survey of the fatty acid profile and gross composition of Brazilian artisanal cheeses. J. Food Compos. Anal. 2021, 101, 103955. [Google Scholar] [CrossRef]
- Govari, M.; Iliadis, S.; Papageorgiou, D.; Fletouris, D. Seasonal changes in fatty acid and conjugated linoleic acid contents of ovine milk and kefalotyri cheese during ripening. Int. Dairy J. 2020, 109, 104775. [Google Scholar] [CrossRef]
- Kim, N.S.; Lee, J.H.; Han, K.M.; Kim, J.W.; Cho, S.; Kim, J. Discrimination of commercial cheeses from fatty acid profiles and phytosterol contents obtained by GC and PCA. Food Chem. 2014, 143, 40–47. [Google Scholar] [CrossRef]
- Paszczyk, B.; Polak-Śliwińska, M.; Łuczyńska, J. Fatty acids profile, trans isomers, and lipid quality indices in smoked and unsmoked cheeses and cheese-like products. Int. J. Environ. Res. Public Health 2020, 17, 71. [Google Scholar] [CrossRef] [Green Version]
- ISO 16958:2015; Milk, Milk Products, Infant Formula and Adult Nutritionals—Determination of Fatty Acids Composition—Capillary Gas Chromatographic Method. International Standard: Geneva, Switzerland, 2015.
- Folch, J.; Lees, M.; Sloane Stanley, G.H. A Simple Method for the Isolation and Purification of Total Lipides from Animal Tissues. J. Biol. Chem. 1957, 226, 497–509. [Google Scholar] [CrossRef] [PubMed]
- El-Metwally, R.I.; El-Menawy, R.K.; Ismail, M.M. Correlation between free fatty acids content and textural properties of Gouda cheese supplemented with denatured whey protein paste. J. Food Sci. Technol. 2023, 60, 590–599. [Google Scholar] [CrossRef] [PubMed]
- Indumathi, K.P.; Kaushik, R.; Arora, S.; Wadhwa, B.K. Evaluation of iron fortified Gouda cheese for sensory and physicochemical attributes. J. Food Sci. Technol. 2015, 52, 493–499. [Google Scholar] [CrossRef]
- Semeniuc, C.A.; Mandrioli, M.; Socaci, B.S.; Socaciu, M.I.; Fogarasi, M.; Podar, A.S.; Michiu, D.; Jimborean, A.M.; Mureşan, V.; Ionescu, S.R.; et al. Changes in lipid composition and oxidative status during ripening of Gouda-type cheese as influenced by addition of lavender flower powder. Int. Dairy J. 2022, 133, 105427. [Google Scholar] [CrossRef]
- Kelani, K.M.; Elzanfaly, E.S.; Saad, A.S.; Halim, M.K.; El-Zeiny, M.B. Different greenness assessment perspectives for stability-indicating RP-HPLC method used for the assay of isoxsuprine hydrochloride and four nephrotoxic and hepatotoxic photothermal degradation products. Microchem. J. 2021, 171, 106826. [Google Scholar] [CrossRef]
- Saleh, S.S.; Lotfy, H.M.; Tiris, G.; Erk, N.; Rostom, Y. Analytical tools for greenness assessment of chromatographic approaches: Application to pharmaceutical combinations of Indapamide, Perindopril and Amlodipine. Microchem. J. 2020, 159, 105557. [Google Scholar] [CrossRef]
- Pena-Pereira, F.; Tobiszewski, M.; Wojnowski, W.; Psillakis, E. A Tutorial on AGREEprep an Analytical Greenness Metric for Sample Preparation. Adv. Sample Prep. 2022, 3, 100025. [Google Scholar] [CrossRef]


| Nr of FA | FA | Method A | Method B | Method C | Method D | Method E | Method F |
|---|---|---|---|---|---|---|---|
| 1 | C4:0 | 0.01 ± 0.01 a | 0.06 ± 0.01 a | 4.80 ± 0.72 c | 2.72 ± 0.24 b | 2.97 ± 0.27 b | 2.87 ± 0.39 b |
| 2 | C6:0 | 0.01 ± 0.00 a | 0.09 ± 0.02 a | 1.93 ± 0.29 b | 1.41 ± 0.31 bc | 1.13 ± 0.34 c | 1.23 ± 0.39 c |
| 3 | C8:0 | 0.05 ± 0.04 a | 0.27 ± 0.01 a | 1.54 ± 0.10 c | 1.08 ± 0.20 b | 0.81 ± 0.23 b | 0.90 ± 0.36 b |
| 4 | C10:0 | 1.06 ± 0.15 a | 0.51 ± 0.21 a | 4.66 ± 0.13 d | 2.70 ± 0.09 b | 2.43 ± 0.21 bc | 2.01 ± 0.52 c |
| 5 | C11:0 | 0.01 ± 0.00 c | 0.11 ± 0.03 ab | 0.11 ± 0.01 ab | 0.10 ± 0.00 ab | 0.07 ± 0.01 a | 0.12 ± 0.05 a |
| 6 | C12:0 | 2.96 ± 0.18 a | 1.42 ± 0.30 d | 4.98 ± 0.13 e | 3.91 ± 0.21 b | 3.47 ± 0.24 abc | 2.94 ± 0.53 ac |
| 7 | C13:0 | 0.10 ± 0.00 a | 0.49 ± 0.13 b | 0.16 ± 0.01 a | 0.15 ± 0.01 a | 0.12 ± 0.01 a | 0.12 ± 0.03 a |
| 8 | C14:0 | 12.07 ± 0.40 a | 8.83 ± 0.86 d | 13.94 ± 0.30 e | 12.17 ± 0.58 ab | 11.68 ± 0.45 abc | 11.82 ± 1.54 abc |
| 9 | C14:1 | 1.20 ± 0.06 ab | 0.96 ± 0.14 ac | 1.75 ± 0.06 d | 1.39 ± 0.07 bde | 1.30 ± 0.04 bcef | 1.30 ± 0.33 bcef |
| 10 | C15:0 | 1.95 ± 0.14 a | 1.43 ± 0.04 f | 2.21 ± 0.17 abc | 2.28 ± 0.09 cd | 1.96 ± 0.04 be | 2.02 ± 0.28 bde |
| 11 | C15:1 | 0.41 ± 0.02 a | 0.78 ± 0.36 b | 0.51 ± 0.29 abc | 0.37 ± 0.01 ac | 0.32 ± 0.00 ac | 0.36 ± 0.08 ac |
| 12 | C16:0 | 43.85 ± 1.33 a | 37.17 ± 0.23 b | 38.17 ± 1.22 b | 41.62 ± 1.12 ac | 42.45 ± 0.63 ac | 41.94 ± 1.87 ac |
| 13 | C16:1 | 2.15 ± 0.10 ab | 2.56 ± 0.03 c | 2.21 ± 0.09 ad | 2.42 ± 0.07 c | 2.18 ± 0.03 bde | 2.15 ± 0.12 bde |
| 14 | C17:0 | 0.98 ± 0.06 a | 0.86 ± 0.12 a | 0.90 ± 0.20 a | 0.99 ± 0.03 a | 0.93 ± 0.02 a | 0.98 ± 0.12 a |
| 15 | C17:1 | 0.45 ± 0.01 a | 0.70 ± 0.16 b | 0.57 ± 0.24 abc | 0.46 ± 0.05 acd | 0.41 ± 0.01 acde | 0.48 ± 0.06 acde |
| 16 | C18:0 | 8.29 ± 0.66 b | 9.00 ± 1.35 b | 4.56 ± 0.09 c | 6.41 ± 0.28 a | 6.62 ± 0.24 a | 6.47 ± 0.29 a |
| 17 + 18 | C18:1n9t + C18:1n9c | 19.60 ± 1.46 b | 23.80 ± 0.59 c | 12.76 ± 0.16 d | 15.43 ± 1.12 a | 16.66 ± 0.56 a | 15.36 ± 1.67 a |
| 19 | C18:2n6c | 0.65 ± 0.05 a | 0.93 ± 0.33 b | 0.54 ± 0.06 a | 0.71 ± 0.02 ab | 0.67 ± 0.04 a | 0.45 ± 0.37 a |
| 20 | C18:2n6t | 1.99 ± 0.08 a | 2.67 ± 0.23 d | 1.46 ± 0.04 b | 1.68 ± 0.07 bc | 1.65 ± 0.05 bc | 1.75 ± 0.26 ac |
| 21 | C20:0 | 0.17 ± 0.02 b | 0.28 ± 0.07 a | 0.28 ± 0.09 a | 0.28 ± 0.01 a | 0.23 ± 0.02 a | 0.21 ± 0.08 a |
| 22 | C18:3n3 | 1.11 ± 0.08 a | 5.24 ± 0.68 b | 1.03 ± 0.06 a | 1.07 ± 0.04 a | 1.11 ± 0.04 a | 1.11 ± 0.07 a |
| 23 | C20:1n9 | 0.92 ± 0.02 a | 1.84 ± 0.31 c | 0.92 ± 0.07 a | 1.12 ± 0.05 ab | 1.13 ± 0.05 ab | 1.23 ± 0.17 b |
| Sums | |||||||
| ∑SFA 1 | 71.52 | 60.53 | 78.25 | 75.82 | 74.87 | 73.62 | |
| ∑UFA 2 | 24.73 | 30.64 | 18.71 | 21.19 | 21.99 | 20.88 | |
| ∑MUFA 3 | 3.74 | 8.84 | 3.04 | 3.46 | 3.43 | 3.31 | |
| ∑PUFA 4 | 20.25 | 24.73 | 13.30 | 16.15 | 17.32 | 15.80 | |
| Method | Metrics | |
|---|---|---|
| Analytical Eco-Scale Score | AGREEprep Pictogram | |
| A | 73 acceptable green analysis |  |
| B | 63 acceptable green analysis |  |
| C | 71 acceptable green analysis |  |
| D | 61 acceptable green analysis |  |
| E | 63 acceptable green analysis | 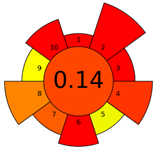 |
| F | 61 acceptable green analysis | 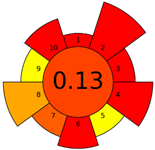 |
Disclaimer/Publisher’s Note: The statements, opinions and data contained in all publications are solely those of the individual author(s) and contributor(s) and not of MDPI and/or the editor(s). MDPI and/or the editor(s) disclaim responsibility for any injury to people or property resulting from any ideas, methods, instructions or products referred to in the content. |
© 2023 by the authors. Licensee MDPI, Basel, Switzerland. This article is an open access article distributed under the terms and conditions of the Creative Commons Attribution (CC BY) license (https://creativecommons.org/licenses/by/4.0/).
Share and Cite
Narloch, I.; Wejnerowska, G. A Comparative Analysis on the Environmental Impact of Selected Methods for Determining the Profile of Fatty Acids in Cheese. Molecules 2023, 28, 4981. https://doi.org/10.3390/molecules28134981
Narloch I, Wejnerowska G. A Comparative Analysis on the Environmental Impact of Selected Methods for Determining the Profile of Fatty Acids in Cheese. Molecules. 2023; 28(13):4981. https://doi.org/10.3390/molecules28134981
Chicago/Turabian StyleNarloch, Izabela, and Grażyna Wejnerowska. 2023. "A Comparative Analysis on the Environmental Impact of Selected Methods for Determining the Profile of Fatty Acids in Cheese" Molecules 28, no. 13: 4981. https://doi.org/10.3390/molecules28134981