
Comparison of Chemical Compositions and Antioxidant Activities for the Immature Fruits of Citrus changshan-huyou Y.B. Chang and Citrus aurantium L.


Abstract
:1. Introduction
2. Results and Discussion
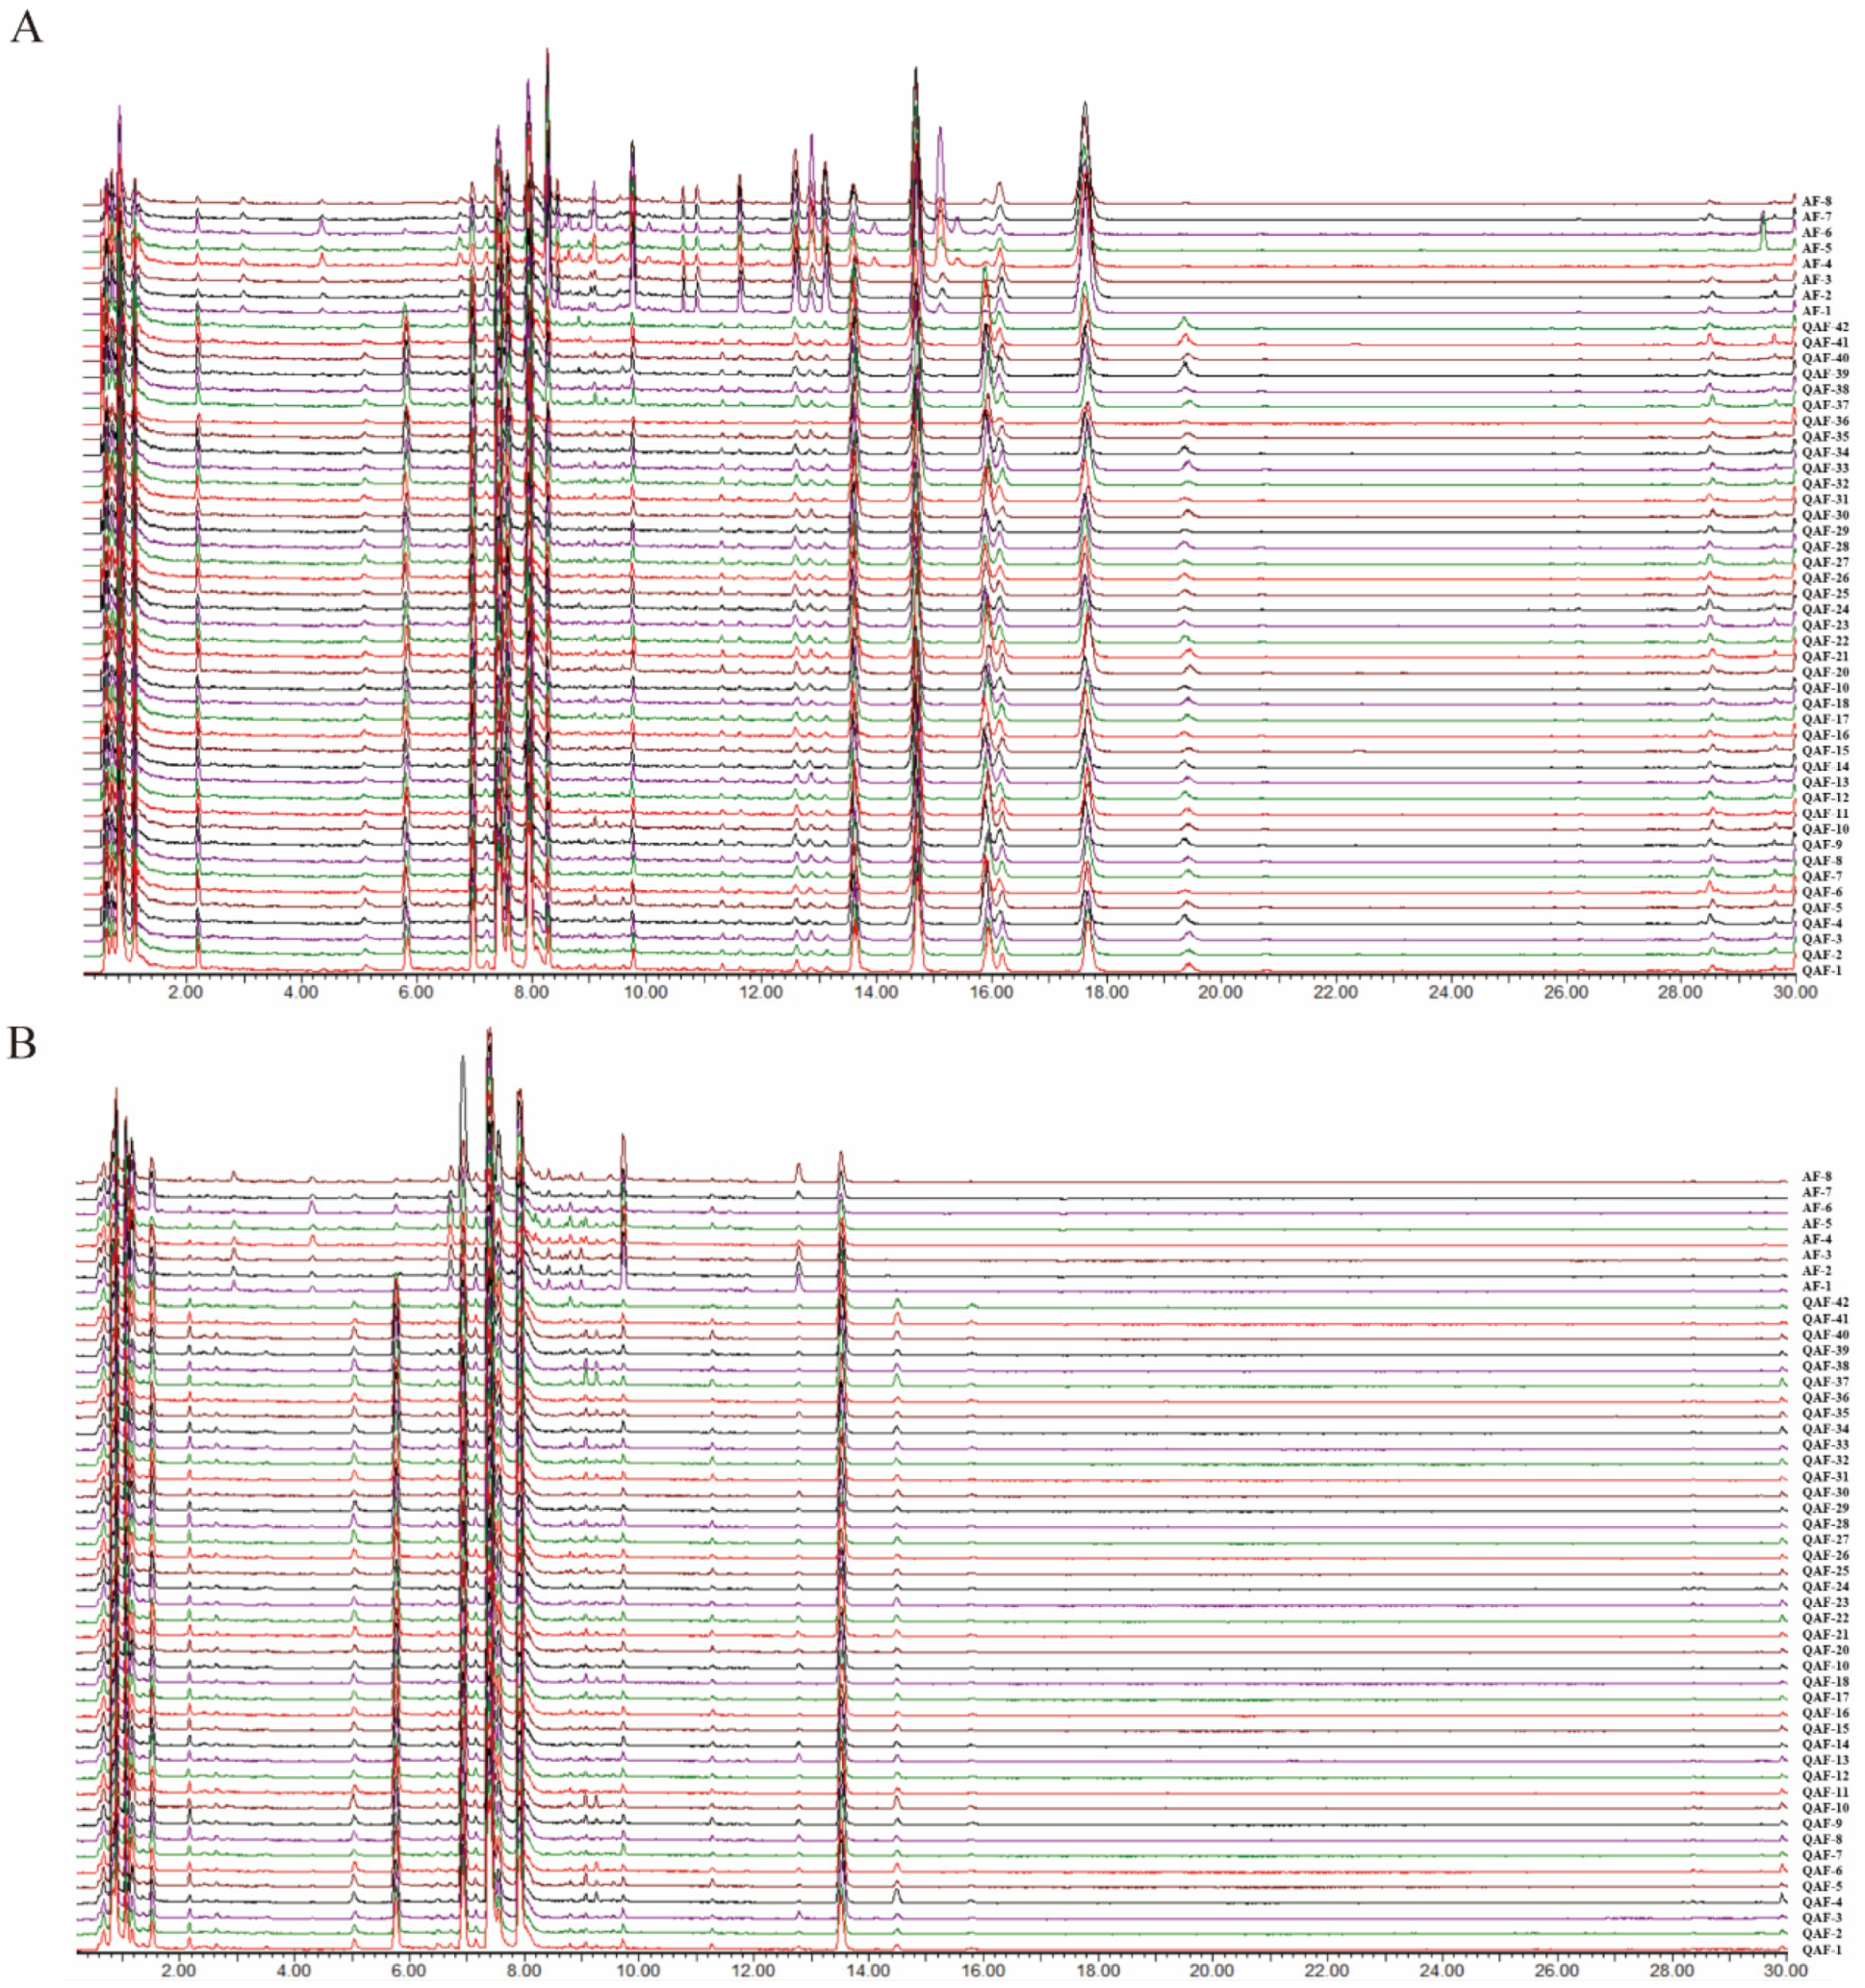
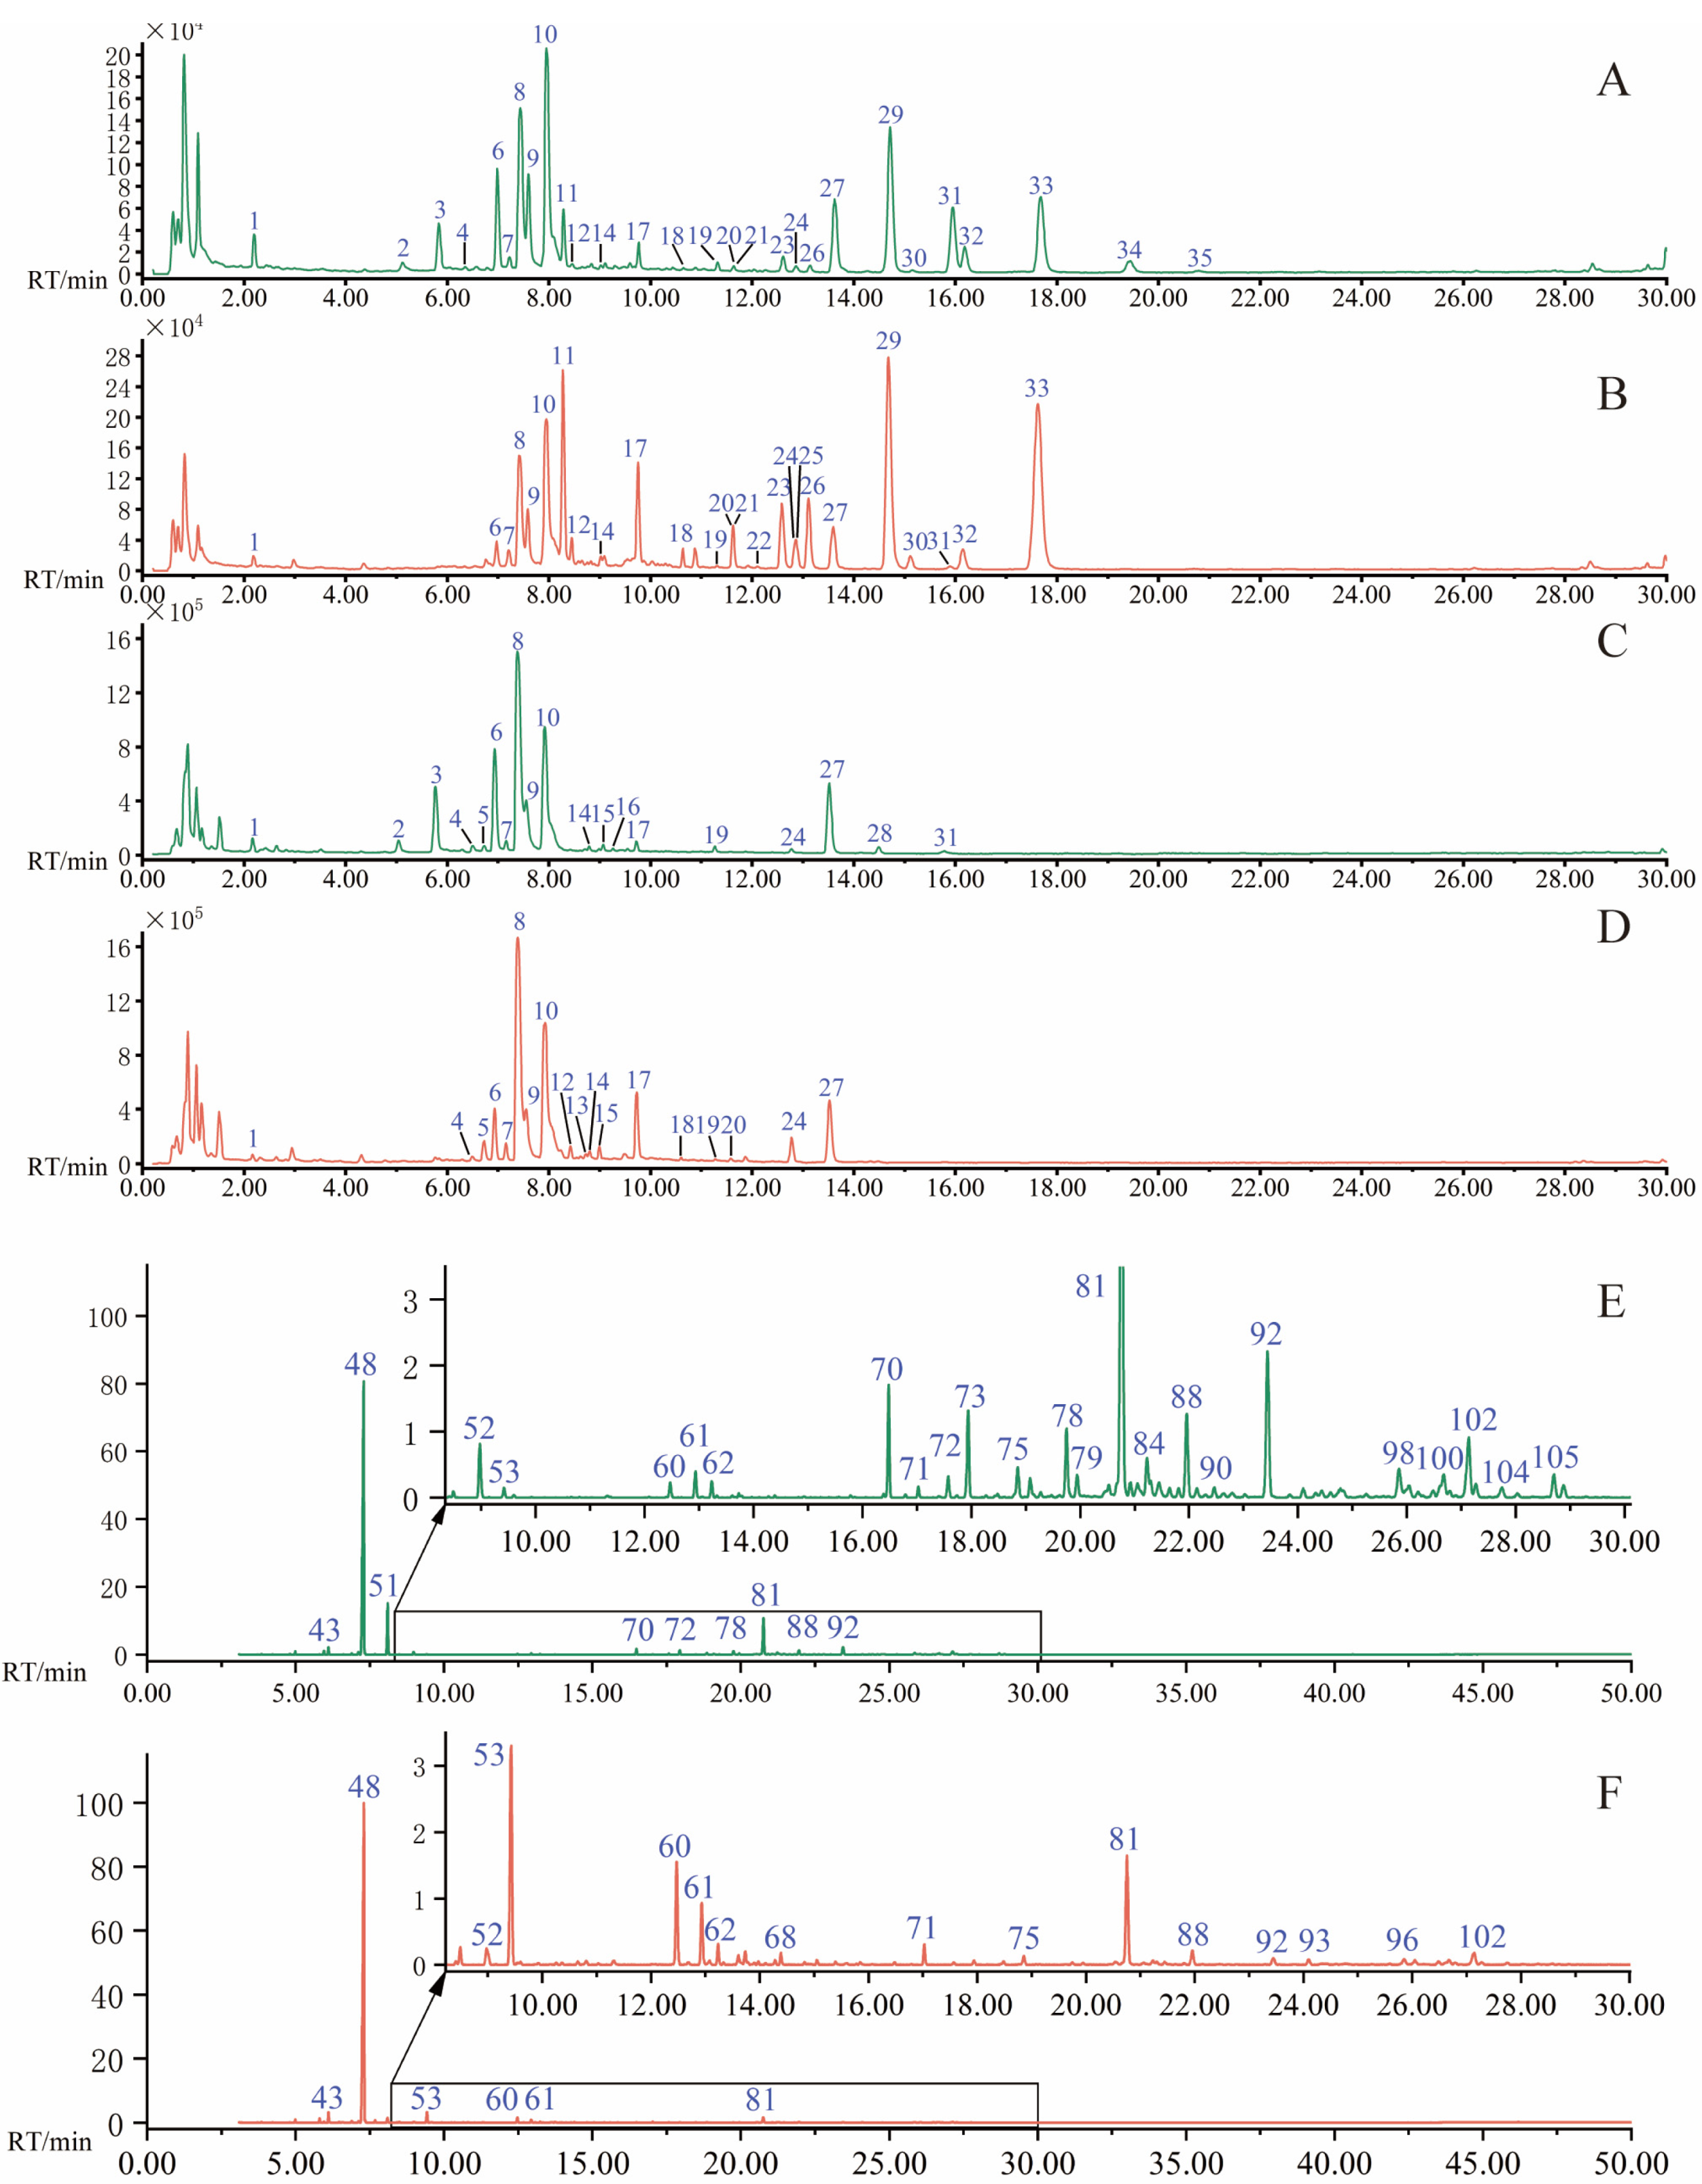
2.1. UPLC−QTOF/MS Analysis and Identification
2.1.1. Flavonoids
2.1.2. Limonoids
2.1.3. Coumarins
2.2. Analysis of Volatile Compounds by GC−MS
2.3. Chemometric Analysis
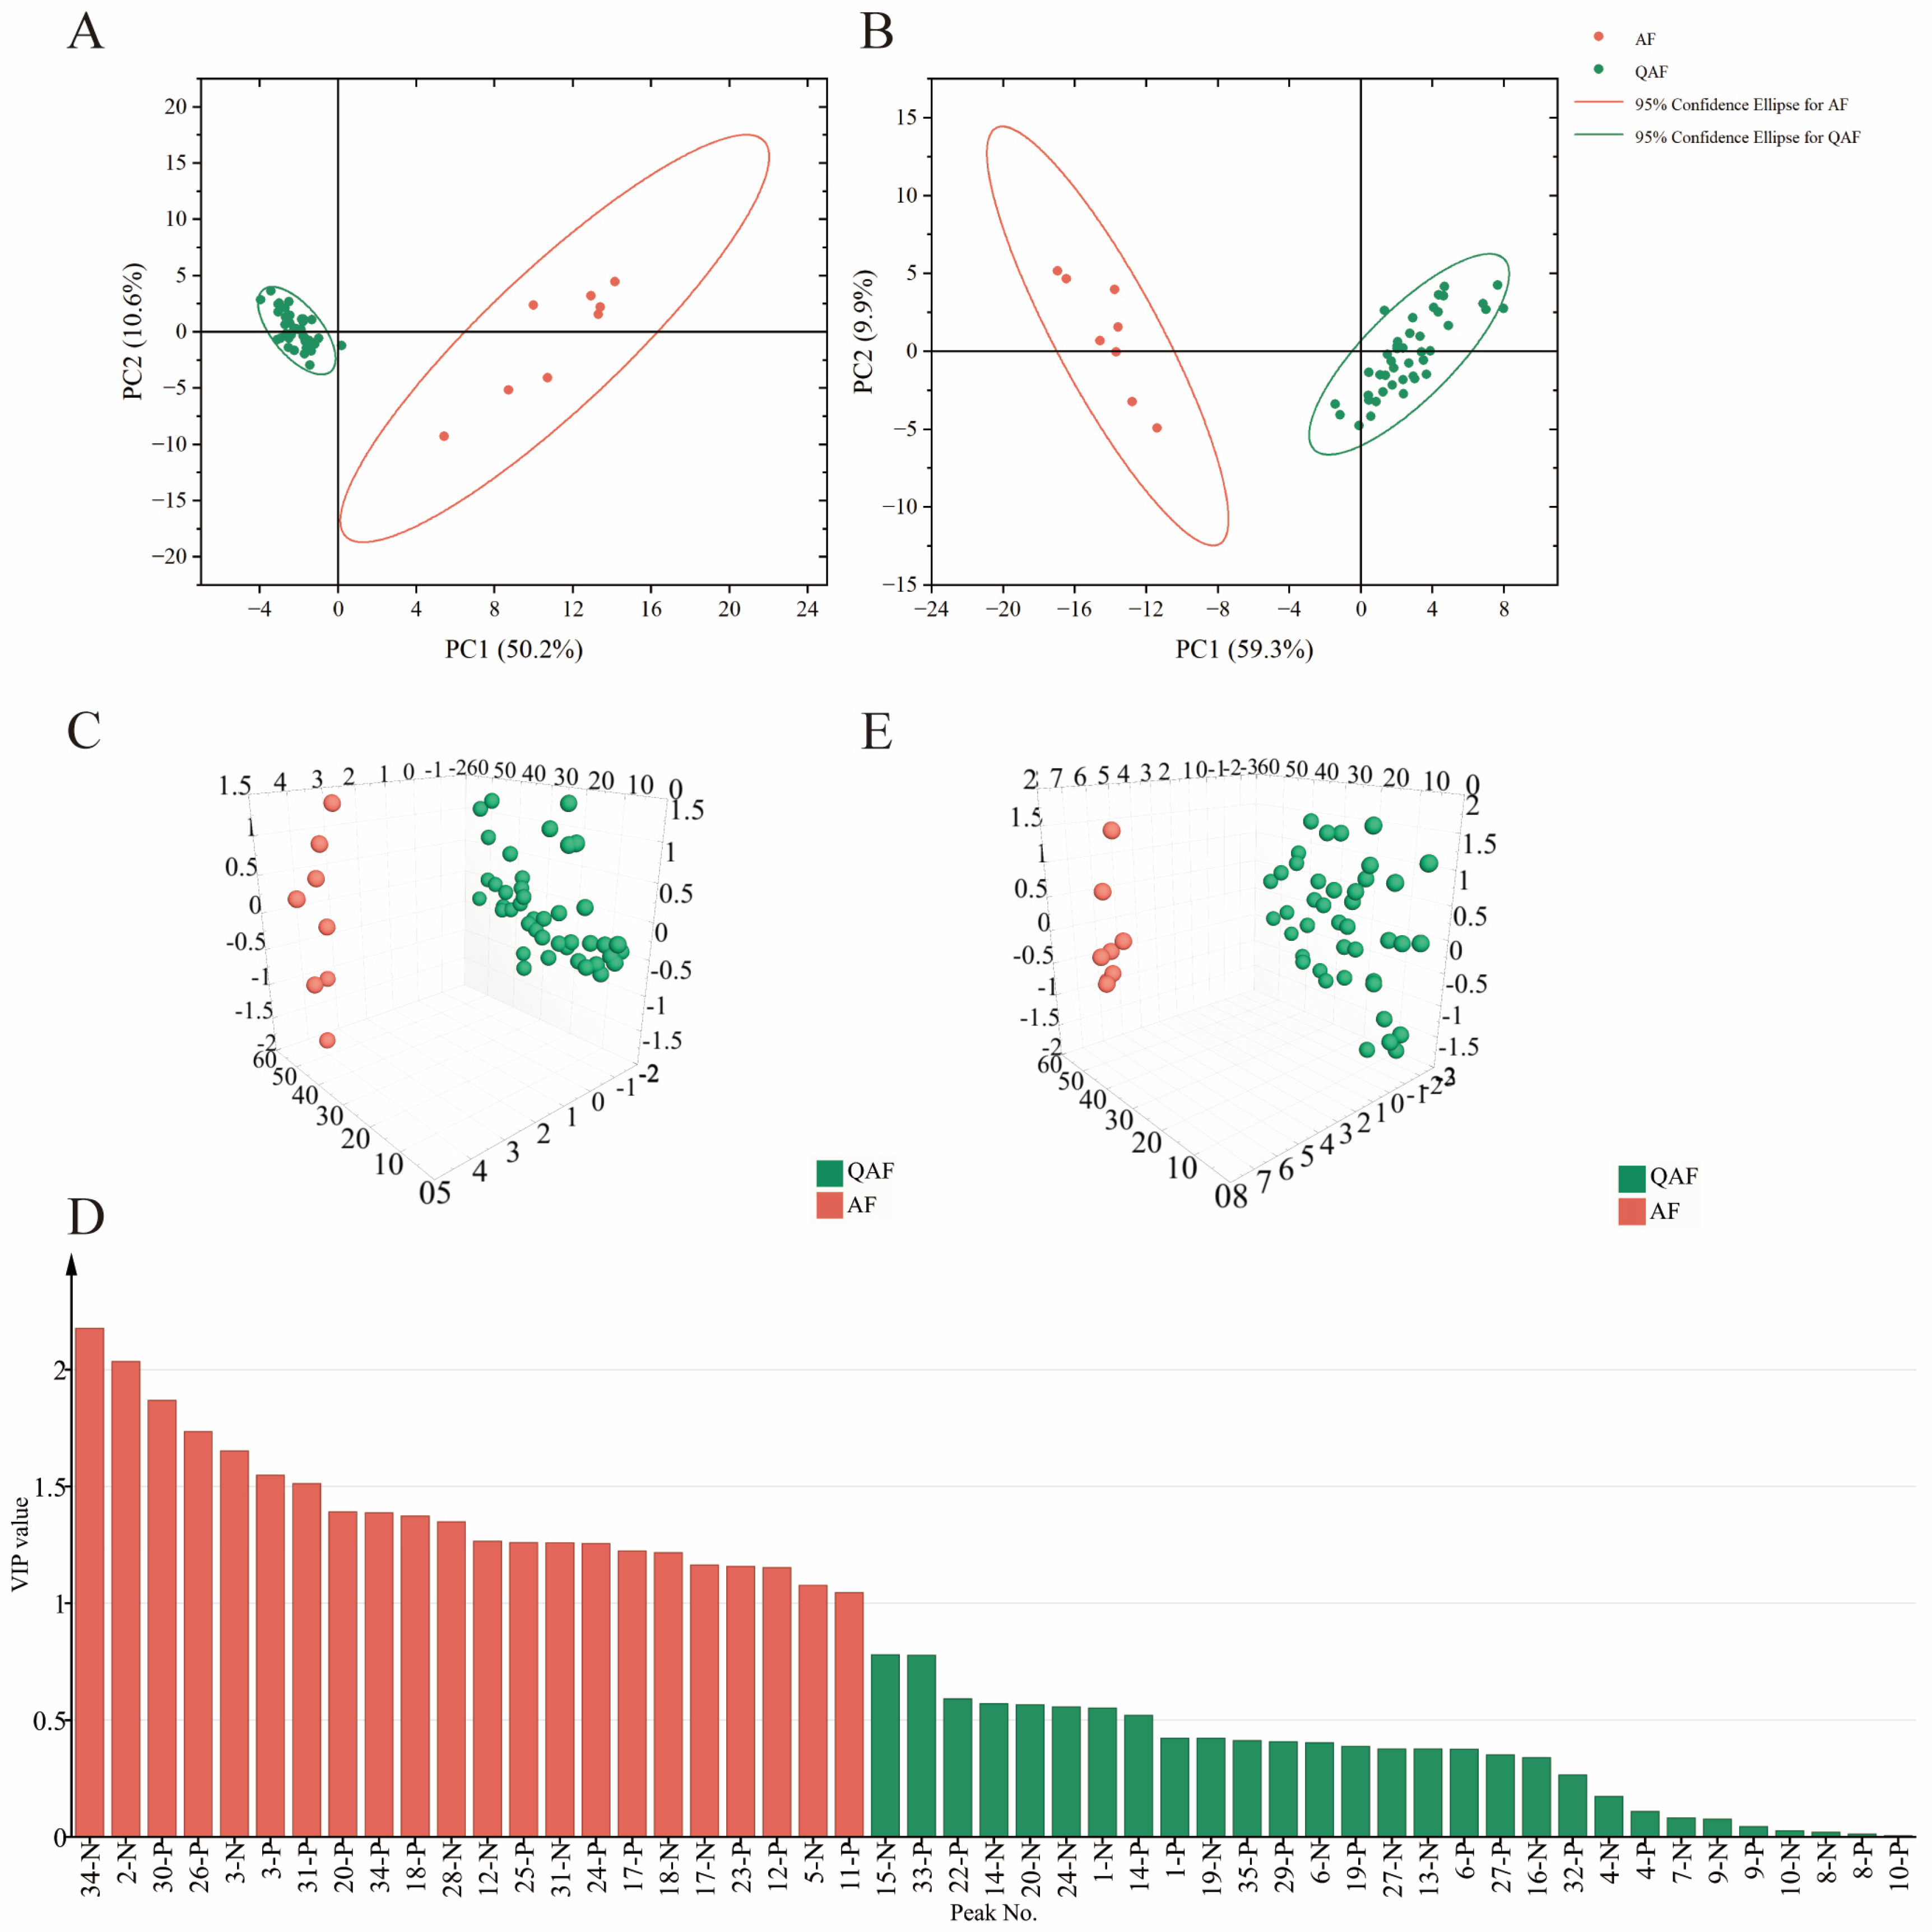
2.3.1. PCA
2.3.2. OPLS−DA
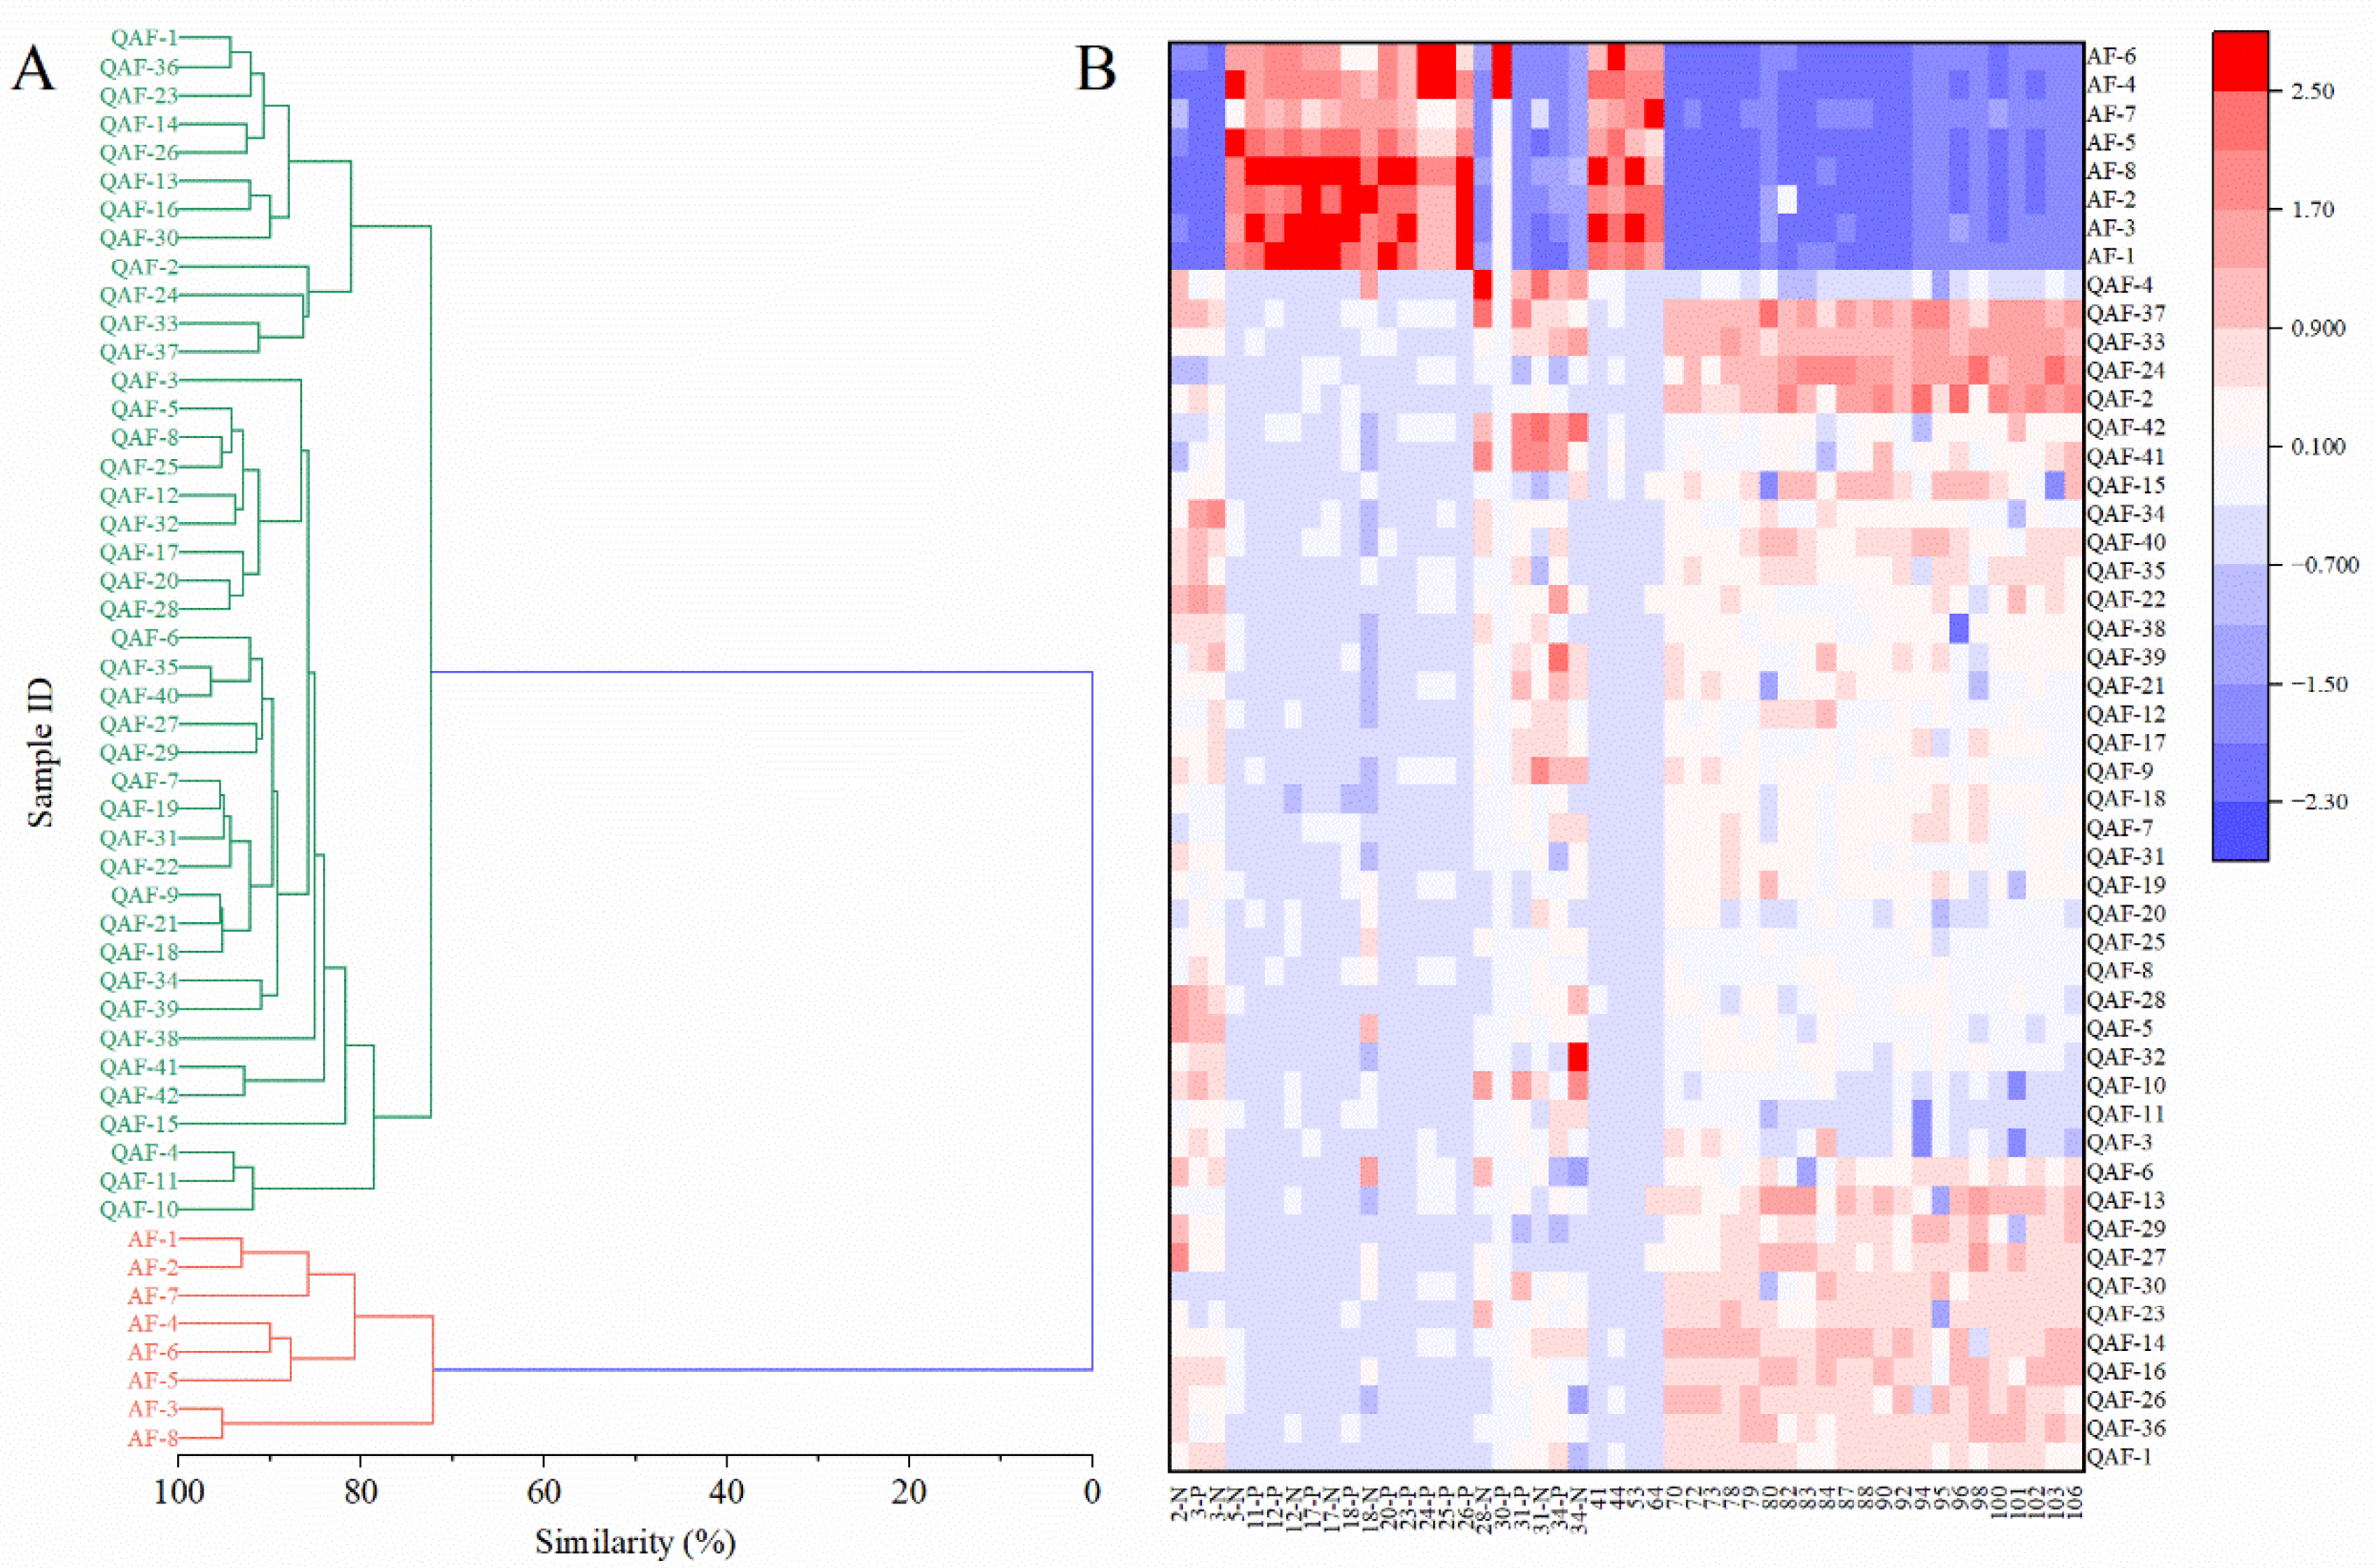
2.3.3. HCA
2.4. Antioxidant Capacity
2.4.1. Antioxidant Capability Assay
2.4.2. Antioxidant Potency Composite (APC)
3. Materials and Methods
3.1. Chemicals and Reagents
3.2. Plant Materials
3.3. Preparation of Standard Solutions and Sample Solutions
3.4. UPLC−QTOF/MS Analysis and Data Processing
3.5. Extraction of Volatile Oil and GC−MS Analysis
3.6. Chemometric Analysis
3.7. Antioxidant Capacity Assays
3.7.1. DPPH Radical Scavenging Assay
3.7.2. ABTS Radical Scavenging Assay
3.7.3. FRAP Assay
3.7.4. Statistical Analysis of Antioxidant Capacity
4. Conclusions
Supplementary Materials
Author Contributions
Funding
Institutional Review Board Statement
Informed Consent Statement
Data Availability Statement
Acknowledgments
Conflicts of Interest
Sample Availability
List of Abbreviations
References
- Zhao, W.; Huang, Q.; Zhang, W.; Yue, C.; Song, J. Research for the Original Plant of Chinese Medicinal Materials Qu Aurantii Fructus. Chin. J. Mod. Appl. Pharm. 2019, 36, 1652–1655. [Google Scholar]
- Fang, C.; He, J.; Xiao, Q.; Chen, B.; Zhang, W. Development of the Volatile Fingerprint of Qu Aurantii Fructus by HS-GC-IMS. Molecules 2022, 27, 4537. [Google Scholar] [CrossRef]
- Hu, Y.; Liu, J.; Li, H.; Tang, W.; Li, X.; Guo, Y. Chemical Constituents from Citrus changshan-huyou and Their Anti-Inflammatory Activities. Chem. Biodivers. 2020, 17, e2000503. [Google Scholar] [CrossRef]
- Ma, Y.; Chen, H.; Fang, X.; Wang, X.; Ge, W. A Comparative Study on Regulating Qi Effect of Quzhiqiao (Fructus Aurantii from Zhejiang) and Fructus Aurantii from The Other Three Major Producing Areas on Functional Dyspepsia Rats. Chin. J. Tradit. Med. Sci. Technol. 2021, 28, 722–726. [Google Scholar]
- Xu, G.; Ye, X.; Chen, J.; Liu, D. Effect of heat treatment on the phenolic compounds and antioxidant capacity of citrus peel extract. J. Agric. Food Chem. 2007, 55, 330–335. [Google Scholar] [CrossRef]
- Li, L.; Chen, J.; Lin, L.; Pan, G.; Zhang, S.; Chen, H.; Zhang, M.; Xuan, Y.; Wang, Y.; You, Z. Quzhou Fructus Aurantii Extract suppresses inflammation via regulation of MAPK, NF-κB, and AMPK signaling pathway. Sci. Rep. 2020, 10, 1593. [Google Scholar] [CrossRef] [Green Version]
- Xu, X. Studies on Antitussive and Expectorant Effects of Water Extract from the Changshan-huyou Peel. China Pharm. 2011, 14, 227–228. [Google Scholar]
- Ling, Y.; Shi, Z.; Yang, X.; Cai, Z.; Wang, L.; Wu, X.; Ye, A.; Jiang, J. Hypolipidemic effect of pure total flavonoids from peel of Citrus (PTFC) on hamsters of hyperlipidemia and its potential mechanism. Exp. Gerontol. 2020, 130, 110786. [Google Scholar] [CrossRef]
- Ying, Y.; Wan, H.; Zhao, X.; Yu, L.; He, Y.; Jin, W. Pharmacokinetic-Pharmacodynamic Modeling of the Antioxidant Activity of Quzhou Fructus Aurantii Decoction in a Rat Model of Hyperlipidemia. Biomed. Pharm. 2020, 131, 110646. [Google Scholar] [CrossRef]
- Wang, J.; Li, T.; Cai, H.; Jin, L.; Li, R.; Shan, L.; Cai, W.; Jiang, J. Protective effects of total flavonoids from Qu Zhi Qiao (fruit of Citrus paradisi cv. Changshanhuyou) on OVA-induced allergic airway inflammation and remodeling through MAPKs and Smad2/3 signaling pathway. Biomed. Pharmacother. 2021, 138, 111421. [Google Scholar] [CrossRef]
- Shi, Z.; Li, T.; Liu, Y.; Cai, T.; Yao, W.; Jiang, J.; He, Y.; Shan, L. Hepatoprotective and Anti-Oxidative Effects of Total Flavonoids From Qu Zhi Qiao (Fruit of Citrus Paradisi cv.Changshanhuyou) on Nonalcoholic Steatohepatitis In Vivo and In Vitro Through Nrf2-ARE Signaling Pathway. Front. Pharmacol. 2020, 11, 483. [Google Scholar] [CrossRef] [PubMed] [Green Version]
- Jiang, J.; Yan, L.; Shi, Z.; Wang, L.; Shan, L.; Thomas, E. Hepatoprotective and anti-inflammatory effects of total flavonoids of Qu Zhi Ke (peel of Citrus changshan-huyou) on non-alcoholic fatty liver disease in rats via modulation of NF-kappaB and MAPKs. Phytomedicine 2019, 64, 153082. [Google Scholar] [CrossRef] [PubMed]
- Xu, L.; Song, J.; Zhao, S.; Yang, Y.; Yue, C.; Feng, J.; Dai, D.; Mao, P.; Jin, J.; Wang, Y.; et al. Pharmacodynamic Comparison of Qi Regulating and Depression Dispersing between Citrus changshan-huyou and Aurantii Fructus From Different Sources. Chin. J. Exp. Tradit. Med. Formulae 2016, 22, 156–160. [Google Scholar]
- Zheng, C.; Zhao, W.; Song, J.; Wang, L.; Zhang, W. Demonstration and Study of Qu Aurantii Fructus Medicinally Used as Aurantii Fructus. Chin. J. Mod. Appl. Pharm. 2022, 39, 2096–2102. [Google Scholar]
- Zhao, W.; Guo, Z.; Zhang, W.; Huang, Q.; Yi, Z.; Song, J. Study on original plant species and geographical distribution of Fructus Aurantii. China J. Chin. Mater. Med. 2018, 43, 4361–4364. [Google Scholar]
- Gao, L.; Zhang, H.; Xiang, Z.; Jiang, J.; Yuan, C.; Song, J. Citrus aurantium ‘Changshan-huyou’-An ethnopharmacological and phytochemical review. Front. Pharmacol. 2022, 13, 983470. [Google Scholar] [CrossRef]
- Suntar, I.; Khan, H.; Patel, S.; Celano, R.; Rastrelli, L. An Overview on Citrus aurantium L.: Its Functions as Food Ingredient and Therapeutic Agent. Oxid. Med. Cell. Longev. 2018, 2018, 7864269. [Google Scholar] [CrossRef] [Green Version]
- He, Y.; Li, Z.; Wang, W.; Sooranna, S.R.; Shi, Y.; Chen, Y.; Wu, C.; Zeng, J.; Tang, Q.; Xie, H. Chemical Profiles and Simultaneous Quantification of Aurantii fructus by Use of HPLC-Q-TOF-MS Combined with GC−MS and HPLC Methods. Molecules 2018, 23, 2189. [Google Scholar] [CrossRef] [Green Version]
- Yue, C. The Survey of Chemical Components and Pharmacological Effects in Citruschangshan-huyou YB.Chang. and to Compared with Fructus Aurantii. Master’s Thesis, Zhejiang Chinese Medical University, Hangzhou, China, 2015. [Google Scholar]
- Hu, J.; Wang, J.; Qin, B.; Wang, L.; Li, X. Chemometric Analyses for the Characterization of Raw and Stir-Frying Processed Drynariae Rhizoma Based on HPLC Fingerprints. Evid. Based Complement. Alternat Med. 2021, 2021, 6651657. [Google Scholar] [CrossRef]
- Lever, J.; Krzywinski, M.; Altman, N. Principal component analysis. Nature Methods 2017, 14, 641–642. [Google Scholar] [CrossRef] [Green Version]
- Kang, C.; Zhang, Y.; Zhang, M.; Qi, J.; Zhao, W.; Gu, J.; Guo, W.; Li, Y. Screening of specific quantitative peptides of beef by LC-MS/MS coupled with OPLS−DA. Food Chem. 2022, 387, 132932. [Google Scholar] [CrossRef] [PubMed]
- More, G.K.; Vervoort, J.; Steenkamp, P.A.; Prinsloo, G. Metabolomic profile of medicinal plants with anti-RVFV activity. Heliyon 2022, 8, e08936. [Google Scholar] [CrossRef] [PubMed]
- Bordonaba, J.G.; Terry, L.A. Biochemical profiling and chemometric analysis of seventeen UK-grown black currant cultivars. J. Agric. Food Chem. 2008, 56, 7422–7430. [Google Scholar] [CrossRef]
- Li, P.; Zeng, S.; Duan, L.; Ma, X.; Dou, L.; Wang, L.; Li, P.; Bi, Z.; Liu, E. Comparison of Aurantii Fructus Immaturus and Aurantii Fructus based on multiple chromatographic analysis and chemometrics methods. J. Chromatogr. A 2016, 1469, 96–107. [Google Scholar] [CrossRef]
- Bai, Y.; Zheng, Y.; Pang, W.; Peng, W.; Wu, H.; Yao, H.; Li, P.; Deng, W.; Cheng, J.; Su, W. Identification and Comparison of Constituents of Aurantii Fructus and Aurantii Fructus Immaturus by UFLC-DAD-Triple TOF-MS/MS. Molecules 2018, 23, 803. [Google Scholar] [CrossRef] [Green Version]
- Cheung, T.; Li, W.; Ho, H.; Liang, Z.; Huang, C. Chemical variation in Aurantii Fructus before and after processing based on UHPLC-Q-TOF-MS. China J. Chin. Mater. Med. 2016, 41, 2070–2080. [Google Scholar]
- Tsiokanosa, E.; Tsafantakisa, N.; Termentzib, A.; Aligiannisa, N.; Skaltsounisa, L.A.; Fokialakisa, N. Phytochemical characteristics of bergamot oranges from the Ionian islands of Greece: A multi-analytical approach with emphasis in the distribution of neohesperidose flavanones. Food Chem. 2021, 343, 128400. [Google Scholar] [CrossRef] [PubMed]
- William, J.; John, P.; Ch, A.R.; Raza, S.A.; Adnan, A.; Mumtaz, M.W.; Sharif, S.; Mukhtar, H.; Akhtar, M.T. Antioxidant activity, α-glucosidase inhibition and phytochemical profiling of Hyophorbe lagenicaulis leaf extracts. PeerJ 2019, 7, e7022. [Google Scholar] [CrossRef] [Green Version]
- Zaare-Nahandi, F.; Hosseinkhani, S.; Zamani, Z.; Asadi-Abkenar, A.; Omidbaigi, R. Delay expression of limonoid UDP-glucosyltransferase makes delayed bitterness in citrus. Biochem. Biophys. Res. Commun. 2008, 371, 59–62. [Google Scholar] [CrossRef]
- Tian, Q.; Ding, X. Screening for limonoid glucosides in Citrus tangerina (Tanaka) Tseng by high-performance liquid chromatography-electrospray ionization mass spectrometry. J. Chromatogr. A 2000, 874, 13–19. [Google Scholar] [CrossRef]
- Zhao, X. Studies on Chemical Components and Pharmacological and Biological Activities in Huyou Peels (Citrus Changshan-Huyou Y.B. Chang). Ph.D. Thesis, Zhejiang University, Hangzhou, China, 2003. [Google Scholar]
- Zhang, J.; Liu, M.; Yan, D.; Sun, X.; Tu, J.; Liu, Y.; Li, N.; Gong, Q. Study on acute toxicity and GC−MS chemical constituent analysis of volatile oil of Fructus aurantii pieces made by methods of Pharmacopoeia and Zhang-bang method. China J. Tradit. Chin. Med. Pharm. 2018, 33, 689–693. [Google Scholar]
- Wang, S.; Yang, C.; Tu, H.; Zhou, J.; Liu, X.; Cheng, Y.; Luo, J.; Deng, X.; Zhang, H.; Xu, J. Characterization and Metabolic Diversity of Flavonoids in Citrus Species. Sci. Rep. 2017, 7, 10549. [Google Scholar] [CrossRef]
- Ma, C.; Gao, W.; Gao, Y.; Man, S.; Huang, L.; Liu, C. Identification of chemical constituents in extracts and rat plasma from Fructus Aurantii by UPLC-PDA-Q-TOF/MS. Phytochem. Anal. 2011, 22, 112–118. [Google Scholar] [CrossRef]
- Lou, Z.; Wang, J.; Zhang, G. Research progress on effects and mechanisms of traditional Chinese medicine for qi-regulating and their components on digestive system disease. China J. Tradit. Chin. Med. Pharm. 2018, 33, 1004–1007. [Google Scholar]
- Feng, J.; Song, J.; Zhao, S.; Xu, L.; Zhang, W.; Lei, M. Study on Spectrum-activity Relationship of Flavonoids in Qu Aurantii Fructus for Regulation of Gastrointestinal Motility. Chin. J. Mod. Appl. Pharm. 2022, 39, 2241–2245. [Google Scholar]
- Qiao, R.; Zhou, L.; Zhong, M.; Zhang, M.; Yang, L.; Yang, Y.; Chen, H.; Yang, W.; Yuan, J. Spectrum-effect relationship between UHPLC-Q-TOF/MS fingerprint and promoting gastrointestinal motility activity of Fructus aurantii based on multivariate statistical analysis. J. Ethnopharmacol. 2021, 279, 114366. [Google Scholar] [CrossRef]
- Feng, J.; Li, J.; Song, J.; Wang, S.; Mao, B. Comprehensive Evaluation of Citrus Paradisi from Different Producing Areas by Entropy Weight TOPSIS Method. China Pharm. 2021, 32, 1312–1318. [Google Scholar]
- Yue, C.; Ma, L.; Song, J.; Zhang, W.; Zhao, W. Establishment of the HPLC Fingerprints of Citrus Changshan-huyou and Analysis of Its Characteristic Components. Chin. J. Mod. Appl. Pharm. 2018, 35, 1217–1220. [Google Scholar]
- Chen, H.; Li, X.; Yang, J.; Zhang, X. Imultaneous Determination and Chemometric Analysis of Fourteen Flavonoids in Fructus Aurantii from Four Origins by UPLC-MS/MS. Mod. Tradit. Chin. Med. Mater. Med. World Sci. Technol. 2023, 25, 519–526. [Google Scholar]
- Li, C.; Cai, Q.; Wu, X.; Tan, Z.; Huang, S.; Wei, C.; Zhang, W.; Chen, Z.; Zhang, L.; Xiang, H. Variation in Compositions and Biological Activities of Essential Oils from Four Citrus Species: Citrus limon, Citrus sinensis, Citrus paradisi, and Citrus reticulata. Chem. Biodivers. 2022, 19, e202100910. [Google Scholar] [CrossRef]
- Seeram, N.P.; Aviram, M.; Zhang, Y.; Henning, S.M.; Feng, L.; Dreher, M.; Heber, D. Comparison of antioxidant potency of commonly consumed polyphenol-rich beverages in the United States. J. Agric. Food Chem. 2008, 56, 1415–1422. [Google Scholar] [CrossRef]
- Cichoż-Lach, H.; Michalak, A. Oxidative stress as a crucial factor in liver diseases. World J. Gastroenterol. 2014, 20, 8082–8091. [Google Scholar] [CrossRef] [PubMed]
- Feitosa, C.M.; Oliveira, G.L.d.S.; Cavalcante, A.d.N.; Chaves, S.K.M.; Rai, M. Determination of Parameters of Oxidative Stress in vitro Models of Neurodegenerative Diseases-A Review. Curr. Clin. Pharmacol. 2018, 13, 100–109. [Google Scholar] [CrossRef] [PubMed]
- Ng, F.; Berk, M.; Dean, O.; Bush, A.I. Oxidative stress in psychiatric disorders: Evidence base and therapeutic implications. Int. J. Neuropsychopharmacol. 2008, 11, 851–876. [Google Scholar] [CrossRef] [PubMed] [Green Version]
- Tian, T.; Wang, Z.; Zhang, J. Pathomechanisms of Oxidative Stress in Inflammatory Bowel Disease and Potential Antioxidant Therapies. Oxid. Med. Cell. Longev. 2017, 2017, 4535194. [Google Scholar] [CrossRef] [PubMed] [Green Version]
- Zhao, S.; Cheng, C.; Zhang, C.; Huang, Y. Interplay Between Oxidative Stress, Cyclooxygenases, and Prostanoids in Cardiovascular Diseases. Antioxid. Redox Signal. 2021, 34, 784–799. [Google Scholar] [CrossRef]
- Ye, A.; Jiang, J.; Li, R.; Jin, L.; Wu, X.; Wang, J. Study on Hypolipidemic Effect of Pure Total Flavonoids from Qu Aurantii Fructus on Golden Hamsters of Hyperlipidemia and Its Potential Mechanism. Chin. J. Mod. Appl. Pharm. 2020, 37, 1938–1946. [Google Scholar]
- Zheng, X.; Liu, C.; Wang, D.; Bi, X.; Yang, B.; Sun, C. Flavonoids contents and antioxidant activities in Citrus paradisi cv. Changshan Huyou during development. Acta Agric. Zhejiangensis 2015, 27, 1185–1191. [Google Scholar]
- Wang, L.; Wang, L.; Wu, T.; Zhao, S.; Zheng, M.; Lu, S. Effects of different processing methods on the contents of the pharmacodynamic index components and antioxidant activity of Citrus aurantium. China Pharm. 2022, 33, 830–835. [Google Scholar]
- Song, J.; Feng, J.; Hu, J.; Xu, L.; Fu, H. Study on the Dynamic Changes of Three Contents in Citrus Changshan Huyou Fruit in Different Growth Periods. Chin. J. Mod. Appl. Pharm. 2014, 31, 1474–1478. [Google Scholar]
- Wang, H.; Huang, Y.; Liang, Y.; Zhang, X.; Xie, H.; Zhang, S. Suitable harvest period of Aurantii Fructus based on UPLC-Q-TOF-MS metabolomics. China J. Chin. Mater. Med. 2022, 47, 3175–3184. [Google Scholar]
- Xing, N.; Shu, Z.; Xu, B.; Jiao, W.; Li, Z.; Wang, Q.; Kuang, H. GC−MS Analysis of Volatile Oil Components in Fructus Aurantii from Different Regions and Study of Its Antitumor Activity. Inf. Tradit. Chin. Med. 2015, 32, 1–6. [Google Scholar]


| Comp No. | RT (min) | Compounds | Category | MF | Measured Mass (m/z) | Error b (ppm) | Fragment Ions (m/z) | Peak No. |
|---|---|---|---|---|---|---|---|---|
| 1 | 2.16 | vicenin-2 | flavone | C27H30O15 | 595.1662 [M + H]+ | −0.2 | 257.3252, 295.0883, 478.0288, 577.1523 | 1-P |
| 593.1505 [M − H]− | −0.2 | 162.8622, 431.2102, 473.1420, 475.1699 | 1-N | |||||
| 2 | 5.02 | eriocitrin | flavanone | C27H32O15 | 597.1813 [M + H]+ | −1 | 289.0689, 417.1266, 451.1285, 565.1464 | 2-P |
| 595.1667 [M − H]− | 0.7 | 151.0897, 287.0551, 308.7538, 459.8731 | 2-N | |||||
| 3 | 5.76 | neoeriocitrin | flavanone | C27H32O15 | 597.1819 [M + H]+ | 0 | 289.0723, 417.1095, 435.1271, 451.1260 | 3-P |
| 595.1664 [M − H]− | 0.2 | 151.3640, 287.2366, 308.1440, 459.0476 | 3-N | |||||
| 4 | 6.48 | naringin 6″-rhamnoside c | flavanone | C33H42O18 | 727.2449 [M + H]+ | 0 | 151.2614, 193.0523, 342.1341, 657.7466 | 4-P |
| 725.2293 [M − H]− | 0 | 273.0728, 419.1294, 511.0328, 595.1902 | 4-N | |||||
| 5 | 6.73 | hesperetin 5-O-glucoside | flavanone | C22H24O11 | 463.1245 [M − H]− | 1.1 | 125.0201, 217.1107, 241.2611, 374.8735 | 5-N |
| 6 | 6.93 | narirutin | flavanone | C27H32O14 | 581.1868 [M + H]+ | −0.3 | 153.0183, 273.0751, 419.1333, 465.1238 | 6-P |
| 579.1712 [M − H]− | −0.3 | 151.0176, 157.7385, 271.0313, 381.9519 | 6-N | |||||
| 7 | 7.16 | hesperetin 7-(2,6-dirhamnosylglucoside) c | flavanone | C34H44O19 | 757.2553 [M + H]+ | −0.3 | 303.0877, 431.1317, 449.1411, 611.2090 | 7-P |
| 755.2397 [M − H]− | −0.3 | 251.0554, 485.1661, 579.2084, 609.2543 | 7-N | |||||
| 8 | 7.40 | naringin a | flavanone | C27H32O14 | 581.1867 [M + H]+ | −0.5 | 157.7210, 331.7121 | 8-P |
| 579.1713 [M − H]− | −0.2 | 273.0771, 104.1233, 419.1310, 435.1302 | 8-N | |||||
| 9 | 7.56 | hesperidin | flavanone | C28H34O15 | 611.1973 [M + H]+ | −0.5 | 303.0822, 431.1323, 465.1415, 579.1700 | 9-P |
| 609.1815 [M − H]− | −0.7 | 131.7915, 286.0830, 301.0629, 579.1698 | 9-N | |||||
| 10 | 7.92 | neohesperidin a | flavanone | C28H34O15 | 611.1976 [M + H]+ | 0 | 273.0708, 303.0882, 449.1455, 465.1396 | 10-P |
| 609.1819 [M − H]− | 0 | 189.8311, 249.3724, 313.9281, 519.1979 | 10-N | |||||
| 11 | 8.25 | meranzin | coumarin | C15H16O4 | 261.1134 [M + H]+ | 2.7 | 130.0093, 158.9663, 189.0565, 243.1025 | 11-P |
| 12 | 8.43 | obacunoic acid-17-β-D-glucoside | limonoid | C29H32O17 | 653.1721 [M + H]+ | 0.5 | 373.1664, 473.1463 | 12-P |
| 651.1559 [M − H]− | −0.3 | 263.2244, 471.1717, 583.1901, 609.1924 | 12-N | |||||
| 13 | 8.79 | naringin 6″-malonate c | flavanone | C30H34O17 | 665.1720 [M − H]− | 0.3 | 271.0612, 545.2758, 501.1102, 621.1769 | 13-N |
| 14 | 8.99 | brutieridin | flavanone | C34H42O18 | 755.2411 [M + H]+ | 1.6 | 96.9604, 303.0997, 419.7484, 611.1989 | 14-P |
| 753.2265 [M − H]− | 3.1 | 317.0820, 577.1470, 609.1931, 753.2303 | 14-N | |||||
| 15 | 9.07 | nomilin glucoside c | limonoid | C34H46O15 | 693.2759 [M − H]− | 0.1 | 161.2311, 485.0921, 487.1647, 531.1981 | 15-N |
| 16 | 9.26 | nomilinic acid 17-β-D-glucoside | limonoid | C34H48O16 | 711.2880 [M − H]− | 2.2 | 125.8538, 362.0775, 463.1354, 651.1357 | 16-N |
| 17 | 9.73 | poncirin a | flavanone | C28H34O14 | 595.2027 [M + H]+ | 0 | 287.0934, 433.1445 | 17-P |
| 593.1868 [M − H]− | −0.3 | 177.3632, 328.8036, 428.1852, 565.3539 | 17-N | |||||
| 18 | 10.61 | melitidin | flavone | C33H40O17 | 725.2294 [M + H]+ | 0.1 | 272.0680, 579.2518, 561.1110 | 18-P |
| 723.2137 [M − H]− | 0.1 | 452.0145, 578.1447, 603.1926 | 18-N | |||||
| 19 | 11.27 | naringenin a | flavanone | C15H12O5 | 273.0768 [M + H]+ | 1.8 | 244.0607, 124.0807, 120.0192 | 19-P |
| 271.0606 [M − H]− | 0 | 116.9294, 200.3859 | 19-N | |||||
| 20 | 11.58 | hesperetin a | flavanone | C16H14O6 | 303.0862 [M + H]+ | −2.3 | 285.0684 | 20-P |
| 301.0714 [M − H]− | 0.7 | 150.0010, 178.9742, 108.0344 | 20-N | |||||
| 21 | 11.58 | iso-sinensetin a | flavone | C20H20O7 | 373.1289 [M + H]+ | 0.5 | 163.0424, 297.1493 | 21-P |
| 22 | 12.07 | 3′-demethylnobiletin a | flavone | C20H20O8 | 389.1221 [M + H]+ | −3.9 | 148.0940, 359.1240 | 22-P |
| 23 | 12.54 | isomeranzin a | coumarin | C15H16O4 | 261.1128 [M + H]+ | 0.4 | 102.0995, 158.5279, 189.0538, 243.0934 | 23-P |
| 24 | 12.79 | obacunoic acid | limonoid | C26H32O8 | 473.2174 [M + H]+ | −0.2 | 261.1100, 373.1358, 455.2199 | 24-P |
| 471.2008 [M − H]− | −2.3 | 137.1152, 203.5991, 391.5844, 453.1971 | 24-N | |||||
| 25 | 12.82 | sinensetin | flavone | C20H20O7 | 373.1287 [M + H]+ | 0 | 312.0947, 358.1085 | 25-P |
| 26 | 13.05 | 6-demethoxytangeretin a | flavone | C19H18O6 | 343.118 1 [M + H]+ | −0.3 | 132.0033, 218.0295, 234.5551, 282.2335 | 26-P |
| 27 | 13.52 | limonin a | limonoid | C26H30O8 | 471.2019 [M + H]+ | 0 | 323.6053, 403.2028, 425.1961 | 27-P |
| 469.1864 [M − H]− | 0.4 | 116.9230, 235.9201, 286.0120, 386.1377 | 27-N | |||||
| 28 | 14.49 | nomilinic acid | limonoid | C28H36O10 | 531.2230 [M − H]− | 0 | 126.3261, 377.4469, 471.2180, 487.2452 | 28-N |
| 29 | 14.61 | nobiletin a | flavone | C21H22O8 | 403.1396 [M + H]+ | 0.7 | 385.0027, 311.8877, 242.0300 | 29-P |
| 30 | 15.01 | 4′,5,6,7-tetramethoxyflavone a | flavone | C19H18O6 | 343.1181 [M + H]+ | −0.3 | 118.0903, 218.1613, 297.6151 | 30-P |
| 31 | 15.79 | nomilin | limonoid | C28H34O9 | 515.2282 [M + H]+ | 0.2 | 161.0510, 411.1992, 469.1833, 497.2009 | 31-P |
| 513.2133 [M − H]− | 1.6 | 206.9667, 250.7199, 438.1786, 453.1919 | 31-N | |||||
| 32 | 16.04 | 3-methoxynobiletin a | flavone | C22H24O9 | 433.1498 [M + H]+ | −0.2 | 375.1141, 193.0924, 240.1472, 257.0406 | 32-P |
| 33 | 17.49 | tangeretin a | flavone | C20H20O7 | 373.1287 [M + H]+ | 0 | 159.9747, 311.1900 | 33-P |
| 34 | 19.18 | obacunone a | limonoid | C26H30O7 | 455.2072 [M + H]+ | 0.4 | 393.1996, 297.6095 | 34-P |
| 453.1915 [M − H]− | 0.4 | 294.8072, 386.0809, 425.9806 | 34-N | |||||
| 35 | 20.55 | 5-demethylnobiletin a | flavone | C20H20O8 | 389.1228 [M + H]+ | −2.1 | 330.2824, 158.9681, 176.9824 | 35-P |
| No. | Rt/min | Compounds | RI a | MF | MW | QAF | AF | ||
|---|---|---|---|---|---|---|---|---|---|
| Average Percentage (n = 42) | Range | Average Percentage (n = 8) | Range | ||||||
| 36 | 3.717 | ethylbenzene | \ b | C8H10 | 106.16 | 0.02% | 0.01–0.02% | 0.02% | 0.02% |
| 37 | 3.844 | p-xylene | \ | C8H10 | 106.16 | 0.10% | 0.09–0.11% | 0.12% | 0.11–0.13% |
| 38 | 4.224 | m-xylene | \ | C8H10 | 106.16 | 0.05% | 0.05–0.06% | 0.06% | 0.05–0.06% |
| 39 | 4.804 | α-thujene | 926 | C10H16 | 136.23 | 0.12% | 0.06–0.19% | 0.07% | 0.02–0.13% |
| 40 | 4.985 | (+)-α-pinene | 935 | C10H16 | 136.23 | 0.57% | 0.35–0.83% | 0.58% | 0.46–0.73% |
| 41 | 5.810 | β-thujene | 974 | C10H16 | 136.23 | 0.05% | 0.02–0.07% | 0.54% | 0.29–0.73% |
| 42 | 5.954 | β-pinene | 981 | C10H16 | 136.23 | 0.62% | 0.38–0.74% | 0.26% | 0.11–0.74% |
| 43 | 6.106 | β-myrcene | 988 | C10H16 | 136.23 | 1.13% | 0.95–1.35% | 1.62% | 1.48–1.73% |
| 44 | 6.461 | octanal | 1003 | C8H10O | 128.21 | 0.01% | 0–0.03% | 0.12% | 0.08–0.16% |
| 45 | 6.609 | α-phellandrene | 1008 | C10H16 | 136.23 | 0.05% | 0.04–0.06% | 0.08% | 0.05–0.11% |
| 46 | 6.888 | α-terpinene | 1017 | C10H16 | 136.23 | 0.21% | 0.18–0.24% | 0.24% | 0.18–0.32% |
| 47 | 7.112 | o-cymene | 1025 | C10H14 | 134.22 | 0.56% | 0.40–0.89% | 0.58% | 0.04–1.13% |
| 48 | 7.290 | limonene | 1030 | C10H16 | 136.23 | 65.76% | 60.64–71.09% | 85.93% | 79.98–88.61% |
| 49 | 7.332 | β-phellandrene | 1032 | C10H16 | 136.23 | 0.14% | 0–0.21% | 0.20% | 0–0.33% |
| 50 | 7.671 | (Z)-β-ocimene | 1043 | C10H16 | 136.23 | 0.10% | 0.08–0.13% | 0.46% | 0.38–0.62% |
| 51 | 8.102 | γ-terpinene | 1057 | C10H16 | 136.23 | 8.86% | 7.93–9.50% | 2.66% | 0.47–5.98% |
| 52 | 8.973 | terpinolene | 1085 | C10H16 | 136.23 | 0.52% | 0.47–0.55% | 0.30% | 0.21–0.53% |
| 53 | 9.413 | linalool | 1100 | C10H18O | 154.25 | 0.10% | 0.07–0.14% | 1.86% | 1.27–2.44% |
| 54 | 9.599 | nonanal | 1105 | C9H18O | 142.24 | 0.02% | 0–0.04% | 0.02% | 0–0.05% |
| 55 | 9.929 | p-mentha-1,3,8-triene | 1114 | C10H14 | 134.22 | ND | ND | 0.01% | 0–0.04% |
| 56 | 10.259 | (+)-trans-p-mentha-2,8-dien-1-ol | 1123 | C10H16O | 152.23 | ND | ND | 0.00% | 0–0.04% |
| 57 | 10.652 | limonene oxide, cis- | 1134 | C10H16O | 152.23 | ND | ND | 0.03% | 0–0.04% |
| 58 | 10.808 | (+)-trans-limonene oxide | 1138 | C10H16O | 152.23 | ND | ND | 0.03% | 0–0.05% |
| 59 | 11.312 | β-terpineol | 1152 | C10H18O | 154.25 | 0.02% | 0–0.04% | 0.05% | 0–0.08% |
| 60 | 12.470 | (−)-terpinen-4-ol | 1184 | C10H18O | 154.25 | 0.18% | 0.13–0.23% | 0.76% | 0.46–1.26% |
| 61 | 12.931 | α-terpineol | 1197 | C10H18O | 154.25 | 0.29% | 0.19–0.40% | 0.56% | 0.40–0.70% |
| 62 | 13.231 | decanal | 1207 | C10H20O | 156.26 | 0.13% | 0.10–0.18% | 0.15% | 0.13–0.18% |
| 63 | 13.324 | octyl acetate | 1211 | C10H20O2 | 172.26 | 0.01% | 0–0.03% | 0.00% | 0–0.02% |
| 64 | 13.608 | carveol | 1222 | C10H16O | 152.23 | 0.00% | 0–0.05% | 0.10% | 0.05–0.18% |
| 65 | 13.726 | nerol | 1227 | C10H18O | 154.25 | 0.02% | 0–0.06% | 0.09% | 0.03–0.18% |
| 66 | 13.777 | citronellol | 1229 | C11H20O | 156.26 | 0.00% | 0–0.02% | 0.01% | 0–0.04% |
| 67 | 13.971 | (+)-cis-carveol | 1236 | C10H16O | 152.23 | ND | ND | 0.02% | 0–0.04% |
| 68 | 14.280 | carvone | 1248 | C10H14O | 150.22 | ND | ND | 0.05% | 0.02–0.08% |
| 69 | 15.045 | perillaldehyde | 1278 | C10H14O | 150.22 | ND | ND | 0.03% | 0–0.04% |
| 70 | 16.479 | δ-elemene | 1334 | C15H24 | 204.35 | 0.85% | 0.63–1.01% | 0.03% | 0–0.07% |
| 71 | 17.024 | neryl acetate | 1355 | C12H20O2 | 196.29 | 0.08% | 0.06–0.10% | 0.15% | 0.10–0.20% |
| 72 | 17.578 | copaene | 1376 | C15H24 | 204.35 | 0.22% | 0.15–0.27% | 0.01% | 0–0.05% |
| 73 | 17.938 | (−)-β-elemene | 1389 | C15H24 | 204.35 | 0.81% | 0.63–0.98% | 0.03% | 0–0.08% |
| 74 | 18.272 | sesquithujene | 1402 | C15H24 | 204.35 | 0.01% | 0–0.02% | ND | ND |
| 75 | 18.855 | caryophyllene | 1420 | C15H24 | 204.35 | 0.36% | 0.25–0.49% | 0.07% | 0–0.10% |
| 76 | 19.079 | γ-elemene | 1428 | C15H24 | 204.35 | 0.22% | 0.12–0.29% | ND | ND |
| 77 | 19.274 | α-guaiene | 1434 | C15H24 | 204.35 | 0.05% | 0.03–0.06% | ND | ND |
| 78 | 19.748 | cis-β-farnesene | 1449 | C15H24 | 204.35 | 0.69% | 0.47–0.90% | 0.01% | 0–0.04% |
| 79 | 19.942 | humulene | 1455 | C15H24 | 204.35 | 0.24% | 0.17–0.32% | 0.00% | 0–0.03% |
| 80 | 20.526 | γ-muurolene | 1474 | C15H24 | 204.35 | 0.17% | 0–0.35% | 0.01% | 0–0.04% |
| 81 | 20.762 | germacrene D | 1481 | C15H24 | 204.35 | 7.99% | 5.95–9.56% | 1.13% | 0.83–1.52% |
| 82 | 20.919 | δ-selinene | 1486 | C15H24 | 204.35 | 0.13% | 0.07–0.20% | 0.02% | 0–0.11% |
| 83 | 21.050 | valencen | 1491 | C15H24 | 204.35 | 0.20% | 0.07–0.33% | 0.00% | 0–0.03% |
| 84 | 21.223 | bicyclogermacrene | 1496 | C15H24 | 204.35 | 0.48% | 0.25–0.73% | 0.02% | 0–0.06% |
| 85 | 21.295 | α-muurolene | 1498 | C15H24 | 204.35 | 0.11% | 0–0.21% | 0.01% | 0–0.05% |
| 86 | 21.642 | a-bulnesene | 1508 | C15H24 | 204.35 | 0.10% | 0.07–0.14% | ND | ND |
| 87 | 21.798 | γ-cadinene | 1512 | C15H24 | 204.35 | 0.09% | 0.06–0.15% | 0.00% | 0–0.02% |
| 88 | 21.959 | dysoxylonene | 1517 | C15H24 | 204.35 | 1.01% | 0.65–1.45% | 0.12% | 0–0.25% |
| 89 | 22.145 | β-sesquiphellandrene | 1522 | C15H24 | 204.35 | 0.10% | 0.07–0.14% | ND | ND |
| 90 | 22.458 | δ-cadinene | 1530 | C15H24 | 204.35 | 0.11% | 0.06–0.19% | ND | ND |
| 91 | 23.021 | 2-(4-ethenyl-4-methyl-3-prop-1-en-2-ylcyclohexyl)propan-2-ol | 1546 | C15H26O | 222.37 | 0.03% | 0–0.05% | ND | ND |
| 92 | 23.439 | germacrene B | 1557 | C15H24 | 204.35 | 1.91% | 1.34–2.40% | 0.05% | 0–0.11% |
| 93 | 24.095 | spathulenol | 1575 | C15H24O | 220.35 | 0.14% | 0.10–0.24% | 0.02% | 0–0.07% |
| 94 | 24.437 | (−)-globulol | 1584 | C15H26O | 222.37 | 0.08% | 0–0.16% | ND | ND |
| 95 | 24.775 | guaiol | 1594 | C15H26O | 222.37 | 0.20% | 0.02–0.32% | ND | ND |
| 96 | 25.854 | junenol | 1621 | C15H26O | 222.37 | 0.46% | 0–0.81% | 0.05% | 0–0.10% |
| 97 | 26.027 | γ-eudesmole | 1625 | C15H26O | 222.37 | 0.25% | 0–0.49% | 0.01% | 0–0.12% |
| 98 | 26.200 | hinesol | 1629 | C15H26O | 222.37 | 0.09% | 0.05–0.18% | 0.00% | 0–0.01% |
| 99 | 26.475 | isosparthulenol | 1636 | C15H24O | 220.35 | 0.08% | 0–0.18% | ND | ND |
| 100 | 26.674 | t-muurolol | 1641 | C15H26O | 222.37 | 0.46% | 0.29–0.77% | 0.02% | 0–0.11% |
| 101 | 26.780 | cadin-4-en-10-ol | 1643 | C15H26O | 222.37 | 0.08% | 0–0.13% | ND | ND |
| 102 | 27.135 | α-cadinol | 1652 | C15H26O | 222.37 | 1.02% | 0.63–1.59% | 0.15% | 0–0.24% |
| 103 | 27.266 | neointermedeol | 1655 | C15H26O | 222.37 | 0.21% | 0.01–0.37% | ND | ND |
| 104 | 27.748 | isointermedeol | 1667 | C15H26O | 222.37 | 0.10% | 0–0.30% | ND | ND |
| 105 | 28.700 | β-sinensal | 1690 | C15H22O | 218.33 | 0.34% | 0.21–0.49% | ND | ND |
| 106 | 28.877 | juniper camphor | 1694 | C15H26O | 222.37 | 0.19% | 0.09–0.31% | ND | ND |
| 107 | 40.633 | palmitic acid | 1965 | C16H32O2 | 256.42 | 0.22% | 0–0.71% | ND | ND |
| 108 | 43.766 | phytol | 2105 | C20H40O | 296.50 | 0.03% | 0–0.11% | ND | ND |
Disclaimer/Publisher’s Note: The statements, opinions and data contained in all publications are solely those of the individual author(s) and contributor(s) and not of MDPI and/or the editor(s). MDPI and/or the editor(s) disclaim responsibility for any injury to people or property resulting from any ideas, methods, instructions or products referred to in the content. |
© 2023 by the authors. Licensee MDPI, Basel, Switzerland. This article is an open access article distributed under the terms and conditions of the Creative Commons Attribution (CC BY) license (https://creativecommons.org/licenses/by/4.0/).
Share and Cite
Zhang, Q.; Song, W.; Tao, G.; Li, Q.; Wang, L.; Huang, W.; Gao, L.; Yin, L.; Ye, Y. Comparison of Chemical Compositions and Antioxidant Activities for the Immature Fruits of Citrus changshan-huyou Y.B. Chang and Citrus aurantium L. Molecules 2023, 28, 5057. https://doi.org/10.3390/molecules28135057
Zhang Q, Song W, Tao G, Li Q, Wang L, Huang W, Gao L, Yin L, Ye Y. Comparison of Chemical Compositions and Antioxidant Activities for the Immature Fruits of Citrus changshan-huyou Y.B. Chang and Citrus aurantium L. Molecules. 2023; 28(13):5057. https://doi.org/10.3390/molecules28135057
Chicago/Turabian StyleZhang, Qixin, Wenying Song, Guanqi Tao, Qin Li, Lixia Wang, Wenkang Huang, Lijuan Gao, Lai Yin, and Yiping Ye. 2023. "Comparison of Chemical Compositions and Antioxidant Activities for the Immature Fruits of Citrus changshan-huyou Y.B. Chang and Citrus aurantium L." Molecules 28, no. 13: 5057. https://doi.org/10.3390/molecules28135057