
Response Methodology Optimization and Artificial Neural Network Modeling for the Removal of Sulfamethoxazole Using an Ozone–Electrocoagulation Hybrid Process

 and
and
Abstract
:
1. Introduction
2. Results and Discussion
2.1. RSM Optimization
2.1.1. Model Evaluation
2.1.2. Model Analysis
2.1.3. Diagnostics
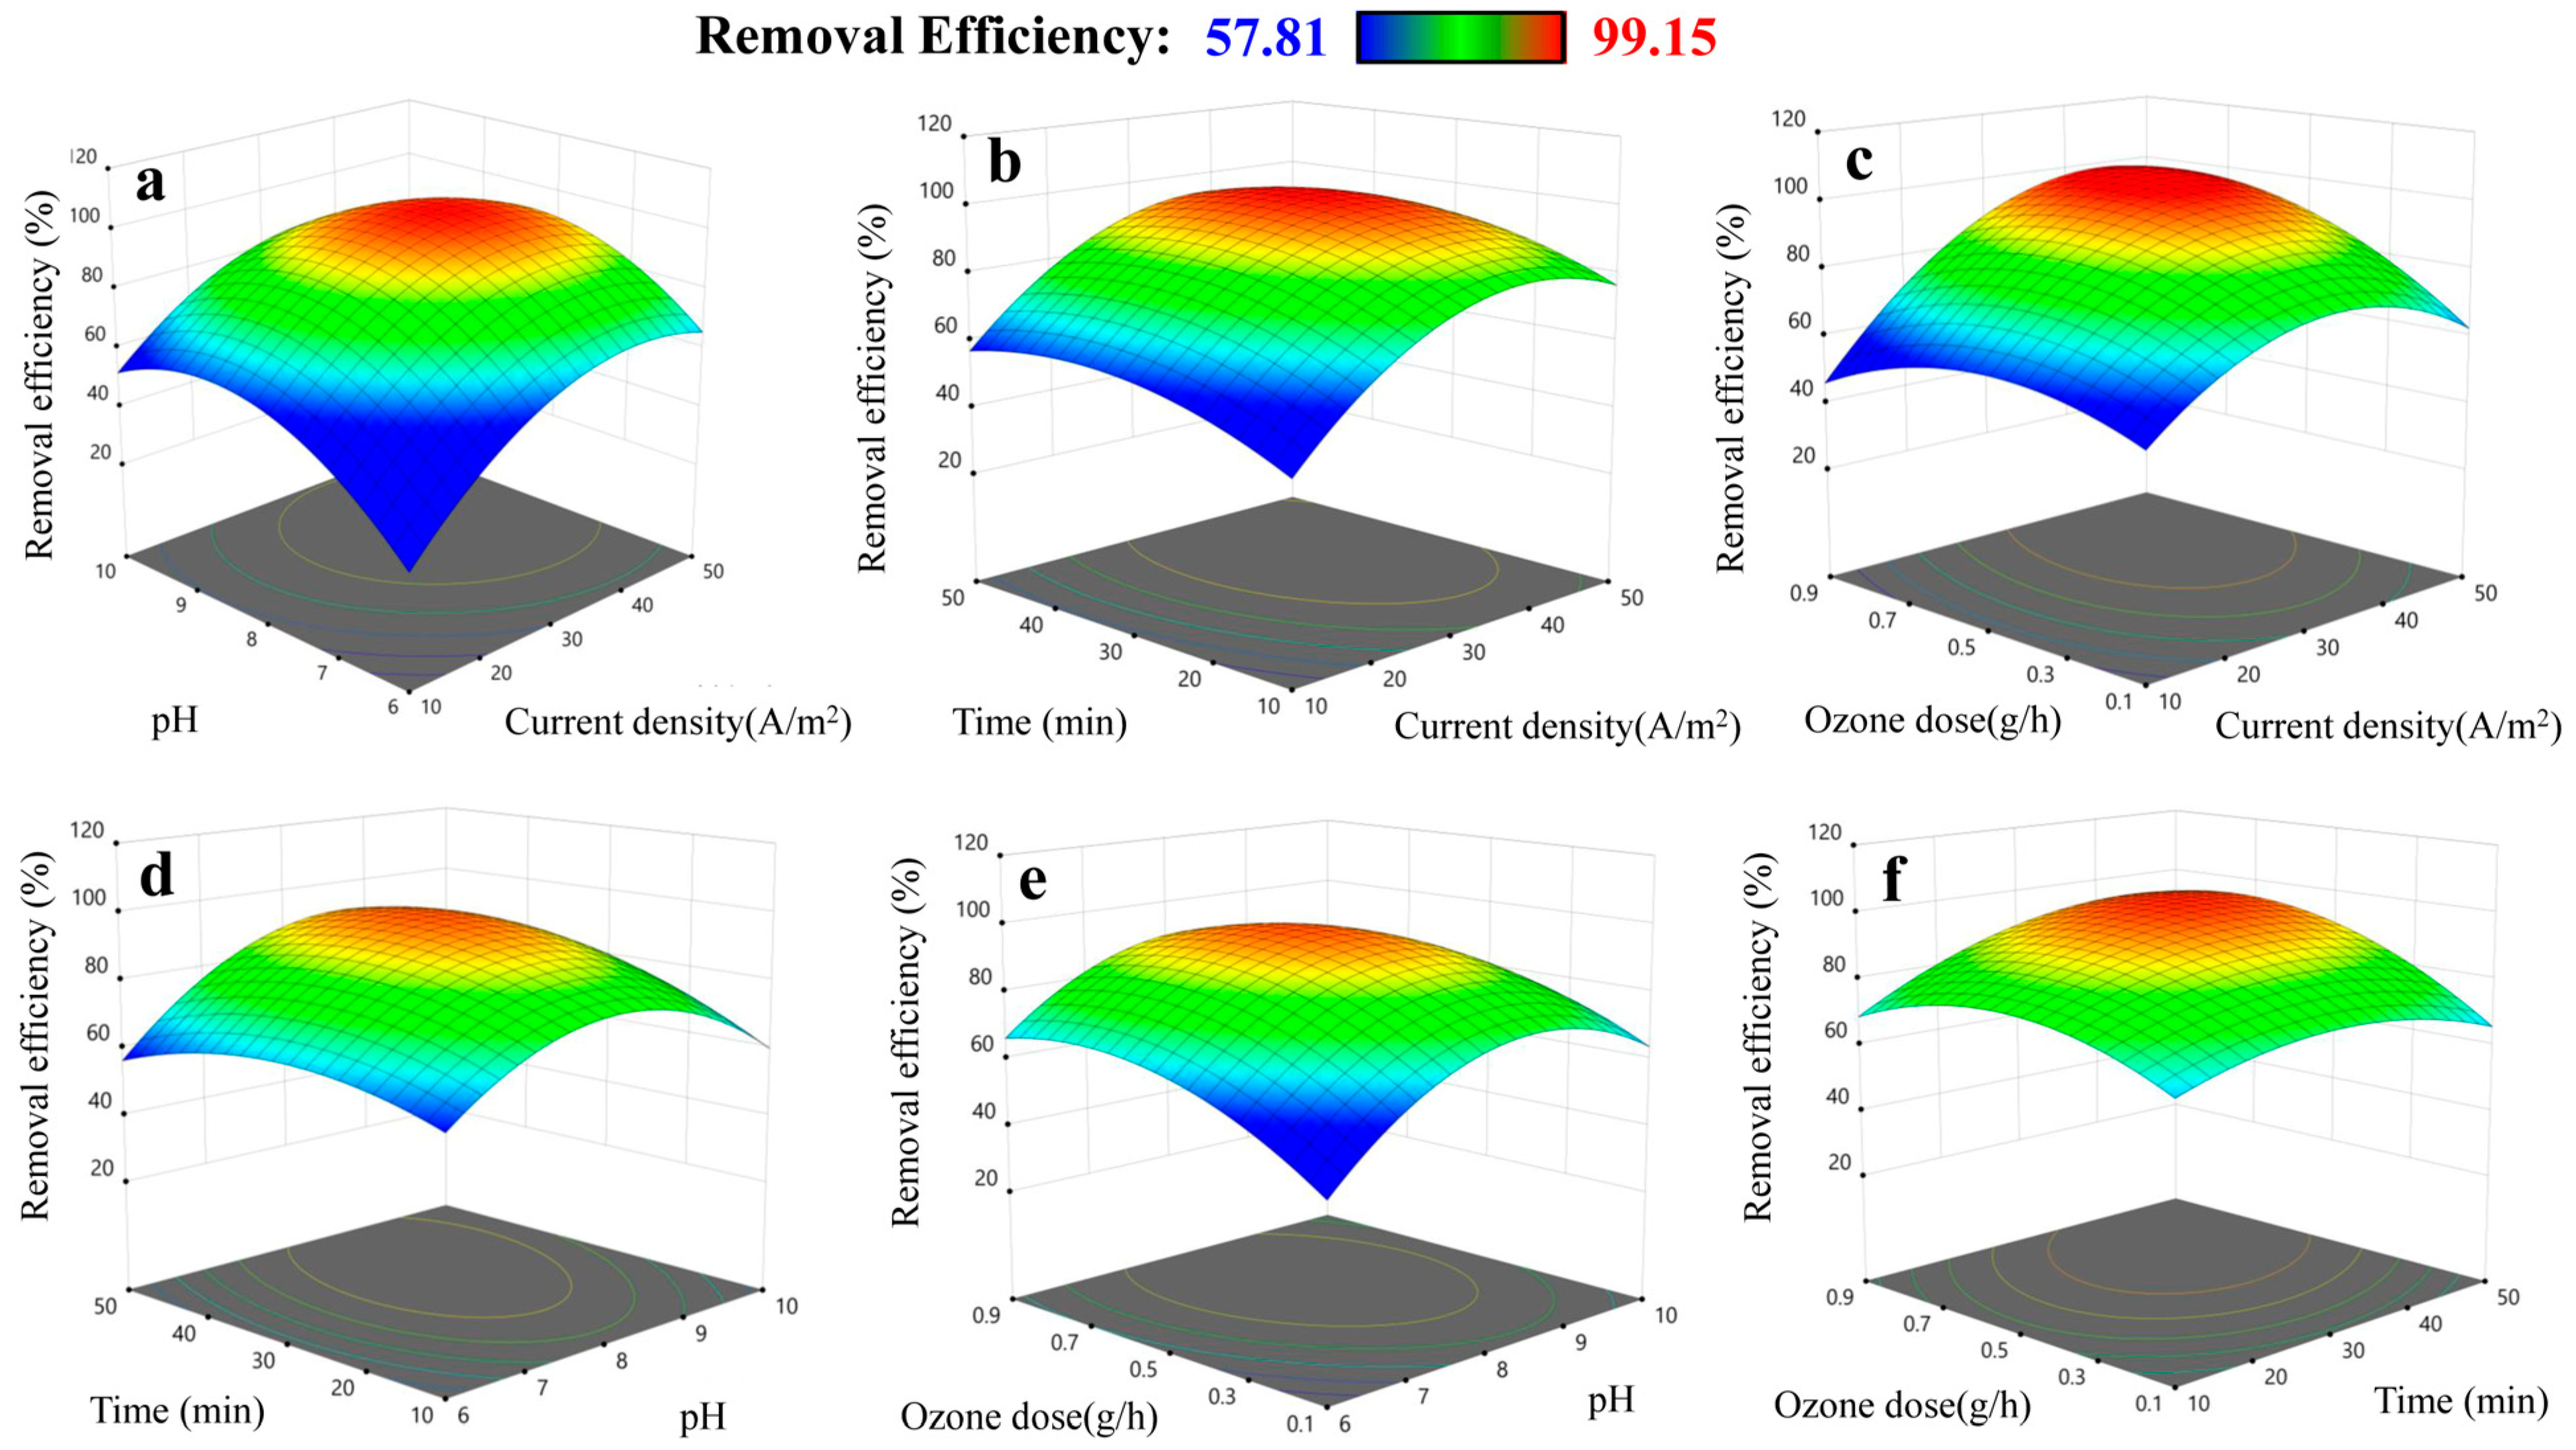
2.1.4. Effect and Interactive Effect of the Parameters on the Response
2.1.5. Numerical Optimization
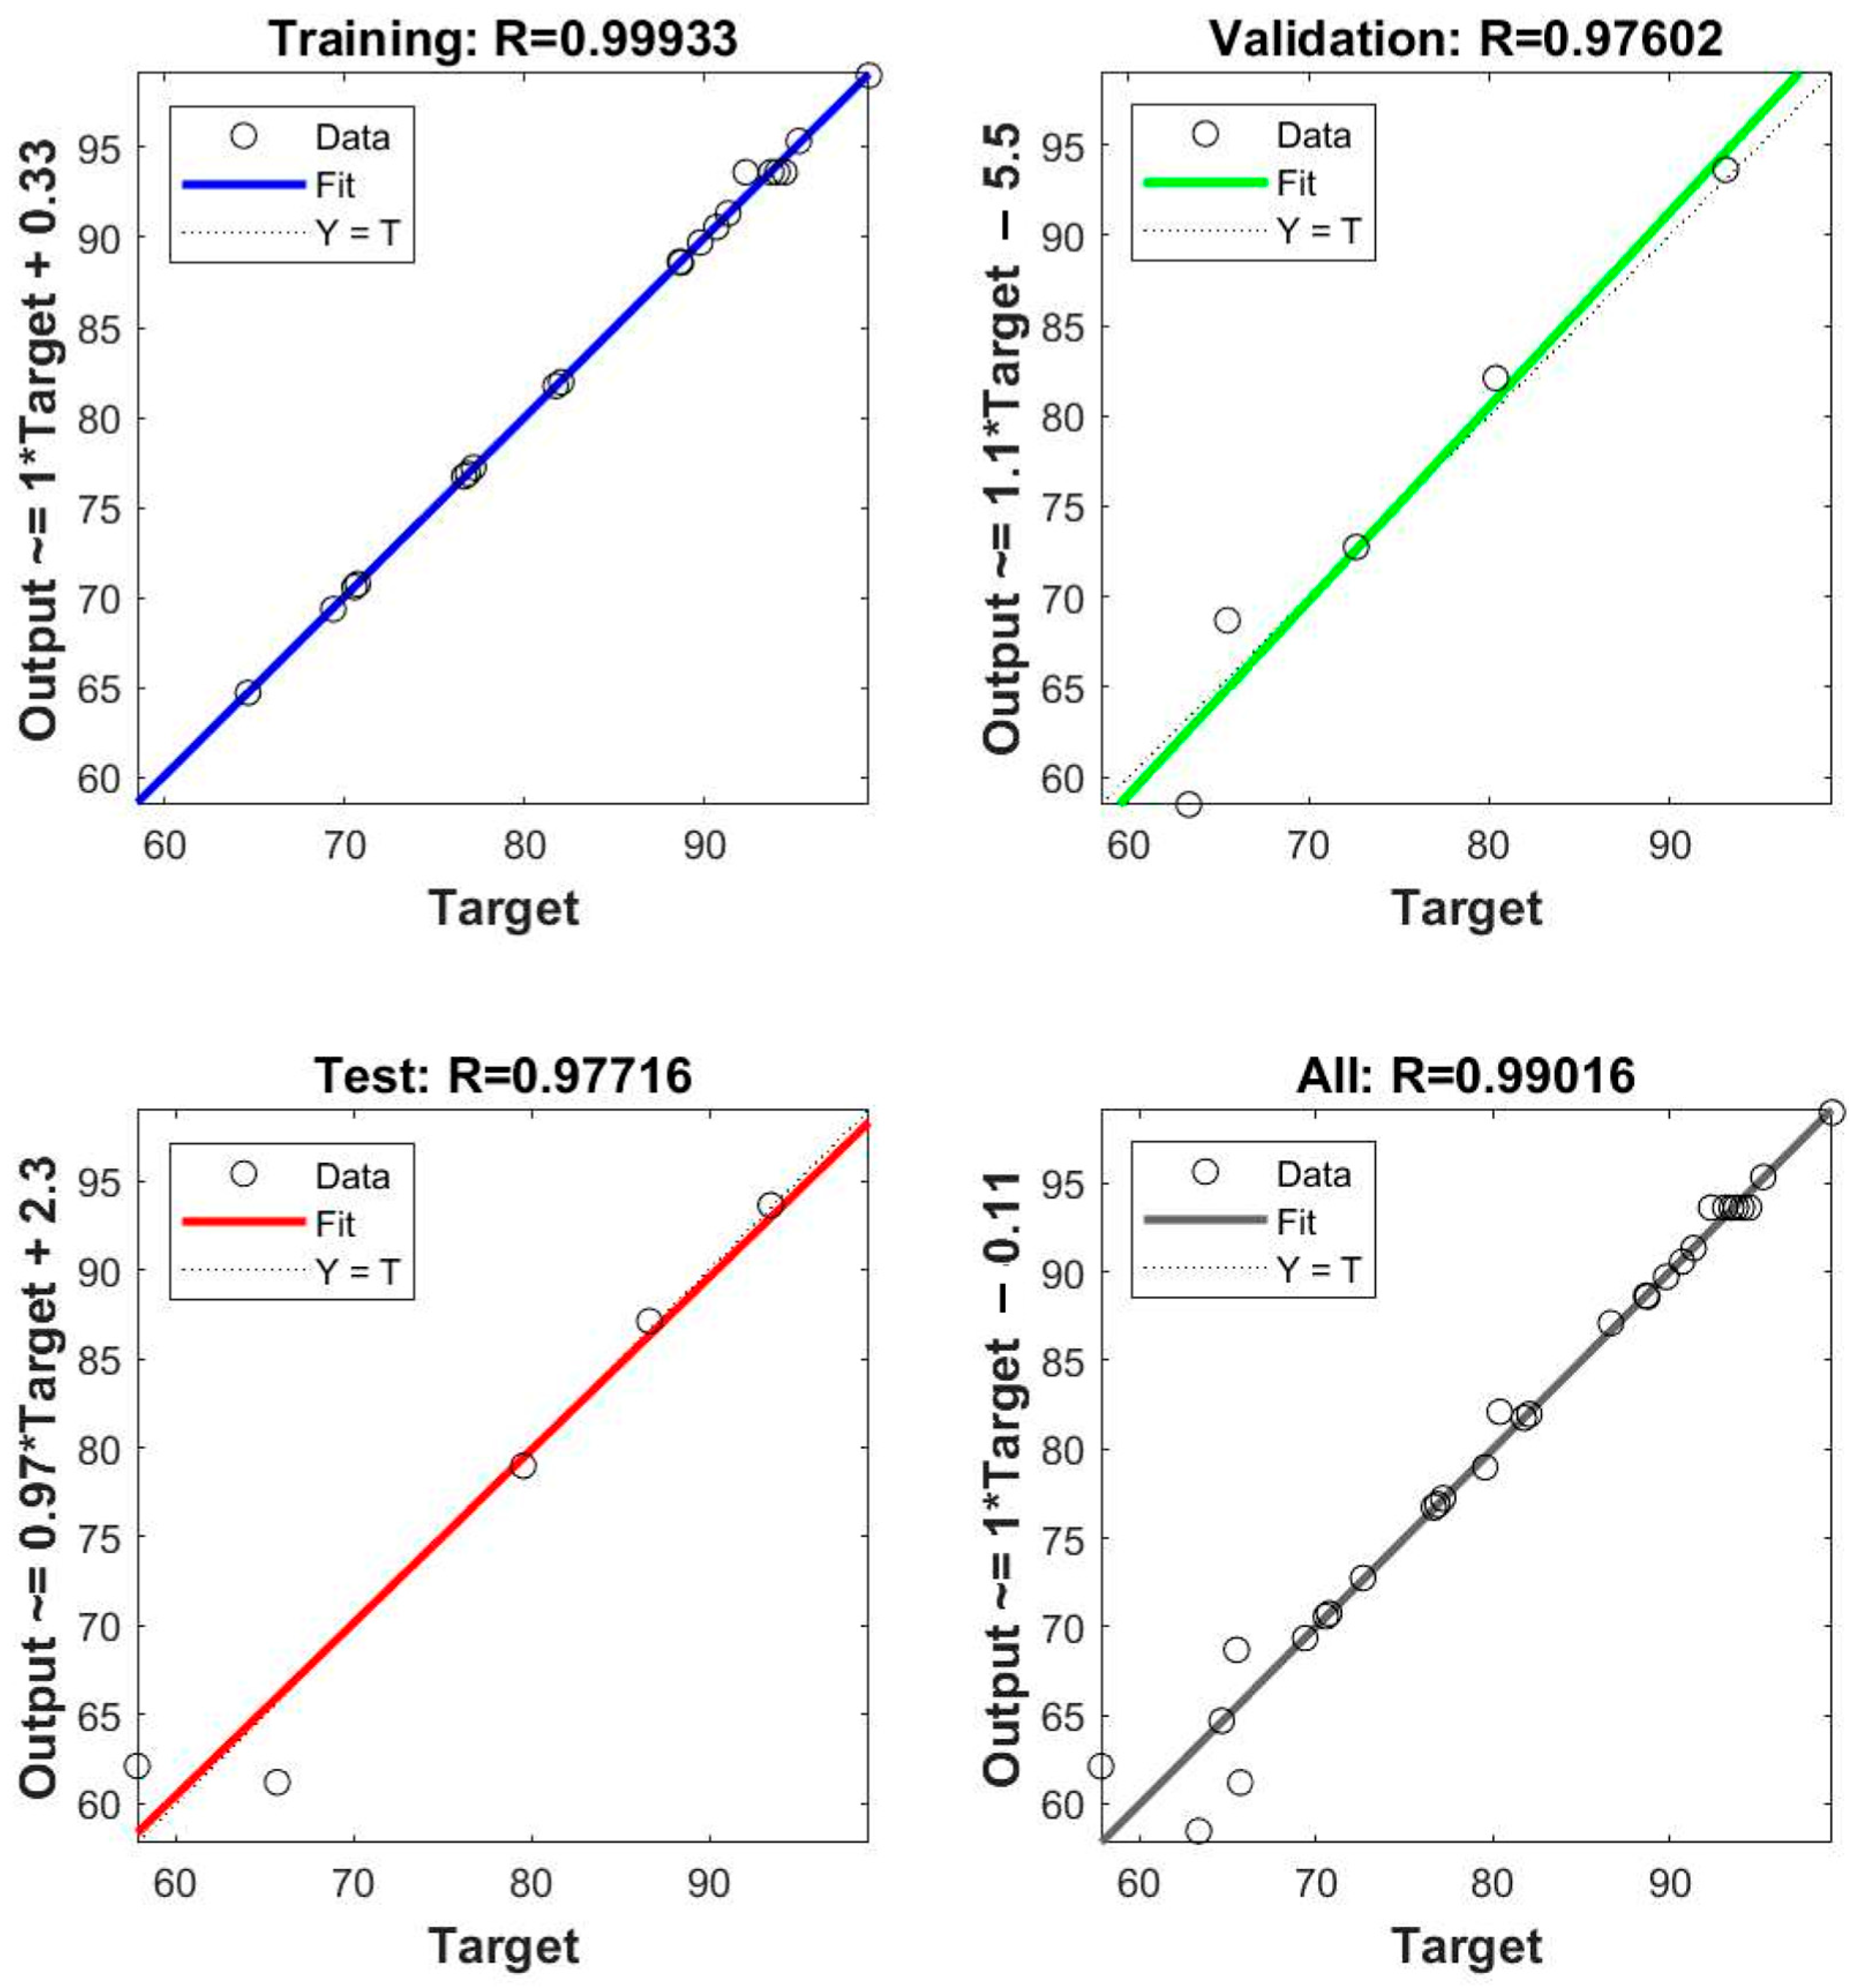
2.2. ANN Modeling
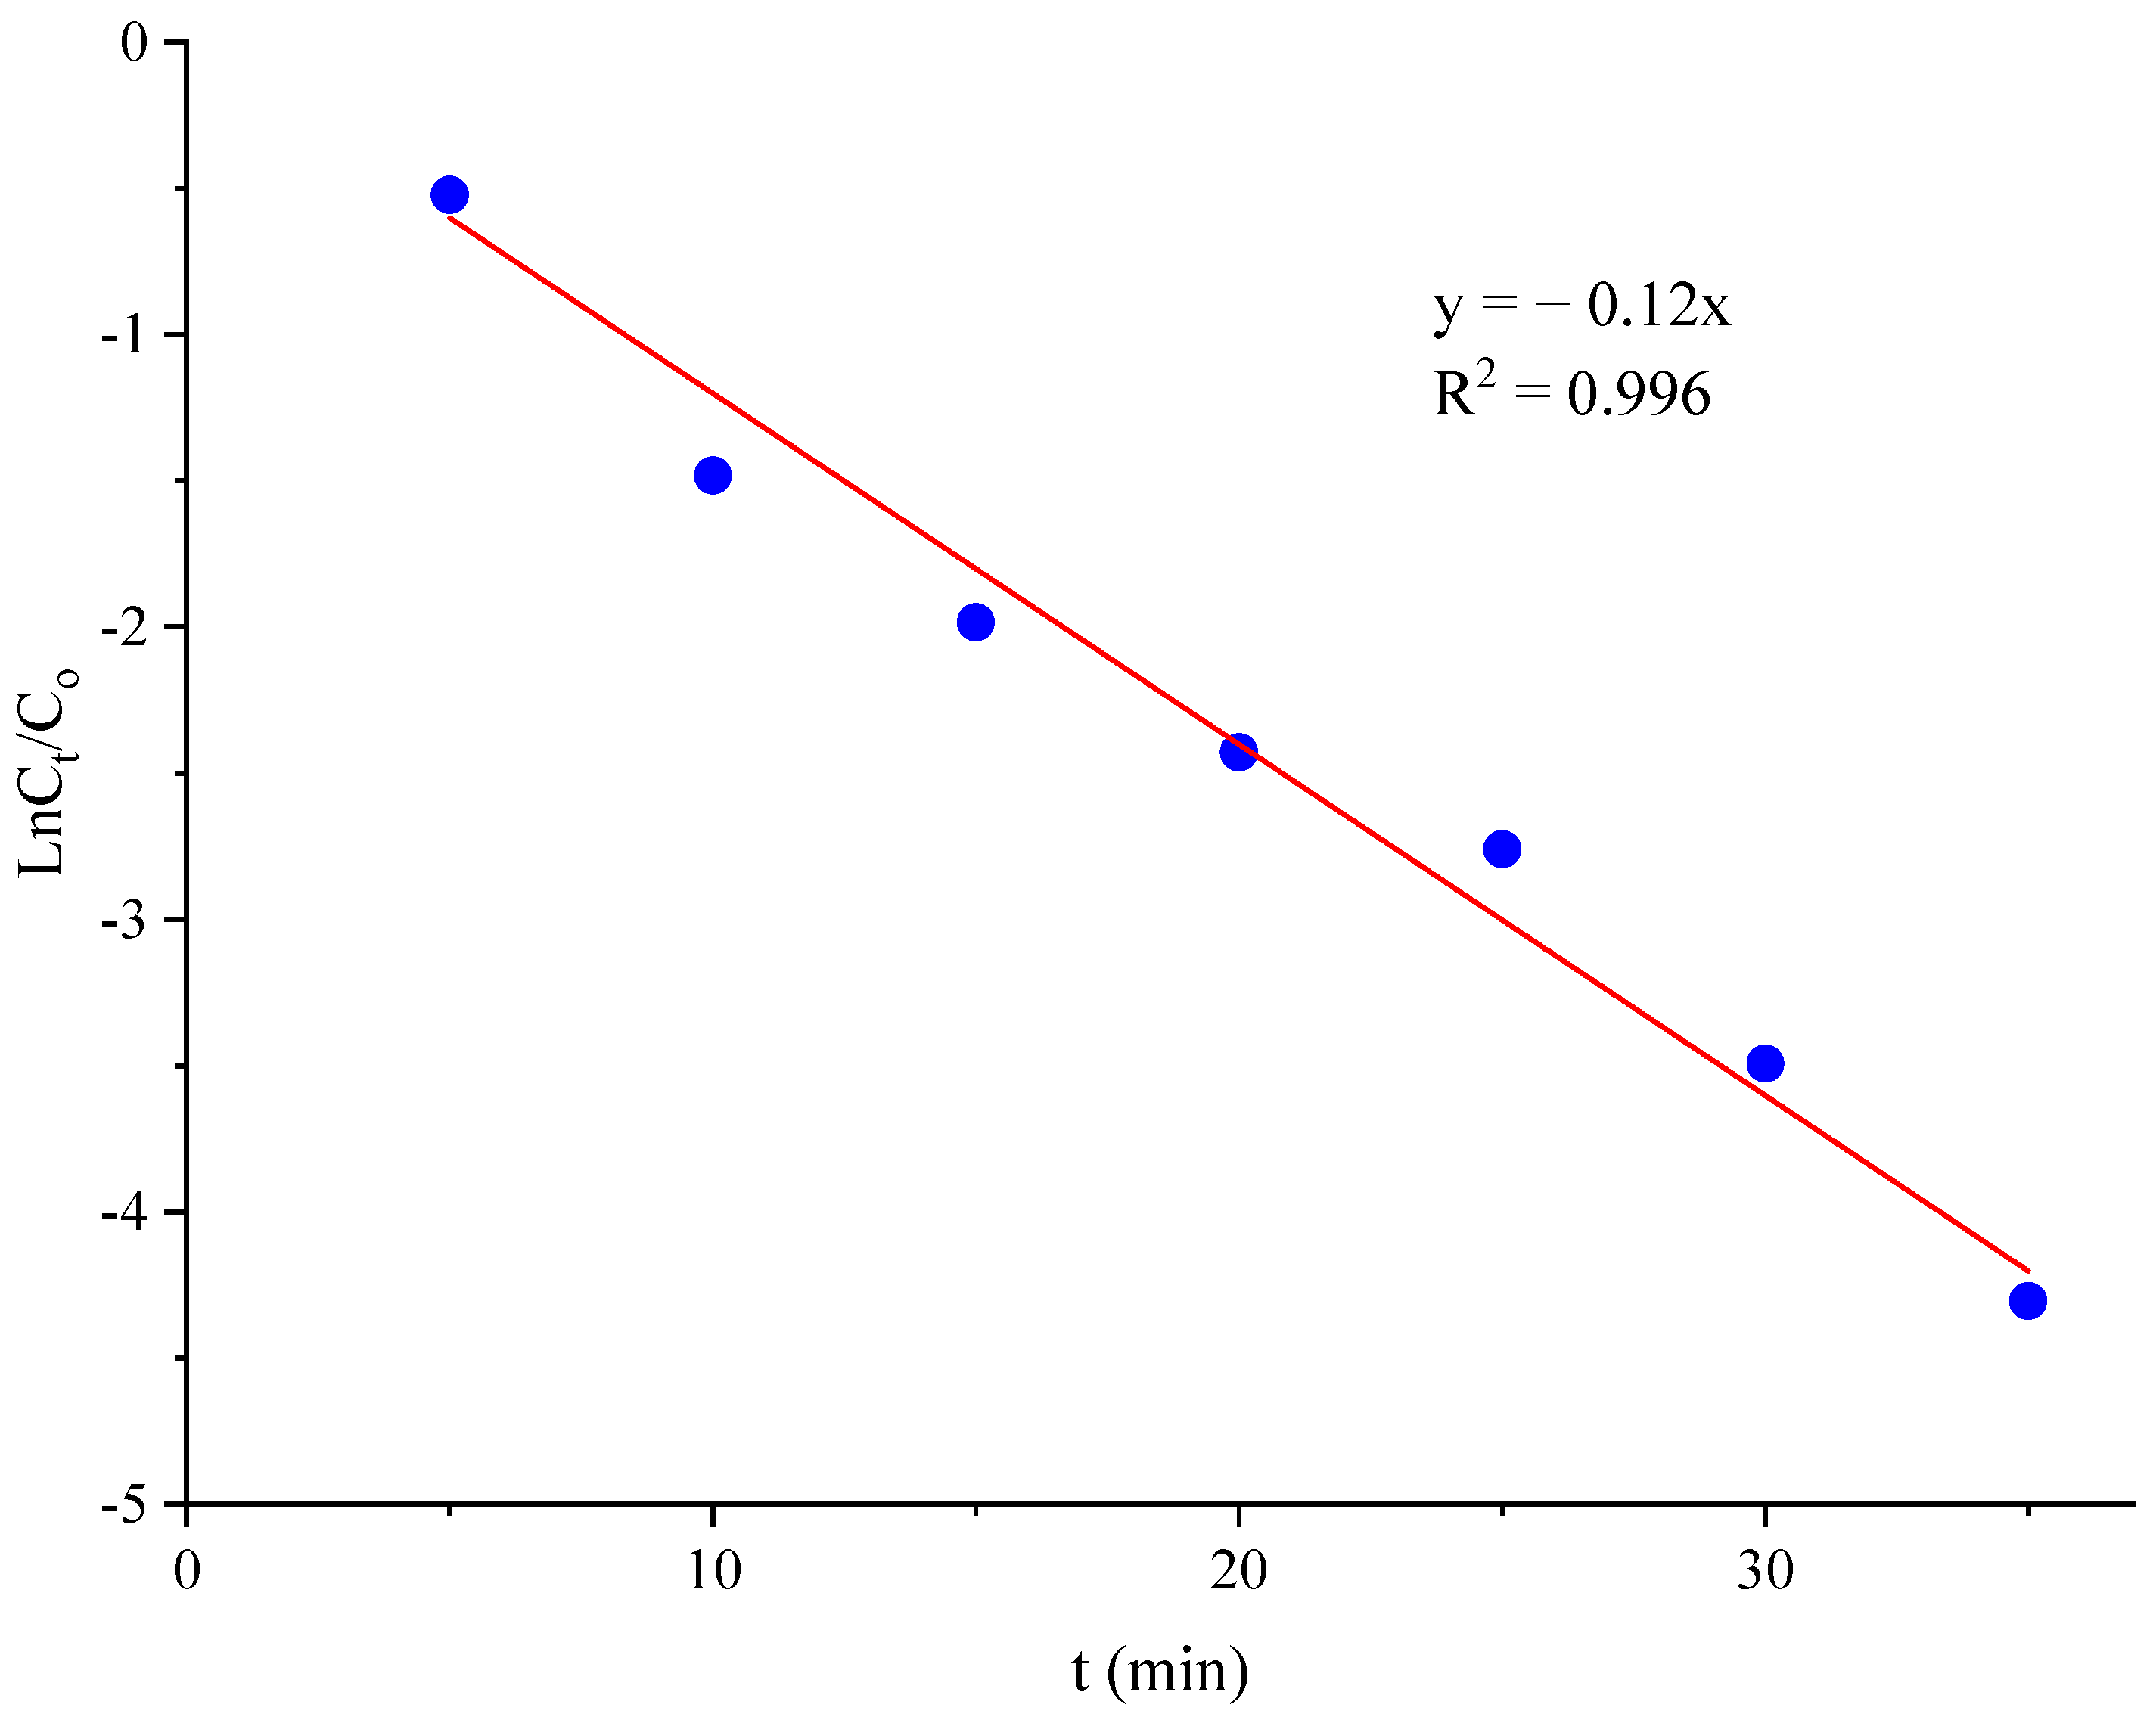
2.3. Kinetic Study
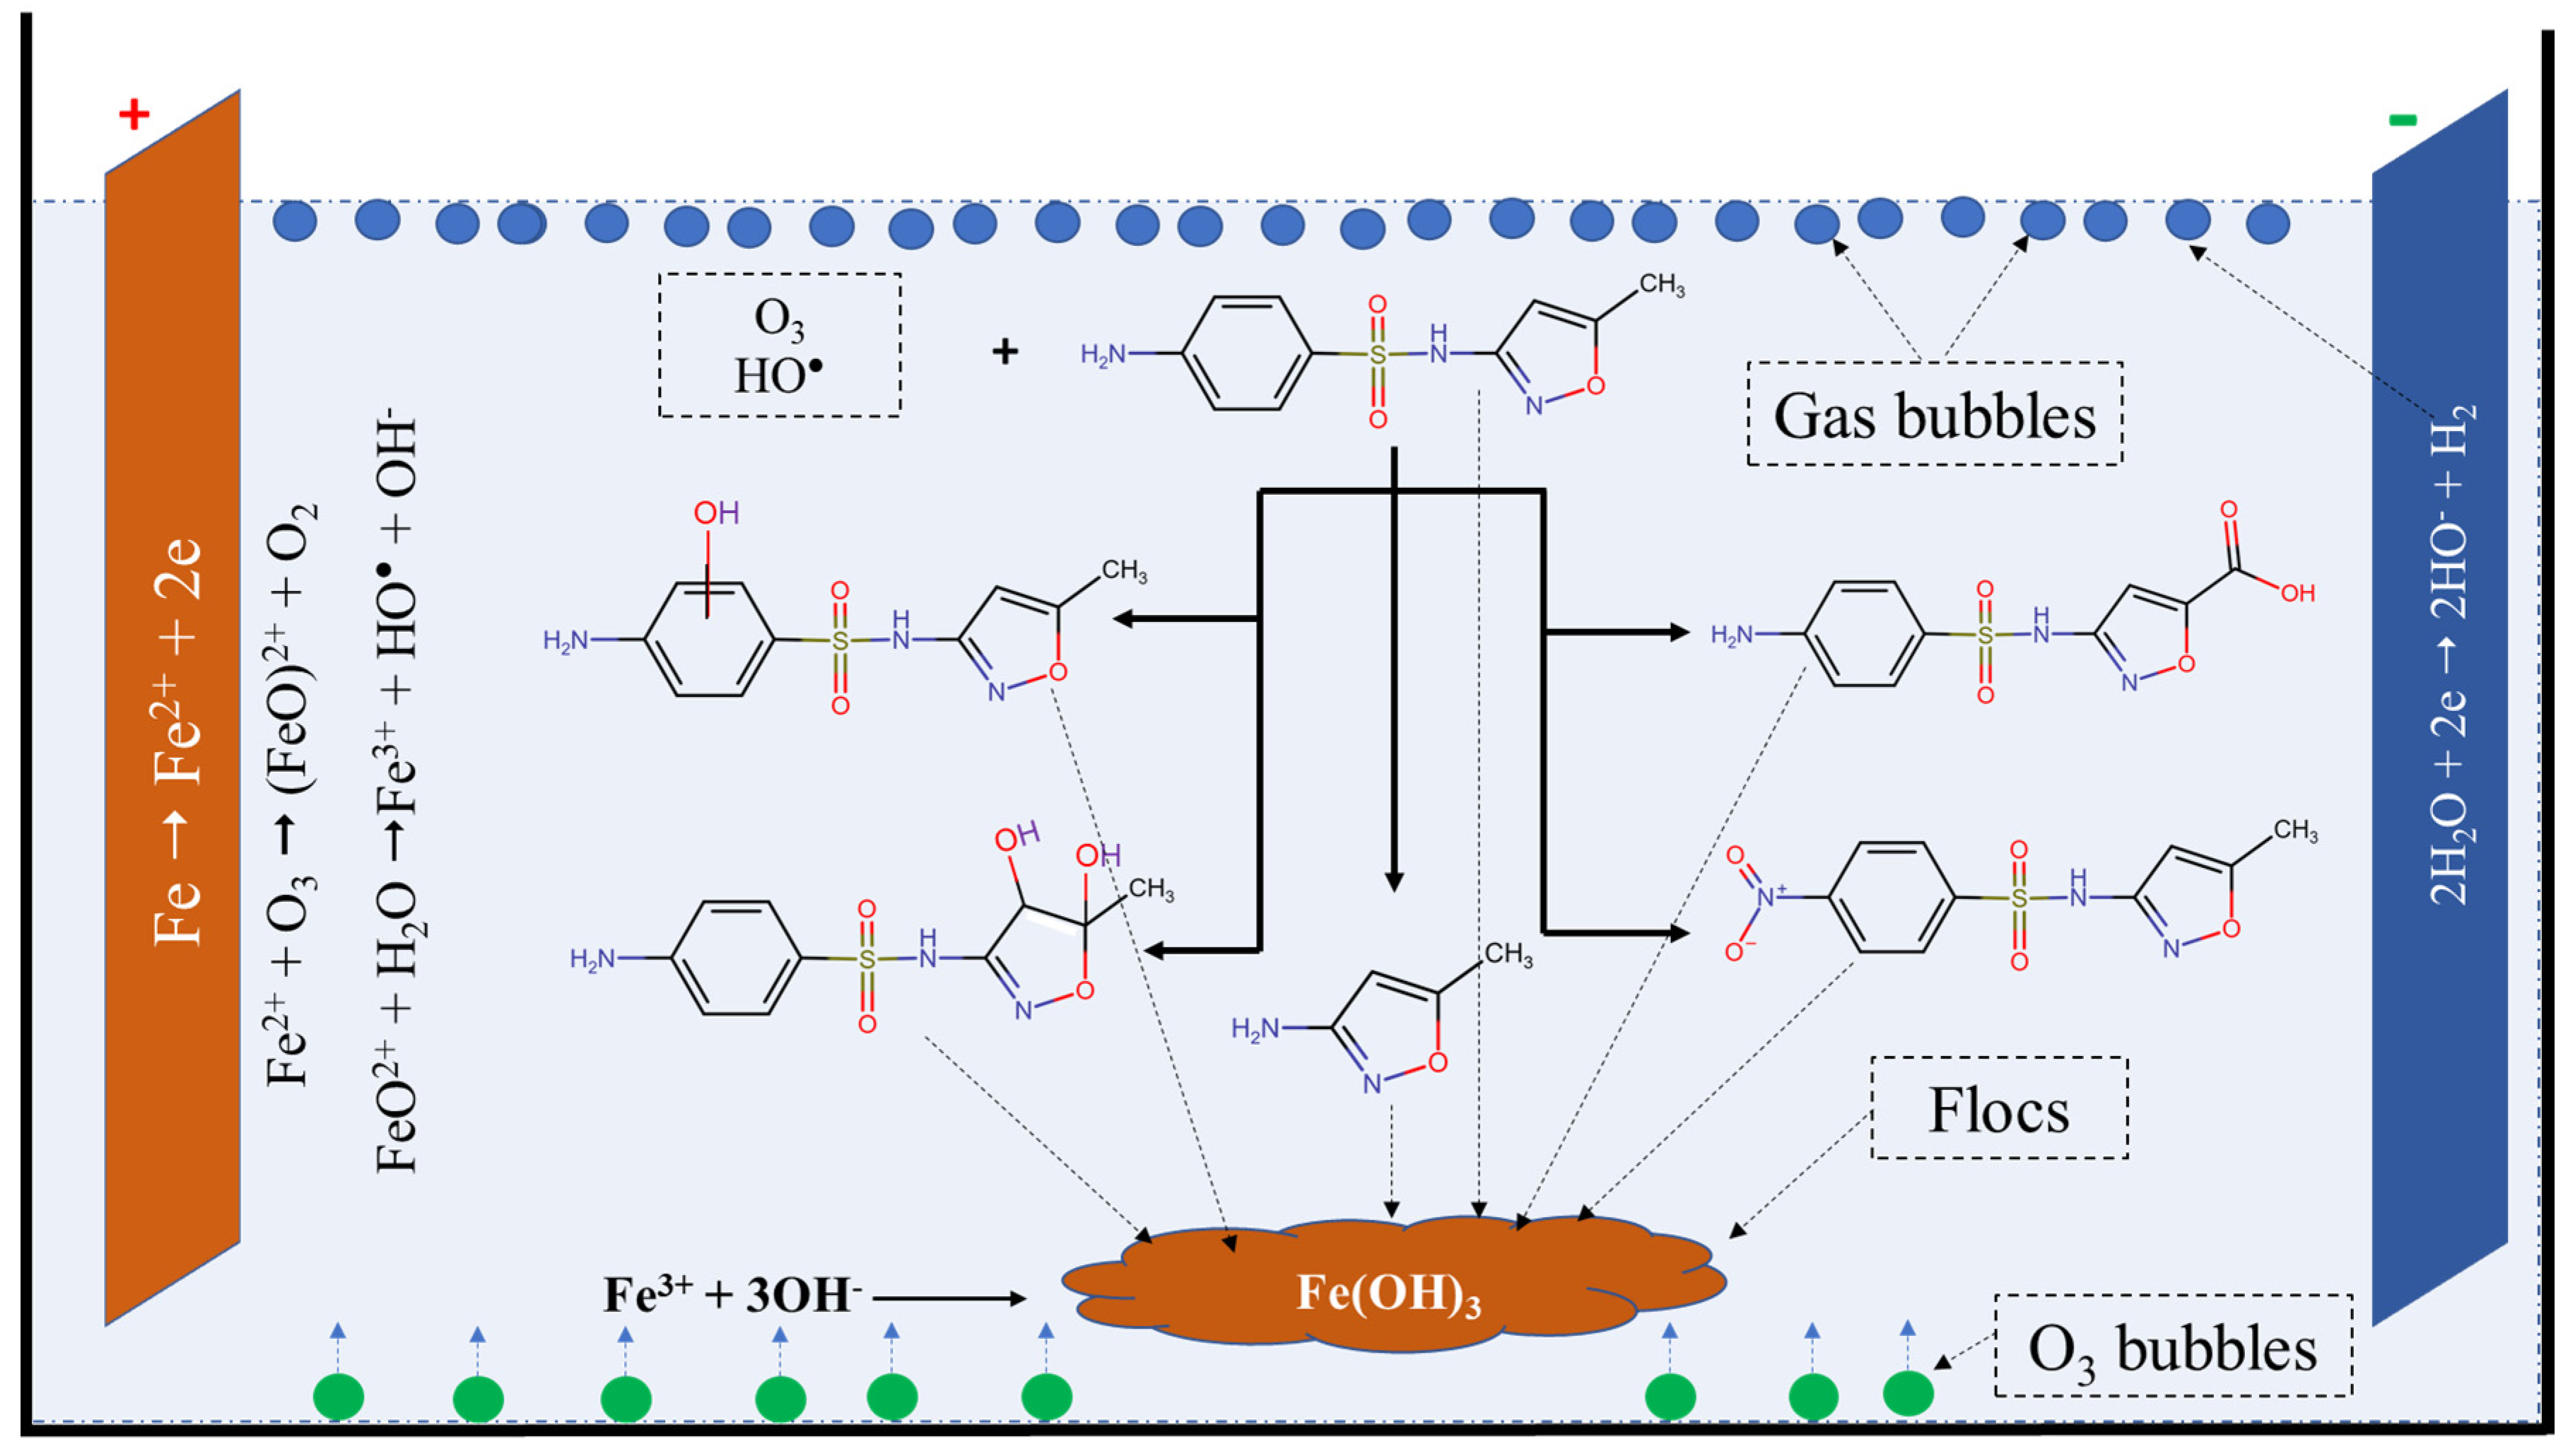
2.4. Possible Mechanism
3. Materials and Methods
3.1. Chemicals
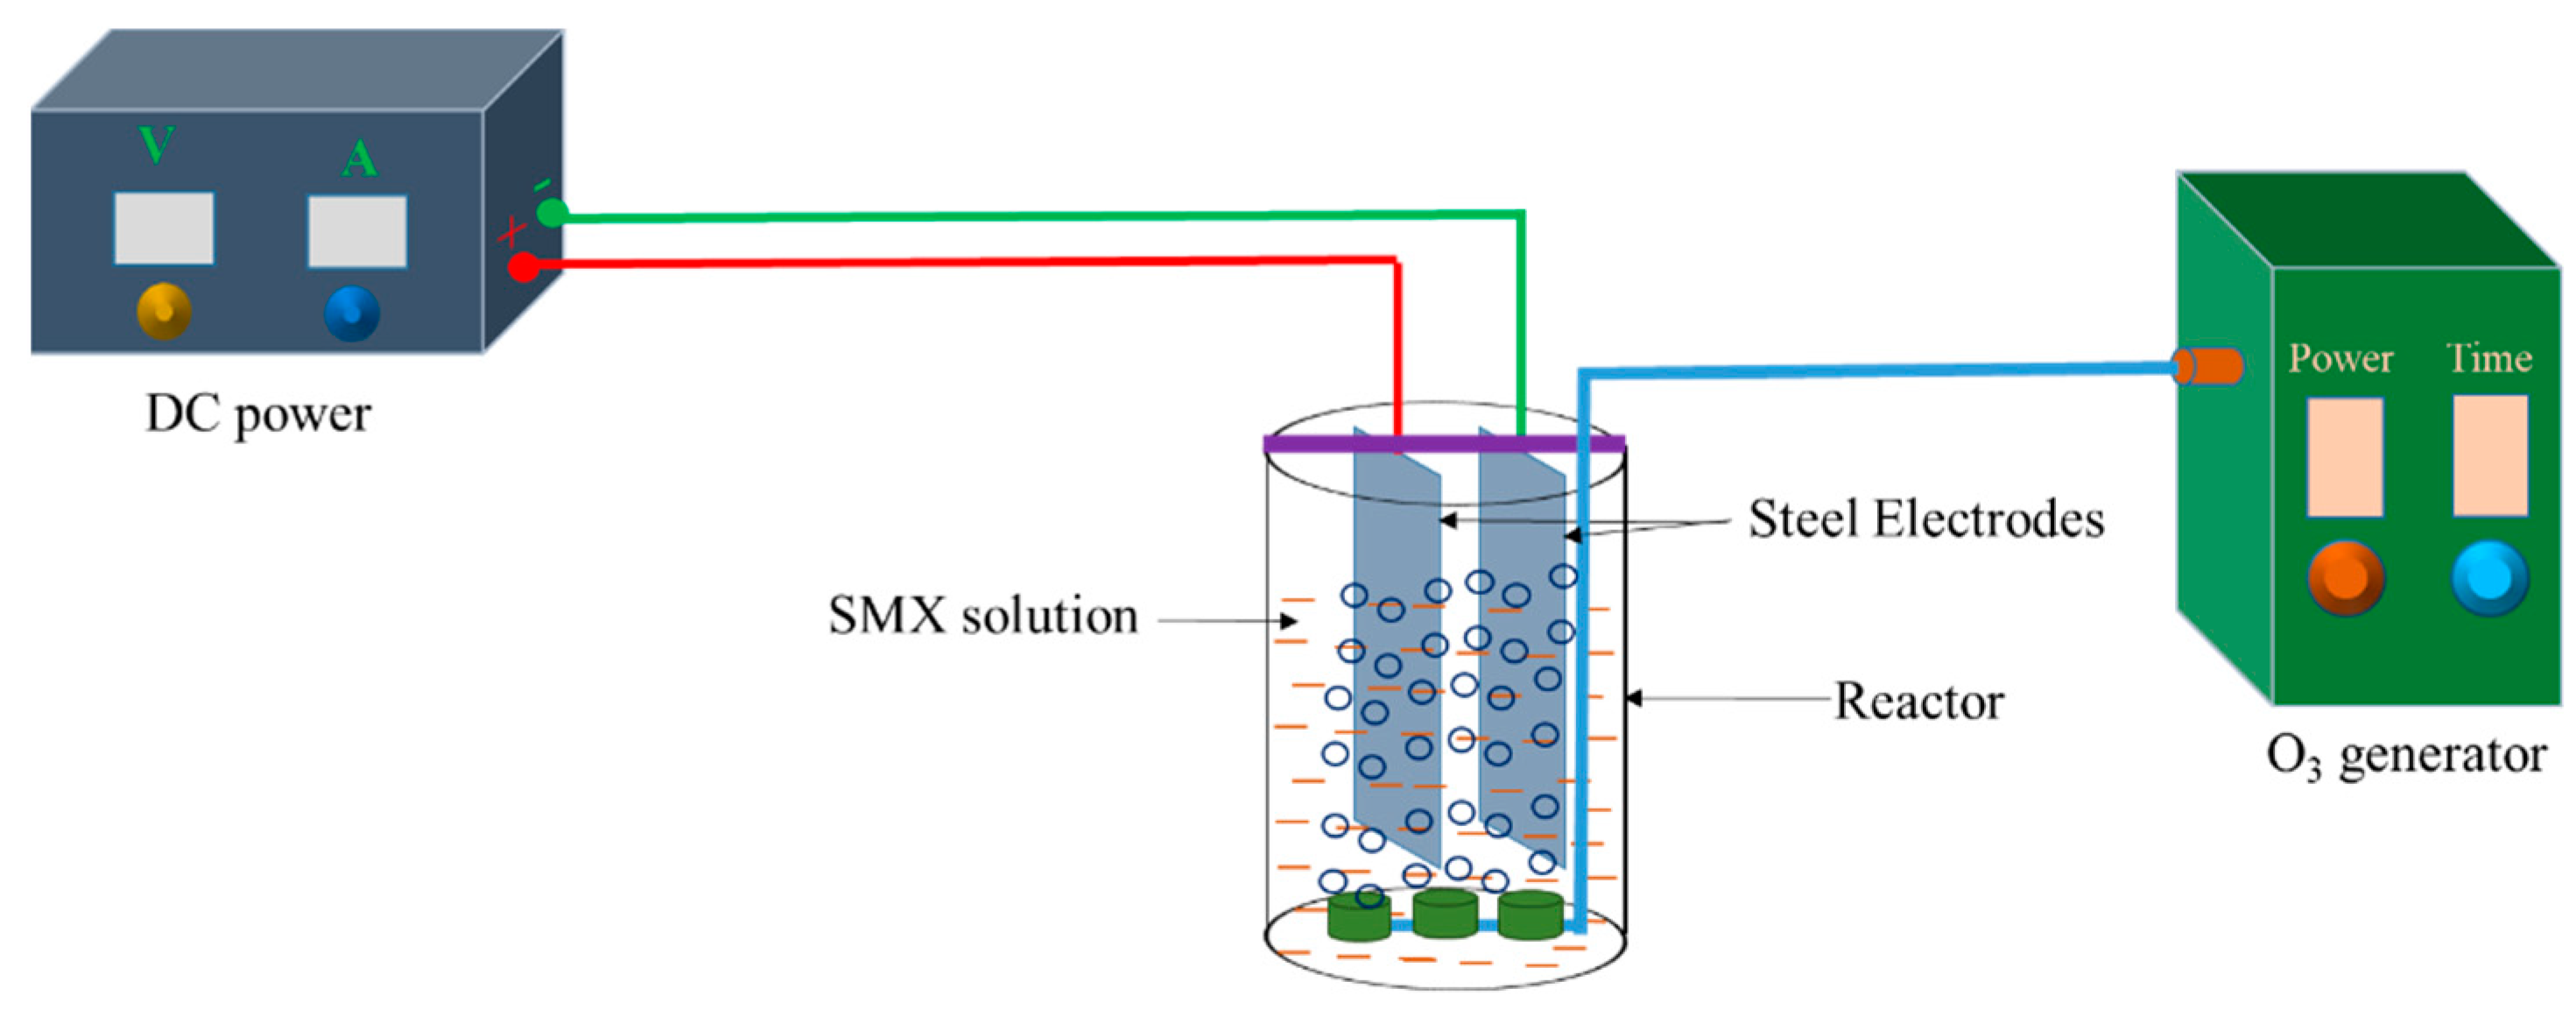
3.2. Ozone–Electrocoagulation System
3.3. Experimental Design
3.4. Structure of ANN Model
3.5. Statistics
4. Conclusions
Author Contributions
Funding
Data Availability Statement
Conflicts of Interest
Sample Availability
References
- Prasannamedha, G.; Kumar, P.S. A Review on Contamination and Removal of Sulfamethoxazole from Aqueous Solution Using Cleaner Techniques: Present and Future Perspective. J. Clean. Prod. 2020, 250, 119553. [Google Scholar] [CrossRef]
- Gao, S.; Zhao, Z.; Xu, Y.; Tian, J.; Qi, H.; Lin, W.; Cui, F. Oxidation of Sulfamethoxazole (SMX) by Chlorine, Ozone and Permanganate-A Comparative Study. J. Hazard. Mater. 2014, 274, 258–269. [Google Scholar] [CrossRef] [PubMed]
- Ma, S.; Zuo, X.; Xiong, J.; Ma, C.; Chen, Z. Sulfamethoxazole Removal Enhancement from Water in High-Silica ZSM-5/Ozonation Synchronous System with Low Ozone Consumption. J. Water Process Eng. 2020, 33, 101083. [Google Scholar] [CrossRef]
- Mestre, A.S.; Carvalho, A.P. Photocatalytic Degradation of Pharmaceuticals Wastewater. Molecules 2019, 24, 3702. [Google Scholar] [CrossRef] [PubMed] [Green Version]
- Bizi, M. Sulfamethoxazole Removal from Drinking Water by Activated Carbon: Kinetics and Diffusion Process. Molecules 2020, 25, 4656. [Google Scholar] [CrossRef]
- del Gómez-Ramos, M.; Mezcua, M.; Agüera, A.; Fernández-Alba, A.R.; Gonzalo, S.; Rodríguez, A.; Rosal, R. Chemical and Toxicological Evolution of the Antibiotic Sulfamethoxazole under Ozone Treatment in Water Solution. J. Hazard. Mater. 2011, 192, 18–25. [Google Scholar] [CrossRef] [PubMed]
- Hou, L.; Zhang, H.; Wang, L.; Chen, L.; Xiong, Y.; Xue, X. Removal of Sulfamethoxazole from Aqueous Solution by Sono-Ozonation in the Presence of a Magnetic Catalyst. Sep. Purif. Technol. 2013, 117, 46–52. [Google Scholar] [CrossRef]
- Guo, W.Q.; Yin, R.L.; Zhou, X.J.; Du, J.S.; Cao, H.O.; Yang, S.S.; Ren, N.Q. Sulfamethoxazole Degradation by Ultrasound/Ozone Oxidation Process in Water: Kinetics, Mechanisms, and Pathways. Ultrason. Sonochem. 2015, 22, 182–187. [Google Scholar] [CrossRef]
- Xiang, L.; Xie, Z.; Guo, H.; Song, J.; Li, D.; Wang, Y.; Pan, S.; Lin, S.; Li, Z.; Han, J.; et al. Efficient Removal of Emerging Contaminant Sulfamethoxazole in Water by Ozone Coupled with Calcium Peroxide: Mechanism and Toxicity Assessment. Chemosphere 2021, 283, 131156. [Google Scholar] [CrossRef]
- Gomes, D.S.; Gando-Ferreira, L.M.; Quinta-Ferreira, R.M.; Martins, R.C. Removal of Sulfamethoxazole and Diclofenac from Water: Strategies Involving O3 and H2O2. Environ. Technol. 2018, 39, 1658–1669. [Google Scholar] [CrossRef]
- Nidheesh, P.V.; Scaria, J.; Babu, D.S.; Kumar, M.S. An Overview on Combined Electrocoagulation-Degradation Processes for the Effective Treatment of Water and Wastewater. Chemosphere 2021, 263, 127907. [Google Scholar] [CrossRef] [PubMed]
- Das, P.P.; Anweshan, A.; Mondal, P.; Sinha, A.; Biswas, P.; Sarkar, S.; Purkait, M.K. Integrated Ozonation Assisted Electrocoagulation Process for the Removal of Cyanide from Steel Industry Wastewater. Chemosphere 2021, 263, 128370. [Google Scholar] [CrossRef] [PubMed]
- Song, S.; Yao, J.; He, Z.; Qiu, J.; Chen, J. Effect of Operational Parameters on the Decolorization of C.I. Reactive Blue 19 in Aqueous Solution by Ozone-Enhanced Electrocoagulation. J. Hazard. Mater. 2008, 152, 204–210. [Google Scholar] [CrossRef] [PubMed]
- Bilińska, L.; Blus, K.; Gmurek, M.; Ledakowicz, S. Coupling of Electrocoagulation and Ozone Treatment for Textile Wastewater Reuse. Chem. Eng. J. 2019, 358, 992–1001. [Google Scholar] [CrossRef]
- Hernández-Ortega, M.; Ponziak, T.; Barrera-Díaz, C.; Rodrigo, M.A.; Roa-Morales, G.; Bilyeu, B. Use of a Combined Electrocoagulation-Ozone Process as a Pre-Treatment for Industrial Wastewater. Desalination 2010, 250, 144–149. [Google Scholar] [CrossRef]
- Aziz, A.R.A.; Asaithambi, P.; Daud, W.M.A.B.W. Combination of Electrocoagulation with Advanced Oxidation Processes for the Treatment of Distillery Industrial Effluent. Process Saf. Environ. Prot. 2016, 99, 227–235. [Google Scholar] [CrossRef]
- Asaithambi, P.; Govindarajan, R.; Busier Yesuf, M.; Selvakumar, P.; Alemayehu, E. Enhanced Treatment of Landfill Leachate Wastewater Using Sono(US)-Ozone(O3)–Electrocoagulation(EC) Process: Role of Process Parameters on Color, COD and Electrical Energy Consumption. Process Saf. Environ. Prot. 2020, 142, 212–218. [Google Scholar] [CrossRef]
- Asaithambi, P.; Aziz, A.R.A.; Daud, W.M.A.B.W. Integrated Ozone—Electrocoagulation Process for the Removal of Pollutant from Industrial Effluent: Optimization through Response Surface Methodology. Chem. Eng. Process. Process Intensif. 2016, 105, 92–102. [Google Scholar] [CrossRef]
- Asaithambi, P.; Susree, M.; Saravanathamizhan, R.; Matheswaran, M. Ozone Assisted Electrocoagulation for the Treatment of Distillery Effluent. Desalination 2012, 297, 1–7. [Google Scholar] [CrossRef]
- Behin, J.; Farhadian, N.; Ahmadi, M.; Parvizi, M. Ozone Assisted Electrocoagulation in a Rectangular Internal-Loop Airlift Reactor: Application to Decolorization of Acid Dye. J. Water Process Eng. 2015, 8, 171–178. [Google Scholar] [CrossRef]
- Ahangarnokolaei, M.A.; Ayati, B.; Ganjidoust, H. Simultaneous and Sequential Combination of Electrocoagulation and Ozonation by Al and Fe Electrodes for DirectBlue71 Treatment in a New Reactor: Synergistic Effect and Kinetics Study. Chemosphere 2021, 285, 131424. [Google Scholar] [CrossRef] [PubMed]
- Bernal-Martínez, L.A.; Barrera-Díaz, C.; Solís-Morelos, C.; Natividad, R. Synergy of Electrochemical and Ozonation Processes in Industrial Wastewater Treatment. Chem. Eng. J. 2010, 165, 71–77. [Google Scholar] [CrossRef]
- Mehralian, M.; Khashij, M.; Dalvand, A. Treatment of Cardboard Factory Wastewater Using Ozone-Assisted Electrocoagulation Process: Optimization through Response Surface Methodology. Environ. Sci. Pollut. Res. 2021, 28, 45041–45049. [Google Scholar] [CrossRef] [PubMed]
- Song, S.; He, Z.; Qiu, J.; Xu, L.; Chen, J. Ozone Assisted Electrocoagulation for Decolorization of C.I. Reactive Black 5 in Aqueous Solution: An Investigation of the Effect of Operational Parameters. Sep. Purif. Technol. 2007, 55, 238–245. [Google Scholar] [CrossRef]
- Karimifard, S.; Alavi Moghaddam, M.R. Application of Response Surface Methodology in Physicochemical Removal of Dyes from Wastewater: A Critical Review. Sci. Total Environ. 2018, 640–641, 772–797. [Google Scholar] [CrossRef] [PubMed]
- Nguyen, V.D.; Pham, T.T.; Vranova, V.; Nguyen, H.T.H.; Nguyen, L.T.N.; Vuong, X.T.; Bui, Q.M. Removal of Cadmium from Aqueous Solution Using Sonochemically Modified Clinoptilolite: Optimization and Modeling. Environ. Technol. Innov. 2020, 20, 101166. [Google Scholar] [CrossRef]
- Ghorbani, F.; Younesi, H.; Ghasempouri, S.M.; Zinatizadeh, A.A.; Amini, M.; Daneshi, A. Application of Response Surface Methodology for Optimization of Cadmium Biosorption in an Aqueous Solution by Saccharomyces Cerevisiae. Chem. Eng. J. 2008, 145, 267–275. [Google Scholar] [CrossRef]
- Amini, M.; Younesi, H.; Bahramifar, N.; Lorestani, A.A.Z.; Ghorbani, F.; Daneshi, A.; Sharifzadeh, M. Application of Response Surface Methodology for Optimization of Lead Biosorption in an Aqueous Solution by Aspergillus Niger. J. Hazard. Mater. 2008, 154, 694–702. [Google Scholar] [CrossRef]
- Danmaliki, G.I.; Saleh, T.A.; Shamsuddeen, A.A. Response Surface Methodology Optimization of Adsorptive Desulfurization on Nickel/Activated Carbon. Chem. Eng. J. 2017, 313, 993–1003. [Google Scholar] [CrossRef]
- Bezerra, M.A.; Santelli, R.E.; Oliveira, E.P.; Villar, L.S.; Escaleira, L.A. Response Surface Methodology (RSM) as a Tool for Optimization in Analytical Chemistry. Talanta 2008, 76, 965–977. [Google Scholar] [CrossRef]
- Qian, J.; Zhou, X.; Cai, Q.; Zhao, J.; Huang, X. The Study of Optimal Adsorption Conditions of Phosphate on Fe-Modified Biochar by Response Surface Methodology. Molecules 2023, 28, 2323. [Google Scholar] [CrossRef]
- Chollom, M.N.; Bakare, B.F.; Rathilal, S.; Tetteh, E.K. Evaluating the Biodegradation of Veterinary Antibiotics Using Kinetics Model and Response Surface Methodology. Molecules 2022, 27, 5402. [Google Scholar] [CrossRef] [PubMed]
- Behera, S.K.; Meena, H.; Chakraborty, S.; Meikap, B.C. Application of Response Surface Methodology (RSM) for Optimization of Leaching Parameters for Ash Reduction from Low-Grade Coal. Int. J. Min. Sci. Technol. 2018, 28, 621–629. [Google Scholar] [CrossRef]
- Kavand, M.; Eslami, P.; Razeh, L. The Adsorption of Cadmium and Lead Ions from the Synthesis Wastewater with the Activated Carbon: Optimization of the Single and Binary Systems. J. Water Process Eng. 2020, 34, 101151. [Google Scholar] [CrossRef]
- Bhatti, M.S.; Reddy, A.S.; Kalia, R.K.; Thukral, A.K. Modeling and Optimization of Voltage and Treatment Time for Electrocoagulation Removal of Hexavalent Chromium. Desalination 2011, 269, 157–162. [Google Scholar] [CrossRef]
- Ghaedi, A.M.; Vafaei, A. Applications of Artificial Neural Networks for Adsorption Removal of Dyes from Aqueous Solution: A Review. Adv. Colloid Interface Sci. 2017, 245, 20–39. [Google Scholar] [CrossRef]
- Takahashi, M.B.; Coelho de Oliveira, H.; Fernández Núñez, E.G.; Rocha, J.C. Brewing Process Optimization by Artificial Neural Network and Evolutionary Algorithm Approach. J. Food Process Eng. 2019, 42, e13103. [Google Scholar] [CrossRef]
- Kaushik, A.; Khan, R.; Solanki, P.R.; Pandey, P.; Alam, J.; Ahmad, S.; Malhotra, B.D. Iron Oxide Nanoparticles-Chitosan Composite Based Glucose Biosensor. Biosens. Bioelectron. 2008, 24, 676–683. [Google Scholar] [CrossRef]
- Khan, T.; Manan, T.S.B.A.; Isa, M.H.; Ghanim, A.A.J.; Beddu, S.; Jusoh, H.; Iqbal, M.S.; Ayele, G.T.; Jami, M.S. Modeling of Cu(II) Adsorption from an Aqueous Solution Using an Artificial Neural Network (ANN). Molecules 2020, 25, 3263. [Google Scholar] [CrossRef]
- Khan, T.; Mustafa, M.R.U.; Isa, M.H.; Manan, T.S.B.A.; Ho, Y.C.; Lim, J.W.; Yusof, N.Z. Artificial Neural Network (ANN) for Modelling Adsorption of Lead (Pb (II)) from Aqueous Solution. Water. Air. Soil Pollut. 2017, 153, 1288–1300. [Google Scholar] [CrossRef]
- Nguyen, V.D.; Nguyen, H.T.H.; Vranova, V.; Nguyen, L.T.N.; Bui, Q.M.; Khieu, T.T. Artificial Neural Network Modeling for Congo Red Adsorption on Microwave-Synthesized Akaganeite Nanoparticles: Optimization, Kinetics, Mechanism, and Thermodynamics. Environ. Sci. Pollut. Res. 2021, 28, 9133–9145. [Google Scholar] [CrossRef] [PubMed]
- Ullah, S.; Assiri, M.A.; Al-Sehemi, A.G.; Bustam, M.A.; Sagir, M.; Abdulkareem, F.A.; Raza, M.R.; Ayoub, M.; Irfan, A. Characteristically Insights, Artificial Neural Network (ANN), Equilibrium, and Kinetic Studies of Pb(II) Ion Adsorption on Rice Husks Treated with Nitric Acid. Int. J. Environ. Res. 2020, 14, 43–60. [Google Scholar] [CrossRef]
- Reynel-Ávila, H.E.; Aguayo-Villarreal, I.A.; Diaz-Muñoz, L.L.; Moreno-Pérez, J.; Sánchez-Ruiz, F.J.; Rojas-Mayorga, C.K.; Mendoza-Castillo, D.I.; Bonilla-Petriciolet, A. A Review of the Modeling of Adsorption of Organic and Inorganic Pollutants from Water Using Artificial Neural Networks. Adsorpt. Sci. Technol. 2022, 2022, 9384871. [Google Scholar] [CrossRef]
- Yang, Y.; Lin, X.; Wei, B.; Zhao, Y.; Wang, J. Evaluation of Adsorption Potential of Bamboo Biochar for Metal-Complex Dye: Equilibrium, Kinetics and Artificial Neural Network Modeling. Int. J. Environ. Sci. Technol. 2014, 11, 1093–1100. [Google Scholar] [CrossRef]
- Akhtar, A.; Aslam, Z.; Asghar, A.; Bello, M.M.; Raman, A.A.A. Electrocoagulation of Congo Red Dye-Containing Wastewater: Optimization of Operational Parameters and Process Mechanism. J. Environ. Chem. Eng. 2020, 8, 104055. [Google Scholar] [CrossRef]
- Almukdad, A.; Hafiz, M.A.; Yasir, A.T.; Alfahel, R.; Hawari, A.H. Unlocking the Application Potential of Electrocoagulation Process through Hybrid Processes. J. Water Process Eng. 2021, 40, 101956. [Google Scholar] [CrossRef]
- Prasannamedha, G.; Kumar, P.S.; Mehala, R.; Sharumitha, T.J.; Surendhar, D. Enhanced Adsorptive Removal of Sulfamethoxazole from Water Using Biochar Derived from Hydrothermal Carbonization of Sugarcane Bagasse. J. Hazard. Mater. 2021, 407, 124825. [Google Scholar] [CrossRef]
- Reis, P.J.M.; Reis, A.C.; Ricken, B.; Kolvenbach, B.A.; Manaia, C.M.; Corvini, P.F.X.; Nunes, O.C. Biodegradation of Sulfamethoxazole and Other Sulfonamides by Achromobacter Denitrificans PR1. J. Hazard. Mater. 2014, 280, 741–749. [Google Scholar] [CrossRef] [Green Version]
- Babaei, A.A.; Khataee, A.; Ahmadpour, E.; Sheydaei, M.; Kakavandi, B.; Alaee, Z. Optimization of Cationic Dye Adsorption on Activated Spent Tea: Equilibrium, Kinetics, Thermodynamic and Artificial Neural Network Modeling. Korean J. Chem. Eng. 2016, 33, 1352–1361. [Google Scholar] [CrossRef]
- Guo, H.; Li, D.; Li, Z.; Lin, S.; Wang, Y.; Pan, S.; Han, J. Promoted Elimination of Antibiotic Sulfamethoxazole in Water Using Sodium Percarbonate Activated by Ozone: Mechanism, Degradation Pathway and Toxicity Assessment. Sep. Purif. Technol. 2021, 266, 118543. [Google Scholar] [CrossRef]
- Rakness, K.; Gordon, G.; Langlais, B.; Masschelein, W.; Matsumoto, N.; Richard, Y.; Robson, C.M.; Somiya, I. Guideline for Measurement of Ozone Concentration in the Process Gas from an Ozone Generator. Ozone Sci. Eng. 1996, 18, 209–229. [Google Scholar] [CrossRef]


| Source | Sequential p-Value | Lack of Fit p-Value | Adjusted R2 | Predicted R2 |
|---|---|---|---|---|
| Linear | <0.0001 | <0.0001 | 0.5734 | 0.5329 |
| 2FI | 0.8169 | <0.0001 | 0.5122 | 0.4673 |
| Quadratic | <0.0001 | 0.2972 | 0.994 | 0.985 |
| Source | Sum of Squares | df | Mean Square | F-Value | p-Value |
|---|---|---|---|---|---|
| Model | 3948.36 | 14 | 282.03 | 341.84 | <0.0001 |
| A-Current density | 1646.89 | 1 | 1646.89 | 1996.18 | <0.0001 |
| B-pH | 295.19 | 1 | 295.19 | 357.80 | <0.0001 |
| C-Time | 155.40 | 1 | 155.40 | 188.36 | <0.0001 |
| D-Ozone dose | 406.64 | 1 | 406.64 | 492.89 | <0.0001 |
| AB | 14.42 | 1 | 14.42 | 17.48 | 0.0008 |
| AC | 0.2426 | 1 | 0.2426 | 0.2940 | 0.5956 |
| AD | 92.79 | 1 | 92.79 | 112.46 | <0.0001 |
| BC | 34.25 | 1 | 34.25 | 41.52 | <0.0001 |
| BD | 12.20 | 1 | 12.20 | 14.78 | 0.0016 |
| CD | 36.88 | 1 | 36.88 | 44.70 | <0.0001 |
| A2 | 601.53 | 1 | 601.53 | 729.11 | <0.0001 |
| B2 | 711.82 | 1 | 711.82 | 862.78 | <0.0001 |
| C2 | 144.38 | 1 | 144.38 | 175.00 | <0.0001 |
| D2 | 232.35 | 1 | 232.35 | 281.63 | <0.0001 |
| Residual | 12.38 | 15 | 0.8250 | ||
| Lack of Fit | 9.53 | 10 | 0.9525 | 1.67 | 0.2972 |
| Pure Error | 2.85 | 5 | 0.5700 | ||
| Cor Total | 3960.74 | 29 |
| Name | Goal | Lower Limit | Upper Limit | Lower Weight | Upper Weight | Importance |
|---|---|---|---|---|---|---|
| A: Current density | in range | 20 | 40 | 1 | 1 | 3 |
| B: pH | in range | 7 | 9 | 1 | 1 | 3 |
| C: Time | in range | 20 | 40 | 1 | 1 | 3 |
| D: Ozone dose | in range | 0.3 | 0.7 | 1 | 1 | 3 |
| Removal Efficiency | maximize | 57.81 | 99.15 | 1 | 1 | 5 |
| Layer 1 | Layer 2 | R2 | MSE |
|---|---|---|---|
| tansig | purelin | 0.779 | 30.464 |
| logsig | purelin | 0.980 | 2.646 |
| tansig | logsig | 0.729 | 60.663 |
| logsig | tansig | 0.952 | 7.806 |
| tansig | tansig | 0.613 | 101.465 |
| logsig | logsig | 0.047 | 141.302 |
| purelin | logsig | 0.414 | 88.153 |
| purelin | tansig | 0.662 | 44.992 |
| purelin | purelin | 0.605 | 55.197 |
| Independent Variables | Range | ||||
|---|---|---|---|---|---|
| −α | −1 | 0 | +1 | +α | |
| Current density (A/m2) | 10 | 20 | 30 | 40 | 50 |
| pH | 6 | 7 | 8 | 9 | 10 |
| Time (mm) | 10 | 20 | 30 | 40 | 50 |
| Ozone dose | 0.1 | 0.3 | 0.5 | 0.7 | 0.9 |
Disclaimer/Publisher’s Note: The statements, opinions and data contained in all publications are solely those of the individual author(s) and contributor(s) and not of MDPI and/or the editor(s). MDPI and/or the editor(s) disclaim responsibility for any injury to people or property resulting from any ideas, methods, instructions or products referred to in the content. |
© 2023 by the authors. Licensee MDPI, Basel, Switzerland. This article is an open access article distributed under the terms and conditions of the Creative Commons Attribution (CC BY) license (https://creativecommons.org/licenses/by/4.0/).
Share and Cite
Nghia, N.T.; Tuyen, B.T.K.; Quynh, N.T.; Thuy, N.T.T.; Nguyen, T.N.; Nguyen, V.D.; Tran, T.K.N. Response Methodology Optimization and Artificial Neural Network Modeling for the Removal of Sulfamethoxazole Using an Ozone–Electrocoagulation Hybrid Process. Molecules 2023, 28, 5119. https://doi.org/10.3390/molecules28135119
Nghia NT, Tuyen BTK, Quynh NT, Thuy NTT, Nguyen TN, Nguyen VD, Tran TKN. Response Methodology Optimization and Artificial Neural Network Modeling for the Removal of Sulfamethoxazole Using an Ozone–Electrocoagulation Hybrid Process. Molecules. 2023; 28(13):5119. https://doi.org/10.3390/molecules28135119
Chicago/Turabian StyleNghia, Nguyen Trong, Bui Thi Kim Tuyen, Ngo Thi Quynh, Nguyen Thi Thu Thuy, Thi Nguyet Nguyen, Vinh Dinh Nguyen, and Thi Kim Ngan Tran. 2023. "Response Methodology Optimization and Artificial Neural Network Modeling for the Removal of Sulfamethoxazole Using an Ozone–Electrocoagulation Hybrid Process" Molecules 28, no. 13: 5119. https://doi.org/10.3390/molecules28135119
APA StyleNghia, N. T., Tuyen, B. T. K., Quynh, N. T., Thuy, N. T. T., Nguyen, T. N., Nguyen, V. D., & Tran, T. K. N. (2023). Response Methodology Optimization and Artificial Neural Network Modeling for the Removal of Sulfamethoxazole Using an Ozone–Electrocoagulation Hybrid Process. Molecules, 28(13), 5119. https://doi.org/10.3390/molecules28135119