Abstract
As one of the crucial targets of epigenetics, histone lysine-specific demethylase 1 (LSD1) is significant in the occurrence and development of various tumors. Although several irreversible covalent LSD1 inhibitors have entered clinical trials, the large size and polarity of the FAD-binding pocket and undesired toxicity have focused interest on developing reversible LSD1 inhibitors. In this study, targeting the substrate-binding pocket of LSD1, structure-based and ligand-based virtual screenings were adopted to expand the potential novel structures with molecular docking and pharmacophore model strategies, respectively. Through drug-likeness evaluation, ADMET screening, molecular dynamics simulations, and binding free energy screening, we screened out one and four hit compounds from the databases of 2,029,554 compounds, respectively. Generally, these hit compounds can be divided into two categories, amide (Lig2 and Comp2) and 1,2,4-triazolo-4,3-α-quinazoline (Comp3, Comp4, Comp7). Among them, Comp4 exhibits the strongest binding affinity. Finally, the binding mechanisms of the hit compounds were further calculated in detail by the residue free energy decomposition. It was found that van der Waals interactions contribute most to the binding, and FAD is also helpful in stabilizing the binding and avoiding off-target effects. We believe this work not only provides a solid theoretical foundation for the design of LSD1 substrate reversible inhibitors, but also expands the diversity of parent nucleus, offering new insights for synthetic chemists.
1. Introduction
Histone lysine-specific demethylase 1 (LSD1) is a highly conserved flavin adenine dinucleotide (FAD) dependent oxidative enzyme, the ability of expression of which has been discovered in a variety of tumor cells, including neuroblastoma, breast cancer, lung cancer, gastric cancer, acute myeloid leukemia, and so on [1,2,3,4,5]. LSD1 regulates tumor growth and metastasis through its demethylation function, which is determined by the molecules it binds. LSD1/REST or LSD1/CO-REST complexes are recruited to the corresponding promoter sequence and bind to it, removing the methyl group on the target gene through “epigenetic silencing” [4,5]. Structurally, the full-length LSD1 is comprised of 852 amino acids with three key structure domains: an N-terminal SWIRM domain (small alpha-helical domain, residues 172–271), a central protruding TOWER domain (residues 417–522), and C-terminal AOL (amine oxidase-like domain, residues 271–417 and 522–833) [6] (Figure 1). The SWIRM domain contributes to the steadiness of the protein and could participate in the LSD1-mediated protein-protein interactions that are imperative for regulating epigenetic modifications [7]. The TOWER domain is significant for maintaining the AOL domain spatial configuration, and could affect the interactions with other proteins, such as COREST [8]. The AOL domain consists of an FAD-binding domain and a substrate-binding domain, with two active binding centers in between at the crossover point. These two active binding sites form the catalytic activity center jointly.
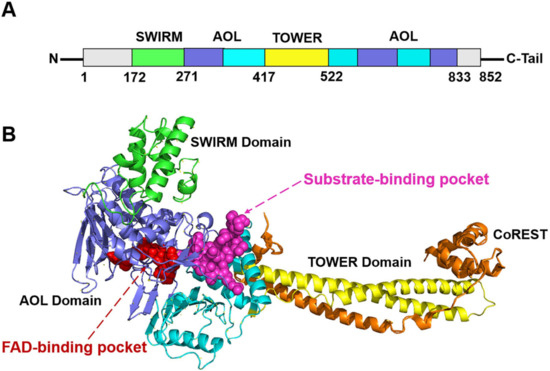
Figure 1.
The (A) primary sequence and (B) tertiary structure schematic diagrams of LSD1 [9]. The FAD-binding pocket and substrate-binding pocket are colored in red and magenta, respectively.
Generally, the reported LSD1 inhibitors [10] can be divided into two categories: irreversible and reversible ones. Recently, almost all the irreversible LSD1 inhibitors already undergoing clinical trials are effective on the FAD catalytic pocket, most of which are tranylcypromine-based compounds, such as TCP, ORY-1001 [11], GSK-2879552 [12,13], IMG-7289, INCB059872, ORY-2001, and TAK-418 (Figure 2B). These inhibitors bond with FAD covalently and thus always produce on-target toxicity [6,14,15,16]. Distinguishingly, reversible LSD1 inhibitors have been found to target either the FAD catalytic pocket or the substrate-binding pocket. For the FAD catalytic pocket, most reversible inhibitors are FAD-competitive inhibitors, such as 3-(piperidin-4-ylmethoxy)-pyridine derivatives [17] or 5-cyano-6-phenyl pyrimidine analogs [18], which have achieved excellent potency in biochemical and cellular assays. Unfortunately, these compounds exerted toxic effects as well [17,19,20]. Apart from that, the large size and polarity of the FAD-binding pocket were the other significant limitations of the FAD-competitive inhibitors. As a result, more interest has started to focus on reversible inhibitors that target substrate-binding pockets.
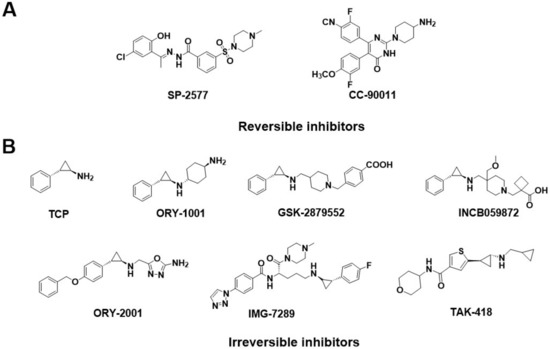
Figure 2.
Structure of (A) reversible LSD1 inhibitors and (B) TCP-based irreversible LSD1 inhibitors in clinical trials.
Several classes of LSD1 inhibitors, such as (4-cyanophenyl) glycine derivatives [19], 3,5-diamino-1,2,4-triazoles [21], 5-hydroxypyrazole derivatives [22], and 4-(pyrrolidine-3-yl) benzonitrile derivatives [23], have been discovered to be with conspicuous bioactivities targeting the substrate-binding pocket. Among them, two compounds, SP-2577 [24,25] and CC-90011 [26], have already entered the clinical stage (Figure 2A). Replacing the morpholine of compound SP-2509 with N-methylpiperazine, Sorna et al. [25] obtained compound SP-2577 (Ki = 31 nM, IC50 = 13 nM). This modification overcame the off-target effects of SP-2509 and has already started the phase I clinical trials of the relapsed or refractory ES (NCT03600649) and advanced solid tumors (NCT03895684) [24]. In 2020, employing the high-throughput screening (HTS) technology and SAR method, Kanouni et al. [26] identified compound 5-chloro-4-(4-isocyanophenyl)-N-(pyrrolidin-3-ylmethyl)pyrimidin-2-amine. Through a set of structural replacement of the branch chain, the most active compound CC-90011 (IC50 = 0.25 nM) was obtained. Additionally, the substrate-binding pocket can regulate the rotation of the amine oxidase domain concerning the TOWER domain, thereby affecting the overall receptor flexibility [27]. Thus, targeting the substrate-binding pocket would be a vital strategy for the design of corresponding reversible LSD1 inhibitors.
As one of the economical and effective methods for discovering small molecule lead compounds, the most popular virtual screening methods, structure-based and ligand-based virtual screenings (SBVS and LBVS), has been widely applied to target specific proteins. SBVS primarily utilizes the strategy of molecular docking, while LBVS includes QSAR, the pharmacophore model, and other strategies. For LSD1, Zhou et al. [28] performed a pharmacophore-based virtual screening of a library containing approximately 170,000 compounds and identified nine novel FAD-competitive LSD1 inhibitors in 2015. Compound XZ09 exhibited the best inhibitory activity, with an IC50 of 2.41 uM. However, the virtual screening method has not been applied to the substrate-binding pocket, which can compensate for the scarcity of reversible inhibitors.
In this study, targeting the substrate-binding pocket, LSD1 reversible inhibitors with strong specificity and high affinity were screened by structure-based and ligand-based virtual screenings, utilizing molecular docking and pharmacophore model strategies, respectively. Then, the corresponding binding mechanisms of hit compounds were explored through MD simulations and binding free energy calculations. We believe that this work is valuable for expanding the diversity of parent nucleus of LSD1 substrate reversible inhibitors, and also provides definite theoretical guidance for its further optimization for synthetic chemists.
2. Results and Discussion
2.1. Structure-Based Virtual Screening (SBVS)
2.1.1. Drug-Likeness and ADMET Screening
Scheme 1 showed the complete SBVS flow diagram. Drug-likeness screening was performed to expedite the narrowing of the range first, and 1,604,170 compounds were screened out following Lipinski’s and Veber’s rules. Then, 26,556 compounds with favorable ADMET properties were retained for subsequent molecular docking after ADMET screening.
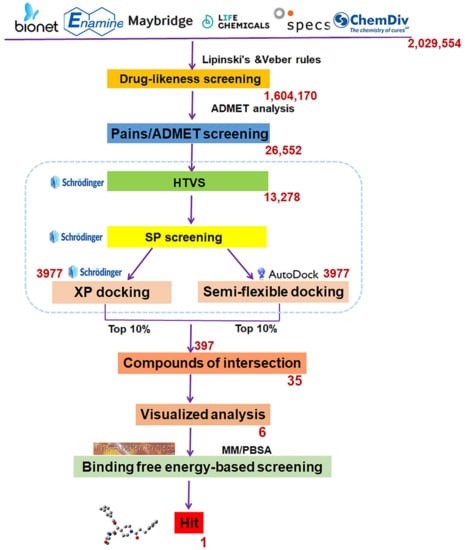
Scheme 1.
The flowchart of structure-based virtual screening targeted the substrate-binding pocket of LSD1. The red number represents how many compounds are remained after each round of screening.
2.1.2. Molecular Docking Studies
Selection of Docking Methods
In order to verify the reliability of the docking algorithm, three docking programs (Molecular Operating Environment (MOE2020), Schrödinger, and Autodock Vina) were compared and evaluated using the positive control CC-90011 (PDB ID: 6W4K) [26]. The evaluation criterion was to check whether a docking program can effectively reproduce the binding modes of ligands in crystal structures of LSD1-ligand complexes. The corresponding root mean squared deviation (RMSD) values after docking are 1.449 Å (MOE), 0.45 Å (Schrödinger), and 0.003 Å (Autodock Vina), all falling within the error range (2 Å) for SBVS. Obviously, AutoDock Vina and Schrödinger docking programs were more favorable than MOE2020 and were chosen to perform the following molecular docking screening.
Docking Screening
Three graded dockings were conducted following the previously described docking workflow and criteria for Molecular docking study in SBVS. Initially, a rough HTVS was performed, followed by a more precise SP docking screening, obtaining 3977 screened compounds. Subsequently, based on the score ranking, the top 10% of compounds obtained from XP docking in Schrödinger and the semi-flexible docking in Autodock Vina were intersected, retaining 35 compounds of intersection. Finally, following the standard that at least one hydrogen bond interaction existed between the compounds and residue Asp555 or Lys661, only six compounds (Table 1) were retained through visualized analysis. The drug-likeness and ADMET screening results are presented in Table S3.

Table 1.
Compounds obtained after visualized analysis through SBVS.
2.1.3. Screening Based on Binding Free Energy Calculations
Based on the LSD1-ligand docking conformations with the highest score among the six screened compounds, 175 ns MD simulations were performed, and the corresponding binding free energies were calculated using the last 50 ns of equilibrated trajectories. Figure S1 shows the RMSD (Cα atom) and root mean square fluctuations (RMSF) curves of these six complex systems, as well as the sole-LSD1 and LSD1_CC-90011 positive control systems. Comparing their average RMSD values, it was observed that except for Lig1 and Lig5, the interactions of the other four complexes with LSD1 slightly increased the system stabilities compared to the sole-LSD1 (3.45 Å) system (Table S4). The RMSF results indicated that two amino acid sequences (450–493 and 783–793) exhibit significant fluctuations. Structurally, since these two sequences belong to the inherently flexible loop region and are far from the targeted binding pocket, the fluctuations would not affect the binding mode.
With the MM/PBSA method, the binding free energies of six complexes and the LSD1_CC-90011 positive control system were computed based on the last 50 ns trajectories. The binding free energy of CC-90011 with LSD1 was also calculated as a reference, and the results were presented in Table 2. It is generally believed that the lower the ΔGbind value, the more stable the complex. As shown in Table 2, the ΔGbind of Lig2 is −63.13 kcal/mol, more negative than CC-90011 (ΔGbind = −44.42 kcal/mol), which suggests that it may be a potential inhibitor of LSD1. Furthermore, the favorable contributions to ΔGbind are the same, mainly coming from ΔEele, ΔEvdw, and ΔGnonp. Among these three energies, ΔEvdw consistently has the most negative value, indicating its significant role as the driving force in maintaining the stability between protein and ligands. In contrast with ΔEvdw, ΔGPB, with the largest positive value, makes an unfavorable contribution to the binding free energy.
Table 2.
Calculated MM/PBSA binding free energy of the MD simulations through SBVS.
2.1.4. Binding Mode Analysis
To gain further insights into the binding mode of Lig2 and the binding pocket of LSD1, taking CC-90011 as the positive control, the corresponding residue free energy decomposition was calculated, and values more negative than −1 kcal/mol are listed in Figure 3. When comparing LSD1_CC-90011 and LSD1_Lig2 complex systems, there are seven common residues, including Lys661, Phe538, la539, Val333, Pro808, Tyr761, and Asn540. Among these residues, four are hydrophobic (Phe538, Ala539, Val333, and Tyr761), indicating that hydrophobic interactions are the primary interactions involved. This is also inconsistent with the binding free energy calculation results. The only difference is that in LSD1_CC-90011, Lys661 has a major favorable contribution, with a decomposition energy of −5.95 kcal/mol, much larger than that of Lig2 (Table S5). This energy gap is offset by the larger hydrophobic interaction between FAD and Lig2, with a decomposition energy of −3.85 kcal/mol, which is greater than that of CC-90011 (−2.06 kcal/mol) (Table S5). In this way, the FAD in the catalytic pocket is associated with the hit Lig2 together, ensuring its stability in the adjacent substrate-binding pocket.
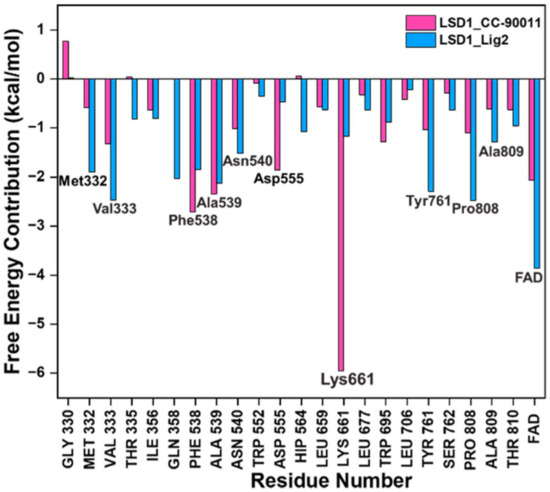
Figure 3.
Residues free energy decomposition calculations for the binding pocket composed in LSD1_CC-90011 and LSD1_Lig2 complexes.
2.2. Ligand-Based Virtual Screening (LBVS)
2.2.1. Pharmacophore Model Generation
As listed in Table 3, 10 HypoGen pharmacophore models were generated, aiming to use 3D alignments of molecules further to predict the activity of compounds quantitatively. According to Occam’s razor [29,30] principle, the best pharmacophore model should exhibit the highest correlation coefficient, lowest cost value, highest cost difference, and lowest RMS value. Consequently, HypoGen1 consists of HY, RA, PI, and HBD features, was statistically identified as the significant hypothesis, and was chosen to estimate the activities of 24 compounds in the test set (Figure 4). The calculated and experimental activities of all compounds in the training set are shown in Table 4.
Table 3.
Characteristics of ten hypotheses for the training set generated by HypoGen algorithm.
Figure 4.
Pharmacophore mapping of (A) the most active compound 1 and (B) the lowest activity compound 21 on the best hypothesis model HypoGen1. HY, RA, PI, HBD are colored in cyan, blue, red and magenta, respectively.
Table 4.
Experimental and estimated activities of 21 compounds based on HypoGen1 in the training set.
In Figure 4A, Compound 1 was mapped onto PI, HBD, RA, and HY features of HypoGen1 with a fit value of 9.71, while for Compound 21 with the lowest activity values, the matching results are not as satisfactory, thus showcasing the competence of HypoGen1 in selecting the most active compounds upon subjecting it to screen the databases (Figure 4B). Figure 5A illustrates the scatter plot between the experimental and estimated activity values of the compounds in the training set, the correlation coefficient of which was 0.9507. It indicates that the generated pharmacophore model can accurately predict the activity values of the compounds in the training set.
Figure 5.
Scatter diagrams of experimental and predicted activity of compounds in HypoGen1 pharmacophore in (A) Training set, and (B) Test set.
2.2.2. Pharmacophore Model Validation
Cost Analysis
The best hypothesis was selected through cost analysis. According to the results (Table 3), HypoGen1 has the lowest total cost (97.64), closest to the fixed cost (65.47), and far away from the null cost (685.76) in comparison to the other hypotheses. Moreover, HypoGen1 demonstrates the highest correlation value of 0.98 and the lowest RMS value of 1.68. The cost difference is 588.12, much greater than 60 bits difference, indicating a greater than 90% chance of representing a true correlation in the data set used [31]. The above data indicate that HypoGen1 has good predictive capability.
Test Set Validation
HypoGen1 was verified by the test set to check its ability to predict compound activity accurately. A test set consisting of 24 compounds was mapped on HypoGen1, and a scatter plot comparing their experimental and estimated activities was generated (Table S6). As shown in Figure 5B, all test set samples are clustered around y = x, and the correlation coefficient R2 calculated is 0.8531, further confirming the suitability of HypoGen1 for activity prediction.
Fischer’s Randomization Test Analysis
HypoGen1 was validated by Fischer’s randomization test to check the statistical significance, as well as to confirm whether the assumptions generated by the training set are reasonable. The experimental activity data of the compounds in the training set were randomly recombined to provide a “random” data set to create the pharmacophore model by using the same features and parameters as the initial pharmacophore model. Overall, 19 pharmacophore models were randomly generated, and the data line graph is shown in Figure 6. It can be observed that the cost value of HypoGen1 is lower than that of the randomly generated pharmacophore, and HypoGen1 has a higher correlation value compared to the 19 random hypotheses. These results indicate that this constructed pharmacophore model is superior and is not generated by chance at a 95% confidence level.
Figure 6.
A graphical representation of the total cost values (A) and correl values (B) of HypoGen1 and ten hypotheses generated from 19 random spreadsheets during Fischer’s randomization run. A confidence level of 95% was used.
2.2.3. Drug-Likeness Screening
After evaluation, the verified HypoGen1 pharmacophore model was used for filtering LSD1 inhibitors from the databases (2,029,554 compounds). Upon applying the Ligand Pharmacophore Mapping module of DS2017R2, 38,205 compounds were retrieved. LBVS approach was performed through the drug-likeness screening, molecular docking, virtual analysis, and ADMET screening subsequently. The screening protocol is illustrated in Scheme 2. Following Lipinski’s and Veber’s rules, 20,909 compounds were selected for molecular docking studies.
Scheme 2.
The flowchart of ligand-based virtual screening targeted the substrate-binding site of LSD1.
2.2.4. Screening Based on Docking, ADMET and Binding Free Energy
The top-scoring compounds (top 70%) were screened out after docking by AutoDock Vina. They were subsequently processed visualized analysis with the same standards as Selection of Docking Methods, finally obtaining 602 compounds. After ADMET screening, only seven compounds (Table 5) with favorable ADMET properties were retained for further analysis (Table S7).
Table 5.
Compounds obtained after ADMET analysis through LBVS.
Then, 200 ns MD simulations and binding free energy calculations of the complex systems composed of these seven selected compounds and LSD1 were performed to narrow down the region of interest. Compared their average RMSD values with that of sole-LSD1 and LSD1_CC-90011 positive control systems (Figure S2), it was observed that except for Comp6, the interactions of the other six complexes with LSD1 all slightly increase the system stabilities in comparison to the sole-LSD1 (3.45 Å) system (Table S4). The calculated binding free energy results show that the ΔGbind of Comp2, Comp3, Comp4, and Comp7 (−48.51 kcal/mol, −51.06 kcal/mol, −54.26 kcal/mol, and −46.45 kcal/mol) are all more negative than that of CC-90011 (−44.42 kcal/mol) (Table 6). This indicates that these compounds have greater binding affinities with LSD1, and thus can be considered as potential LSD1 inhibitors. Among them, Comp4 has the highest binding free energy. Similarly, the favorable contributions to ΔGbind are the van der Waals.
Table 6.
Calculated MM/PBSA binding free energy of the MD simulations through LBVS.
2.2.5. Binding Modes Analysis
The binding modes of the filtered compounds Comp2, Comp3, Comp4, and Comp7 with LSD1, as well as the positive control CC-90011, were investigated by molecular docking and residue free energy decomposition calculations. Figure 7 illustrates the residues with contribution values more negative than −1 kcal/mol. Structurally, according to the different parent nucleus, these four hit compounds can be classified into two types. One is Comp2, belonging to the amide compound; the other is Comp3, Comp4, and Comp7, all belonging to 1,2,4-triazolo-4,3-α-quinazoline compounds.
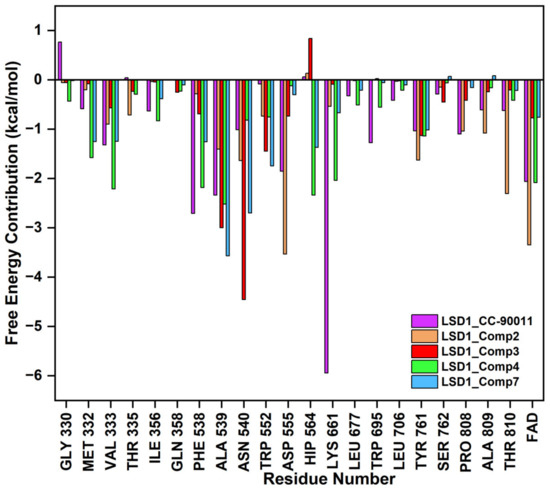
Figure 7.
Residues free energy decomposition calculations for the binding pocket-composed in LSD1_CC-90011, LSD1_Comp2, LSD1_Comp3, LSD1_Comp4, and LSD1_Comp7 complexes.
For Comp2, the electronegative residue Asp555 has an outstanding contribution to the interaction, with a decomposition energy of −3.53 kcal/mol (Table S8). The hydroxyl and nitrogen atoms on the side chain of Asp555 form a relatively strong hydrogen bond with the carboxyl oxygen atom of Comp2, which likely facilitates the binding orientation and helps reduce off-target effects (Figure 8). Except this, residue Thr810, Tyr761, and Ala809 are involved in hydrophobic interaction with Comp2 (Table S9). Additionally, co-factor FAD also has a great contribution to the interaction, with a decomposition energy of −3.35 kcal/mol, which is only slightly lower than the largest contributor Asp555 (Table S8). It was found that FAD plays an essential role in maintaining the stability of Comp2 in the targeted substrate pocket through hydrophobic interactions, accounting for 95.76% of the hydrophobic fraction (Table S9).
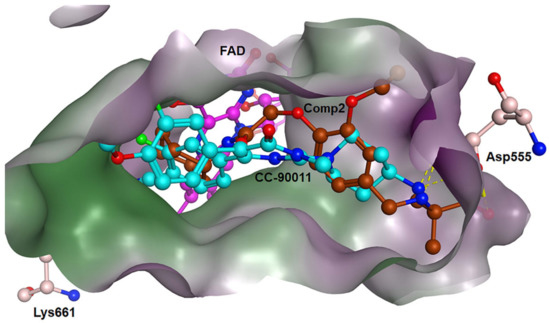
Figure 8.
Binding modes of LSD1 with CC-90011 (blue) and Comp2 (brown).
For the other type, the docking conformations superposition diagram of these three hit compounds in the binding pocket (Figure 9A) reveals that their parent nucleus overlaid well. For Comp3, residue Asn540 and Ala539 give the greatest favorable contributions to their binding (−4.46 kcal/mol and −3.00 kcal/mol), which also opportunely form Pi-H interactions with the benzene ring and 1,2,4-triazole ring of parent nucleus, respectively (Figure 9B). Additionally, hydrogen bond analysis shows that the oxygen atom of Asn540 can also form a hydrogen bond with the nitrogen atom on the amide of Comp3, indicating this bond made the function to orient and tighten the binding affinity to a large certain (Figure 9B).
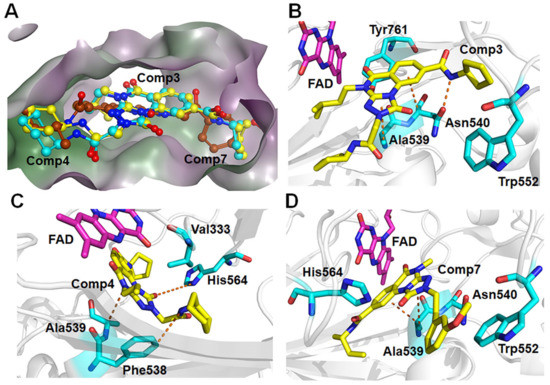
Figure 9.
(A) The aligned conformations of Comp3 (yellow), Comp4 (blue), and Comp7 (brown). Schematic diagram of modes of LSD1 with (B) Comp3, (C) Comp4, and (D) Comp7.
Comp4 exhibits the highest binding affinity with LSD1 among the hit compounds. The contributions of residues are quite average, with no particular residue standing out. There are five residues whose decomposition energies are more negative than −2 kcal/mol, including Ala539, His564, Val333, Phe538, and Lys661. Similar to Comp3, the pyrimidine ring of Comp4 interacts with the main contributor Ala539 through Pi-H interaction, which shows the highest decomposition energy of −2.52 kcal/mol (Figure 9C and Table S8). Furthermore, Phe538, Ala539, and Val333, all of which are hydrophobic residues, contribute to the binding affinity through hydrophobic interactions, with hydrophobic occupancies of 95.62%, 66.41%, and 62.74%, respectively (Table S9). The electropositive residue His564 forms hydrogen bonds with Comp4 through its nitrogen atoms on the ring, with a decomposition energy of −2.34 kcal/mol (Figure 9C and Table S8). Comp4 additionally forms hydrophobic interactions with FAD, with a decomposition energy of −2.08 kcal/mol, implying the essential role of FAD in stabilizing Comp4 and reducing off-target effects (Table S8).
Regarding Comp7, it has the least and relatively weaker residue contributors overall. Among the contributors, Ala539 and Asn540 contribute the most (−3.57 kcal/mol and −2.70 kcal/mol). Specifically, Ala539 forms Pi-H interactions with the benzene ring and 1,2,4-triazole ring of Comp7, respectively (Figure 9D). It also has less hydrophobic interaction with FAD compared to CC-90011. This may explain why Comp7 has the lowest ∆Gbind among the three hit compounds. Therefore, the differences in binding affinity mainly originate from the branched functional groups.
3. Materials and Methods
3.1. Database Preparation
Commercial databases derived from Taosu biochemical company, including Chemdiv, Maybridge, Lifechemical, Bionet, Specs, and Enamine, were selected for both SBVS and LBVS, with a total of 2,029,554 small molecules. The Wash module of MOE2020 (Chemical Computing Group Inc., Montreal, QC, Canada) software was utilized to optimize all small compounds, including adding hydrogen atoms, 3D structure conversion, and AM1-BCC charge fitting using the Amber10:EHT force field. Lipinski’sand Veber’s rules [32,33] were used to filter out drug-likeness molecules.
3.2. Structure-Based Virtual Screening (SBVS)
3.2.1. The Binding Site of LSD1 Receptor
The LSD1 receptor structure was obtained from the co-crystal structure of LSD1 with CC-90011 (PDB ID: 6W4K) [26] in the RCSB protein data bank (https://www.rcsb.org/ 1 March 2021). The LSD1 protein was pre-processed through residue correction, adding hydrogen at pH 7.0, and charge fitting by both Schrödinger software [34] and AutoDock Tools software [35] (ADT, version 1.5.6). As reported [26], the active substrate-binding pocket of LSD1 is located on the surface of the AOL structure domain, comprising 22 residues, including Gly330, Met332, Val333, Thr335, Ile356, Gln358, Phe538, Ala539, Asn540, Trp552, Asp555, His564, Lys661, Leu659, Leu677, Trp695, Leu706, Tyr761, Ser762, Pro808, Ala809, and Thr810.
3.2.2. Molecular Docking Study in SBVS
A multi-stage and progressive approach was adopted for the SBVS of LSD1 inhibitors, which consists of three screening rounds completed jointly by Schrödinger and AutoDock Vina. The first two rounds employ high-throughput virtual screening (HTVS) and standard precision (SP) modules in Schrödinger software. In the first screening round, known for its relatively low discrimination and time-saving character, the HTVS method can quickly confirm whether small molecules can enter the active site of protein or not, filtering out compounds with poor matching degree and low affinity. Only the top-scoring compounds (top 50%) were retained. In the second screening round, the SP method (GlideScore function) was applied to re-dock these retained compounds to the docking site, and the top-scoring compounds (top 30%) were subsequently selected. The LigPrep module was used in both screening rounds mainly to generate all tautomers of small molecules, and the Receptor grid generation module was used to generate grid points. A docking box was then generated at the primordial ligand site of the protein, and molecular docking was performed using the Glide docking module under default parameters. In the third screening round, the extra precision (XP) docking module of Schrödinger with EmodelSore function and the semi-flexible docking method in Autodock Vina with Vina scoring function were adopted, respectively. In Autodock Vina, the docking box size was set as 15 Å × 15 Å × 15 Å, and the exhaustiveness was set to 24. Finally, the top-scoring compounds (top 10%) were selected, and their intersection was taken, considering the scoring function and matching degree with the active pocket.
3.3. Ligand-Based Virtual Screening
3.3.1. Training Set and Test Set Preparation
In order to establish a reliable ligand-based pharmacophore model, 45 reported LSD1 inhibitors [19,21,22,23,24,26,36,37,38,39,40,41] targeting the substrate-binding pocket were selected based on the following protocol. These selected inhibitors with similar activity values were required to maintain structural diversity, and their activities should span at least four orders of magnitude. Among them, 21 diverse compounds (Table S1) were selected as the training set, and the remaining 24 compounds (Table S2) were classified into the test set for validating the pharmacophore model. The IC50 values of the compound in the training and the test set ranged from 0.25 nM to 16,000 nM and from 0.70 nM to 33,900 nM, respectively. Structural energy minimization was performed using the CHARMM [42] force field to obtain the dominant conformations. These prepared compounds were used for pharmacophore generation and validation by DS2017R2 software (Accelrys Software Inc., San Diego, CA, USA).
3.3.2. Pharmacophore Model Generation
Utilizing the Catalyst HypoGen algorithm, a set of ligands with known activity values was used to derive corresponding hypothesis models [43]. This algorithm is devoted to finding common hypotheses among the active compounds in the training set, constructing a pharmacophore model that correlates best with the measured activities while using as few features as possible [44]. In order to effectively correlate the training set with their activities, the uncertain value was set to 1.5. The conformation generation method was set to Fast with an energy threshold of 10 kcal/mol, and each molecule generated a maximum of 255 diverse conformations. In this algorithm, all conformational models were used for each compound in the training set, not just the lowest energy conformation. Then, five features, namely hydrophobic (HY), ring aromatic (RA), positive ionizable center (PI), hydrogen bond acceptor (HBA), and hydrogen bond donor (HBD), were selected to generate feature mappings. Considering the spatial effects of compounds, the maximum excluded volume was set, and the minimum interfeature distance was set to 1.5. Finally, 10 pharmacophore models with significant statistical parameters were generated.
3.3.3. Pharmacophore Model Validation
After generating the pharmacophore from the training set, three methods were adopted to validate its accuracy, including cost analysis, test set validation, and Fischer’s randomization test.
Cost Analysis
A cost analysis was performed to evaluate the complexity, chemical characteristics, and errors of the generated pharmacophore model compared to the experimental activity. In the standard HypoGen model, the configuration should not exceed 17. The total cost, fixed cost, and null cost represent the actual cost of the pharmacophore, the cost of a perfect pharmacophore, and the cost of the worst possible pharmacophore, respectively. The difference between total cost and null cost should be maximized. A difference greater than 60 bits suggests a true correlation in the used data set exceeding 90% [31]. The total cost of any hypothesis should be close to the fixed cost and away from the null cost. Meanwhile, the root mean squared (RMS) represents the correlation (Correl) quality between the estimated and actual activity. So, high-quality models should have the highest activity value correlation coefficient and the lowest RMS value [45].
Test Set Validation
This hypothesis aimed to identify the active structures and predict the activities of molecules. To validate the capability of the pharmacophore hypothesis, 24 compounds with different structures in the test set were applied, and their activities were predicted. The model was evaluated according to the correlation coefficient q2 of the linear regression used to calculate log (activities) values. All queries were performed using the Ligand Pharmacophore Profiler protocol in DS2017R2 as well.
Fischer’s Randomization Test
Fischer’s randomization test method was applied to assess the statistical significance of the best hypotheses by confirming the strong correlation between chemical structures and biological activities. In this technique, the activity value was randomly assigned to the compounds in the training set on the premise of a confidence level set at 95%. Then, 19 randomized training sets were generated and utilized to create 19 random pharmacophores by HypoGen algorithm using identical features and parameters. If these pharmacophores showed similar or superior statistics, the original hypothesis was deemed not to be generated by chance [46,47].
3.4. Molecular Docking Study in LBVS
Molecular dockings between LSD1 and the compounds that passed pharmacophore matching and satisfied Lipinski’s and Veber’s rules were performed using AutoDock Vina program. The main parameters used here were identical to those used in the SBVS module.
3.5. ADMET Screening
ADMET screening was assessed using DS2017R2 software and ADMETlab2.0 server [48] for SBVS and LBVS, respectively, to reduce drug development costs. The primary descriptors for ADMET prediction in SBVS included aqueous solubility, blood–brain barrier penetration (BBB), human intestinal absorption (HIA), ames mutagenicity (AMES), weight-of-evidence rodent, and carcinogenicity (WOE). In LBVS, the chosen parameters included BBB, HIA, Caco-2 permeability, madin−darby canine kidney (MDCK) permeability, plasma protein binding (PPB), hERG, AMES, human hepatotoxicity (H-HT), and rat oral acute toxicity (ROA). Finally, the Pan Assay Interference Compounds (PAINS) [49] filter was applied in ADMETlab2.0 to eliminate false-positive molecules.
3.6. Molecular Dynamics Simulations
Taking the best-docked receptor-ligand complexes as the initial structure models, all MD simulations were performed using the GPU-accelerated version of the PMEMD [50,51] module in Amber18 packages [52]. All hit compounds were firstly optimized at B3LYP/6-31G (d, p) level using Gaussian16 [53]. The general AMBER force field (GAFF2) [54] and the AMBER ff14SB [55] force field were applied to the hit compounds and protein, respectively. Four chloride counterions were added to each system to maintain the electro-neutrality. All studied systems were immersed in a TIP3P [56] water box, with a minimum distance of 12 Å between the box edges and any protein/substrate atom.
The initial models were minimized using a combination of 80,000 steps of steepest descent and 20,000 steps of conjugate gradients methods. Subsequently, the system was gradually heated from 10 K to 300 K using Langevin dynamics [57,58] with a collision frequency of 5.0 ps−1. Then, the system was equilibrated for 10 ns in the NPT ensemble at 300 K and 1 bar. Anisotropic pressure regulation was performed using the Berendsen barostat with a pressure relaxation time of 2.0 ps. Finally, 175 ns and 200 ns production MD simulations were performed for SBVS and LBVS, respectively. Periodic boundary conditions were employed, and the long-range electrostatic interactions were described using the particle mesh Ewald method (PME) [59]. A cut-off radius of 8 Å was used for evaluating short-range interactions. The SHAKE algorithm [60] was used to constrain chemical bonds containing H atoms, with a constraint constant of 10−6 and a time step of 2 fs. The equilibrated portion of the trajectories was analyzed using AmberTools CPPTRAJ program [61].
3.7. Binding Free Energy Calculations
Considering a good balance between computational efficiency and accuracy, the MM/PBSA method was finally chosen to calculate protein–ligand binding free energy through the MMPBSA.py [62] script of Amber18 package. First, 5000 snapshots extracted from the last 50 ns trajectories at a 20 ps interval were used to calculate the binding free energy. The ionic strength was set to 0.15 M, and the external and internal dielectric constants were set to 80 and 4, respectively.
The binding free energy (∆Gbind) was computed by the following equation, where ∆Gcomplex, ∆Greceptor, and ∆Gligand were the free energies of the complex, receptor, and ligand, respectively.
ΔGbind = ΔH − TΔS = ΔEMM + ΔGsolv − TΔS
ΔEMM = ΔEele + ΔEvdw + ΔEint
ΔGsolv = ΔGPB + ΔGnonp
Here, −T∆S represented entropy contribution. Since entropic calculation is time-consuming, and its value will fluctuate if a small number of snapshots are adopted, it was omitted in this study [63]. ∆Egas is gas phase molecular mechanical energy, and ∆Gsolv is solvation free energy. ∆Eint, ∆Evdw, and ∆Eele are the internal energy, van der Waals interaction energy, and electrostatic energy, respectively. The total value of ∆Eint accounting for bond, angle, and dihedral energies was set to zero. The ∆Gsolv was calculated as the sum of the polar contribution (∆GPB) to the solvation free energy calculated by the Poisson–Boltzmann (PB) model and non-polar contribution (∆Gnonp) derived from a linear relation to the solvent-accessible surface area (SASA).
ΔGnonp = γ SASA + β
The empirical constants γ and β were set as 0.00542 kcal/mol/Å2 and 0.92 kcal/mol, respectively. The SASA was determined by a probe radius of 1.4 Å. To further explore the detailed interaction information of complex, residue free energy decomposition was performed by the MM/PBSA method to identify the key residues responsible for binding free energy. The contribution of each residue was calculated without considering the contribution of entropies. The contribution was defined as the sum of ∆Evdw, ∆Eele, ∆GPB, and ∆Gnonp:
∆Gresidue = ∆Evdw + ∆Eele + ∆GPB + ∆Gnonp
4. Conclusions
LSD1 plays an important role in the occurrence and development of various tumors and has recently become a new molecular target for tumor prevention and treatment. Thus, designing high-efficiency and low-toxicity LSD1 inhibitors with novel structures started to cause more and more interest of pharmaceutical chemists. In this work, we systematically searched for reversible LSD1 inhibitors that targeted the substrate-binding pocket using computer-aided drug design technology. Mainly, structure-based and ligand-based virtual screenings were employed to further identify potential novel structures using molecular docking and pharmacophore model strategies, respectively. Through drug-likeness evaluation, ADMET screening, MD simulations, and binding free energy-based screening, one and four hit compounds were finally screened out from the databases (2,029,554 compounds). The hit compound Lig2 obtained through SBVS belongs to amide, while the four compounds obtained through LBVS can be divided into two groups according to the parent nucleus. One belongs to the amide compound (Comp2), and the other is 1,2,4-triazolo-4,3-α-quinazoline (Comp3, Comp4, Comp7). Among them, Comp4 exhibits the strongest binding affinity. Finally, the binding mechanisms of these hit compounds were further calculated in detail by residue free energy decomposition. It is indicated that van der Waals force is the largest contributor to the binding affinity contribution of all hit compounds to LSD1, and FAD is also helpful in stabilizing the binding and avoiding off-target effects. In future, it would be feasible to perform further structure optimizations based on these novel hit compounds to improve the bioactivity continuously. Our work expands the diversity of parent nucleus of LSD1 substrate reversible inhibitors and provides a solid theoretical foundation for the design and further optimization of synthetic chemists.
Supplementary Materials
The following supporting information can be downloaded at: https://www.mdpi.com/article/10.3390/molecules28145315/s1, Figure S1: (A) RMSD and (B) RMSF results during the molecular dynamics simulations of sole-LSD1, LSD1_CC-90011, LSD1_Lig1, LSD1_Lig2, LSD1_Lig3, LSD1_Lig4, LSD1_Lig5 and LSD1_Lig6 systems through SBVS; Figure S2: (A) RMSD and (B) RMSF results during the molecular dynamics simulations of sole-LSD1, LSD1_CC-90011, LSD1_Comp1, LSD1_Comp2, LSD1_Comp3, LSD1_Comp4, LSD1_Comp5, LSD1_Comp6 and LSD1_Comp7 systems through LBVS; Table S1: The smile formats and experimental IC50 values of 21 compounds in the training set; Table S2: The smile formats and experimental IC50 values of 24 compounds in the test set. Table S3: The drug-likeness and ADMET properties of compounds screened after visualized analysis through SBVS; Table S4: Calculated RMSD values of complexes in the MD simulations through SBVS and LBVS; Table S5: Free energy decomposition calculations for the binding pocket-composed residues in LSD1_CC-90011 and LSD1_Lig2 complexes through SBVS; Table S6: Experimental and estimated activities of 24 compounds based on HypoGen1 in the test set; Table S7: The drug-likeness and ADMET properties of compounds screened after ADMET analysis through LBVS; Table S8: Free energy decomposition calculations for the binding pocket-composed residues in LSD1_Comp2, LSD1_Comp3, LSD1_Comp4 and LSD1_Comp7 complexes through LBVS; Table S9: Hydrophobic interaction analysis in LSD1_Comp2 and LSD1_Comp4 complexes through LBVS.
Author Contributions
L.Y. designed a complete research circuit and supervised the whole project execution. J.D. guided part of virtual screening works, and H.L. provided the virtual screening platform. Z.Y. performed the entire works and wrote the manuscript. S.L. and M.C. assisted in drawing the figures and analyzed part of the data. X.Y. proofread the manuscript. All authors have read and agreed to the published version of the manuscript.
Funding
This research was funded by the Key Scientific and Technological Projects of Henan Province (No. 232102311174), the National Natural Science Foundation of China (No. 21803058 and No. 82020108030) and the Postdoctoral Research Grant in Henan Province (No. 1902002). We sincerely thank the National Supercomputing Center in Zhengzhou for providing partial computing resources.
Institutional Review Board Statement
Not applicable.
Informed Consent Statement
Not applicable.
Data Availability Statement
Suggested Data Availability Statements are available in section “MDPI Research Data Policies” at https://github.com/bigsmartguy/LSD1-Yang (accessed on 3 April 2023).
Conflicts of Interest
The authors declare that there is no conflict of interest.
Sample Availability
Samples of the compounds are not available from the authors.
References
- Shi, Y.; Lan, F.; Matson, C.; Mulligan, P.; Whetstine, J.R.; Cole, P.A.; Casero, R.A.; Shi, Y. Histone demethylation mediated by the nuclear amine oxidase homolog LSD1. Cell 2004, 119, 941–953. [Google Scholar] [CrossRef] [PubMed]
- Lokken, A.A.; Zeleznik-Le, N.J. Breaking the LSD1/KDM1A addiction: Therapeutic targeting of the epigenetic modifier in AML. Cancer Cell 2012, 21, 451–453. [Google Scholar] [CrossRef] [PubMed]
- Magerl, C.; Ellinger, J.; Braunschweig, T.; Kremmer, E.; Koch, L.K.; Holler, T.; Buttner, R.; Luscher, B.; Gutgemann, I. H3K4 dimethylation in hepatocellular carcinoma is rare compared with other hepatobiliary and gastrointestinal carcinomas and correlates with expression of the methylase Ash2 and the demethylase LSD1. Hum. Pathol. 2010, 41, 181–189. [Google Scholar] [CrossRef] [PubMed]
- Schulte, J.H.; Lim, S.; Schramm, A.; Friedrichs, N.; Koster, J.; Versteeg, R.; Ora, I.; Pajtler, K.; Klein-Hitpass, L.; Kuhfittig-Kulle, S.; et al. Lysine-specific demethylase 1 is strongly expressed in poorly differentiated neuroblastoma: Implications for therapy. Cancer Res. 2009, 69, 2065–2071. [Google Scholar] [CrossRef]
- Wang, Y.; Zhang, H.; Chen, Y.; Sun, Y.; Yang, F.; Yu, W.; Liang, J.; Sun, L.; Yang, X.; Shi, L.; et al. LSD1 is a subunit of the NuRD complex and targets the metastasis programs in breast cancer. Cell 2009, 138, 660–672. [Google Scholar] [CrossRef]
- Zheng, Y.C.; Ma, J.; Wang, Z.; Li, J.; Jiang, B.; Zhou, W.; Shi, X.; Wang, X.; Zhao, W.; Liu, H.M. A systematic review of histone Lysine-specific demethylase 1 and its inhibitors. Med. Res. Rev. 2015, 35, 1032–1071. [Google Scholar] [CrossRef]
- Aravind, L.; Iyer, L.M. The SWIRM domain: A conserved module found in chromosomal proteins points to novel chromatin-modifying activities. Genome Biol. 2002, 3, research0039. [Google Scholar] [CrossRef]
- Maiques-Diaz, A.; Somervaille, T.C. LSD1: Biologic roles and therapeutic targeting. Epigenomics 2016, 8, 1103–1116. [Google Scholar] [CrossRef]
- Anand, R.; Marmorstein, R. Structure and mechanism of lysine-specific demethylase enzymes. J. Biol. Chem. 2007, 282, 35425–35429. [Google Scholar] [CrossRef]
- Song, Y.H.; Zhang, H.Q.; Yang, X.K.; Shi, Y.T.; Yu, B. Annual review of lysine-specific demethylase 1 (LSD1/KDM1A) inhibitors in 2021. Eur. J. Med. Chem. 2022, 228, 114042. [Google Scholar] [CrossRef]
- Maes, T.; Mascaro, C.; Tirapu, I.; Estiarte, A.; Ciceri, F.; Lunardi, S.; Guibourt, N.; Perdones, A.; Lufino, M.M.P.; Somervaille, T.C.P.; et al. ORY-1001, a potent and selective covalent KDM1A inhibitor, for the treatment of acute leukemia. Cancer Cell 2018, 33, 495–511 e12. [Google Scholar] [CrossRef] [PubMed]
- Mohammad, H.; Smitheman, K.; Van Aller, G.; Cusan, M.; Kamat, S.; Liu, Y.; Johnson, N.; Hann, C.; Armstrong, S.; Kruger, R. 212 Novel anti-tumor activity of targeted LSD1 inhibition by GSK2879552. Eur. J. Cancer 2014, 50, 72. [Google Scholar] [CrossRef]
- Mohammad, H.P.; Smitheman, K.N.; Kamat, C.D.; Soong, D.; Federowicz, K.E.; Van Aller, G.S.; Schneck, J.L.; Carson, J.D.; Liu, Y.; Butticello, M.; et al. A DNA hypomethylation signature predicts antitumor activity of LSD1 inhibitors in SCLC. Cancer Cell 2015, 28, 57–69. [Google Scholar] [CrossRef] [PubMed]
- Wen, L.; Chen, Y.; Zeng, L.L.; Zhao, F.; Li, R.; Liu, Y.; Zhang, C. Triptolide induces cell-cycle arrest and apoptosis of human multiple myeloma cells in vitro via altering expression of histone demethylase LSD1 and JMJD2B. Acta Pharmacol. Sin. 2012, 33, 109–119. [Google Scholar] [CrossRef] [PubMed]
- Ota, Y.; Itoh, Y.; Kaise, A.; Ohta, K.; Endo, Y.; Masuda, M.; Sowa, Y.; Sakai, T.; Suzuki, T. Targeting cancer with PCPA-Drug conjugates: LSD1 inhibition-triggered release of 4-hydroxytamoxifen. Angew. Chem. Int. Ed. Engl. 2016, 55, 16115–16118. [Google Scholar] [CrossRef]
- Wang, M.; Liu, X.; Jiang, G.; Chen, H.; Guo, J.; Weng, X. Relationship between LSD1 expression and E-cadherin expression in prostate cancer. Int. Urol. Nephrol. 2015, 47, 485–490. [Google Scholar] [CrossRef]
- Wu, F.; Zhou, C.; Yao, Y.; Wei, L.; Feng, Z.; Deng, L.; Song, Y. 3-(Piperidin-4-ylmethoxy)pyridine containing compounds are potent inhibitors of lysine specific demethylase 1. J. Med. Chem. 2016, 59, 253–263. [Google Scholar] [CrossRef]
- Ma, L.; Wang, H.; You, Y.; Ma, C.; Liu, Y.; Yang, F.; Zheng, Y.; Liu, H. Exploration of 5-cyano-6-phenylpyrimidin derivatives containing an 1,2,3-triazole moiety as potent FAD-based LSD1 inhibitors. Acta Pharm. Sin. B 2020, 10, 1658–1668. [Google Scholar] [CrossRef]
- Mould, D.P.; Alli, C.; Bremberg, U.; Cartic, S.; Jordan, A.M.; Geitmann, M.; Maiques-Diaz, A.; McGonagle, A.E.; Somervaille, T.C.P.; Spencer, G.J.; et al. Development of (4-Cyanophenyl)glycine derivatives as reversible inhibitors of lysine specific demethylase 1. J. Med. Chem. 2017, 60, 7984–7999. [Google Scholar] [CrossRef]
- Niwa, H.; Sato, S.; Hashimoto, T.; Matsuno, K.; Umehara, T. Crystal structure of LSD1 in complex with 4-[5-(Piperidin-4-ylmethoxy)-2-(p-tolyl)pyridin-3-yl]benzonitrile. Molecules 2018, 23, 1538. [Google Scholar] [CrossRef]
- Kutz, C.J.; Holshouser, S.L.; Marrow, E.A.; Woster, P.M. 3,5-Diamino-1,2,4-triazoles as a novel scaffold for potent, reversible LSD1 (KDM1A) inhibitors. Medchemcomm 2014, 5, 1863–1870. [Google Scholar] [CrossRef] [PubMed]
- Mould, D.P.; Bremberg, U.; Jordan, A.M.; Geitmann, M.; Maiques-Diaz, A.; McGonagle, A.E.; Small, H.F.; Somervaille, T.C.P.; Ogilvie, D. Development of 5-hydroxypyrazole derivatives as reversible inhibitors of lysine specific demethylase 1. Bioorg. Med. Chem. Lett. 2017, 27, 3190–3195. [Google Scholar] [CrossRef] [PubMed]
- Mould, D.P.; Bremberg, U.; Jordan, A.M.; Geitmann, M.; McGonagle, A.E.; Somervaille, T.C.P.; Spencer, G.J.; Ogilvie, D.J. Development and evaluation of 4-(pyrrolidin-3-yl)benzonitrile derivatives as inhibitors of lysine specific demethylase 1. Bioorg. Med. Chem. Lett. 2017, 27, 4755–4759. [Google Scholar] [CrossRef] [PubMed]
- Soldi, R.; Ghosh Halder, T.; Weston, A.; Thode, T.; Drenner, K.; Lewis, R.; Kaadige, M.R.; Srivastava, S.; Daniel Ampanattu, S.; Rodriguez Del Villar, R.; et al. The novel reversible LSD1 inhibitor SP-2577 promotes anti-tumor immunity in SWItch/Sucrose-NonFermentable(SWI/SNF) complex mutated ovarian cancer. PLoS ONE 2020, 15, e0235705. [Google Scholar] [CrossRef]
- Sorna, V.; Theisen, E.R.; Stephens, B.; Warner, S.L.; Bearss, D.J.; Vankayalapati, H.; Sharma, S. High-throughput virtual screening identifies novel N’-(1-phenylethylidene)-benzohydrazides as potent, specific, and reversible LSD1 inhibitors. J. Med. Chem. 2013, 56, 9496–9508. [Google Scholar] [CrossRef]
- Kanouni, T.; Severin, C.; Cho, R.W.; Yuen, N.Y.; Xu, J.; Shi, L.; Lai, C.; Del Rosario, J.R.; Stansfield, R.K.; Lawton, L.N.; et al. Discovery of CC-90011: A potent and selective reversible inhibitor of lysine specific demethylase 1 (LSD1). J. Med. Chem. 2020, 63, 14522–14529. [Google Scholar] [CrossRef]
- Baron, R.; Vellore, N.A. LSD1/CoREST reversible opening-closing dynamics: Discovery of a nanoscale clamp for chromatin and protein binding. Biochemistry 2012, 51, 3151–3153. [Google Scholar] [CrossRef]
- Zhou, C.; Kang, D.; Xu, Y.; Zhang, L.; Zha, X. Identification of novel selective lysine-specific demethylase 1 (LSD1) inhibitors using a pharmacophore-based virtual screening combined with docking. Chem. Biol. Drug Des. 2015, 85, 659–671. [Google Scholar] [CrossRef]
- Debnath, A.K. Pharmacophore mapping of a series of 2,4-Diamino-5-deazapteridine inhibitors of mycobacterium avium complex dihydrofolate reductase. J. Med. Chem. 2002, 45, 41–53. [Google Scholar] [CrossRef]
- Debnath, A.K. Generation of predictive pharmacophore models for CCR5 antagonists: Study with piperidine- and piperazine-based compounds as a new class of HIV-1 entry inhibitors. J. Med. Chem. 2004, 47, 768. [Google Scholar] [CrossRef]
- Sakkiah, S.; Thangapandian, S.; John, S.; Kwon, Y.J.; Lee, K.W. 3D QSAR pharmacophore based virtual screening and molecular docking for identification of potential HSP90 inhibitors. Eur. J. Med. Chem. 2010, 45, 2132–2140. [Google Scholar] [CrossRef] [PubMed]
- Lipinski, C.A. Lead- and drug-like compounds: The rule-of-five revolution. Drug Discov. Today Technol. 2004, 1, 337–341. [Google Scholar] [CrossRef] [PubMed]
- Veber, D.F.; Johnson, S.R.; Cheng, H.-Y.; Smith, B.R.; Ward, K.W.; Kopple, K.D. Molecular properties that influence the oral bioavailability of drug candidates. J. Med. Chem. 2002, 45, 2615–2623. [Google Scholar] [CrossRef] [PubMed]
- Fowler, L.R.; Morain, S.R. Schrödinger’s App. Am. J. Law. Med. 2020, 46, 203–218. [Google Scholar] [CrossRef]
- Morris, G.M.; Huey, R.; Lindstrom, W.; Sanner, M.F.; Belew, R.K.; Goodsell, D.S.; Olson, A.J. AutoDock4 and AutoDockTools4: Automated docking with selective receptor flexibility. J. Comput. Chem. 2009, 30, 2785–2791. [Google Scholar] [CrossRef] [PubMed]
- Duan, Y.C.; Guan, Y.Y.; Zhai, X.Y.; Ding, L.N.; Qin, W.P.; Shen, D.D.; Liu, X.Q.; Sun, X.D.; Zheng, Y.C.; Liu, H.M. Discovery of resveratrol derivatives as novel LSD1 inhibitors: Design, synthesis and their biological evaluation. Eur. J. Med. Chem. 2017, 126, 246–258. [Google Scholar] [CrossRef]
- Li, Y.; Sun, Y.; Zhou, Y.; Li, X.; Zhang, H.; Zhang, G. Discovery of orally active chalcones as histone lysine specific demethylase 1 inhibitors for the treatment of leukaemia. J. Enzyme Inhib. Med. Chem. 2021, 36, 207–217. [Google Scholar] [CrossRef]
- Li, Z.R.; Wang, S.; Yang, L.; Yuan, X.H.; Suo, F.Z.; Yu, B.; Liu, H.M. Experience-based discovery (EBD) of aryl hydrazines as new scaffolds for the development of LSD1/KDM1A inhibitors. Eur. J. Med. Chem. 2019, 166, 432–444. [Google Scholar] [CrossRef]
- Romussi, A.; Cappa, A.; Vianello, P.; Brambillasca, S.; Cera, M.R.; Dal Zuffo, R.; Faga, G.; Fattori, R.; Moretti, L.; Trifiro, P.; et al. Discovery of reversible inhibitors of KDM1A efficacious in acute myeloid leukemia models. ACS Med. Chem. Lett. 2020, 11, 754–759. [Google Scholar] [CrossRef]
- Sartori, L.; Mercurio, C.; Amigoni, F.; Cappa, A.; Faga, G.; Fattori, R.; Legnaghi, E.; Ciossani, G.; Mattevi, A.; Meroni, G.; et al. Thieno[3,2-b]pyrrole-5-carboxamides as new reversible inhibitors of histone lysine demethylase KDM1A/LSD1. Part 1: High-throughput screening and preliminary exploration. J. Med. Chem. 2017, 60, 1673–1692. [Google Scholar] [CrossRef]
- Vianello, P.; Sartori, L.; Amigoni, F.; Cappa, A.; Faga, G.; Fattori, R.; Legnaghi, E.; Ciossani, G.; Mattevi, A.; Meroni, G.; et al. Thieno[3,2-b]pyrrole-5-carboxamides as new reversible inhibitors of histone lysine demethylase KDM1A/LSD1. Part 2: Structure-based drug design and structure-activity relationship. J. Med. Chem. 2017, 60, 1693–1715. [Google Scholar] [CrossRef]
- Huang, J.; Rauscher, S.; Nawrocki, G.; Ran, T.; Feig, M.; De Groot, B.L.; Grubmuller, H.; MacKerell, A.D., Jr. CHARMM36m: An improved force field for folded and intrinsically disordered proteins. Nat. Methods 2017, 14, 71–73. [Google Scholar] [CrossRef] [PubMed]
- Schuster, D.; Laggner, C.; Steindl, T.M.; Palusczak, A.; Hartmann, R.W.; Langer, T. Pharmacophore modeling and in silico screening for new P450 19 (aromatase) inhibitors. J. Chem. Inf. Model. 2006, 46, 1301–1311. [Google Scholar] [CrossRef] [PubMed]
- Kurogi1, Y.; Güner, O.F. Pharmacophore modeling and three-dimensional database searching for drug design using catalyst. Curr. Med. Chem. 2001, 8, 1035–1055. [Google Scholar] [CrossRef]
- Paliwal, S.; Pal, M.; Yadav, D.; Singh, S.; Yadav, R. Ligand-based drug design studies using predictive pharmacophore model generation on 4H-1,2,4-triazoles as AT1 receptor antagonists. Med. Chem. Res. 2011, 21, 2307–2315. [Google Scholar] [CrossRef]
- Tromelin, A.; Guichard, E. Use of catalyst in a 3D-QSAR study of the interactions between flavor compounds and β-Lactoglobulin. J. Agric. Food Chem. 2003, 51, 1977–1983. [Google Scholar] [CrossRef]
- Chopra, M.; Gupta, R.; Gupta, S.; Saluja, D. Molecular modeling study on chemically diverse series of cyclooxygenase-2 selective inhibitors: Generation of predictive pharmacophore model using catalyst. J. Mol. Model. 2008, 14, 1087–1099. [Google Scholar] [CrossRef] [PubMed]
- Xiong, G.; Wu, Z.; Yi, J.; Fu, L.; Yang, Z.; Hsieh, C.; Yin, M.; Zeng, X.; Wu, C.; Lu, A.; et al. ADMETlab 2.0: An integrated online platform for accurate and comprehensive predictions of ADMET properties. Nucleic Acids Res. 2021, 49, W5–W14. [Google Scholar] [CrossRef] [PubMed]
- Baell, J.B.; Holloway, G.A. New substructure filters for removal of pan assay interference compounds (PAINS) from screening libraries and for their exclusion in bioassays. J. Med. Chem. 2010, 53, 2719–2740. [Google Scholar] [CrossRef]
- Gotz, A.W.; Williamson, M.J.; Xu, D.; Poole, D.; Le Grand, S.; Walker, R.C. Routine microsecond molecular dynamics simulations with AMBER on GPUs. 1. Generalized Born. J. Chem. Theory Comput. 2012, 8, 1542–1555. [Google Scholar] [CrossRef]
- Salomon-Ferrer, R.; Gotz, A.W.; Poole, D.; Le Grand, S.; Walker, R.C. Routine microsecond molecular dynamics simulations with AMBER on GPUs. 2. explicit solvent Particle Mesh Ewald. J. Chem. Theory Comput. 2013, 9, 3878–3888. [Google Scholar] [CrossRef]
- Pearlman, D.A.; Case, D.A.; Caldwell, J.W.; Ross, W.S.; Cheatham, T.E., III; DeBolt, S.; Ferguson, D.; Seibel, G.; Kollman, P. AMBER, a package of computer programs for applying molecular mechanics, normal mode analysis, molecular dynamics and free energy calculations to simulate the structural and energetic properties of molecules. Comput. Phys. Commun. 1995, 91, 1–41. [Google Scholar] [CrossRef]
- Frisch, M.J.; Trucks, G.W.; Schlegel, H.B.; Scuseria, G.E.; Robb, M.A.; Cheeseman, J.R.; Scalmani, G.; Barone, V.; Petersson, G.A.; Nakatsuji, H.; et al. Gaussian 16, Revision A.03; Gaussian, Inc.: Wallingford, CT, USA, 2016.
- Sprenger, K.G.; Jaeger, V.W.; Pfaendtner, J. The general AMBER force field (GAFF) can accurately predict thermodynamic and transport properties of many ionic liquids. J. Phys. Chem. B 2015, 119, 5882–5895. [Google Scholar] [CrossRef]
- Maier, J.A. ff14SB: Improving the accuracy of protein side chain and backbone parameters from ff99SB. J. Chem. Theory Comput. 2015, 11, 3696–3713. [Google Scholar] [CrossRef]
- Jorgensen, W.L.; Chandrasekhar, J.; Madura, J.D.; Impey, R.W.; Klein, M.L. Comparison of simple potential functions for simulating liquid water. J. Chem. Phys. 1983, 79, 926–935. [Google Scholar] [CrossRef]
- Loncharich, R.J. Langevin Dynamics of peptides: The frictional dependence of lsomerization rates of N-Acetylalanyl-WMethylamide. Biopolymers 1992, 32, 523–535. [Google Scholar] [CrossRef] [PubMed]
- Izaguirre, J.A.; Catarello, D.P.; Wozniak, J.M.; Skeel, R.D. Langevin stabilization of molecular dynamics. J. Chem. Phys. 2001, 114, 2090–2098. [Google Scholar] [CrossRef]
- Harvey, M.J. An implementation of the smooth Particle Mesh Ewald method on GPU hardware. J. Chem. Theory Comput. 2009, 5, 2371–2377. [Google Scholar] [CrossRef] [PubMed]
- Ryckaert, J.P. Numerical integration of the cartesian equations of motion of a system with constraints: Molecular dynamics of n-Alkanes. J. Comput. Phys. 1977, 23, 321–341. [Google Scholar] [CrossRef]
- Roe, D.R.; Cheatham, T.E. PTRAJ and CPPTRAJ: Software for processing and analysis of molecular dynamics trajectory data. J. Chem. Theory Comput. 2013, 9, 3084–3095. [Google Scholar] [CrossRef]
- Miller, B.R.; McGee, T.D., Jr.; Swails, J.M.; Homeyer, N.; Gohlke, H.; Roitberg, A.E. MMPBSA.py: An efficient program for end-state free energy calculations. J. Chem. Theory Comput. 2012, 8, 3314–3321. [Google Scholar] [CrossRef] [PubMed]
- Adcock, S.A.; McCammon, J.A. Molecular dynamics: Survey of methods for simulating the activity of proteins. Chem. Rev. 2006, 106, 1589–1615. [Google Scholar] [CrossRef] [PubMed]


Disclaimer/Publisher’s Note: The statements, opinions and data contained in all publications are solely those of the individual author(s) and contributor(s) and not of MDPI and/or the editor(s). MDPI and/or the editor(s) disclaim responsibility for any injury to people or property resulting from any ideas, methods, instructions or products referred to in the content. |
© 2023 by the authors. Licensee MDPI, Basel, Switzerland. This article is an open access article distributed under the terms and conditions of the Creative Commons Attribution (CC BY) license (https://creativecommons.org/licenses/by/4.0/).