Article

Computational Modeling of Human Serum Albumin Binding of Per- and Polyfluoroalkyl Substances Employing QSAR, Read-Across, and Docking

by
Andrea Gallagher
1,
Supratik Kar
1,* and
Maria S. Sepúlveda
2,3
1
Chemometrics and Molecular Modeling Laboratory, Department of Chemistry, Kean University, 1000 Morris Avenue, Union, NJ 07083, USA
2
Department of Forestry and Natural Resources, Purdue University, West Lafayette, IN 47907, USA
3
Faculty of Life Sciences, Universidad Andres Bello, Santiago 8370146, Chile
*
Author to whom correspondence should be addressed.
Molecules 2023, 28(14), 5375; https://doi.org/10.3390/molecules28145375
Submission received: 16 June 2023 / Revised: 6 July 2023 / Accepted: 11 July 2023 / Published: 13 July 2023

Abstract

:
Per- and polyfluoroalkyl substances (PFAS) are synthetic chemicals in widespread use that have been shown to be toxic to wildlife and humans. Human serum albumin (HSA) is a known transport protein that binds PFAS at various sites, leading to bioaccumulation and long-term toxicity. In silico tools like quantitative structure-activity relationship (QSAR), read-across, and quantitative read-across structure-property relationship (q-RASPR) are proven techniques for modeling chemical toxicity based on experimental data which can be used to predict the toxicity of untested and new chemicals, while at the same time, help to identify the major features responsible for toxicity. Classification-based and regression-based QSAR models are employed in the present study to predict the binding affinities of 24 PFAS to HSA. Regression-based QSAR models revealed that the packing density index (PDI) and quantitative estimation of drug-likeness (QED) descriptors were both positively correlated with higher binding affinity, while the classification-based QSAR model showed the average connectivity index of order 4 (X4A) descriptor was inversely correlated with binding affinity. Whereas molecular docking studies suggested that PFAS with the highest binding affinity to HSA create hydrogen bonds with Arg348 and salt bridges with Arg348 and Arg485, PFAS with lower binding affinity either showed no interactions with either amino acid or only interactions with Arg348. Among the studied PFAS, perfluoroalkyl acids (PFAA) with large carbon chain length (>C10) have one of the lowest binding affinities, compared to PFAA with carbon chain length ranging from 7 to 9, which showed the highest affinity to HSA. Generalized Read-Across (GenRA) was used to predict toxicity outcomes for the top five highest binding affinity PFAS based on 10 structural analogs for each and found that all are predicted as being chronic to sub-chronically toxic to HSA. The developed in silico models presented in this work can provide a framework for designing PFAS alternatives, screening compounds currently in use, and for the study of PFAS mixture toxicity, which is an area of intense research.

Graphical Abstract

1. Introduction

Per- and polyfluoroalkyl substances (PFAS) or ‘forever chemicals’ are used in a wide variety of products including household and personal care items, food packaging, fabrics, and manufacturing and chemical facilities [1]. PFAS are persistent and do not easily degrade under environmental conditions, leading to bioaccumulation [2,3]. In humans, PFAS exposure has been linked to thyroid disruption, cancer, low birth weight, suppressed vaccine response, obesity, liver disease, kidney disease, and cardiovascular disease, among other adverse health outcomes [1,4,5].
PFAS bind to proteins and this interaction has been postulated to play a major role in bioaccumulation and toxicity. Human serum albumin (HSA) is the primary blood transport protein and has been shown to bind to PFAS at various sites; therefore, serves as a major transport protein for the distribution and bioaccumulation of PFAS. Studies have been conducted investigating the chemical properties of PFAS that affect binding affinity to HSA. A study by Allendorf et al. [6] showed that the albumin/water partition coefficients for several perfluoroalkyl acids (PFAA) were positively correlated with increasing chain length, and absorption was higher for PFAS with sulfonate groups compared to carboxylate groups. Jackson et al. [7] found that PFAS with 6–8 carbon chain length had the highest binding affinity with HSA. In a study by Chi et al. [8], perfluorooctane sulfonic acid (PFOS) and perfluorooctanoic acid (PFOA) both bound to HSA, with PFOS having a stronger binding affinity due to its sulfonate group. Delva-Wiley et al. [9] found that GenX bound HSA at multiple sites, each site involving a hydrogen bond with an arginine residue. Hydrophobicity was a crucial factor for PFAS binding to bovine serum albumin, which is structurally similar to HSA [10].
In sum, the major mechanisms by which HSA interacts with PFAS at the active site involves hydrophobic interactions with hydrophobic pockets and electrostatic interactions with charged amino acid residues. This binding could displace endogenous ligands, such as fatty acids, affecting binding affinity and influencing the transport of other molecules and metabolites. In addition, binding of PFAS to HSA could lead to structural changes in the protein impacting its function. Therefore, additional studies that further characterize the interaction of PFAS with HSA are needed.
In silico models are a proven method to predict toxicity as well as evaluate the mode of action (MOA) action for a specific endpoint. In our previous work, we employed quantitative structure-activity relationships (QSAR) and docking methods to explore the endocrine-disrupting activity of PFAS [11]. In another study, QSAR was employed to evaluate the change in toxicity among single, binary, and tertiary PFAS mixtures, followed by understanding the MOA of their toxicity in terms of synergism and/or additivity for mixtures [12]. The experimental study suggested that PFOS was the most cytotoxic and perfluorohexane sulfonate (PFHxS) the least cytotoxic among the four studied PFAS. In conclusion, experimental and modeling outcomes confirmed that mixtures were roughly additive, with the exception of PFOS and PFOA, which were found to be weakly synergistic.
The objective of this study was to model the binding affinity of 24 PFAS with HSA. Classification- and regression-based QSAR, followed by read-across models and docking studies, were used to model and predict the toxicity and potential adverse effects to HSA, followed by a description of major structural and physicochemical features, driving binding affinities to HSA. The developed in silico toxicity models also can be used in the early stages of PFAS development to prioritize compounds for further testing, reducing the time and cost associated with experimental testing, followed by offering insights into underlying mechanisms of toxicity, and support decision-making processes in various industries as well as in environmental risk assessment. Importantly, our approach can also be used to study PFAS interactions and aid in the understanding of PFAS mixture toxicity.

2. Results and Discussion

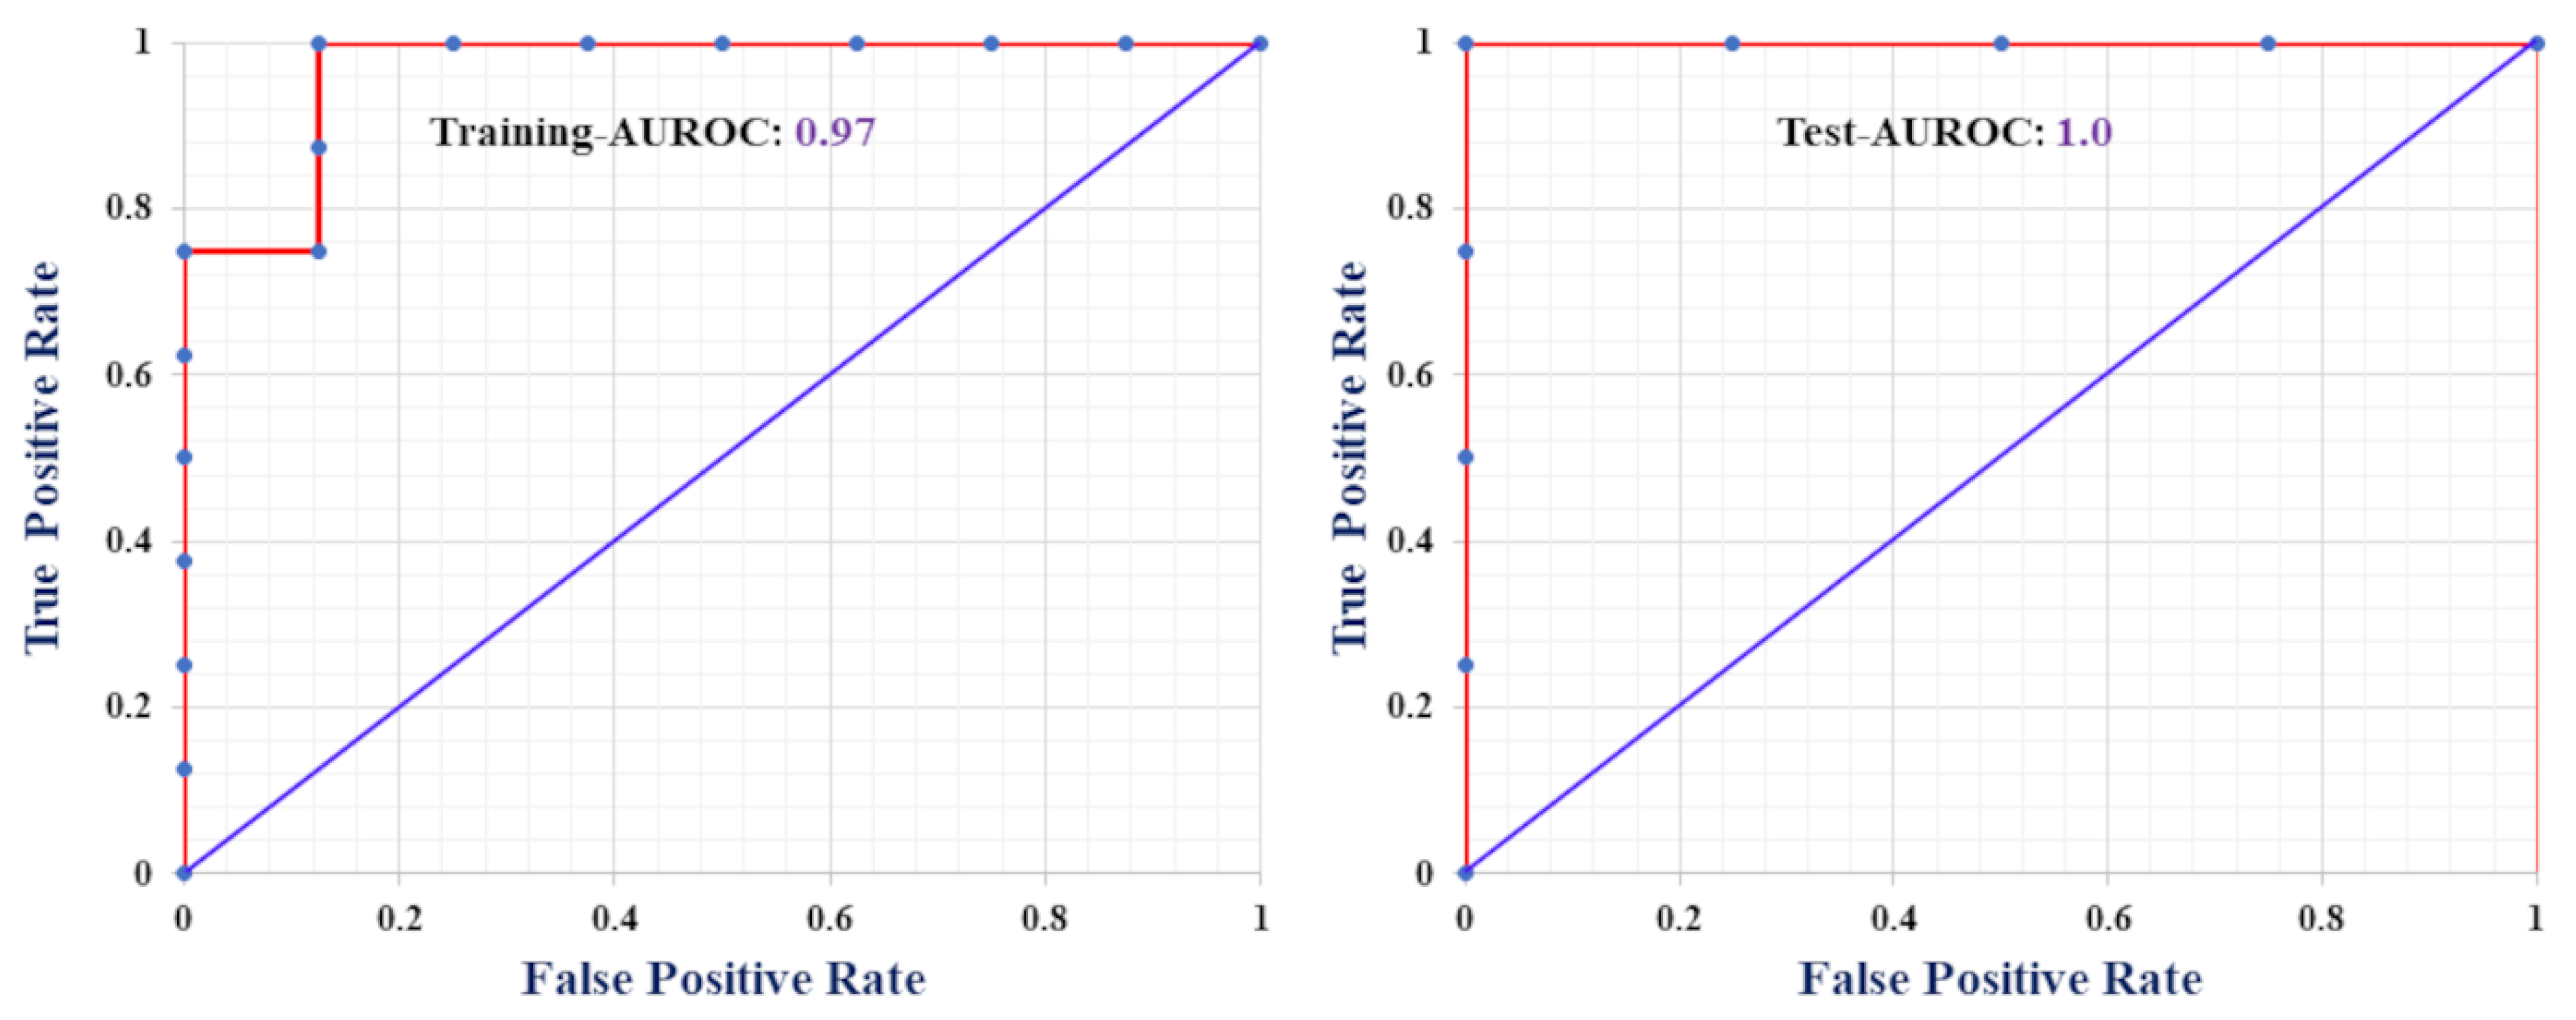
2.1. Classification-Based QSAR Model

After combining training and test data sets, the model classified 11 PFAS as having ‘high’ (H) binding affinity and 13 PFAS as having ‘low’ (L) binding affinity with HSA. Of the 16 PFAS in the training set, 9 were classified as having H binding affinity and 7 were classified as having L binding affinity. Among the remaining 8 PFAS in the test set, 4 were classified as having H binding affinity and 4 were classified as having L binding affinity (Table 1). The discriminant function ΔP is represented by the following Equation (1):
Δ P = 14.668 + 33.651 × E i g 12 _ A E A b o + 0.378 × D E C C + 30.405 × X 4 A ( W i l k s   λ = 0.26 ,   F 3 , 12 = 10.45 ,   P < 0.001
Detailed validation metrics results are illustrated in Table 2. Values above the potency threshold are classified as L and values below the potency threshold are classified as H. As all three descriptors in the equation contribute positively, higher values for these descriptors will most likely result in L classification and lower values are more likely to result in H classification. As can be seen in the equation, X4A has the highest contribution, meaning it is the most important factor in determining the binding affinity in this model. X4A refers to the average connectivity index of order 4, while Eig12_AEA(bo) refers to the eigenvalue number12 from the augmented edge adjacency matrix weighted by bond order and DECC refers to eccentric topological indices.
The receiver operating characteristic (ROC) curves in Figure 1 illustrate the perfect classification ability of the developed model (Equation (1)), where training and test ROC curves achieved 0.97 and 1 value, respectively. Examining the contribution plot in Figure 2, we are certain that X4A is the most important discriminating feature between higher and lower binding affinity of PFAS towards HSA. From the plot, it is quite evident that the higher the X4A value of a PFAS, the lower the binding affinity. Importantly, an additional two features: Eig12_AEA(bo) and DECC are equally important for the development of the model, but considering the discrimination between H and L binding groups, they don’t have much clear distinction.

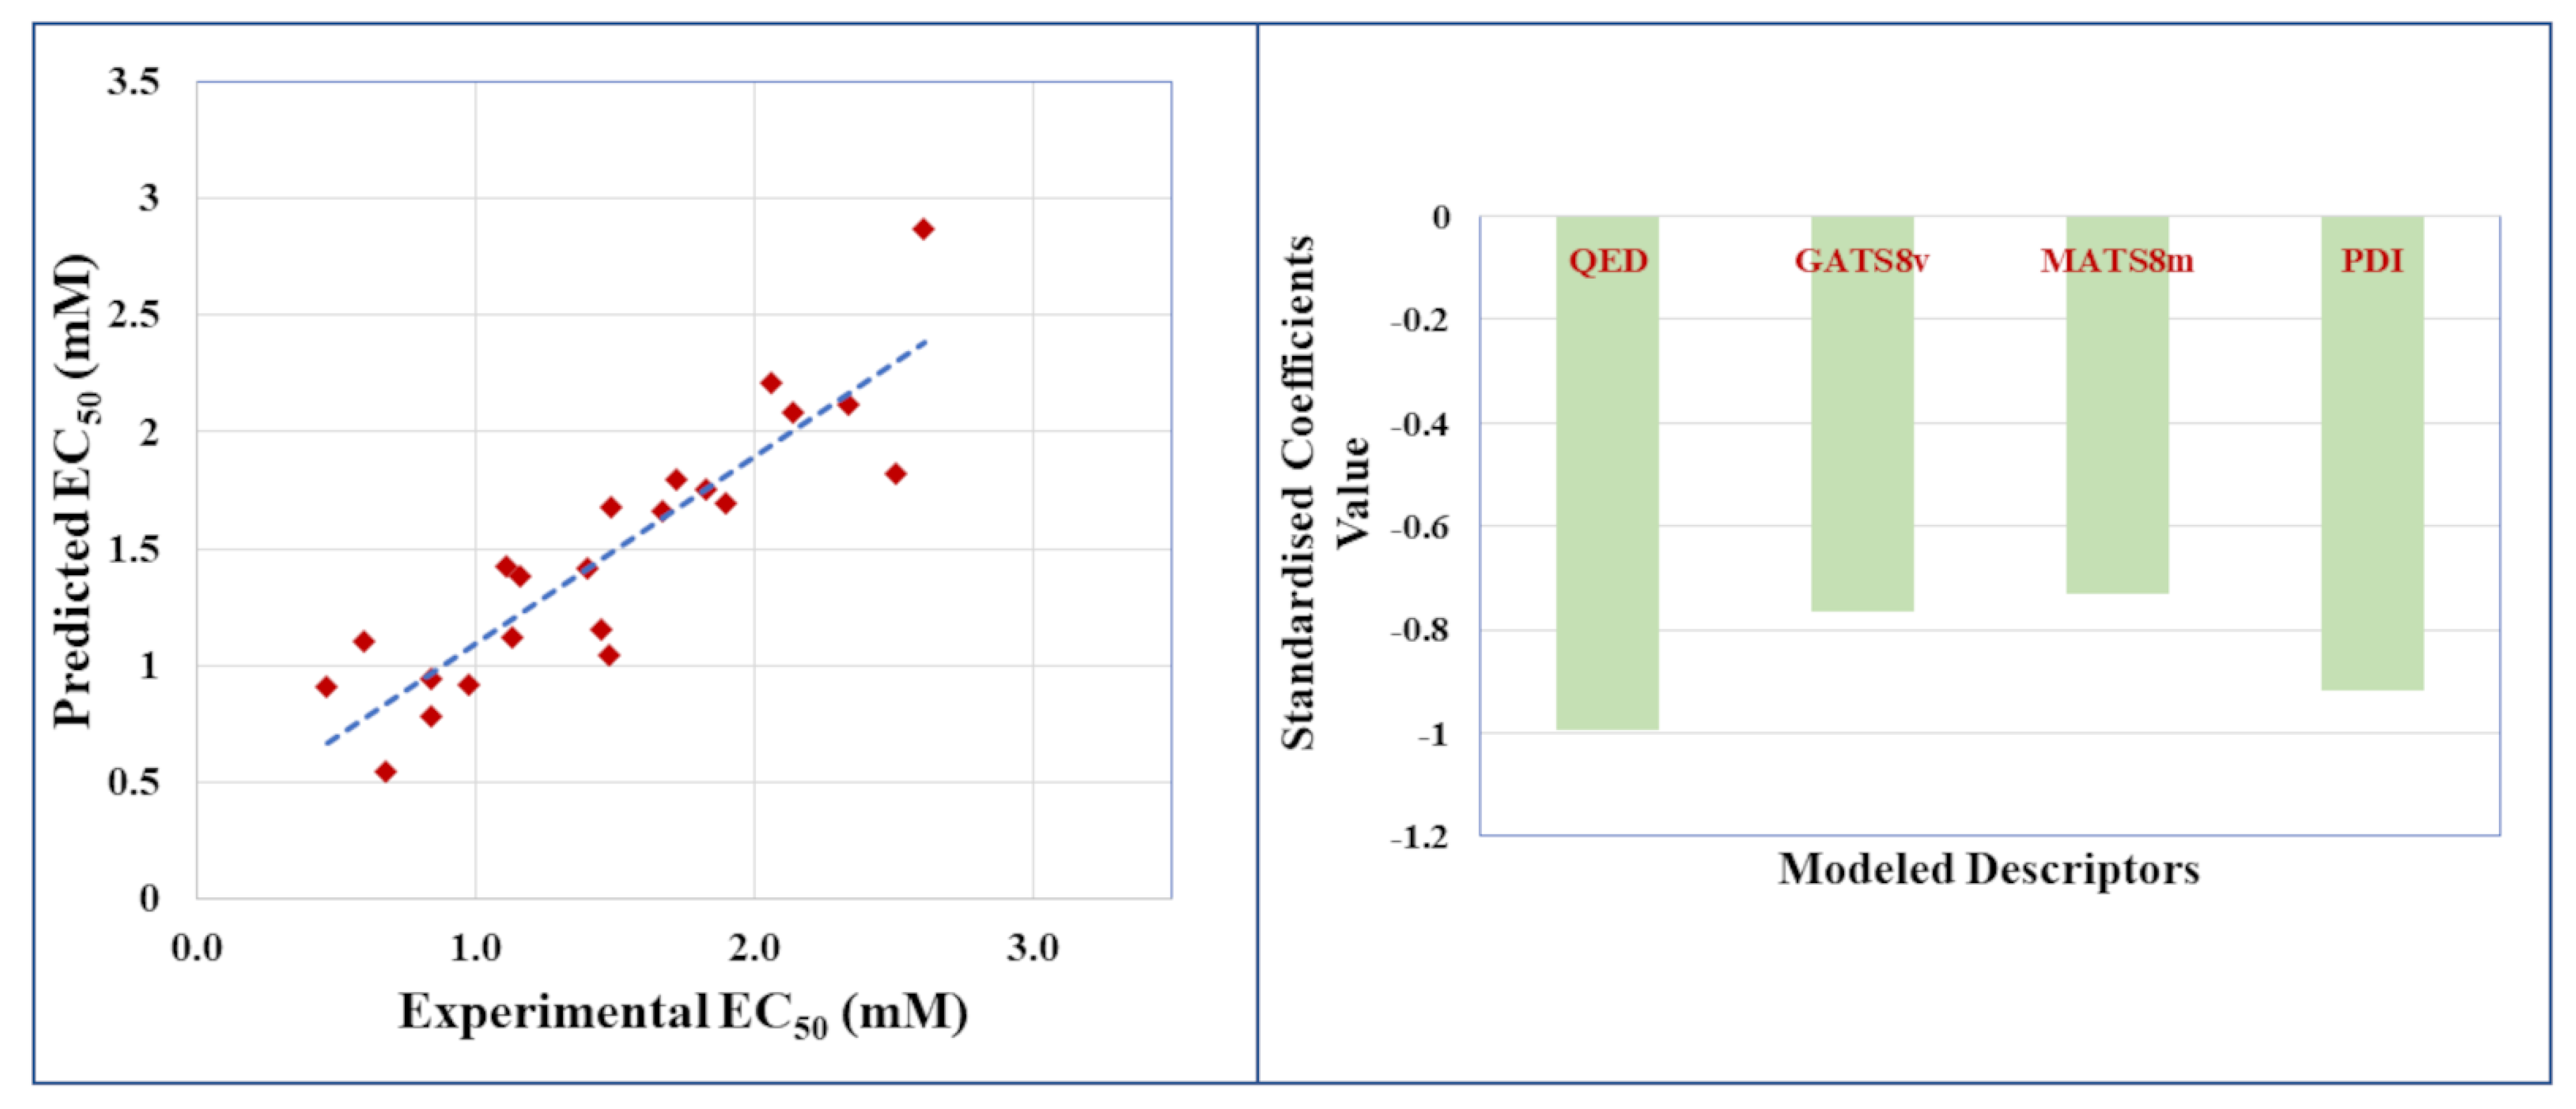
2.2. Regression-Based ‘Small Dataset QSAR’ Model for Undivided Dataset

Two PFAS had no binding affinity values; therefore, for the development of the regression-based QSAR model, we considered only 22 PFAS. As the number is quite low, we decided to take the whole dataset for modeling purposes employing ‘SmallDataModeler’, which is an approved modeling tool when there is not enough data to utilize training and test data sets separately. We developed two models employing multiple linear regression (MLR) and partial least squares (PLS) chemometric tools. Based on the goodness-of-fit and internal validation metrics, it was determined that the PLS model (Model 2) was slightly better than the MLR model (Model 1). The quality of both models is depicted in Table 3.
The developed equation for Model 2 is as follows:
E C 50 mM = 24.427 23.551 × P D I 0.862 × G A T S 8 v 0.607 × M A T S 8 m 4.388 × Q E D
The regression-based Small Dataset MLR model consists of 4 descriptors: MATS8m, GATS8v, PDI, and QED. The PDI descriptor refers to packing density index, defined as the ratio between the McGowan volume (Vx) and the total surface area from P_VSA-like descriptors (SAtot), or P D I = V x S A t o t . The MATS8m descriptor refers to Moran autocorrelation of lag 8 weighted by mass. The GATS8v descriptor refers to Geary autocorrelation of lag 8 weighted by van der Waals volume. The QED descriptor refers to the quantitative estimation of drug-likeness. This descriptor is based on 8 other molecular properties, which are used to obtain a set of desirability functions through asymmetric double sigmoidal (ADS) functions. QED is defined by the equation Q E D = e i = 1 n w i ln d i i = 1 n w i , where di is the desirability of the property, wi is the weight applied to each function, and n is the number of desirability functions.
All four descriptors in the equation have a negative contribution to the equation, meaning that higher values for each descriptor will lead to a lower EC50 or higher binding affinity. To obtain a PFAS with low binding affinity to HSA and, therefore, lower toxicity, ideally the values for all four descriptors should be low, resulting in a more positive EC50. The scatter plot employing the best PLS-based model in Figure 3 (Left) shows that experimental binding affinities in terms of EC50 are well correlated with the predicted affinities. The scatter plot shows that the points fell close to the line of perfect fit, which further supports the predictive efficacy of the developed QSAR model. The variable significance plot in Figure 3 (Right) displays the standardized values for each descriptor of the PLS-based equation. All four descriptors negatively contribute to the equation, with QED showing the highest contribution followed by PDI, GATS8v, and MATS8m to the model.

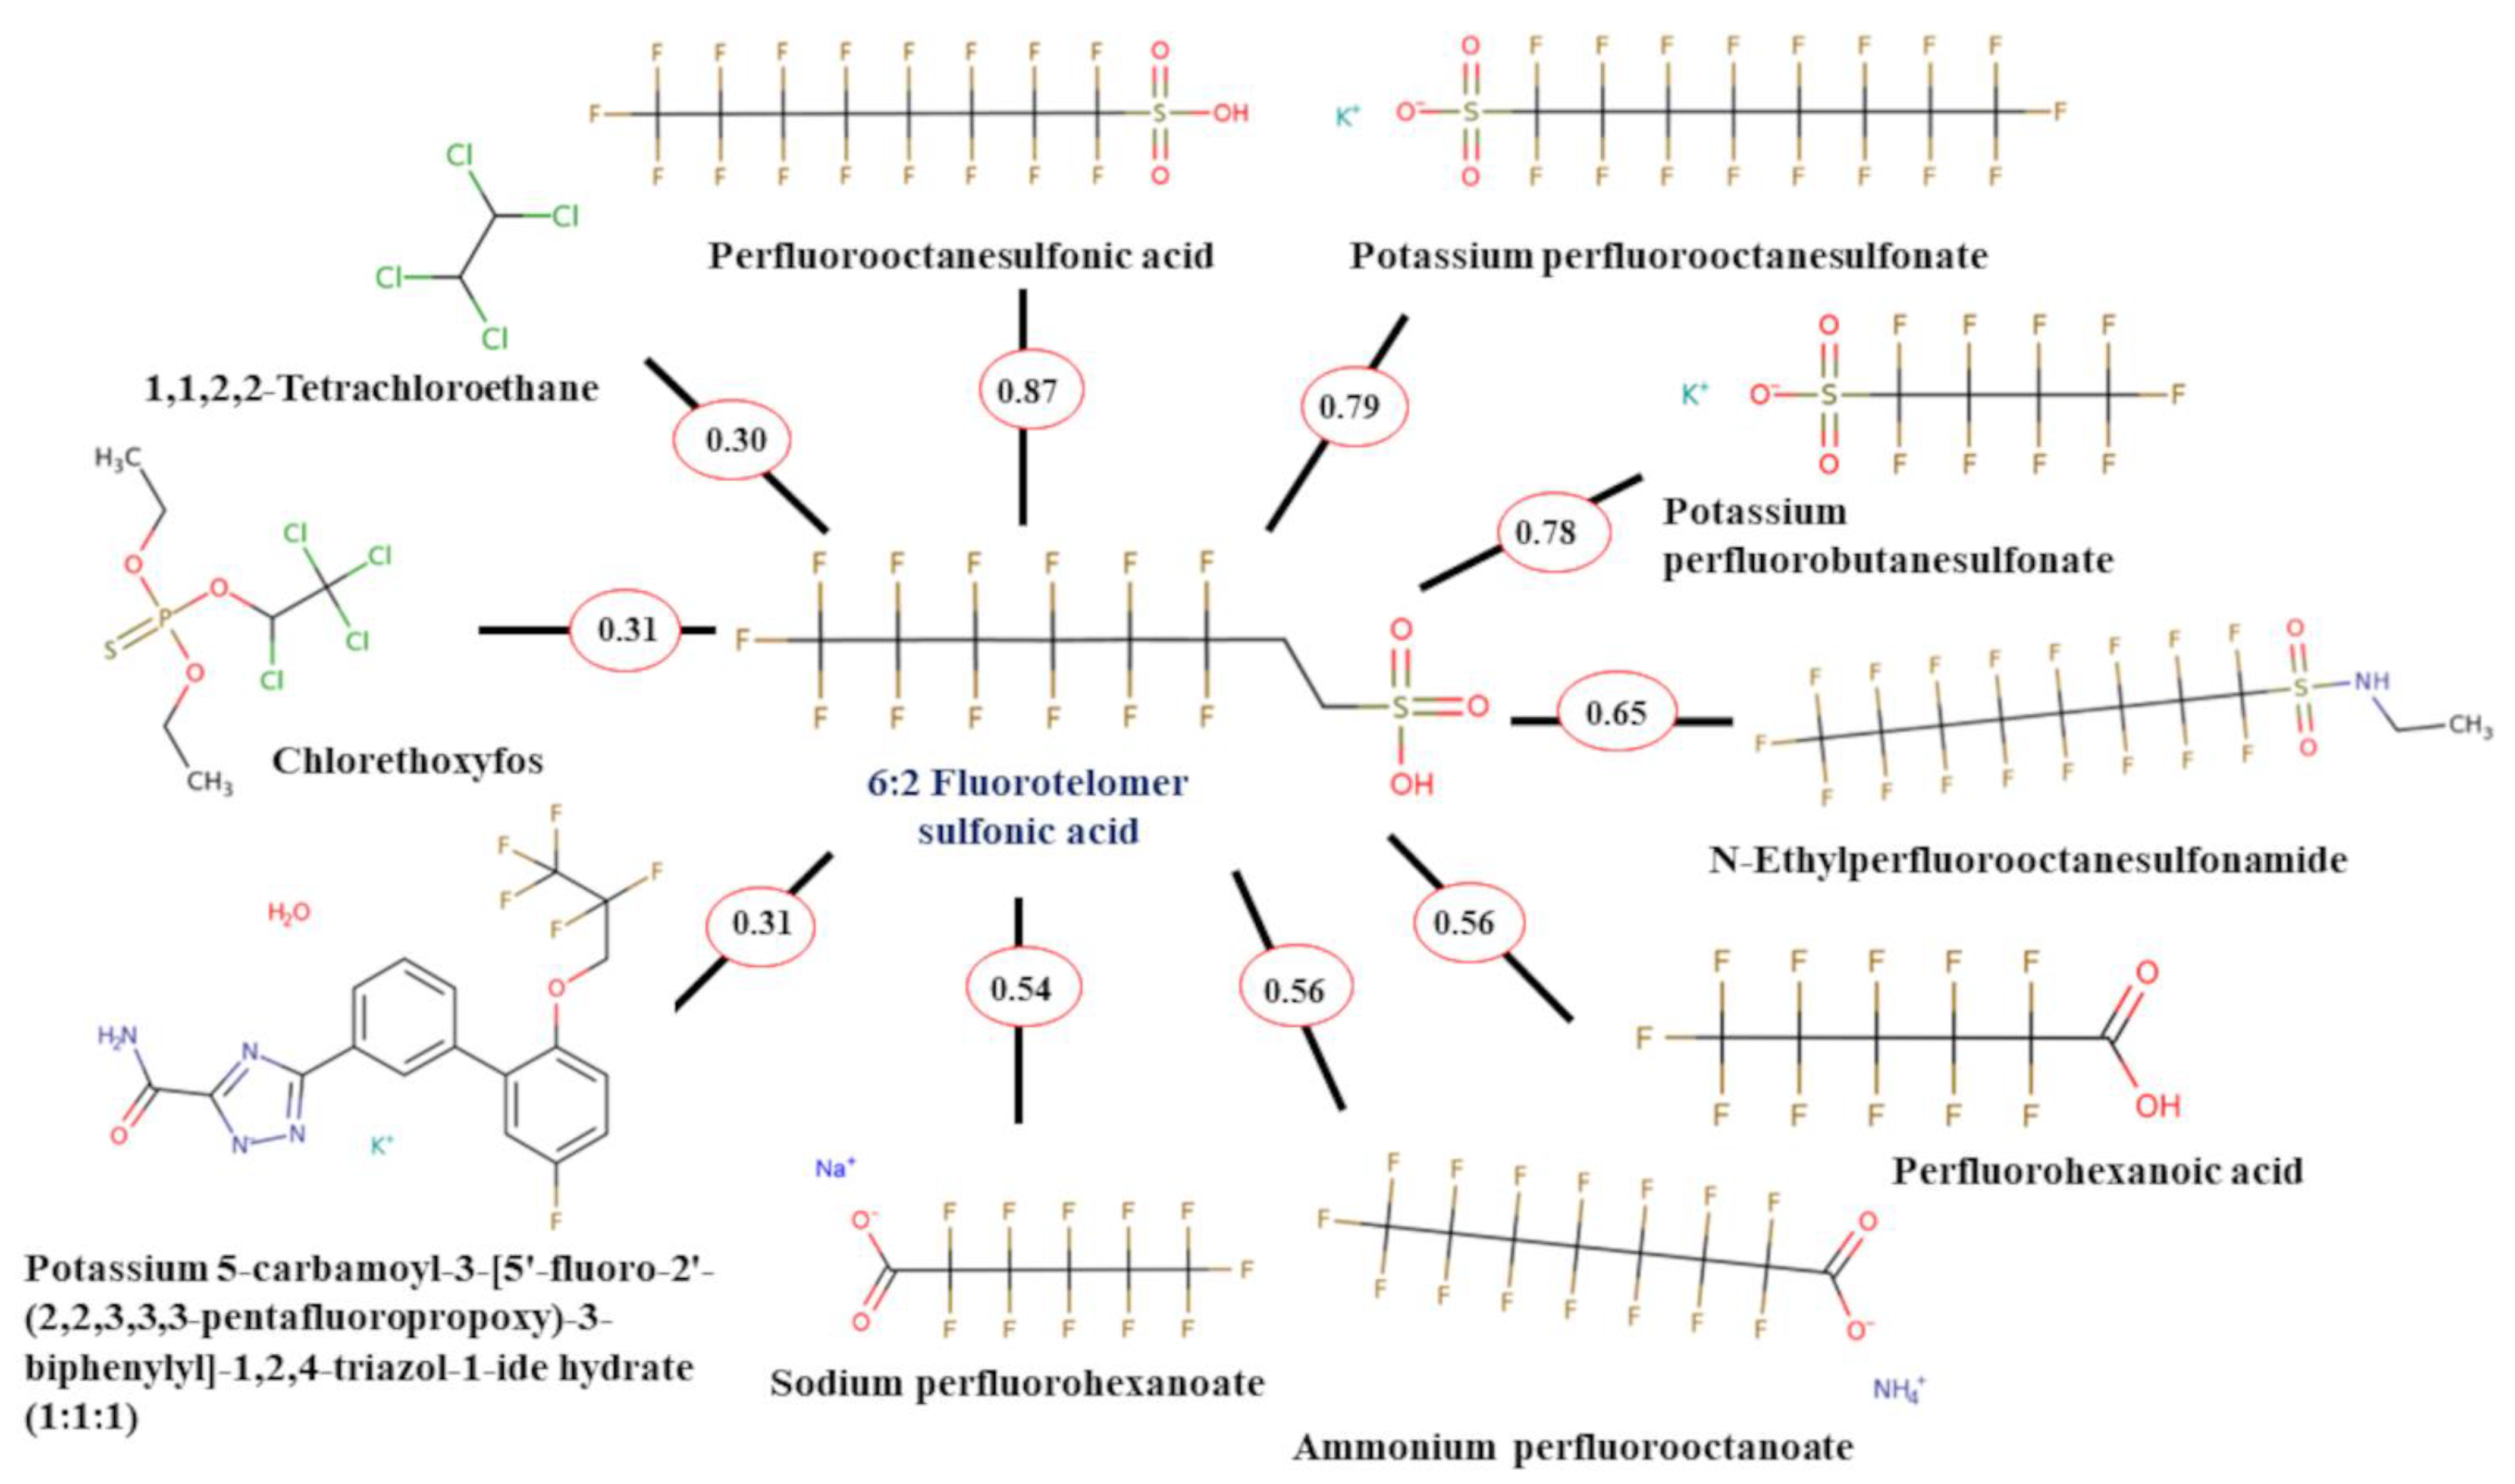
2.3. Read-Across Results

Based on the top 10 ToxPrint Chemotype analogues for each PFAS, GenRA predicted the toxic effects of S5, C6, C4, C5, and C12 (top five highest binding affinity to HSA in the present study). Notably, all 5 PFAS were predicted to be sub-chronically toxic to albumin (ACT scores of 1, 0.818, 0.812, 0.812, and 0.816, respectively), with S5 and C12 having ACT scores of 1 and 1, respectively were also predicted to be chronically toxic. However, it should be noted that the predictions were validated in combination with AUC values and p-values. All AUC values for each prediction were 0, and p-values ranged from 0.73 to 1. Ideally, the AUC should be greater than 0.7 and p-value should be less than 0.1. While the predictions have high ACT scores, the validation metrics show that the predictions are not that reliable due to low AUC and high p-values. One of the major reasons is we are just challenged by the coverage of PFAS toxicity data and the extent to which we can quantify the performance for target chemicals with any degree of robustness. Figure 4 depicts the top 10 ToxPrint Chemotype analogues for 6:2 fluorotelomer sulfonic acid (6:2 FTSA), the PFAS with the highest binding affinity to HSA in the studied dataset. The top 10 ToxPrint Chemotype analogues for the remaining top four PFAS are shown in Supplementary Materials.
Four of the structural analogues were common between all five molecules and contributed to the albumin toxicity prediction with known data. Potassium perfluorobutanesulfonate, an analogue for all five molecules, had subchronic toxic albumin effects at 600 mg/kg/day. N-Ethylperfluorooctanesulfonamide, an analogue for all five molecules, had subchronic toxic albumin effects at 10.1 mg/kg/day. 1,1,2,2-Tetrachloroethane, an analogue for S5, C6, C4, and C5, had subchronic toxic albumin effects at 40 mg/kg/day. Chlorethoxyfos, an analogue for S5 and C12, had subchronic toxic albumin effects at 1.25 mg/kg/day and chronic toxic albumin effects at 1.86 mg/kg/day. Toxicity data and predictions for all five sets of GenRA can be viewed in Supplementary Materials.

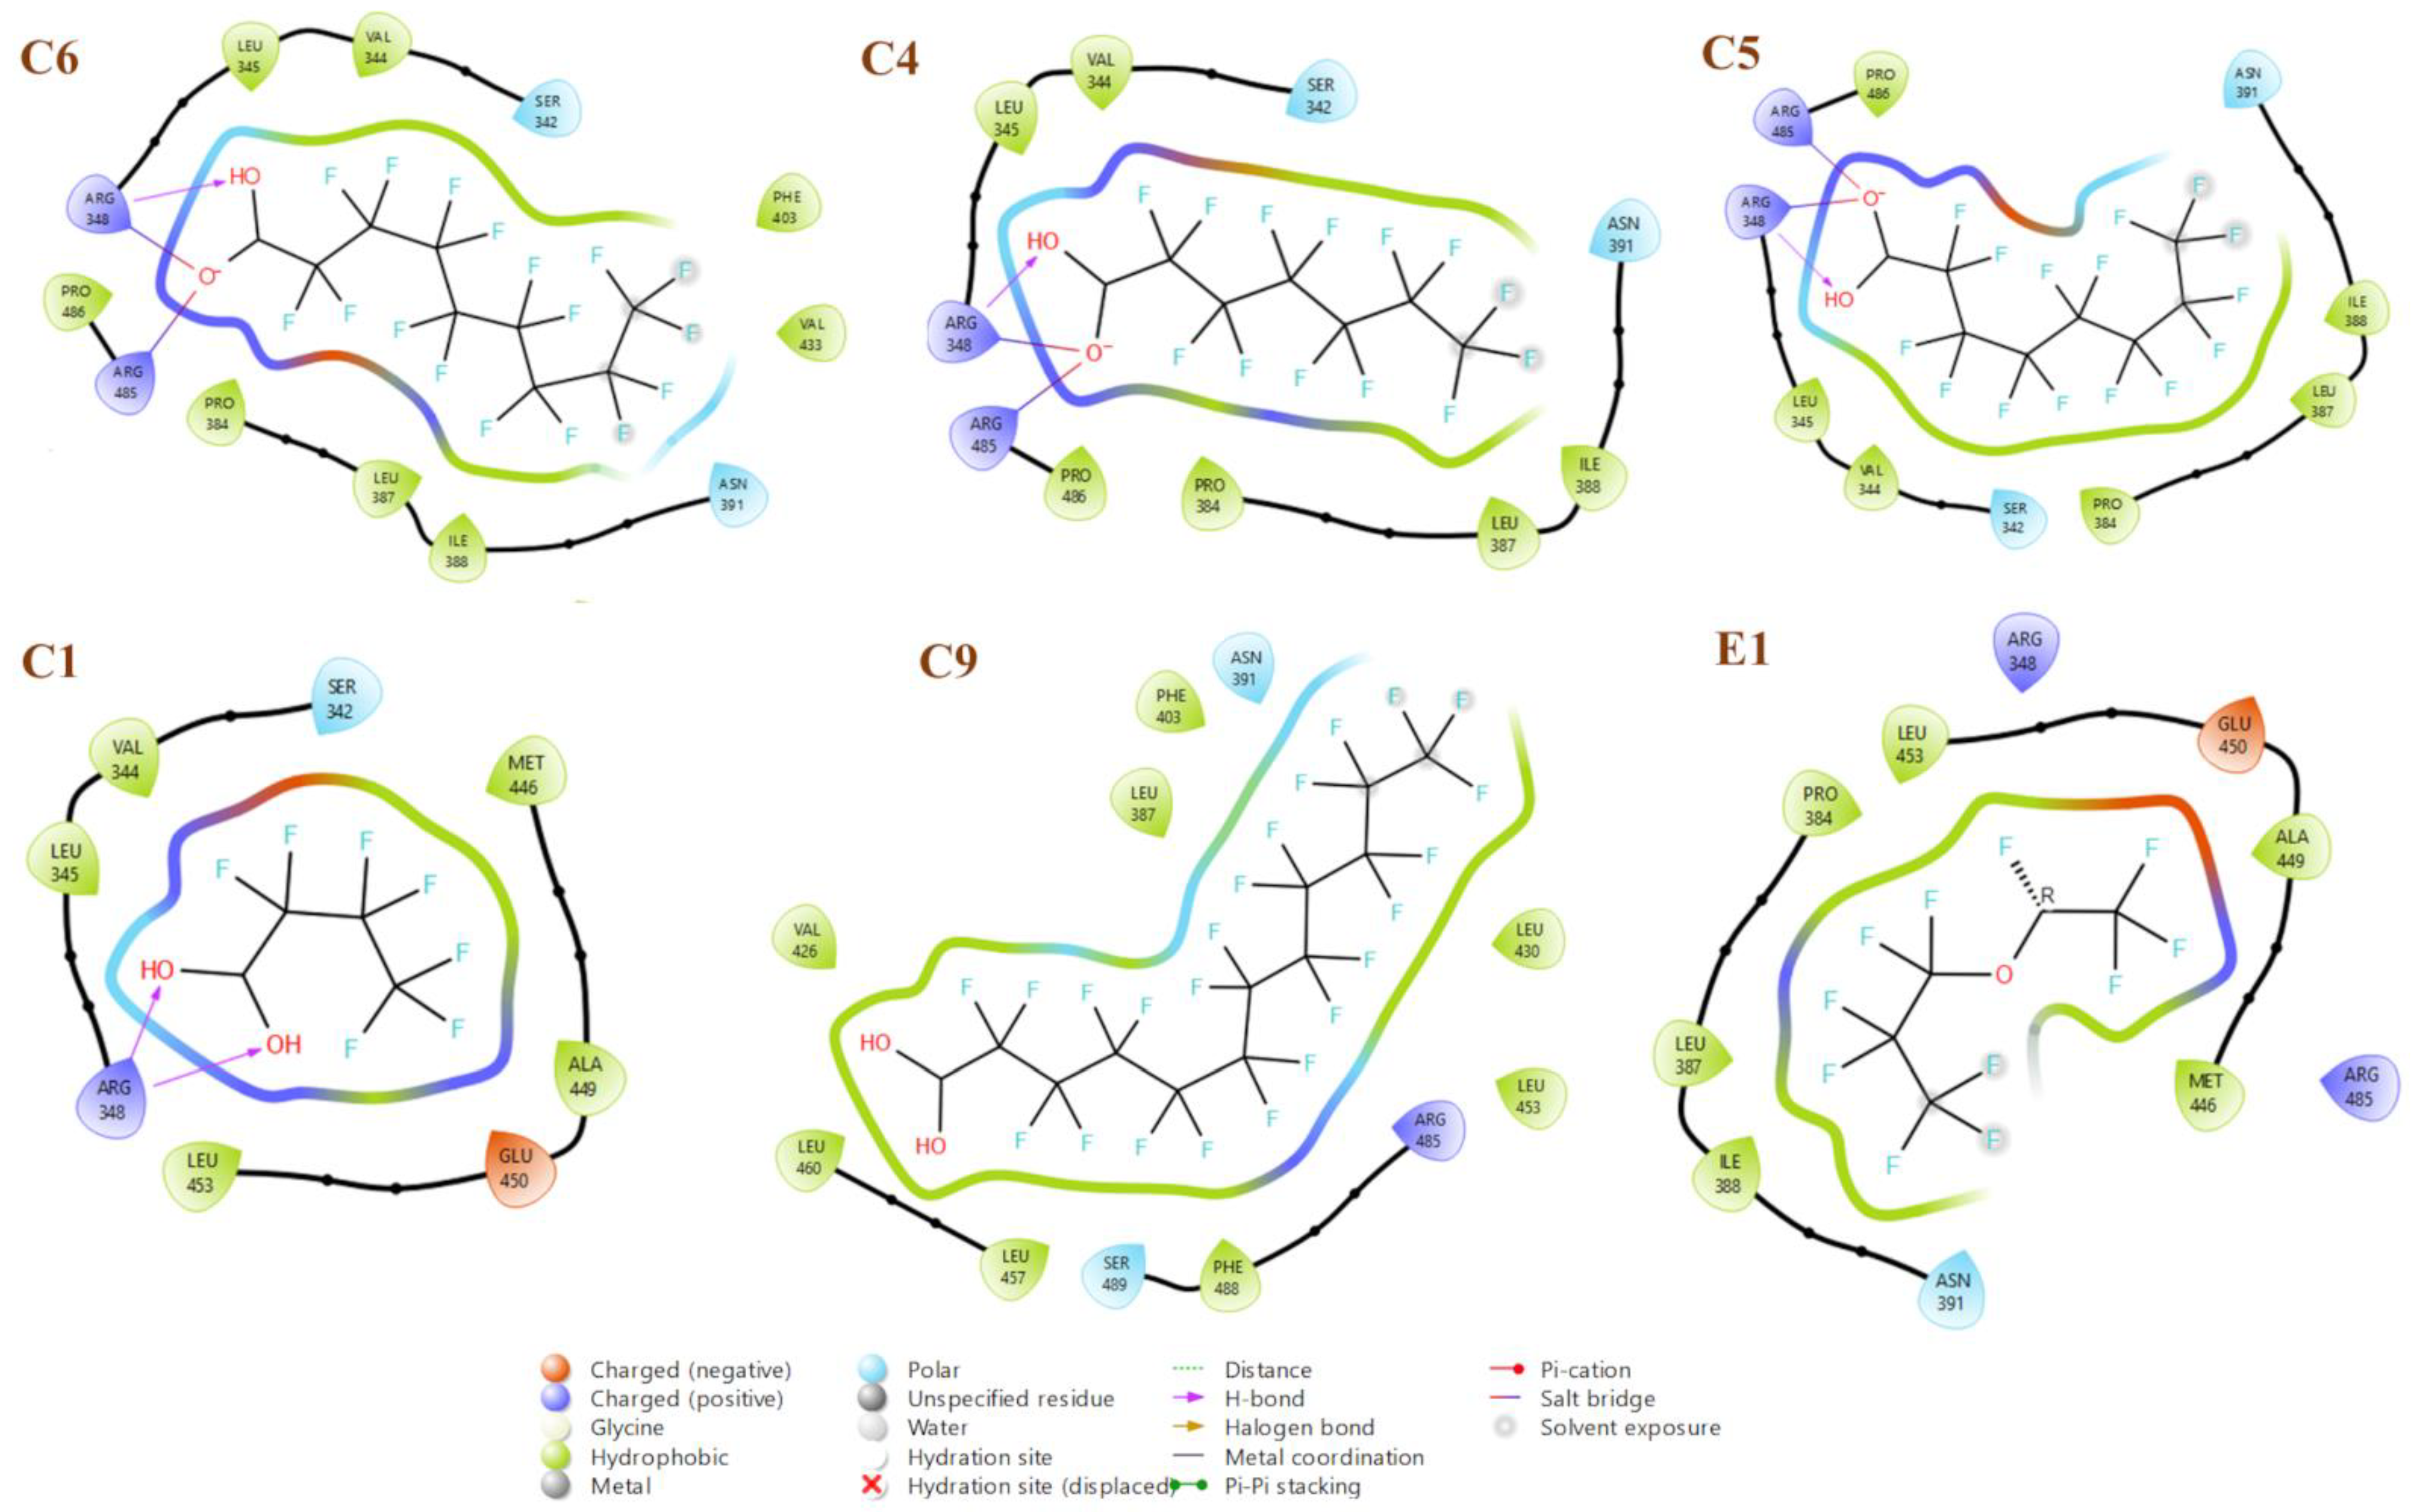
2.4. Docking Results

Docking interaction diagrams for the three highest binding affinities (C6, C4, and C5) and three lowest binding affinities (C1, C9, and E1) show the crucial amino acids involved in binding (Figure 5). Interestingly, all three of the highest affinity PFAS form a hydrogen bond with Arg348 and two salt bridges between Arg485 and Arg348, as well as some hydrophobic and polar interactions. In contrast, C9 and E1 do not form any hydrogen bonds or salt bridges, only hydrophobic and polar interactions, leading to their lowest binding affinity to HSA among the studied PFAS. C1 forms two hydrogen bonds with Arg348, but no salt bridges, indicating that the salt bridges are essential to high binding affinity to HSA. It is interesting to note that despite C9 containing a carboxylate group like C4, C5 and C6, it still has one of the lowest binding affinities, likely due to its large carbon chain length (>C10), which is corroborated by our earlier work [11]. PFAA with carbon chain length ranging from 7 to 9 (C4, C5 and C6) show the highest affinity to HSA.

3. Materials and Methods

3.1. Dataset

Binding affinities of PFAS to HSA in terms of half maximal effective concentrations (EC50 in mM) for 24 diverse PFAS including perfluoroalkyl sulfonic acids (C4–C8), perfluoroalkyl carboxylic acids (C4–C12), mono- and polyether perfluoroalkyl ether acids, and polyfluoroalkyl fluorotelomer were collected from the literature [7]. Out of the 24 PFAS, EC50 were determined for 22 PFAS. The EC50 values were obtained from the concentration-response curves using a 4-parameter variable slope model. EC50 quantifies binding affinity, specifically quantifies the concentration of ligand at which half of the target protein is bound. EC50 also measures the concentration of ligand necessary to induce half of the maximum possible effect. Out of the 24 PFAS, the two fluorotelomer alcohols (4:2 FTOH and 6:2 FTOH) did not bind to PFAS as per experimental study; therefore, they can be classified as ‘non-toxic’ among the studied PFAS. Thus, all 24 PFAS were used in the development of a classification-based QSAR model and 22 PFAS were used in the regression-based QSAR model (Table 1). PFAS with EC50 of 1.45 mM or lower were classified as having H binding affinity to HSA, while the rest were classified as L binding affinity to HSA including the 2 fluorotelomer alcohols with no interactions for the classification QSAR.

3.2. Descriptor Calculation

The chemical structures for the 24 PFAS were uploaded in alvaDesc 2.0.16 [13] for the descriptors calculation. For the classification-based QSAR model, a pool of 753 2D descriptors were calculated for the 24 PFAS. For the regression-based QSAR model, a pool of 736 2D descriptors were calculated as 4:2 FTOH and 6:2 FTOH were excluded due to non-interactions with HSA. Both descriptor pools included the following types of descriptor classes: constitutional indices, ring descriptors, topological indices, walk and path counts, connectivity indices, information indices, 2D matrix-based descriptors, 2D autocorrelations, Burden eigenvalues, P_VSA-like descriptors, ETA indices, drug-like indices, MDE descriptors, chirality descriptors, atom-centered fragments, atom-type E-state indices, charge descriptors, edge adjacency indices, functional group counts, molecular properties, pharmacophore descriptors, and 2D atom pairs.

3.3. QSAR Modeling

The classification-based QSAR model was developed to identify major discriminatory features between the higher to lower binding affinity classes of PFAS, using genetic algorithm-linear discriminant analysis (GA-LDA) with the ‘ClassificationBasedQSAR v1.0.0′ tool by DTC Lab Software [14]. The classification dataset was divided into a training and a test set for modeling with random method at a ratio of 2:1, which resulted in ntest = 8 and ntraining = 16. Due to the small number of data points, in case of the regression-based QSAR modeling, the ‘Small Dataset Modeler’ tool from DTC Lab Software [14] was used to utilize the whole data set for the exhaustive double cross-validation approach, which does not require dataset division. SmallDataModeler v1.0 by DTC Lab Software was employed using 3 compounds in the validation set by genetic algorithm-multiple linear regression (GA-MLR) selection. The SmallDataModeler employs an exhaustive double cross-validation approach and a set of optimal model selection techniques including consensus predictions for performing the small-dataset QSAR modelling. It performs four basic steps, i.e., (i) data pre-treatment, (ii) model development using exhaustive double cross-validation approach, (iii) selection of optimal model, and (iv) model validation (both internal and external).

3.4. Validation, Applicability Domain, and Randomization

Accuracy, Sensitivity, Specificity, Precision and F-measure, geometric means (G-means), Cohen’s kappa, Matthew’s correlation coefficient (MCC), and receiver operating characteristic (ROC) were evaluated as validation metrics for classification-based QSAR [15]. The area under the ROC curve (AUROC) evaluates the performance of a diagnostic variable, where an AUROC of 1 is ideal and an AUROC of 0.5 indicates a random guess, while the regression-based QSAR model and q-RASAR models were validated using goodness-of-fit (R2), internal validation metric leave-one-out cross-validation (Q2LOO), rm2 metrics, and mean absolute error (MAE(95%)). The mathematical definition of major statistical metrics is listed in Table 4.
Here, Wg = cross-product matrix for within group variance, Bg = cross-product matrix for between group variance, σ1 is the standard deviation of population 1, s1 is the standard deviation of the sample drawn from population 1, σ2 is the standard deviation of population 2, s2 is the standard deviation of the sample drawn from population 2, λi = eigen value, det = determinant of a matrix, TP = true positive, FN = false negative, TN = true negative, FP = false positive, λ = Wilk’s lambda; P r a : relative observed agreement between the predicted classification of the model and the known classification; P r e : hypothetical probability of chance agreement, Yobs = observed response, Ycalc = calculated response, Y ¯ = mean response of the analyzed set (any), Y ¯ t r a i n i n g = mean response of training set, Yobs(training) = observed response of the training set, Ypred(training) = predicted response of the training set, r2 = squared correlation coefficient, and r02 = squared correlation coefficient with zero intercept.

3.5. Docking Study

Molecular docking was performed to identify important interactions between the 24 PFAS under study and the protein structure of HSA in complex with PFOA (PDB: 7AAI). The ligands and protein were prepared with the LigPrep [16] and Protein Preparation tools on Maestro module of Schrodinger 2023. The Receptor Grid Generation tool generated a grid file around the top docking site, with an enclosed size of 20 Å. The ligands were docked using the extra precision (XP) Glide module [17] of Schrodinger 2023. The docking method was validated by redocking the co-crystallized ligand PFOA and calculating the RMSD between the docked ligand and the original, which was 0.092 Å. Once the docking protocol and binding active site were validated, we docked all 24 PFAS. Later glide docking energies were considered for correlations between the binding affinity of PFAS to HSA.

3.6. Read-Across

Chemical read-across (RA) is one of the major in silico approaches to fill data gaps when there is not enough data available. The available data of a particular substance (referred to as the source) are utilized to forecast the corresponding endpoint(s) for another substance (known as the target) that lacks data but is deemed ‘similar’ in certain aspects, such as structural similarity among chemicals. A disadvantage of the RA approach is that it is subjective and driven by an expert’s specific approach, which can lead to issues of reproducibility and scalability. An alternative to RA is Generalized Read-Across (GenRA) [18], which is an algorithmic developed by the US EPA that enables more objective and reproducible predictions of in vivo toxicity and in vitro bioactivity. In the present study, we used GenRA to predict the toxicity effects of the top five highly bound PFAS to HSA from the experimental data: S5, C6, C4, C5, and C12. For each molecule, the top 10 structural analogues were identified with pairwise similarity metrics, based on ToxPrint Chemotypes. A data matrix was generated for each set of the 10 analogues, displaying toxicity effects from available data. This approach predicted the toxicity effects of each of the five molecules under various categories including chronic, multigenerational, developmental, subacute, and subchronic effects. Based on the GenRA, we predicted a total of 307 chronic and subchronic toxicity endpoints for HSA resulting from PFAS. Results were further validated by similarity-weighted activity scores (ACT), AUC, and p-values. The complete workflow employed in the present study is depicted in Figure 6.

4. Overview and Conclusions

We have employed multiple in silico modeling approaches like QSAR, RA, and docking to model HSA binding affinity of PFAS. We found that PFAS with long carbon chains (>C10) have lower binding affinities with HSA compared to shorter chain PFAS (C7 to C9), which interacted with HSA with the highest affinity. The RA study also predicted and confirmed that the top five highest binding affinity PFAS as per studied data are also chronic to sub-chronically toxic to HSA. The developed models are not only important to predict the binding affinities of the 25 PFAS tested, but also can be efficiently employed to predict new and untested PFAS’ binding to HSA considering applicability domain in mind. The docking study also offered major insights on amino acid interactions between PFAS and HSA, which will aid in the identification of potentially hazardous PFAS. Additionally, these models can be used to evaluate the interactions of PFAS mixtures, which is what humans and other biota are exposed to in the real world, and is an area of intense research.

Supplementary Materials

The following supporting information can be downloaded at: https://www.mdpi.com/article/10.3390/molecules28145375/s1.

Author Contributions

A.G. (data collection, computational study, analysis, initial draft writing, editing), S.K. and M.S.S. (concept, analysis, reviewing, editing). All authors have read and agreed to the published version of the manuscript.

Funding

US EPA Federal award No. 84045601 (Subaward no. 16200050-034 from Purdue University).

Data Availability Statement

Supporting data can be found under Supplementary Materials.

Acknowledgments

The authors want to thank the administration of the Dorothy and George Hennings College of Science, Mathematics, and Technology (HCSMT) of Kean University for providing research opportunities through research release time and resources. Modules used under Schrödinger software were purchased using US EPA Federal award No. 84045601, Subaward no. 16200050-034 to Kean University (PI: SK) from Purdue University.

Conflicts of Interest

The authors declare no conflict of interest.

Sample Availability

Not applicable.

References

  1. EPA. Our Current Understanding of the Human Health and Environmental Risks of PFAS; EPA: Washington, DC, USA, 2022. [Google Scholar]
  2. Ahrens, L. Polyfluoroalkyl compounds in the aquatic environment: A review of their occurrence and fate. J. Environ. Monit. 2011, 13, 20–31. [Google Scholar] [CrossRef] [PubMed]
  3. Lassen, C.; Jensen, A.A.; Potrykus, A.; Christensen, F.; Kjølholt, J.; Jeppesen, C.N.; Mikkelsen, S.H.; Innanen, S. Survey of PFOS, PFOA and Other Perfluoroalkyl and Polyfluoroalkyl Substances. 2013. Available online: https://www2.mst.dk/udgiv/publications/2013/04/978-87-93026-03-2.pdf (accessed on 6 June 2023).
  4. National Toxicology Program (NTP). Immunotoxicity Associated with Exposure to Perfluorooctanoic Acid (PFOA) or Perfluorooctane Sulfonate (PFOS). 2016. Available online: https://ntp.niehs.nih.gov/go/749926 (accessed on 6 June 2023).
  5. Fenton, S.E.; Ducatman, A.; Boobis, A.; DeWitt, J.C.; Lau, C.; Ng, C.; Smith, J.S.; Roberts, S.M. Per- and polyfluoroalkyl substance toxicity and human health review: Current state of knowledge and strategies for informing future research. Environ. Toxicol. Chem. 2021, 40, 606–630. [Google Scholar] [CrossRef] [PubMed]
  6. Allendorf, F.; Berger, U.; Goss, K.-U.; Ulrich, N. Partition coefficients of four perfluoroalkyl acid alternatives between bovine serum albumin (BSA) and water in comparison to ten classical perfluoroalkyl acids. Environ. Sci. Process. Impacts 2019, 21, 1852–1863. [Google Scholar] [CrossRef] [PubMed]
  7. Jackson, T.W.; Scheibly, C.M.; Polera, M.E.; Belcher, S.M. Rapid Characterization of human serum albumin binding for per- and polyfluoroalkyl substances using differential scanning fluorimetry. Environ. Sci. Technol. 2021, 55, 12291–12301. [Google Scholar] [CrossRef] [PubMed]
  8. Chi, Q.; Li, Z.; Huang, J.; Ma, J.; Wang, X. Interactions of perfluorooctanoic acid and perfluorooctanesulfonic acid with serum albumins by native mass spectrometry, fluorescence and molecular docking. Chemosphere 2018, 198, 442–449. [Google Scholar] [CrossRef] [PubMed]
  9. Delva-Wiley, J.; Jahan, I.; Newman, R.H.; Zhang, L.; Dong, M. Computational analysis of the binding mechanism of GenX and HSA. ACS Omega 2021, 6, 29166–29170. [Google Scholar] [CrossRef] [PubMed]
  10. Alesio, J.L.; Slitt, A.; Bothun, G.D. Critical new insights into the binding of poly- and perfluoroalkyl substances (PFAS) to albumin protein. Chemosphere 2022, 287, 131979. [Google Scholar] [CrossRef] [PubMed]
  11. Kar, S.; Sepúlveda, M.S.; Roy, K.; Leszczynski, J. Endocrine-disrupting activity of per- and polyfluoroalkyl substances: Exploring combined approaches of ligand and structure based modeling. Chemosphere 2017, 184, 514–523. [Google Scholar] [CrossRef] [PubMed]
  12. Hoover, G.; Kar, S.; Guffey, S.; Leszczynski, J.; Sepúlveda, M.S. In vitro and in silico modeling of perfluoroalkyl substances mixture toxicity in an amphibian fibroblast cell line. Chemosphere 2019, 233, 25–33. [Google Scholar] [CrossRef] [PubMed]
  13. Mauri, A.; Bertola, M. Alvascience: A new software suite for the QSAR workflow applied to the blood brain barrier permeability. Int. J. Mol. Sci. 2022, 23, 12882. [Google Scholar] [CrossRef] [PubMed]
  14. Ambure, P.; Roy, K. DTC Lab Software Tools. Available online: http://teqip.jdvu.ac.in/QSAR_Tools/ (accessed on 6 June 2023).
  15. Chicco, D.; Jurman, G. The Matthews correlation coefficient (MCC) should replace the ROC AUC as the standard metric for assessing binary classification. BioData Min. 2023, 16, 4. [Google Scholar] [CrossRef] [PubMed]
  16. LigPrep, Schrödinger Release 2023-2: Schrödinger, LLC, New York, NY. 2023. Available online: https://www.schrodinger.com/products/ligprep (accessed on 6 June 2023).
  17. Glide, Schrödinger Release 2023-2: Schrödinger, LLC, New York, NY. 2023. Available online: https://www.schrodinger.com/products/glide (accessed on 6 June 2023).
  18. Generalized Read-Across (GenRA). Available online: https://comptox.epa.gov/genra/ (accessed on 6 June 2023).
Figure 1. ROC curve for training and test sets based on the developed classification-based model.
Molecules 28 05375 g001
Figure 2. Contribution plot for the modeled features indices to the discriminant functions for higher and lower binding affinity groups of PFAS to HSA.
Molecules 28 05375 g002
Figure 3. Scatter plot and variable significance plot for the best regression-based QSAR model (PLS model: Model 2).
Molecules 28 05375 g003
Figure 4. Top 10 ToxPrint Chemotype analogues for 6:2 fluorotelomer sulfonic acid.
Molecules 28 05375 g004
Figure 5. Amino acid interactions of PFAS showing the highest and lowest binding affinities to HSA.
Molecules 28 05375 g005
Figure 6. Flowchart of the employed computational approach to execute the study. The figure was created with ‘BioRender.com’ (accessed on 2 July 2023).
Molecules 28 05375 g006
Table 1. Modeled PFAS followed by experimental and predicted results obtained from classification and PLS-based regression QSAR.
IDCASChemical NameRegression-Based QSARClassification-Based QSARDocking
Observed EC50 (mM)Predicted EC50 (PLS Model)Observed ClassificationPredicted Classification
(LDA Model)
Glide Energy
(kcal/mol)
C1375-22-4Perfluorobutanoic acid (PFBA)2.612.87LL−19.583
C22706-90-3Perfluoropentanoic acid (PFPeA)2.142.09LL−21.171
C3307-24-4Perfluorohexanoic acid (PFHxA)1.401.41LL−20.473
C4375-85-9Perfluoroheptanoic acid (PFHpA)0.680.55HH−31.114
C5 *335-67-1Perfluorooctanoic acid (PFOA)0.840.78HH−33.059
C6375-95-1Perfluorononanoic acid (PFNA)0.601.10HH−37.045
C7 *335-76-2Perfluorodecanoic acid (PFDA)1.111.42HH−40.381
C82058-94-8Perfluoroundecanoic acid (PFUnDA)1.491.68HH−35.144
C9307-55-1Perfluorododecanoic acid (PFDoA)2.511.83LL−25.948
C10356-02-53:3 Fluorotelomer carboxylic acid (3:3 FTCA)2.062.21LL−22.287
C11914637-49-35:3 Fluorotelomer carboxylic acid (5:3 FTCA)1.481.04HH−25.859
C1227854-30-46:3 Fluorotelomer carboxylic acid (6:3 FTCA)0.840.95HH−27.848
C1334598-33-98:3 Fluorotelomer carboxylic acid (8:3 FTCA)1.161.38HH−29.169
E1 *3330-15-2Heptafluoropropyl 1,2,2,2-tetrafluoroethyl ether (E1)2.342.11LL−18.76
E213252-13-62,3,3,3-Tetrafluoro-2-(heptafluoropropoxy)propanoic acid (HFPO-DA)1.831.75LL−24.764
E3749836-20-27H-Perfluoro-4-methyl-3,6-dioxaoctanesulfonic acid (Nafion BP2)1.901.70LL−27.534
E4 *151772-59-7Perfluoro-3,6,9-trioxadecanoic acid (PFO3DoDA)1.671.66LL−34.337
S1 *375-73-5Perfluorobutanesulfonic acid (PFBS)1.721.79LL−26.738
S2 *355-46-4Perfluorohexanesulfonic acid (PFHxS)0.980.92HH−27.822
S3 *1763-23-1Perfluorooctanesulfonic acid (PFOS)1.131.12HH−31.682
S4757124-72-44:2 Fluorotelomer sulfonic acid (4:2 FTSA)1.451.16HL−23.829
S559587-38-16:2 Fluorotelomer sulfonic acid (6:2 FTSA)0.470.91HH−28.131
O12043-47-24:2 Fluorotelomer alcohol (4:2 FTOH)N/AN/ALL−16.373
O2 *647-42-76:2 Fluorotelomer alcohol (6:2 FTOH)N/AN/ALL−21.834
* Denotes compounds in test set for classification-based QSAR model.
Table 2. Qualitative prediction of classification-based QSAR model.
MetricsTraining SetTest Set
Sensitivity (%)87.5100
Specificity (%)100100
Precision (%)100100
Accuracy (%)93.75100
F-measure (%)93.33100
MCC0.881
AUROC0.971
Cohen’s κ0.881
G-means93.5100
Table 3. Quality of regression-based ‘Small Dataset QSAR’ models.
ModelChemometric
Tool
No. of DescriptorsLVR2Q2(LOO) r m LOO 2 ¯   MAE(95%)
1MLR4-0.8050.6770.5880.221
2PLS430.8020.6910.5940.205
LV: Latent variable.
Table 4. Mathematical formula of statistical validation metrics employed in the present classification- and regression-based QSAR models.
Metrics Defining Statistical Quality of the Classification-Based QSAR Models
Sl. No.Mathematical Definition
1 λ = d e t W g B g + W g Goodness-of-fit and quality measures
2       F = S 1 2 σ 1 2 S 2 2 σ 2 2
3 S e n s i t i v i t y = T P T P + F N Internal and external validation
metrics
and
parameters
for ROC analysis
4 S p e c i f i c i t y = T N T N + F P
5 P r e c i s i o n = T P T P + F P
6 A c c u r a c y = T P + T N T P + F N + T N + F P
7 F m e a s u r e % = 2 1 P r e c i s i o n + 1 S e n s i t i v i t y
8 M C C = T P × T N F P × F N T P + F P × T P + F N × T N + F P × T N + F N
9 G m e a n s = S p e c i f i c i t y × S e n s i t i v i t y
10 P r a = T P + T N T P + F P + T N + F N
P r e = T P + F P × T P + F N + T N + F P × T N + F N T P + F N + F P + T N 2
C o h e n s   K = P r a P r e 1 P r e
Metrics defining statistical quality of the regression-based models
Sl. No.Mathematical definition
11 R 2 = 1 Y o b s Y p r e d 2 Y o b s Y t r a i n i n g ¯ 2 Goodness-of-fit and quality measures
12 Q L O O 2 = 1 Y o b s t r a i n i n g Y p r e d t r a i n i n g 2 Y o b s t r a i n i n g Y t r a i n i n g ¯ 2 Internal parameters
For robustness
checking
13Mean absolute error
M A E = 1 n × Y o b s Y p r e d
Prediction error
14rm2 metric
r m 2 ¯ = r m 2 + r m 2 2       and       Δ r m 2 = r m 2 r m 2 where r m 2 = r 2 × ( 1 r 2 r 0 2 )
The parameters r2 and r02 are defined as follows:
r 0 2 = 1 Y o b s k × Y p r e d 2 Y o b s Y ¯ o b s 2 & r 0 2 = 1 Y p r e d   k × Y o b s   2 Y p r e d   Y ¯ p r e d   2
The terms k and k’ are defined as:
k = Y o b s × Y p r e d   Y p r e d   2 & k = Y o b s × Y p r e d Y o b s 2
The Yobs and Ypred values have been scaled at the beginning using the following formula: Y i ( s c a l e d ) = Y i Y min ( o b s ) Y max ( o b s ) Y min ( o b s )
Scaled rm2 metrics for internal predictivity
Disclaimer/Publisher’s Note: The statements, opinions and data contained in all publications are solely those of the individual author(s) and contributor(s) and not of MDPI and/or the editor(s). MDPI and/or the editor(s) disclaim responsibility for any injury to people or property resulting from any ideas, methods, instructions or products referred to in the content.

