Article

An Untargeted Metabolomics Approach to Study the Variation between Wild and Cultivated Soybeans

by
Fakir Shahidullah Tareq
1,
Raghavendhar R. Kotha
1,
Savithiry Natarajan
2,
Jianghao Sun
1 and
Devanand L. Luthria
1,*
1
Methods and Application of Food Composition Laboratory, Beltsville Human Nutrition Research Center, Agricultural Research Service, U.S. Department of Agriculture, Beltsville, MD 20705, USA
2
Soybean Genomics and Improvement Laboratory, Beltsville Agricultural Research Center, Agricultural Research Service, U.S. Department of Agriculture, Beltsville, MD 20705, USA
*
Author to whom correspondence should be addressed.
Molecules 2023, 28(14), 5507; https://doi.org/10.3390/molecules28145507
Submission received: 1 June 2023 / Revised: 7 July 2023 / Accepted: 12 July 2023 / Published: 19 July 2023
(This article belongs to the Section Food Chemistry)

Abstract

:
The differential metabolite profiles of four wild and ten cultivated soybeans genotypes were explored using an untargeted metabolomics approach. Ground soybean seed samples were extracted with methanol and water, and metabolic features were obtained using ultra-high-performance liquid chromatography coupled with high-resolution mass spectrometry (UHPLC-HRMS) in both positive and negative ion modes. The UHPLC-HRMS analysis of the two different extracts resulted in the putative identification of 98 metabolites belonging to several classes of phytochemicals, including isoflavones, organic acids, lipids, sugars, amino acids, saponins, and other compounds. The metabolic profile was significantly impacted by the polarity of the extraction solvent. Multivariate analysis showed a clear difference between wild and cultivated soybean cultivars. Unsupervised and supervised learning algorithms were applied to mine the generated data and to pinpoint metabolites differentiating wild and cultivated soybeans. The key identified metabolites differentiating wild and cultivated soybeans were isoflavonoids, free amino acids, and fatty acids. Catechin analogs, cynaroside, hydroxylated unsaturated fatty acid derivatives, amino acid, and uridine diphosphate-N-acetylglucosamine were upregulated in the methanol extract of wild soybeans. In contrast, isoflavonoids and other minor compounds were downregulated in the same soybean extract. This metabolic information will benefit breeders and biotechnology professionals to develop value-added soybeans with improved quality traits.

Graphical Abstract

1. Introduction

Soybean is an important leguminous crop providing meal and oil for food (~20%), animal feed (~76%), biodiesel, and other industrial uses (~4%) [1]. According to an estimation by the U.S. Department of Agriculture, in the 2019/2020 harvest year, the world soybean production was 337 million tons, and an increase of 8% (362 million tons) was observed in the 2020/2021 harvest year [2]. Three countries, namely Brazil, the United States of America, and Argentina, accounted for approximately 80% of the world’s production of soybeans [3]. In the United States, the total soybean production was 4.3 billion bushels in 2022 [4]. Soybeans contain diverse primary and secondary metabolites, including proteins, carbohydrates, lipids, amino acids, and phytochemicals (isoflavones, saponins) that contribute to their nutritional and health-promoting properties [5]. Global breeding programs and biotechnology approaches have been used to develop new varieties of soybeans with improved quality traits. A better understanding of how agronomic practices, environmental conditions, pre-and post-harvest storage, and processing conditions impact metabolite changes in soybeans is essential to further develop soybeans with improved quality traits.
The metabolome of plants contains thousands of a diverse range of phytochemicals that can be broadly classified into three categories: primary metabolites (required for plant growth), secondary metabolites (mediate plant-environment interactions), and hormones (organismal processes and metabolism) [6]. Metabolites play an important role in a plant’s growth, development, and responses to environmental factors. Plant metabolomics has been applied to understand changes in the different stages of plant growth [7], changes in the metabolism of plants to environmental contaminants [8], impacts of soil types [9], and the effect of abiotic and biotic stresses [10,11,12].
Several targeted and untargeted metabolomic studies in soybean have been reported. Clarke et al. used a metabolomics approach to show that the metabolome of the genetically modified soybean line had no significant deviation from natural variation within the soybean metabolome, except for targeted changes in the metabolized bioengineered pathway [13]. In a separate study, Chebrolu et al. evaluated the impact of stress during seed development by exposing plants to optimum, moderate, or high temperatures. The authors showed that the germination of seeds from the heat-susceptible genotype is reduced by 50% for the 36/24 °C treatment and completely inhibited for the 42/26 °C. The same authors also showed the enrichment of tocopherols, flavonoids, phenylpropanoids, and ascorbate precursors in the seeds of the heat-tolerant genotype [14].
Gupta et al. used integrative proteomics and metabolomics analyses to identify the differentially expressed proteins and metabolites in two contrasting yellow (Mallikong) and brown-colored (Mallikong mutant) soybean seeds. The authors showed proteins involved in primary metabolism were downregulated in Mallikong mutant (MM), suggesting energy in MM might be utilized for proanthocyanidin biosynthesis responsible for the development of brown seed coat color [15]. Recently, Bragagnolo et al. using a metabolomics approach, showed the presence of isoflavonoids, flavonoids, terpenes, and other substances in soy stems, leaves, pods, and roots. The authors suggested that these underused parts of the plant can potentially be used as a source of bioactive compounds [16].
Studies on the effects of genotype and environment (temperature, carbon dioxide level, and water stress) on soybean isoflavone contents were also conducted [17,18]. The authors observed significant variations in total and individual isoflavone contents between genotype × year, genotype × location, and genotype × year × location interactions using a targeted metabolomic approach. Similarly, metabolic changes in soybean roots under water deficit stress were investigated by gas chromatography-mass spectrometry (GC-MS), and changes in several metabolic pathways involved in sugars, amino acids, and isoprenoid metabolisms were reported [19].
Previously, we reported metabolic responses of nine soybean varieties grown under field and greenhouse conditions. Soybean extracts were derivatized and assayed by GC-FID, GC-MS, and LC-MS to identify ten primary (amino acids, organic acids, and sugars) and ten secondary (isoflavones, fatty acid methyl esters) metabolites. We found that the free amino acids and organic acids varied between the varieties [20]. In a recent study, we reported the compositional analysis of fatty acids and soluble sugars in wild and cultivated 14 soybeans genotypes using targeted analysis [21]. We observed differences in total oil content in wild soybeans (~9%) versus cultivated soybeans (16–22%). In addition, higher levels of linolenic acid (~17%) and stachyose (~53%) were determined in the wild type. In contrast, higher levels of oleic acid (~19%) and sucrose (~59%) were detected in cultivated soybeans using ion chromatography with amperometry detection and gas chromatography with a flame ionization detector after transesterification of crude oil.
The above-targeted methodologies required detailed sample preparation, separation, and derivatization steps to identify and quantify a limited number of metabolites. Untargeted methods such as ultraviolet spectrophotometry (UV), infrared (IR), and near-infrared (NIR) spectrometry have also been used to acquire spectral fingerprints to evaluate sources of variances based on the classes of compounds. The objective of the current study was to investigate if the untargeted UHPLC-HRMS approach can be used to differentiate soybean cultivars and identify the metabolites responsible for the differentiation. Furthermore, we also wanted to evaluate the role of extraction solvents in untargeted metabolomics.

2. Results and Discussion

In this study, we selected four wild and ten cultivated soybean genotypes from different regions of the world for untargeted metabolomics investigation. Methanol and water extracts of all samples were analyzed to investigate their metabolic profiles in both positive and negative ion modes.

2.1. Identification of Compounds

Thousands of metabolite features were obtained using the Compound Discoverer 3.3 software program. Among them, 98 metabolites belonging to amino acids, organic acids, sugars, isoflavones, and soy saponins in methanol and water extracts were identified by careful analysis of the MS/MS fragments and comparison with the available literature data. A total of 64 compounds were detected with the positive and negative ion modes in the water extract, whereas 35 compounds were identified in the methanol extract. Some compounds were detected in both extracts (methanol and water) and in both ionization modes (positive and negative). The details of the compounds identified are summarized in Table 1 (methanol extract) and Table 2 (water extract).
Soybean seeds are one of the most concentrated natural sources of isoflavones in human diets [22]. In soybeans, isoflavones are found in free and conjugated forms. In conjugated forms, they can occur with sugars (glucosides) and/or acids (acetyl/malonyl). The three common free isoflavones in soybean seeds are genistein, daidzein, and glycitein. The [M + H]+ and [M − H] for daidzein, genistein, and glycitein were observed at m/z 255.0650, 271.0612, 285.0758, and 253.0506, 269.0454, 283.0611 respectively. In the present study, we identified five analogs of daidzein at tR 0.99, 5.82, 6.26, 6.58, and 8.23 min. The compounds can be conjugated with sugars, acetylated, and/or malonylated. There are several reports of the presence of such analogs in the literature during targeted analysis [23,24,25].
Amino acids were detected as the second major group of metabolites in soybean seeds. Soybean seeds provide a rich source of plant-based proteins. The protein content in soybean seeds is around 40%, as documented in the published literature [26,27]. We identified 17 free amino acids and two acetylated analogs of amino acids in the water extracts using positive and negative ion modes. Only six amino acids were detected in the methanol extracts. Similar results of the presence of amino acids from soybeans using targeted analysis after derivatization with aminopyridyl-N-hydroxysuccinimidyl carbamate (APDS) reagent [28] have been reported.
In addition to amino acids and isoflavones, over 60 other organic compounds were also detected in water and methanol extracts of soybean seeds. These include organic acids, flavonoids, sugars, saponins, fatty acids, and other phytochemicals. Organic acids are one of the major components affecting soybeans’ overall quality and taste. A recent study by Hyeon et al. reported some organic acids in soybean, such as malic acid, citric acid, and succinic acid [29]. In another recent study, ten organic acids were reported using NMR analysis by Song et al. in soybeans [30]. Similarly, the presence of epicatechin and sugars have also been reported previously by Hyeon et al. and Song et al. [29,30]. We also reported in our earlier publication the presence of sugars in soybean by ion chromatography and fatty acids after derivatization using GC-MS analysis with targeted analysis [20,21].

2.2. Comparison of Metabolites among Cultivars

All metabolites can be broadly classified into five major subgroups: amino acids, phenolics, organic acids, sugars, and miscellaneous. To compare the amounts of metabolites produced in each cultivar, all metabolites were organized based on the area under the curve for the mass ion extracted with two different solvents, water (Figure 1A) and methanol (Figure 1B).
The total amount of amino acids, one of the significant classes of metabolites obtained from water extract, varied significantly between 25% and 75% within cultivated and wild soybean cultivars. Based on the areas under the curve for the targeted mass ion maximum amount of amino acids was obtained in the Asian cultivar (C8). Assessments of protein quality of 14 soybean cultivars using targeted amino acid analysis and two-dimensional electrophoresis were investigated by Zarkadas et al. The authors indicated that all fourteen cultivars contained a good balance of essential amino acids [31]. Similar free amino acids were observed in fermented and unfermented soybeans and mung beans using targeted amino acid analysis after derivatization. The content of free amino acids was increased by 13-fold and 32-fold in fermented mung and soybeans, respectively. The authors showed that fermentation improved the amino acid content in a single soy and mung bean cultivar [32]. A similar analysis and characterization of the amino acid content of thua nao, a traditionally fermented food of northern Thailand, was studied by Dajanta et al. [33]. Significant variation in the phenolics area was seen in different cultivars. A maximum amount of phenolics was detected in the modern elite cultivar C11. The relative percentage of phenolics in other cultivars varied between 7% and 62%, with the lowest amount in cultivar C2. Similar variations in the total phenolic content (6.67 μg−1 in Pureunkong to 72.33 μg−1 in Poongsannamulkong) were observed in seven cultivars of soybeans by Kim et al. [34]. However, the maximum amount of organic acids were detected in ancestral (C9) and modern elite (C4) cultivars, with others showing variation between 25 and 77%.
However, compared to the metabolites from water extract, phenolics were the predominant metabolites in methanol extract. It has been documented that methanol, ethanol, acetone, water, and their water mixtures, with or without acids, are the most widely used solvents for extracting phenolic compounds [35,36]. Boeing et al. reported that among the pure solvents, methanol is the most effective solvent for the extraction of antioxidant compounds [37,38].
Significant variations of phenolics content were observed in the present study between cultivars (33–95%). The maximum amount of phenolics was detected in wild cultivar C13, with the lowest amount in Asian cultivar C8. This was different from the water extract, where the modern elite C11 cultivar showed the maximum amount. Similarly, the total amount of amino acid varied between 40 and 80% among cultivars. Similar to water extract maximum amount of amino acid was obtained in the Asian cultivated cultivar (C8) in methanol extract. However, the maximum amount of organic acid was detected in Asian (C2 and C5) cultivars, with others showing variation between 20 and 90%. The total amount of sugar varied between 30–90%, and Asian cultivar C8 produced the maximum amount of sugar compared to other cultivars. Since no distinct systematic variations in the area under the curve for the mass ions of different metabolites between cultivars were observed, multivariate analysis was done to differentiate between cultivars.

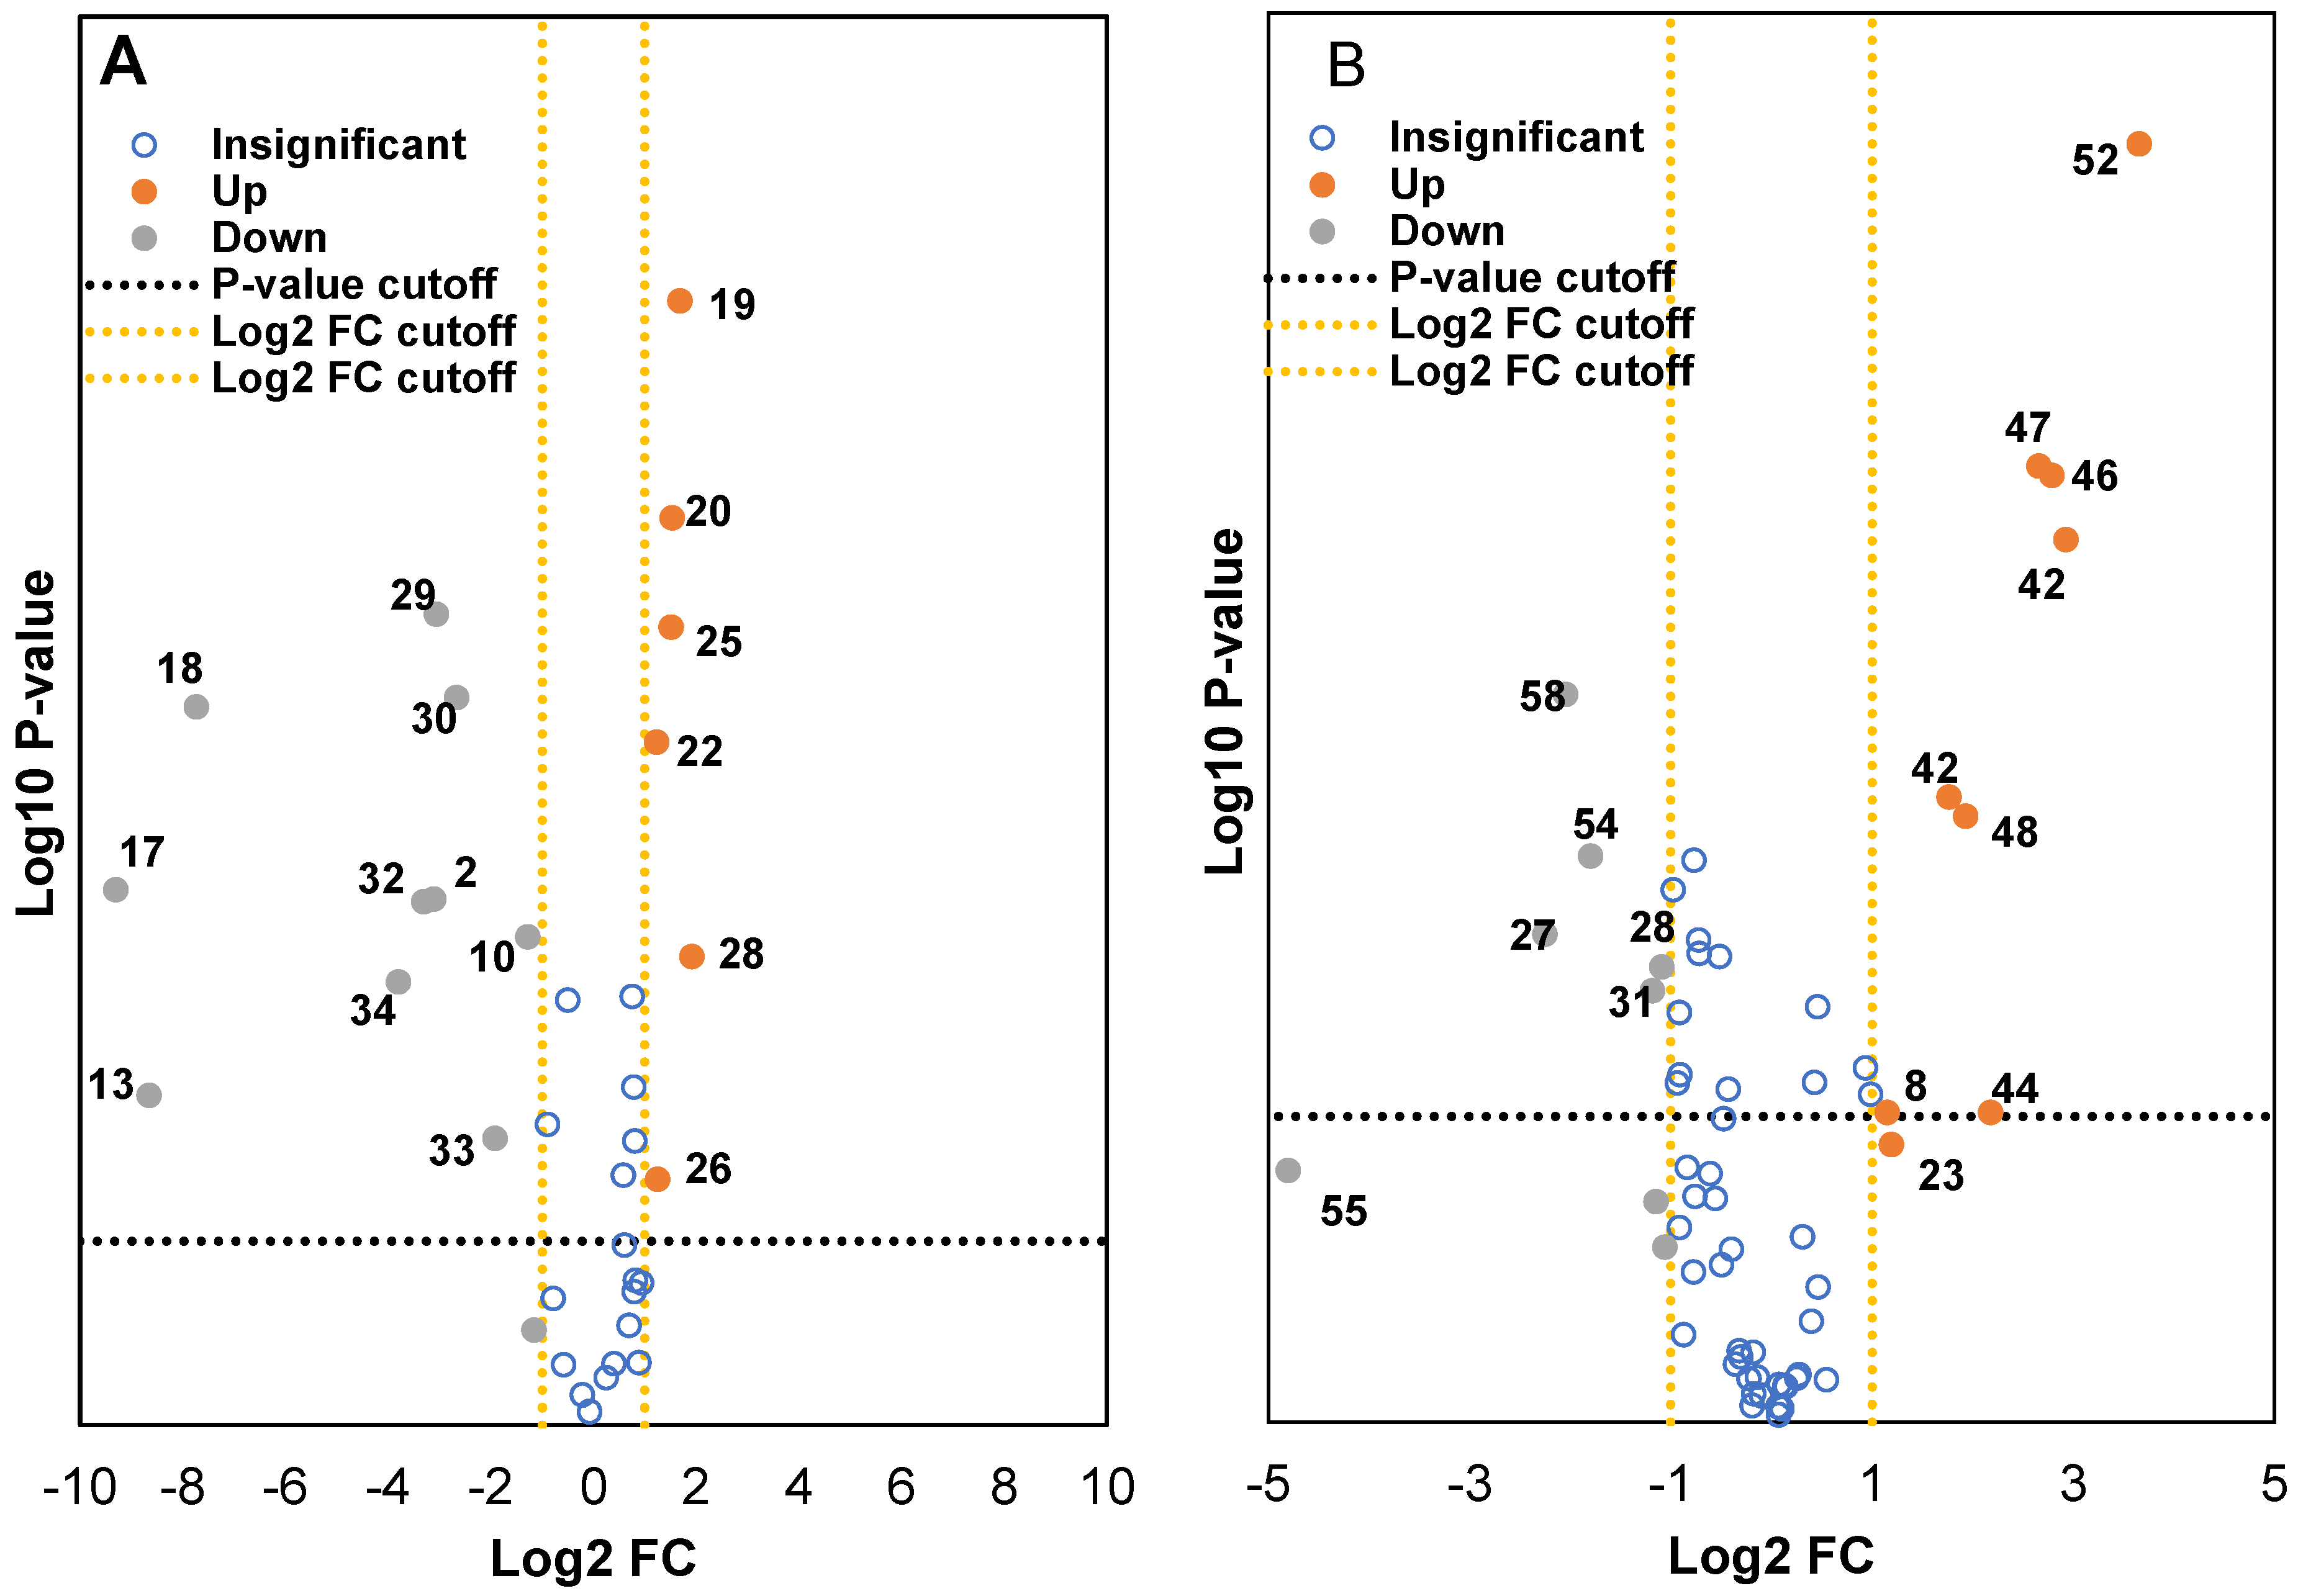
2.3. Classification of Wild and Cultivated Soybeans Using Principal Component Analysis (PCA) and Volcano Plots

Non-supervised analysis of the entire UHPLC-HRMS data using the Progenesis QI resulted in the detection of several thousands of ion features from each extract. The intensity of each ion was extracted and used for principal component analysis. PCA of the normalized intensity data of methanol and water extracts showed certain differentiation of wild and cultivated soybeans, as shown in Figure 2A and Figure 2B. The variances captured by the two components (PC1 and PC2) were between 29–49%. A further supervised partial least square discriminant analysis (PLS-DA) was performed, and the score plots are shown in Figure 3A and Figure 3B. Clear separations were observed between the wild and cultivated soybeans on the score plots; however, the separation between the cultivated soybeans was not obvious. For the metabolites from methanol extraction, the PLS-DA model resulted in the cross-validated predictive ability Q2(Y) of 39.9%. A value of 37.4% of the variance in X [R2(X)] was used to account for 21.1% of the variance of Y [R2(Y)]. For the metabolites from water extraction, the PLS-DA model resulted in the cross-validated predictive ability Q2 of 64.8%. A value of 84.2% of the variance in X [R2(X)] was used to account for 84.8% of the variance of Y [R2(Y)]. It suggested that the model from the metabolites from the water extraction gave us better prediction ability. The t-test (p-value) and fold change served as criteria for selecting the most discriminatory metabolites.
Two volcano plots were constructed to identify the metabolites from both methanol and water extracts that were differentially expressed in wild and cultivated soybeans (Figure 4A and Figure 4B). Around 150–400 metabolite ion features with selected threshold fold change (≥4) and t-tests threshold (p ≤ 0.05) were selected as cutoff values for the volcano plots to identify the prominent ions responsible for the variation of metabolites. The data were categorized into three fractions: statistically insignificant (blue), upregulated (orangish-brown), and downregulated (grey). As seen with the filtered data set, which contained several hundreds of metabolites, a few compounds were either up or downregulated between wild and cultivated soybeans. Careful analysis of the fragmentation ions and comparison with the literature data significantly reduced the number of putatively identified compounds that were downregulated in cultivated and wild soybeans. Metabolites upregulated in the methanol extract of wild soybeans compared to the cultivated soybeans were catechin analog, cynaroside, hydroxylated unsaturated fatty acid derivatives, and uridine diphosphate-N-acetylglucosamine. Similar observations were also identified by Hyeon et al., where the authors showed with PCA that amino acids, organic acids, and fatty acids were higher in cultivated black soybeans as compared to wild black soybeans [30]. However, higher content of isoflavones and other flavonoids derivative was determined in the cultivated soybeans compared to wild soybeans. Some of the metabolites identified in the water extract showed similar trends. The isoflavones analogs, soy saponin, flavonoid analogs, amino acids (glutamine and guanine), lactic acid derivative, and 6-hydroxy caproic acid were determined in higher amounts in cultivated soybean as compared to wild soybeans. Upregulated compounds in wild soybeans were tentatively identified as phloretin, hypoxanthine, glutaric acid, and tyrosine. These results will be of significant value to soybean breeders and biotechnology researchers to develop new varieties of value-added soybeans with improved qualitative traits.

3. Materials and Methods

3.1. Solvents and Materials

LC-MS-grade solvents, including acetonitrile, methanol, water, and formic acid, were used for the extraction and chromatographic separation. These organic solvents were purchased from Fisher Scientific (Pittsburgh, PA, USA). Extractions were carried out in a 15 mL centrifuge tube obtained from Thermo Scientific (Waltham, MA, USA). Polyvinylidene difluoride (PVDF) syringe filters with a pore size of 0.45 µm were purchased from National Scientific Company (Duluth, GA, USA).

3.2. Samples

Fourteen soybean cultivars were collected for this study. Four of these cultivars are wild (C3, C12–C14), and the other ten cultivated cultivars are categorized into three groups, namely, Asian landraces (C2, C5, C6, and C8), ancestral (C7 and C9), and modern elite (C1, C4, C10, and C11). All soybean samples were obtained from the soybean germplasm collection (USDA, Urbana, IL, USA). The cultivar details, i.e., accession number, origin, and genotype information (wild soybean (G. soja), soybean bred for seed traits, and soybean landraces), were previously reported in our earlier publication [22]. In the present study, soybean seeds were ground in a commercial coffee grinder and stored in an ultralow temperature (<−60 °C) freezer prior to analysis.

3.3. Extraction of Metabolites

An amount of 150 ± 0.05 milligrams (mg) of soybean seed powder of each sample were taken into 15 mL centrifuge tubes and extracted with 5 mL of methanol (polarity index 5.1) in an ultrasonic bath (power 400 watts, Advanced Sonic Processing Systems, Oxford, CT, USA) for 15 min (twice). Similarly, the extraction of samples with water (polarity index 10.2) was also carried out. The extracts were centrifuged at 4000 rpm for 15 min and filtered using a 0.45 µm PVDF filter. The clean filtrate (500 µL) containing extracted metabolites was transferred to 2 mL HPLC vials and subjected to UHPLC-MS/MS analyses. All analyses were carried out in triplicate.

3.4. Data Acquisition

The Vanquish UHPLC system (Thermo Scientific), consisting of a binary pump, column compartment, autosampler, and detectors (Photodiode Array detector) PDA and (Charged aerosol detector) CAD coupled with an Exploris 240 mass spectrometer, was used to acquire high-resolution mass data in full-scan and data-dependent acquisition mode for all samples. An aliquot of each extract was analyzed using both positive and negative ionization modes. The metabolites were separated on a C18 Agilent column (Eclipse Plus, 4.5 × 50 mm, 1.8 µm, 1200 bar pressure limit) using the gradient programs; 10% B at 0 min, gradually moves to 30% at 5 min, reach 60% at 10 min, reach 95% at 15 min, run 95% at 15–18 min, then reduced to 10% at 18.5 min. Water and acetonitrile acidified with 0.1% formic acid were used as mobile phases A and B, respectively. The flow rate and the injection volume were maintained at 0.5 mL/min, and 10 µL, respectively.
The HRMS mass range was from 100–2000 m/z, and the ESI conditions were as follows; sheath gas, auxiliary, and sweep gas at 50, 10, and 1 (arbitrary units), respectively, spray voltage at 3.4 kV, and capillary temperature at 320 °C, and vaporizer temperature 350 °C. The full scan mass spectra and three DD-MS2 events were acquired at a resolving power of 12,000. An isolation width of 1 amu, maximum ion injection time of 100 ms, stepped collision energy starting from 30, 50, and 150, and an activation time of 10 ms was used for MSn activation. Xcalibur 4.4, including FreeStyle 1.8 software packages, has been used to analyze the mass spectral data.

3.5. Identification of Compounds

Compound Discoverer (Version 3.3, Thermo Scientific) software was used for the putative identification of metabolites. This involved application of several filters, namely background subtraction, MSn fragmentation information, ΔMass (±5 ppm), minimum area, Fish score, and screening data with multiple databases (in-house mass library for soybean, mzCloud, ChemSpider, Metabolika, and other online available databases available). Furthermore, mass spectral data (molecular ion mass (m/z) and MS/MS fragmentation patterns) were compared with literature-reported data [22,23,24].

3.6. Data Processing

Raw LC-MS data were analyzed using the Compound Discoverer program to collect features for statistical analysis. The overall workflow of the program includes the detection of chromatographic peaks, extraction of the MS spectrum, deconvolution of the overlapping ions based on their isotope patterns, and integration of their respective peak areas. Acquired UHPLC-HRMS raw files were processed by using Nonlinear Progenesis QI (Durham, NC, USA) for peak detection, noise filtering, and peak alignment. Important deconvolution parameters were mass tolerance of 5 ppm, retention time tolerance of 0.2 min, peak rating threshold of 4, minimum peak intensity of 109, chromatographic threshold S/N of 1.5, CV contribution of 10, and an area contribution of 3. The resulting areas of each sample in triplicate were exported to Microsoft Excel 365 (Microsoft, Redmond, WA, USA) for volcano plot construction.

3.7. Statistical Analysis

A data matrix was generated from Progenesis Qi, including a variable index (paired m/z-retention time), sample names (observations), and peak intensities. The peak intensities in each sample were scaled by Pareto scaling before further multivariate analysis using SIMCA 13.0 (Sartorius Stedim Biotech, Umeå, Sweden). Key metabolites responsible for separating different soybean genotypes were further isolated by constructing volcano plots using the Microsoft Excel application. Based on the loadings scores and a threshold of 0.05 for the Student’s t-test of individual samples, key metabolites were selected and identified. The log10 value of the peak area was used to compare the levels of metabolites between samples.

4. Conclusions

Advances in technology, data collection, and analysis software allowed for easy differentiation of wild and cultivated soybean using UHPLC coupled with HRMS without any chemical derivatization in conjunction with PCA analysis. Several recent publications on metabolomics analysis in peer-reviewed journals often use a single aqueous alcohol solvent mixture for sample extraction. As plants produce hundreds and thousands of metabolites, it is critical to investigate multiple solvent compositions of varying polarity to optimize the extraction of a wide array of metabolites with varying polarity. In this manuscript, we showed that the metabolites extracted and putatively identified in two different solvents with polarity indexes of 5.1 and 10.2 were significantly different, with some overlapping metabolites. A total of 98 metabolites were putatively identified as isoflavones, organic acids, lipids, sugars, amino acids, saponins, and other compounds. The PCA and PLS-DA analysis of the HRMS data allowed easy classification of wild and cultivated soybeans. The major metabolites that allowed the differentiation of wild and cultivated soybeans were isoflavonoids, amino acids, and fatty acids. Several metabolites were up and downregulated in wild soybeans as compared to cultivated ones. In general, metabolites upregulated in the wild soybeans were catechin analogs, cynaroside, hydroxylated unsaturated fatty acid derivatives, amino acid, and uridine diphosphate-N-acetylglucosamine. Downregulated metabolites were identified as isoflavonoids and other minor compounds. These marker metabolites may link to characteristic performance traits desired in soybean breeding for crop improvement. In conclusion, the metabolomics extraction and workflow with solvents of varying polarity indexes can result in a significant increase in the number of metabolites extracted and identified. This will allow researchers to extract and identify multiple biomarkers that can provide insights into metabolic pathways and also increase our understanding of how plants interact with varying climatic and growth conditions. It will also enable researchers to breed plants sustainable to various abiotic and biotic stresses. In addition, the detailed metabolomics information will aid researchers in producing foods with better nutritional traits and yields. This will be needed to improve sustainable agriculture practices and alternatives to animal-based protein products that may potentially provide solutions for the global food security challenge with increasing global population and decreasing agricultural land acreages.

Author Contributions

Conceptualization, D.L.L.; methodology, F.S.T., R.R.K. and D.L.L.; formal analysis, F.S.T., R.R.K. and D.L.L.; investigation, F.S.T., R.R.K. and D.L.L.; resources, D.L.L.; data curation, F.S.T., R.R.K. and D.L.L.; writing—original draft preparation, F.S.T. and D.L.L.; writing—review and editing, F.S.T. and D.L.L.; supervision, D.L.L. Samples, S.N.; and multivariate analysis D.L.L., J.S. and F.S.T. All authors have read and agreed to the published version of the manuscript.

Funding

This work was supported by the Agricultural Research Service, US Department of Agriculture, Project# 1235-52000-066-00D.

Institutional Review Board Statement

Not applicable.

Informed Consent Statement

Not applicable.

Data Availability Statement

Data sharing is not applicable to this article.

Acknowledgments

We would like to thank James Harnly for his feedback on preparing this manuscript. We are thankful to Dechun Wang from Michigan State University for providing all original samples that were grown in Michigan.

Conflicts of Interest

The authors declare no conflict of interest.

Sample Availability

Not applicable.

References

  1. Available online: https://ourworldindata.org/soy (accessed on 22 March 2023).
  2. do Prado, F.G.; Pagnoncelli, M.G.B.; de Melo Pereira, G.V.; Karp, S.G.; Soccol, C.R. Fermented soy products and their potential health benefits: A Review. Microorganisms 2022, 10, 1606. [Google Scholar] [CrossRef]
  3. Verma, A.; Chandrakar, M.R. Compound growth rate (CGR) of area, production & productivity of soybean in Chhattisgarh state. Pharma Innov. 2023, 12, 2774–2779. [Google Scholar]
  4. Available online: https://www.nass.usda.gov/Newsroom/2023/01-12-2023.php (accessed on 21 March 2023).
  5. Kim, I.S.; Kim, C.H.; Yang, W.S. Physiologically active molecules and functional properties of soybeans in human health—A current perspective. Int. J. Mol. Sci. 2021, 22, 4054. [Google Scholar] [CrossRef]
  6. Erb, M.; Kliebenstein, D.J. Plant secondary metabolites as defenses, regulators, and primary metabolites: The blurred functional trichotomy. Plant Physiol. 2020, 184, 39–52. [Google Scholar] [CrossRef]
  7. Fan, M.; Lian, W.; Li, T.; Fan, Y.; Rao, Z.; Li, Y.; Qian, H.; Zhang, H.; Wu, G.; Qi, X.; et al. Metabolomics approach reveals discriminatory metabolites associating with the blue pigments from Vaccinium bracteatum Thunb. Leaves at different growth stages. Ind. Crops Prod. 2020, 147, 112252. [Google Scholar] [CrossRef]
  8. Li, P.; Xiao, Z.; Sun, J.; Oyang, X.; Xie, X.; Li, Z.; Tian, X.; Li, J. Metabolic regulations in lettuce root under combined exposure to perfluorooctanoic acid and perfluorooctane sulfonate in hydroponic media. Sci. Total Environ. 2020, 726, 138382. [Google Scholar] [CrossRef]
  9. Huberty, M.; Choi, Y.; Heinen, R.; Bezemer, T.M. Aboveground plant metabolomic responses to plant-soil feedbacks and herbivory. J. Ecol. 2020, 108, 1703–1712. [Google Scholar] [CrossRef]
  10. Wu, L.; Gao, X.; Xia, F.; Joshi, J.; Borza, T.; Wang-Pruski, G. Biostimulant and fungicidal effects of phosphite assessed by GC-TOF-MS analysis of potato leaf metabolome. Physiol. Mol. Plant Pathol. 2019, 106, 49–56. [Google Scholar] [CrossRef]
  11. Wang, X.; Guo, R.; Li, M.; Liu, Y.; Zhao, M.; Fu, H.; Liu, X.; Wang, S.; Shi, L. Metabolomics reveals the drought-tolerance mechanism in wild soybean (Glycine soja). Acta Physiol. Plant 2019, 41, 161. [Google Scholar] [CrossRef]
  12. Valette, M.; Rey, M.; Gerin, F.; Comte, G.; Wisniewski-Dyé, F. A common metabolomic signature is observed upon inoculation of rice roots with various rhizobacteria. J. Integr. Plant Biol. 2020, 62, 228–246. [Google Scholar] [CrossRef]
  13. Clarke, J.D.; Alexander, D.C.; Ward, D.P.; Ryals, J.A.; Mitchell, M.W.; Wulff, J.E.; Guo, L. Assessment of genetically modified soybean in relation to natural variation in the soybean seed metabolome. Sci. Rep. 2013, 3, 3082. [Google Scholar] [CrossRef] [Green Version]
  14. Chebrolu, K.K.; Fritschi, F.B.; Ye, S.; Krishnan, H.B.; Smith, J.R.; Gillman, J.D. Impact of heat stress during seed development on soybean seed metabolome. Metabolomics 2016, 12, 28. [Google Scholar] [CrossRef]
  15. Gupta, R.; Min, C.W.; Kim, S.W.; Wang, Y.; Agrawal, G.K.; Rakwal, R.; Kim, S.G.; Lee, B.W.; Ko, J.M.; Baek, I.Y.; et al. Comparative investigation of seed coats of brown- versus yellow-colored soybean seeds using an integrated proteomics and metabolomics approach. Proteomics 2015, 15, 1706–1716. [Google Scholar] [CrossRef]
  16. Bragagnolo, F.S.; Funari, C.S.; Ibáñez, E.; Cifuentes, A. metabolomics as a tool to study underused soy parts: In search of bioactive compounds. Foods 2021, 10, 1308. [Google Scholar] [CrossRef]
  17. Hoeck, J.; Fehr, W.; Murphy, P.; Welke, G. Influence of genotype and environment on isoflavone contents of soybean. Crop Sci. 2000, 40, 48–51. [Google Scholar] [CrossRef]
  18. Caldwell, C.R.; Britz, S.J.; Mirecki, R.M. Effect of temperature, elevated carbon dioxide, and drought during seed development on the isoflavone content of dwarf soybean [Glycine max (L.) Merrill] grown in controlled environments. J. Agric. Food Chem. 2005, 53, 1125–1129. [Google Scholar] [CrossRef]
  19. Joshi, T.; Qiuming, Y.; Levi, D.; Brechenmacher, L.; Valliyodan, B.; Stacey, G.; Nguyen, H.; Xu, D. SoyMetDB: The soybean metabolome database. In Proceedings of the 2010 IEEE International Conference on Bioinformatics and Biomedicine (BIBM), Hong Kong, China, 18–21 December 2010; pp. 203–208. [Google Scholar]
  20. John, K.M.M.; Savithiry, N.; Devanand, L. Metabolite changes in nine different soybean varieties grown under field and greenhouse conditions. Food Chem. 2016, 211, 347–355. [Google Scholar] [CrossRef] [Green Version]
  21. Kotha, R.R.; Natarajan, S.; Wang, D.; Luthria, D.L. Compositional analysis of non-polar and polar metabolites in 14 soybeans using spectroscopy and chromatography tools. Foods 2019, 8, 557. [Google Scholar] [CrossRef] [Green Version]
  22. Bi, W.; Zhao, G.; Zhou, Y. Metabolomics analysis of flavonoids in seeds and sprouts of two Chinese soybean cultivars. Sci. Rep. 2022, 12, 5541. [Google Scholar] [CrossRef]
  23. Mi, J.L.; Ill-Min, C.; Hunjung, K.; Mun, Y.J. High-resolution LC–ESI-TOF-mass spectrometry method for fast separation, identification, and quantification of 12 isoflavones in soybeans and soybean products. Food Chem. 2015, 176, 254–262. [Google Scholar]
  24. Yeon, H.L.; Bokyeong, K.; Seung-Ryul, H.; Kyun, K.; Jin, H.L. Rapid characterization of metabolites in soybean using ultra-high-performance liquid chromatography coupled with electrospray ionization quadrupole time-of-flight mass spectrometry (UPLC-ESI-Q-TOF-MS/MS) and screening for α-glucosidase inhibitory and antioxidant properties through different solvent systems. J. Food Drug Anal. 2018, 26, 277–291. [Google Scholar]
  25. Kenneth, D.R.S.; Aedin, C. Dietary isoflavones: Biological effects and relevance to human health. J. Nutr. 1999, 129, 758S–767S. [Google Scholar]
  26. Sharma, S.; Kaur, M.; Goyal, R.; Gill, B.S. Physical characteristics and nutritional composition of some new soybean (Glycine max (L.) Merrill) genotypes. J. Food Sci. Technol. 2014, 51, 551–557. [Google Scholar] [CrossRef] [Green Version]
  27. Patil, G.; Mian, R.; Vuong, T.; Pantalone, V.; Song, Q.; Chen, P.; Shannon, G.J.; Carter, T.C.; Nguyen, H.T. Molecular mapping and genomics of soybean seed protein: A review and perspective for the future. Theor. Appl. Genet. 2017, 130, 1975–1991. [Google Scholar] [CrossRef] [Green Version]
  28. Chotekajorn, A.; Hashiguchi, T.; Hashiguchi, M.; Tanaka, H.; Akashi, R. Evaluation of seed amino acid content and its correlation network analysis in wild soybean (Glycine soja) germplasm in Japan. Plant Genet. Resour. 2021, 19, 35–43. [Google Scholar] [CrossRef]
  29. Hyeon, H.; Xu, J.L.; Kim, J.K.; Choi, Y. Comparative metabolic profiling of cultivated and wild black soybeans reveals distinct metabolic alterations associated with their domestication. Food Res. Int. 2020, 134, 109290. [Google Scholar] [CrossRef]
  30. Song, J.; Wu, G.; Li, T.; Liu, C.; Li, D. Changes in the sugars, amino acids and organic acids of post-harvest spermine-treated immature vegetable soybean (Glycine max L. Merr.) as determined by 1H NMR spectroscopy. Food Prod. Process. Nutr. 2020, 2, 7. [Google Scholar] [CrossRef]
  31. Zarkadas, C.G.; Gagnon, C.; Gleddie, S.; Khanizadeh, S.; Cober, E.R.; Guillemette, R.J.D. Assessment of the protein quality of fourteen soybean [Glycine max (L.) Merr.] cultivars using amino acid analysis and two-dimensional electrophoresis. Food Res. Int. 2007, 40, 129–146. [Google Scholar] [CrossRef]
  32. Ali, N.M.; Yeap, S.-K.; Yusof, H.M.; Beh, B.-K.; Ho, W.-Y.; Koh, S.-P.; Abdullah, M.P.; Alitheen, N.B.; Long, K. Comparison of free amino acids, antioxidants, soluble phenolic acids, cytotoxicity and immunomodulation of fermented mung bean and soybean. J. Sci. Food Agric. 2016, 96, 1648–1658. [Google Scholar] [CrossRef]
  33. Dajanta, K.; Apichartsrangkoon, A.; Chukeatirote, E.; Frazier, R.A. Free-amino acid profiles of thua nao, a Thai fermented soybean. Food Chem. 2011, 125, 342–347. [Google Scholar] [CrossRef]
  34. Kim, E.H.; Kim, S.H.; Chung, J.I.; Chi, H.Y.; Kim, J.A.; Chung, I.M. Analysis of phenolic compounds and isoflavones in soybean seeds (Glycine max (L.) Merill) and sprouts grown under different conditions. Eur. Food Res. Technol. 2006, 222, 201–208. [Google Scholar] [CrossRef]
  35. Naczk, M.; Shahidi, F. Phenolics in cereals, fruits and vegetables: Occurrence, extraction and analysis. J. Pharm. Biomed. Anal. 2006, 41, 1523–1542. [Google Scholar] [CrossRef]
  36. Bunea, C.I.; Pop, N.; Babeş, A.C.; Matea, C.; Dulf, F.V.; Bunea, A. Carotenoids, total polyphenols and antioxidant activity of grapes (Vitis vinifera) cultivated in organic and conventional systems. Chem. Cent. J. 2012, 6, 66–74. [Google Scholar] [CrossRef] [Green Version]
  37. Boeing, J.S.; Barizão, E.O.; e Silva, B.C.; Montanher, P.F.; de Cinque Almeida, V.; Visentainer, J.V. Evaluation of solvent effect on the extraction of phenolic compounds and antioxidant capacities from the berries: Application of principal component analysis. Chem. Cent. J. 2014, 8, 48. [Google Scholar] [CrossRef]
  38. Zhao, H.; Dong, J.; Lu, J.; Chen, J.; Li, Y.; Shan, L.; Lin, Y.; Fan, W.; Gu, G. Effects of extraction solvent mixtures on antioxidant activity evaluation and their extraction capacity and selectivity for free phenolic compounds in barley (Hordeum vulgare L.). J. Agric. Food Chem. 2006, 54, 7277–7286. [Google Scholar] [CrossRef]
Figure 1. (A) Comparative analysis of all metabolites based on area under the curve for four wild and ten cultivated soybeans extracted with water. All samples were analyzed in triplicate, and the averages of the triplicates have been reported. (B) Comparative analysis of all metabolites based on area under the curve for four wild and ten cultivated soybeans extracted with methanol. All samples were analyzed in triplicate, and the averages of the triplicates have been reported.
Molecules 28 05507 g001
Figure 2. Principal component analysis of the high-resolution mass spectral data of all metabolites for four wild and ten cultivated soybeans extracted with methanol (A) and water (B).
Molecules 28 05507 g002
Figure 3. Partial least squares discriminate analysis (PLS-DA) of the high-resolution mass spectral data of all metabolites for four wild and ten cultivated soybeans extracted with methanol (A) and water (B).
Molecules 28 05507 g003
Figure 4. Volcano plots of identified metabolites from ten cultivated and four wild soybeans extracted with methanol (A) and water (B). The numbers noted in the score plot are marked as * in Table 1 for the methanol extract and Table 2 for the water extract.
Molecules 28 05507 g004
Table 1. Identification of metabolites using high-resolution mass spectrometry of methanol extract of fourteen soybean cultivars (ten cultivated and four wild) in positive and negative ion modes.
No.IdentificationFormulatR (min)Calc. Mass m/z [M]Observed Mass m/z [M ± H]±1(±) Fragment Ions
1CholineC5H13NO0.93103.0997104.106960.0806
2IditolC6H14O60.94182.0790181.0717
3Malic acidC4H6O50.97134.0215133.0142
4Citric acidC6H8O70.98192.0270191.0197
5Furoic acidC5H4O30.99112.0161111.008867.0187
6CatechinC15H14O61.00290.0791289.0718245.0812, 203.0707, 187.0398, 137.0240, 109.0291
7Glutamic acidC5H9NO41.04147.0531146.0458102.0556, 84.0451
8Gluconic acidC6H12O71.05196.0583195.0510129.0189, 75.0085, 59.0137
9Aspartic acidC4H7NO41.06133.0375132.0302115.0032, 88.0401
10HistidineC6H9N3O21.09155.0695156.0768110.0703, 93.0439
11Malic acidC4H6O51.20134.0215133.0142115.0033, 71.0136
12IsoleucineC6H13NO21.27131.0946132.101986.0957, 69.0693
13CynarosideC21H20O111.31448.1006449.107968.997
14UDP-N-acetylglucosamine *C17H27N3O17P21.34607.0818606.0745384.9831, 158.9254, 96.9692
15TryptophanC11H12N2O21.36204.0898205.0971188.0692, 146.0589, 118.0642
16PhenylalanineC9H11NO21.38165.0789166.0863120.0803, 103.0538, 91.0539
17Catechin *C15H14O61.47290.0791289.0718187.0398, 137.0240, 109.0291
18Catechin analog *C15H14O64.41290.0789289.0717245.0812, 203.0707, 137.0240, 109.0291
193,5-Dihydroxy-2-(4-hydroxyphenyl)-4-oxo-3,4-dihydro-2H-chromen-7-yl hexopyranosideC21H22O114.57450.1162449.1089287.0554, 259.0604, 125.0240, 57.0345
20ApigetrinC21H20O104.91432.1056431.0983269.0446, 117.0339, 89.0240
21DaidzinC21H20O95.82416.1106417.1179227.0684, 199.0738, 137.0223
22DaidzeinC15H10O46.26254.0577255.0650225.0552, 208.0527, 113.0295, 91.0187, 65.0033
23Apigetrin analogC21H20O106.47432.1054477.1035269.0446, 117.0339, 89.0240
24GlyciteinC16H12O56.64284.0684283.0612268.0368, 240.0421
25GenisteinC15H10O57.15270.0527269.0454225.0547, 181.0654
26Daidzein analogC15H10O48.28254.0579253.0506209.0598, 133.0292, 91.0186, 65.0031
27NaringeninC15H12O59.26272.0685271.0612151.0028, 119.0498, 93.0341, 65.0032
28Genistein analogC15H10O59.53270.0528269.0455225.0547, 181.0654
29Corchorifatty acid FC18H32O59.61328.2251327.2178229.1441, 211.13303, 171.1020, 85.0291, 57.0345
30(15Z)-9,12,13-Trihydroxy-15-octadecenoic acid *C18H34O510.08330.2407329.2334171.1020, 139.1123, 99.0812
31Soyasaponin IC48H78O1810.76942.5182941.5105615.3881, 457.3671, 205.0709, 143.0345, 113.0241
32(±)9-HpODE *C18H32O412.12312.2301311.2228275.2005, 183.0115, 79.9569
33(+/−)9,10-dihydroxy-12Z-octadecenoic acid *C18H34O413.00314.2458313.2385277.2168, 201.1125, 171.1022
3413(S)-HOTrE *C18H30O313.95294.2195293.2123195.1390, 95.9597, 79.9570
* Differentiating metabolites.
Table 2. Identification of metabolites using high-resolution mass spectrometry of water extract of fourteen soybean cultivars (ten cultivated and four wild) in positive and negative ion modes.
No.IdentificationFormulatR (min)Calc. Mass m/z [M]Observed
m/z [M ± H]±1
(±) Fragment Ions
1ArginineC6H14N4O20.83174.1116173.1044156.0778, 131.0822, 114.0557
2HistidineC6H9N3O20.85155.0695156.0768110.0703, 93.0439
3Glutamic acidC5H9NO40.93147.0531146.0458ND
4GlucoseC6H12O60.93180.0634179.0561101.024289.0242, 71.01369, 59.0138
5N-acetylornithineC7H14N2O30.94174.1004173.0931131.0822, 85.0769
6D-RiboseC5H10O50.95150.0528149.0455131.0346, 89.0243, 71.0137, 59.0138
7Malic acidC4H6O50.97134.0215133.0142115.0034, 89.0242, 72.9929, 71.0137
8Glutamine *C5H10N2O30.99146.0692147.0765127.0509, 109.0404, 84.0452
9UridineC9H12N2O61.00244.0695243.0623200.0562, 152.0351, 110.0245
10Citric acidC6H8O71.00192.0269191.0196173.0090, 111.0085, 87.0087
11ArginineC6H14N4O21.00174.1117175.1189156.0778, 131.0822, 114.0557
12Furoic acidC5H4O31.01112.0161111.008867.0189
13Pantothenic acidC9H17NO51.01219.1106218.1033146.0821, 88.0402
14ThreonineC4H9NO31.02119.0582120.0655116.0696, 70.0645
15AsparagineC4H8N2O31.03132.0535133.0608116.0333, 87.0546, 74.0231
16ProlineC5H9NO21.03115.0633116.070670.0645
17Trans-Aconitic acidC6H6O61.03174.0164173.0092129.0191, 111.0085, 85.02936
18CytosineC4H5N3O1.04111.0432112.050595.0232, 69.0442
19Glutamic acidC5H9NO41.04147.0532148.0605128.0348, 102.0556, 84.0451
20LysineC6H14N2O21.04146.1055147.1128130.0852, 84.0801, 56.0491
21ValineC5H11NO21.08117.0789118.0862100.0748, 72.0802, 55.0538
22AdenineC5H5N51.11135.0545136.0617119.0343
23Guanine *C5H5N5O1.11151.0494152.0567135.0294, 110.0341
24Succinic acidC4H6O41.13118.0266117.019373.0293
25N-AcetylornithineC7H14N2O31.21174.1005175.1077131.0822, 85.0769
26GuanosineC10H13N5O51.21283.0917282.0844150.0419, 108.0202
27Hypoxanthine *C5H4N4O1.21136.0385137.0458119.0342, 110.0340, 94.0392
28Tyrosine *C9H11NO31.22181.0739180.0666163.0396, 119.0498, 72.0088
29MethionineC5H11NO2S1.25149.0511150.0583133.0307, 104.0520, 61.0102
30IsoleucineC6H13NO21.30131.0946132.101886.0957, 69.0693
31Glutaric acid *C5H8O41.32132.0422131.0349113.0240, 87.0449, 69.0343
32LeucylprolineC11H20N2O31.40228.1473229.1546116.0696, 86.0957, 70.0645
33Trans-3-Indoleacrylic acidC11H9NO21.80187.0632188.0705170.0586, 146.0588, 118.0641
34TryptophanC11H12N2O21.80204.0898205.0971188.0692, 146.0589, 118.0642
35Glycidic acidC10H10O32.17178.0629177.0557133.0656, 71.01366
3612-O-β-D-Glucopyranosyloxyjasmonic acidC18H28O94.00388.1732387.1659207.1023, 101.0242, 89.0242, 59.0138
37SinensinC21H22O114.26450.1162449.1089287.0555, 259.0605, 125.02401
38Dihydrophaseic acidC15H22O54.63282.1468281.1395171.1175, 123.0813, 87.00853
3912-O-β-D-Glucopyranosyloxyjasmonic acidC18H28O94.95388.1733387.166207.1023, 101.0242, 89.0242, 59.0138
40Daidzin *C21H20O95.30416.1108417.1181227.0684, 199.0738, 137.0223
41GlyciteinC16H12O55.33284.0684283.0611268.0371, 240.0422
42Hdroxycaproic acid *C6H12O35.39132.0786131.0714113.0606, 85.0656, 57.0345
43N-Acetyl-l-phenylalanineC11H13NO35.72207.0895206.0823164.0713, 91.0551, 70.0296
44Pheyllactic acid *C9H10O35.99166.0629165.0557147.0449, 119.0501, 72.9929
452-(acetylamino)-3-(1H-indol-3-yl)propanoic acidC13H14N2O36.30246.1004245.0931116.0349, 98.0244, 74.0245, 58.0297
46Apigetrin *C21H20O106.34432.1056431.0983268.0368, 239.0335, 59.0137
47Genistin *C21H20O106.47432.1057433.1129271.0579, 215.0685, 153.0170
48Daidzein *C15H10O46.48254.0578253.0505208.0527, 113.0295, 91.0187, 65.0033
49AstragalinC21H20O116.51448.1005447.0932284.0320, 227.0345, 65.0032
50Glycitein analogC16H12O56.56284.0684283.0611268.0371, 240.0422
51Octyl glucosideC14H28O66.72292.1886291.181385.0292, 59.0137
527-Hydroxy-2-(4-hydroxyphenyl)-4-oxo-3,4-dihydro-2H-chromen-5-yl β-d-glucopyranoside *C21H22O107.04434.1213433.1139271.0607, 243.0667, 151.0034, 93.0343
53Azelaic acidC9H16O47.32188.1048187.0976125.0969, 97.0656
54Galangin *C15H10O57.49270.0527271.0599215.0686, 153.0169, 115.0532
55Phloretin *C15H14O57.77274.0841273.0768167.0346, 123.0447, 93.0343
56Abscisic acidC15H20O48.01264.1362263.1288219.1386, 204.2252, 136.0526
57Daidzein analogC15H10O48.18254.0578253.0505225.0552, 132.0214, 91.0187, 65.0033
585,7-dihydroxy-3-(4-methoxyphenyl)-4H-chromen-4-one *C16H12O58.56284.0685285.0757229.0839, 197.0579, 118.0402
59GenisteinC15H10O59.43270.0526269.0454225.0557, 181.0654
60(15Z)-9,12,13-trihydroxy-15-octadecenoic acidC18H34O510.01330.2405329.2332211.1335, 171.1023, 139.1125, 99.0813
61Tetradecanedioic acidC14H26O410.63258.1831257.1758239.1644
62Soyasaponin IC48H78O1810.77942.5182941.5107733.4519, 457.3673, 257.0659, 101.0242
63(±)9-HpODEC18H32O411.34312.2301311.2228171.1023, 139.1125, 113.0968
64Thapsic acidC16H30O411.75286.2144285.2071267.2065, 59.0137
* Differentiating metabolites.
Disclaimer/Publisher’s Note: The statements, opinions and data contained in all publications are solely those of the individual author(s) and contributor(s) and not of MDPI and/or the editor(s). MDPI and/or the editor(s) disclaim responsibility for any injury to people or property resulting from any ideas, methods, instructions or products referred to in the content.

