Mass Spectra Fitting as Diagnostic Tool for Magnetron Plasmas Generated in Ar and Ar/H2 Gases with Tungsten Targets
Abstract
:1. Introduction
2. Setup Details and Description of the Experimental Mass Spectra
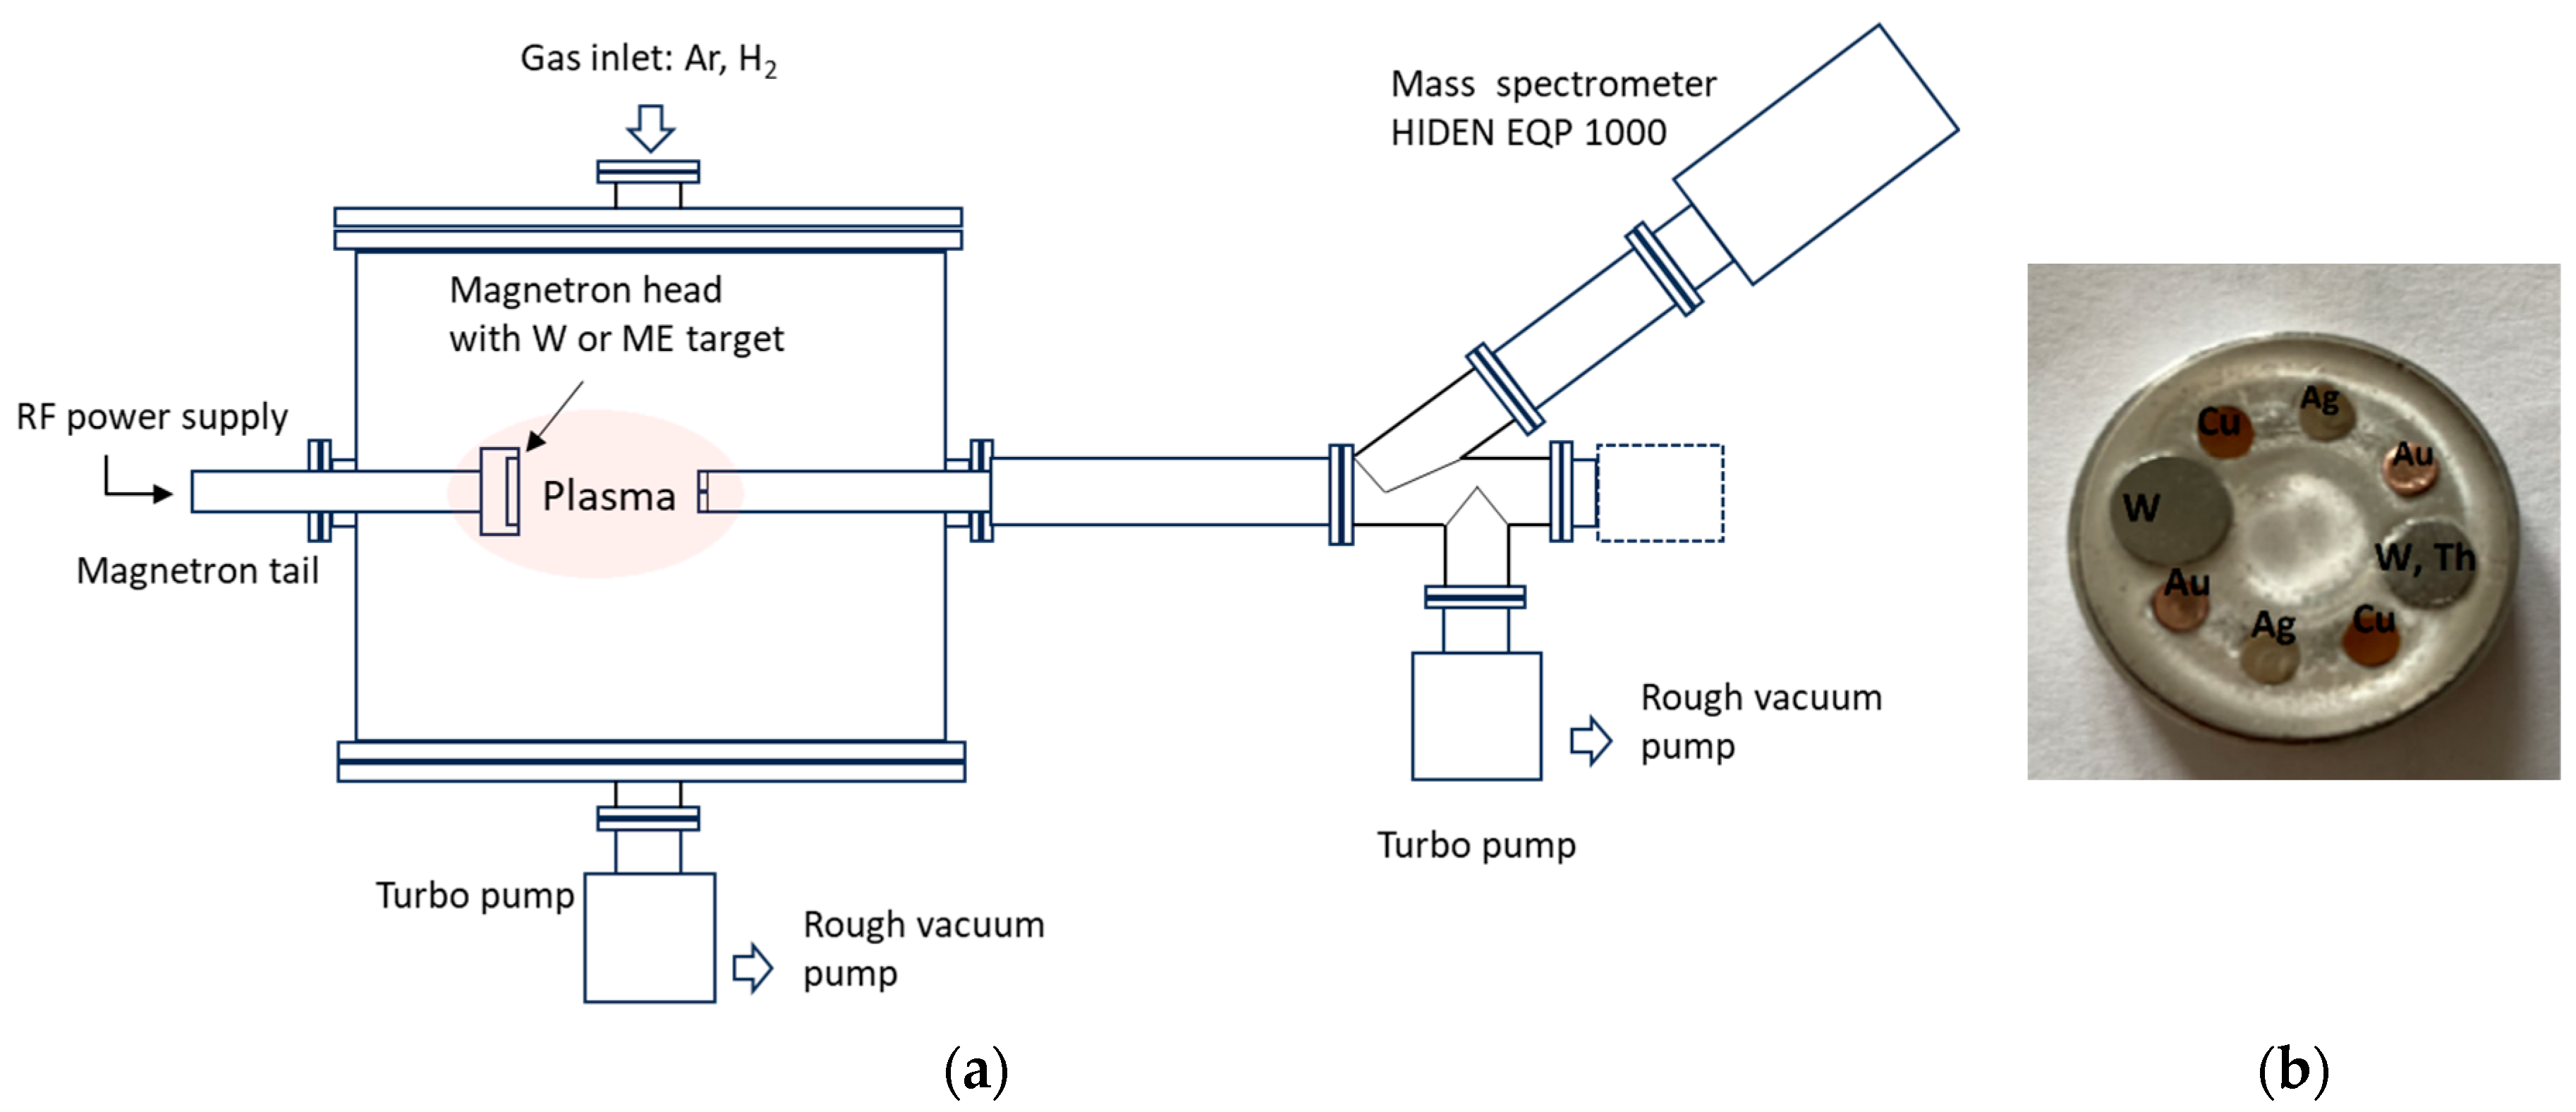
2.1. Experimental Setup and Operating Parameters
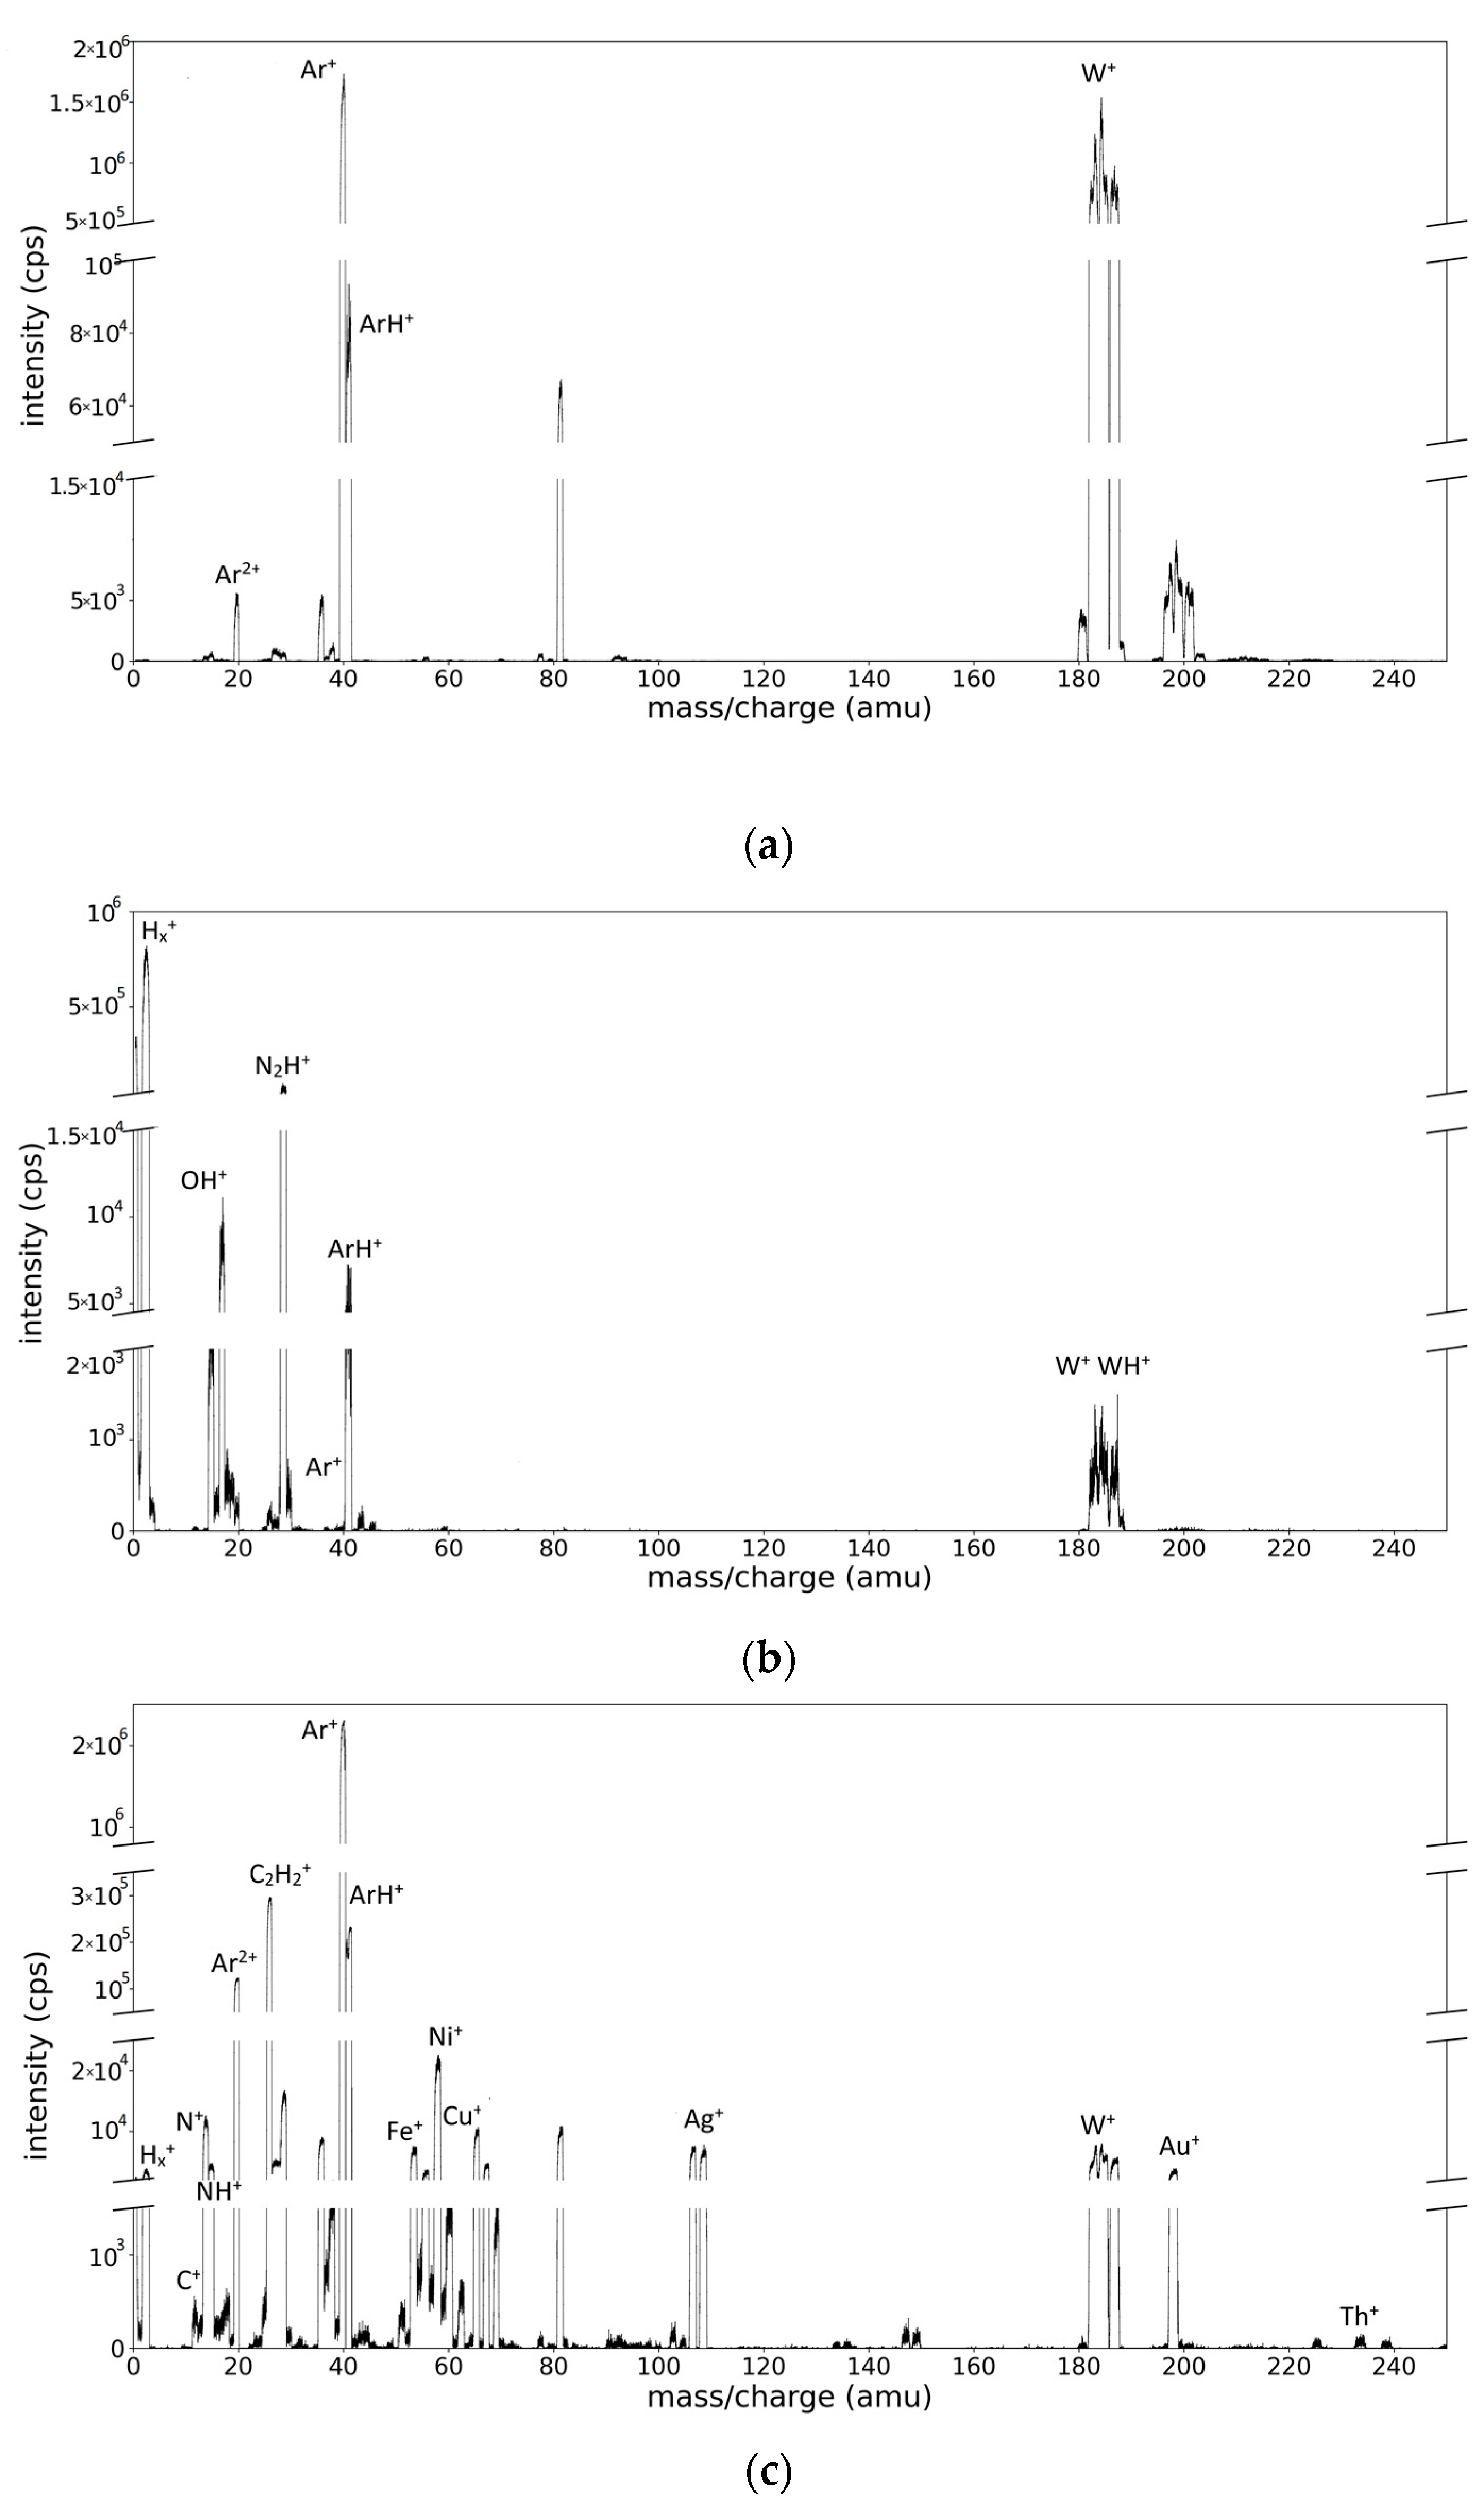
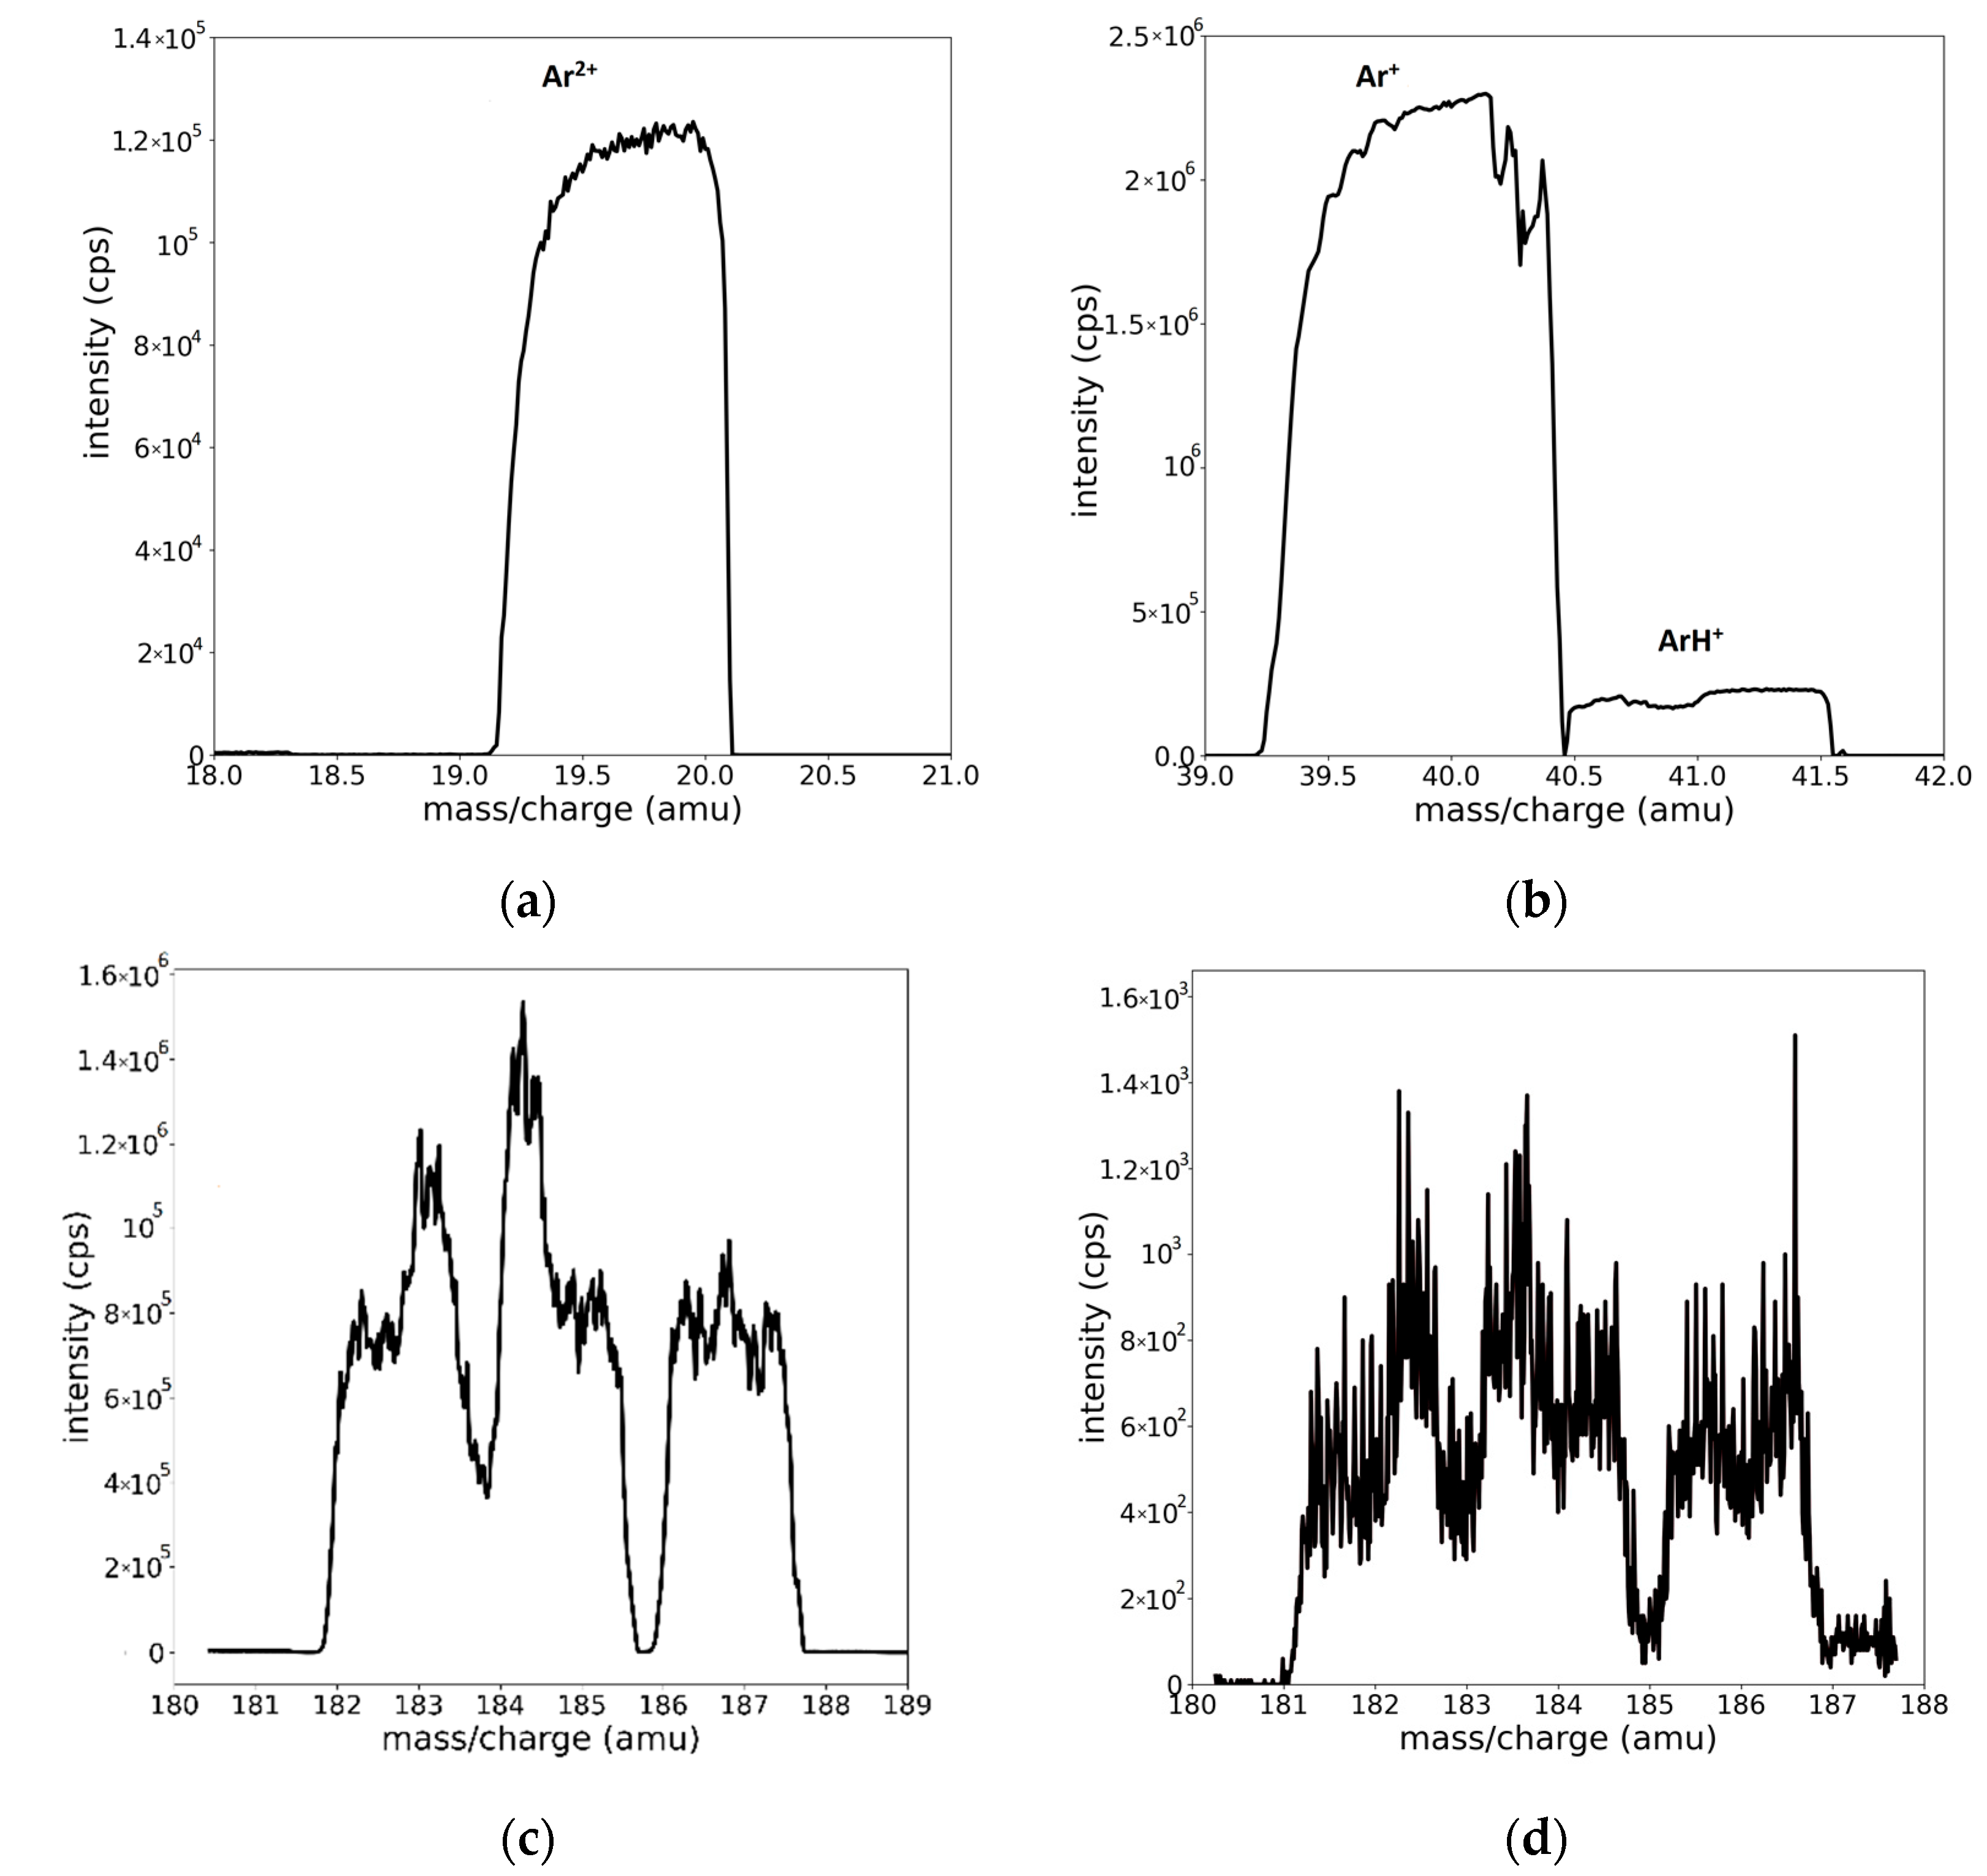
2.2. Description of the Recorded Mass Spectra
3. Peak Fitting Procedure and Results
3.1. Selection of the Peaks Fitting Function
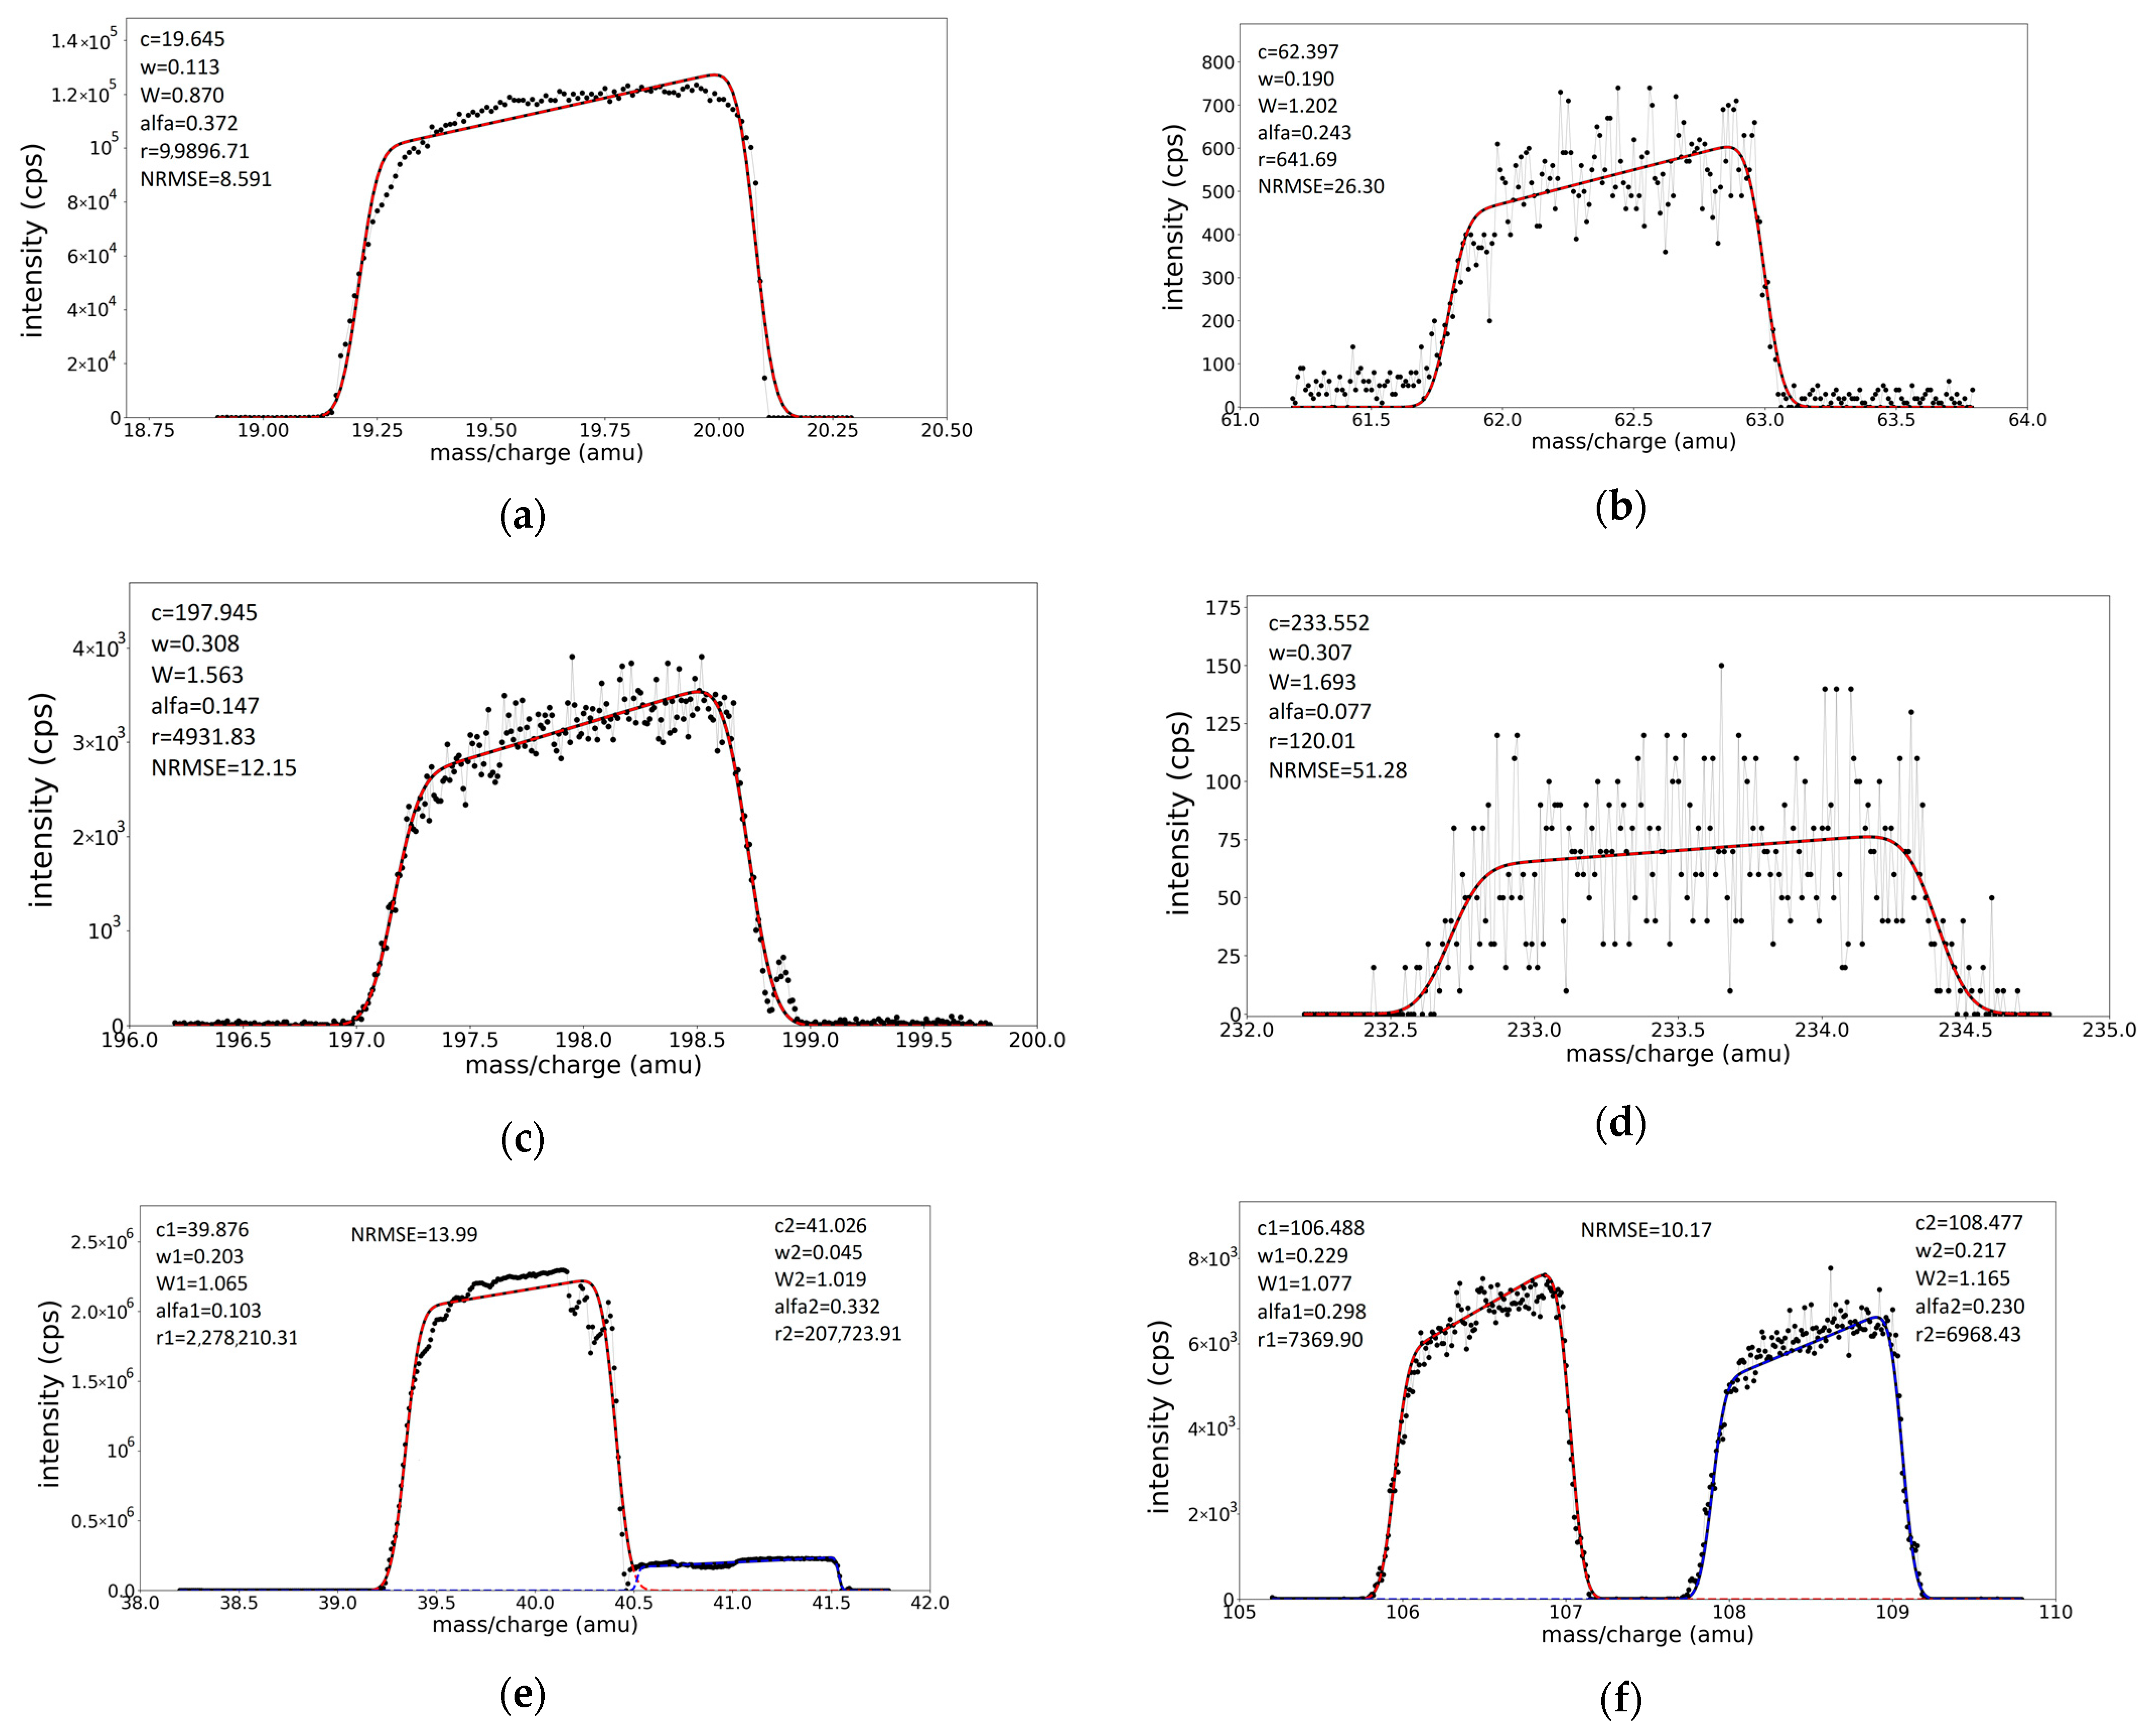
3.2. The Fitting Procedure and Its Validation on Individual Experimental Peaks
3.3. Spectra Calibration for Peak Position and Peak Widths
3.4. Validation of the Fitting Procedure for Superposed Peaks
- (A)
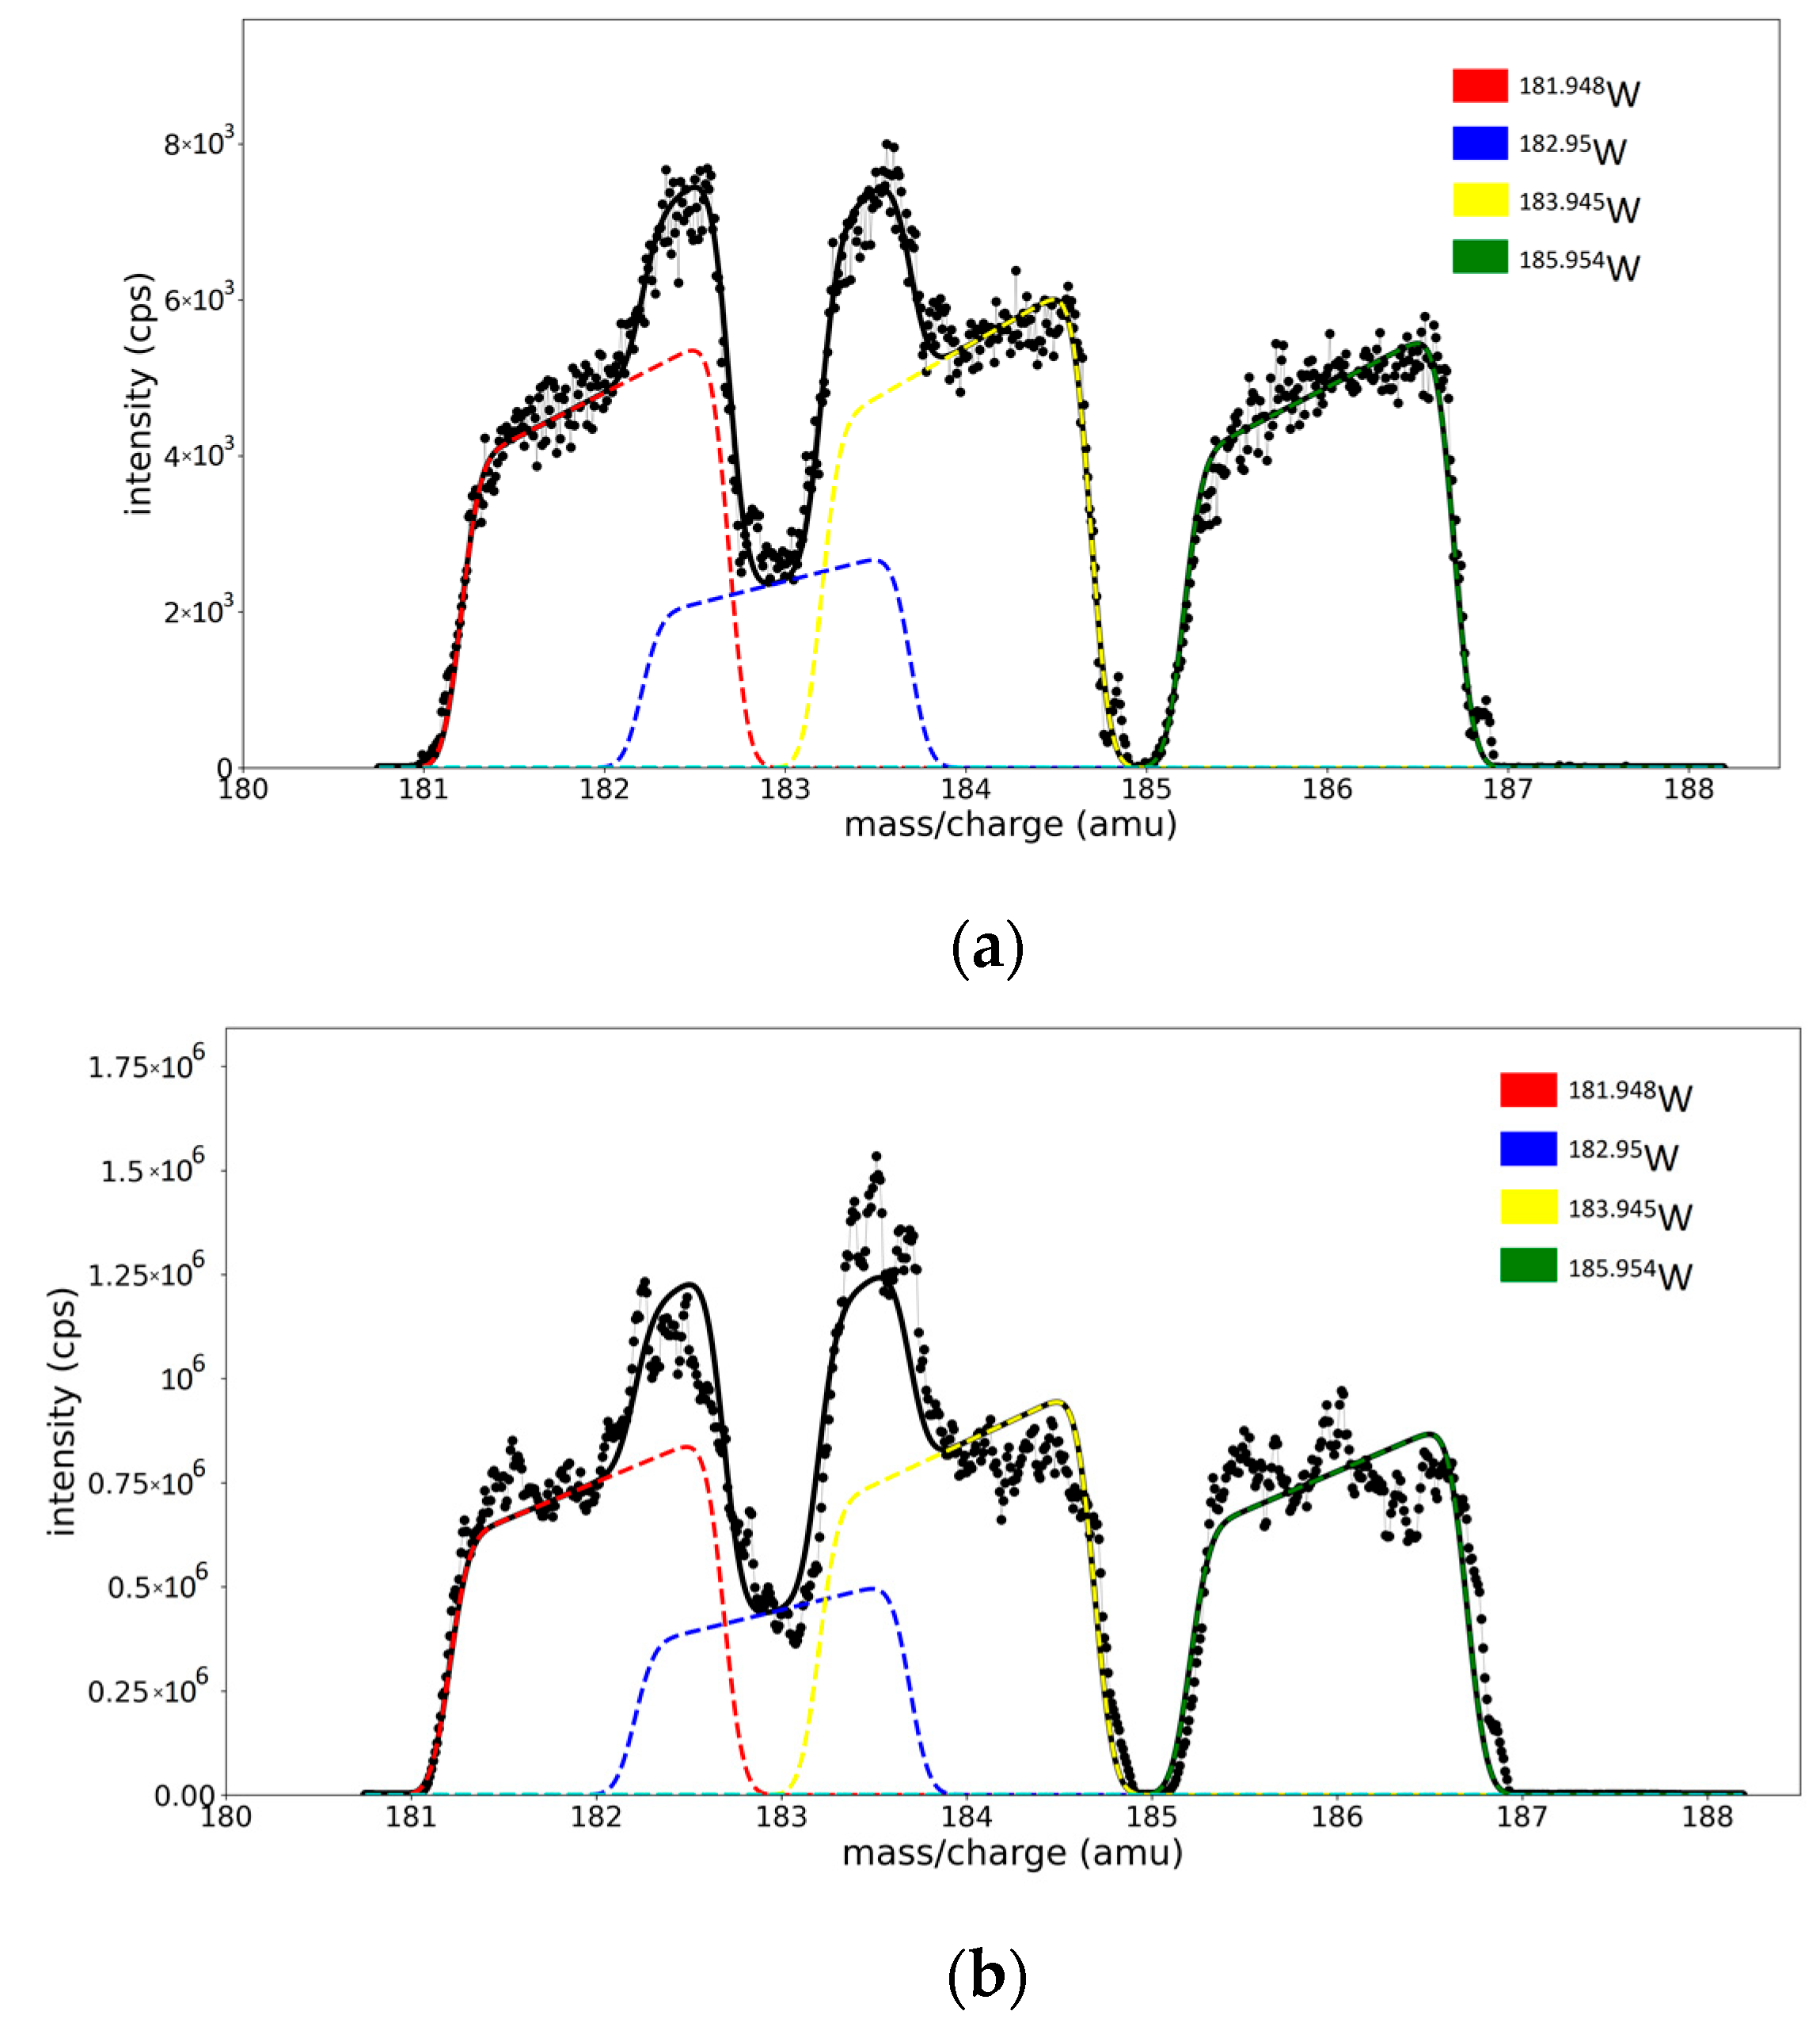
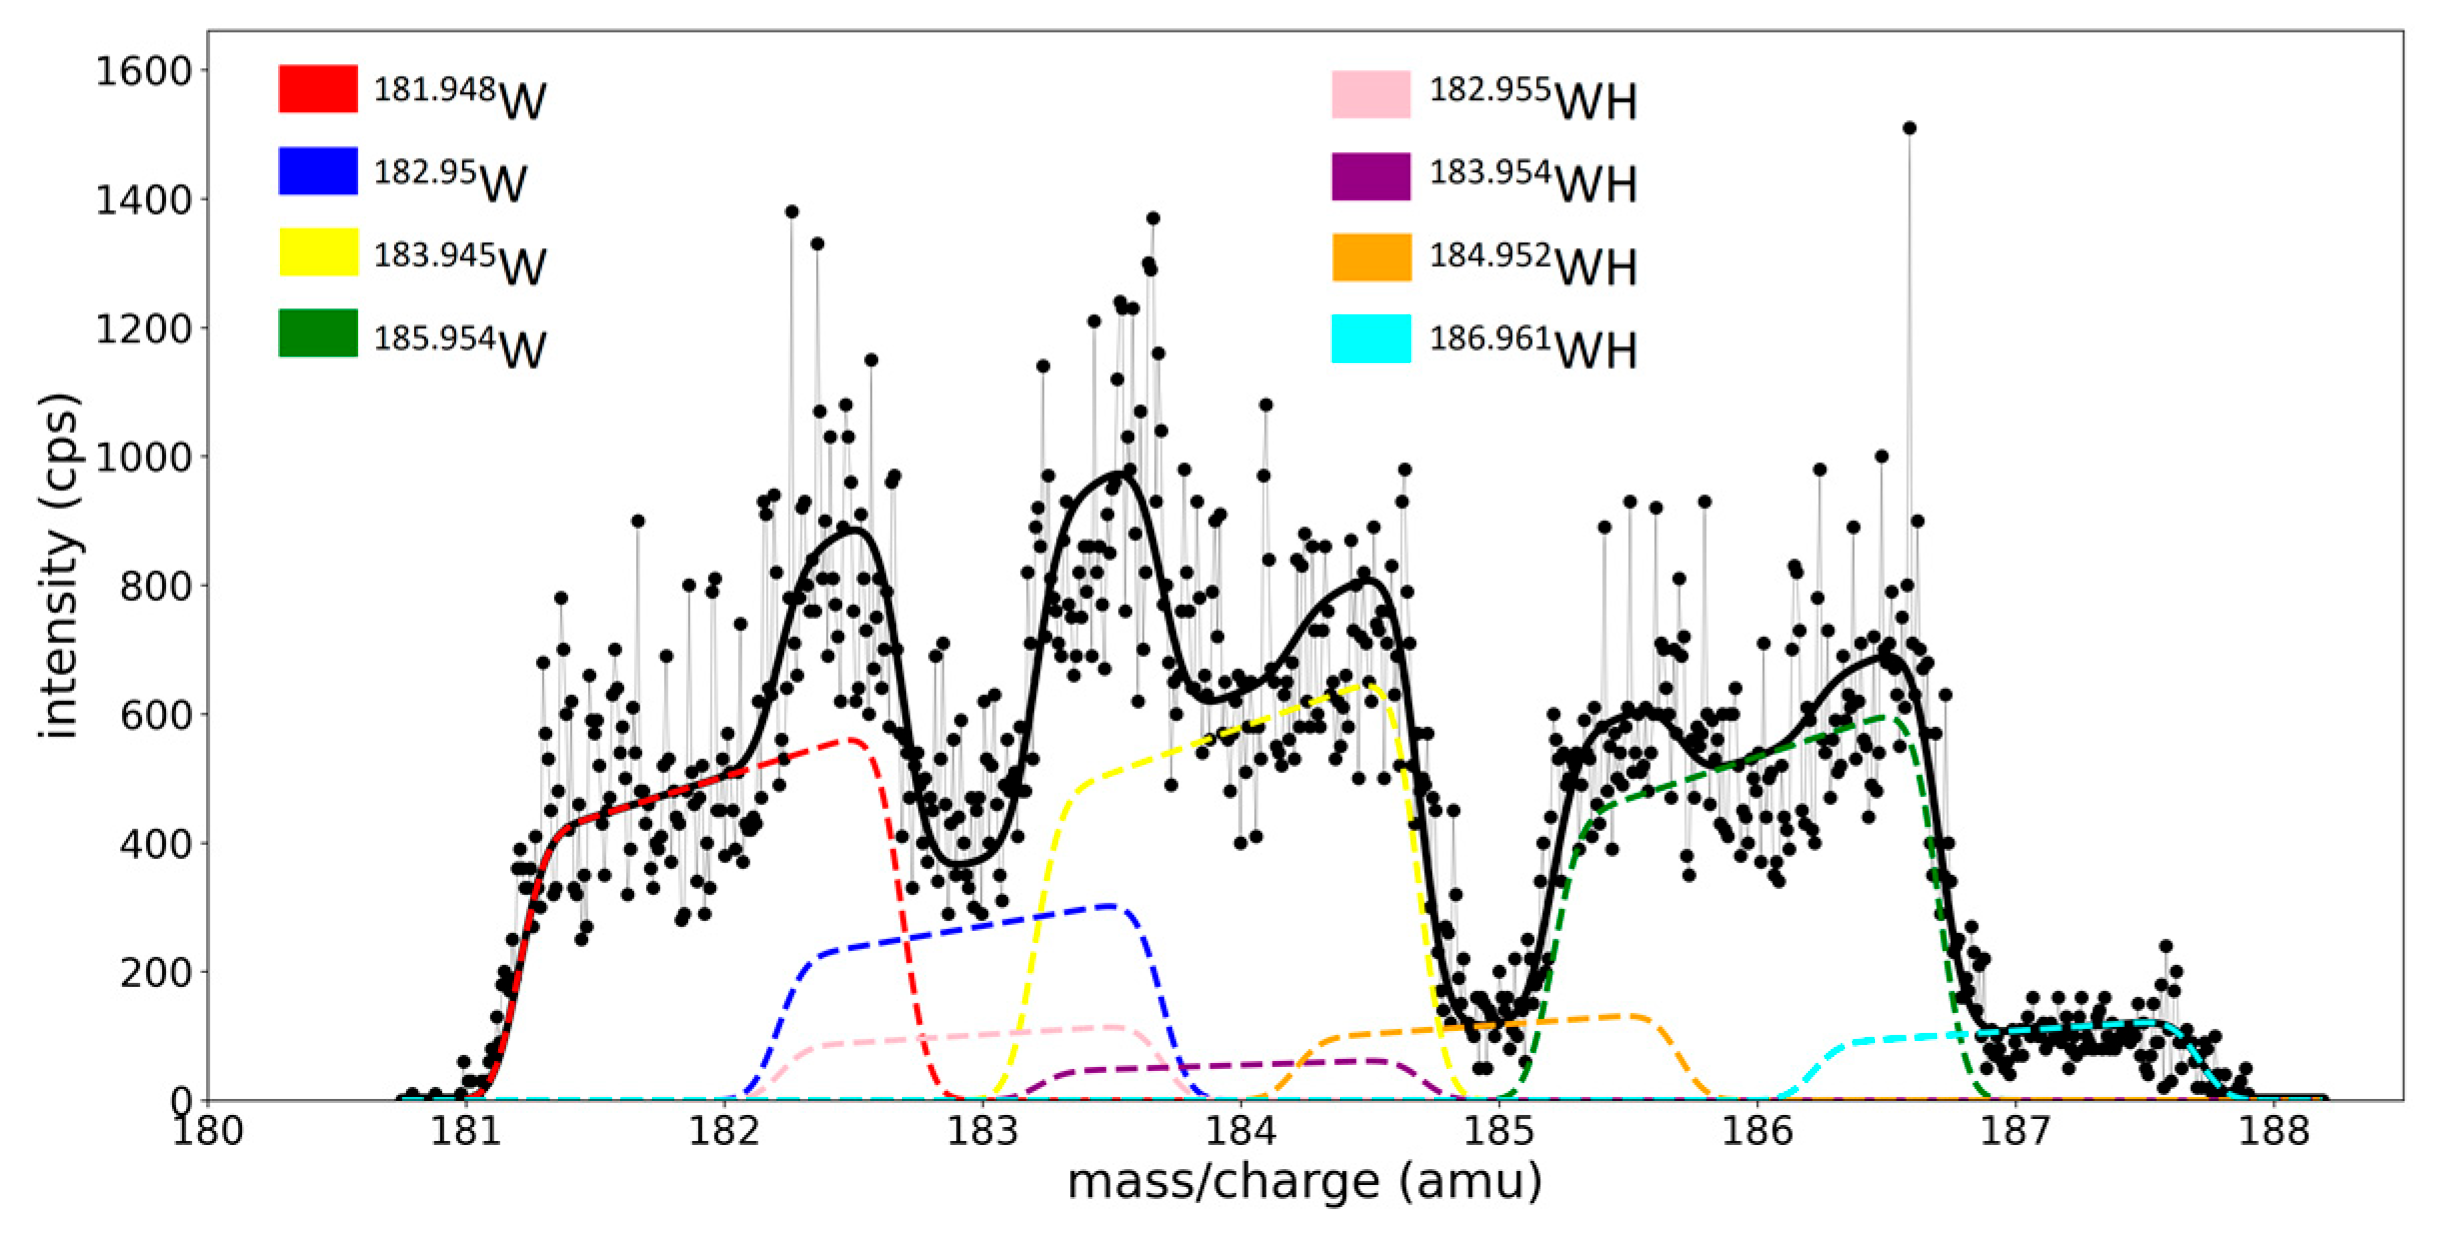
- With five free-fitting parameters for each isotope (c for peak for position; w, W, and α for peak shape; and one fitting parameter ri for isotope concentration—represented as the area of the peak). The spectrum model function S has its form defined in Equation (6) and depends on 20 free parameters, 5 for each peak.
- (B)
- With the isotope concentrations (ri) as the only free parameters, the position and shape parameters for each peak are extracted from the previous calibration curves (relations are shown in the legend of Figure S3a–c). The spectrum model function S = S(x, r1, r2, r3, r4) depends on four parameters, representing the areas of each peak.
3.5. Reduction in Profile Spectra to Bar Spectra
4. Conclusions
Supplementary Materials
Author Contributions
Funding
Institutional Review Board Statement
Informed Consent Statement
Data Availability Statement
Conflicts of Interest
Sample Availability
References
- Amoruso, S.; Bruzzese, R.; Spinelli, N.; Velotta, R. Characterization of Laser-Ablation Plasmas. J. Phys. B At. Mol. Opt. Phys. 1999, 32, R131. [Google Scholar] [CrossRef]
- Tyunkov, A.V.; Burdovitsin, V.A.; Oks, E.M.; Shandrikov, M.V.; Yushkov, Y.G.; Zavadsky, S.M.; Zolotukhin, D.B. Mass-to-Charge Ion Composition of Plasma in a Magnetron Discharge with Reactive Sputtering of Titanium Target. Plasma Process. Polym. 2021, 18, 2000210. [Google Scholar] [CrossRef]
- Medhe, S. Ionization Techniques in Mass Spectrometry: A Review. Mass Spectrom. Purif. Tech. 2018, 4, 1. [Google Scholar] [CrossRef]
- Zhang, X.; Ren, X.; Chingin, K.; Xu, J.; Yan, X.; Chen, H. Mass Spectrometry Distinguishing C=C Location and Cis/Trans Isomers: A Strategy Initiated by Water Radical Cations. Anal. Chim. Acta 2020, 1139, 146–154. [Google Scholar] [CrossRef] [PubMed]
- Nicolescu, T.O. Interpretation of Mass Spectra. In Mass Spectrometry; Aliofkhazraei, M., Ed.; IntechOpen: London, UK, 2017; pp. 24–78. [Google Scholar] [CrossRef] [Green Version]
- Stoica, S.D.; Vizireanu, S.; Acsente, T.; Dinescu, G. Hybrid Nanomaterial Architectures: Combining Layers of Carbon Nanowalls, Nanotubes, and Particles. Plasma Chem. Plasma Process. 2018, 38, 695–706. [Google Scholar] [CrossRef]
- Su, Y.; Ren, T.; Lin, Y.; Zheng, C. Application of Solid-Phase Microextraction in Atomic Spectrometry. Adv. Sample Prep. 2022, 3, 100033. [Google Scholar] [CrossRef]
- Coombes, K.R.; Baggerly, K.A.; Morris, J.S. Pre-Processing Mass Spectrometry Data in the book Fundamentals of Data Mining in Genomics and Proteomics; Springer: Berlin/Heidelberg, Germany, 2007; pp. 79–102. Available online: https://link.springer.com/chapter/10.1007/978-0-387-47509-7_4 (accessed on 23 July 2023).
- Schulz, S.; Becker, M.; Groseclose, M.R.; Schadt, S.; Hopf, C. Advanced MALDI Mass Spectrometry Imaging in Pharmaceutical Research and Drug Development. Curr. Opin. Biotechnol. 2019, 55, 51–59. [Google Scholar] [CrossRef] [PubMed]
- Yang, L.; Tong, S.; Zhou, L.; Hu, Z.; Mester, Z.; Meija, J. A Critical Review on Isotopic Fractionation Correction Methods for Accurate Isotope Amount Ratio Measurements by MC-ICP-MS. J. Anal. Spectrom. 2018, 33, 1849–1861. [Google Scholar] [CrossRef]
- Urban, J.; Afseth, N.K.; Štys, D. Fundamental Definitions and Confusions in Mass Spectrometry about Mass Assignment, Centroiding and Resolution. TrAC-Trends Anal. Chem. 2014, 53, 126–136. [Google Scholar] [CrossRef] [Green Version]
- Zheng, Y.; Tian, D.; Liu, K.; Bao, Z.; Wang, P.; Qiu, C.; Liu, D.; Fan, R. Peak Detection of TOF-SIMS Using Continuous Wavelet Transform and Curve Fitting. Int. J. Mass Spectrom. 2018, 428, 43–48. [Google Scholar] [CrossRef]
- Stark, H.; Yatavelli, R.L.N.; Thompson, S.L.; Kimmel, J.R.; Cubison, M.J.; Chhabra, P.S.; Canagaratna, M.R.; Jayne, J.T.; Worsnop, D.R.; Jimenez, J.L. Methods to Extract Molecular and Bulk Chemical Information from Series of Complex Mass Spectra with Limited Mass Resolution. Int. J. Mass Spectrom. 2015, 389, 26–38. [Google Scholar] [CrossRef] [Green Version]
- Touboul, M.; Walker, R.J. High Precision Tungsten Isotope Measurement by Thermal Ionization Mass Spectrometry. Int. J. Mass Spectrom. 2012, 309, 109–117. [Google Scholar] [CrossRef]
- Zhang, R.; Meija, J.; Huang, Y.; Pei, X.; Mester, Z.; Yang, L. Determination of the Isotopic Composition of Tungsten Using MC-ICP-MS. Anal. Chim. Acta 2019, 1089, 19–24. [Google Scholar] [CrossRef] [PubMed]
- Marcheti, A.A.; Mignerey, A.C. Deconvolution of Mass Spectra. In Nuclear Instruments and Methods in Physics Research Section A: Accelerators, Spectrometers, Detectors and Associated Equipment; Elsevier: Amsterdam, The Netherlands, 1993; Volume 324, pp. 288–296. [Google Scholar]
- Meija, J.; Caruso, J.A. Deconvolution of Isobaric Interferences in Mass Spectra. J. Am. Soc. Mass Spectrom. 2004, 15, 654–658. [Google Scholar] [CrossRef] [PubMed] [Green Version]
- Shah, D.; Major, G.H.; Roychowdhury, T. Advanced Line Shapes in X-ray Photoelectron Spectroscopy II. Vac. Technol. Coat. 2020, 21, 35–39. [Google Scholar]
- Gibson, J.R.; Taylor, S. Asymmetrical Features of Mass Spectral Peaks Produced by Quadrupole Mass Filters. Rapid Commun. Mass Spectrom. 2003, 17, 1051–1055. [Google Scholar] [CrossRef]
- Major, G.H.; Avval, T.G.; Patel, D.I.; Shah, D.; Roychowdhury, T.; Barlow, A.J.; Pigram, P.J.; Greiner, M.; Fernandez, V.; Herrera-Gomez, A.; et al. A Discussion of Approaches for Fitting Asymmetric Signals in X-ray Photoelectron Spectroscopy (XPS), Noting the Importance of Voigt-like Peak Shapes. Surf. Interface Anal. 2021, 53, 689–707. [Google Scholar] [CrossRef]
- Bressert, E. SciPy and NumPy; O’Reilly Media. Inc.: Sebastopol, CA, USA, 2012; pp. 17–20. ISBN 9781449305468. [Google Scholar]
- Johnson, M.; Frasier, S. Nonlinear least-squares analysis. Meth. Enzymol. 1985, 117, 301–342. [Google Scholar] [CrossRef]
- Harris, D. Nonlinear Least-Squares Curve Fitting with Microsoft Excel Solver. J. Chem. Educ. 1998, 75, 1–119. [Google Scholar] [CrossRef]
- Kambezidis, H.D. 3.02—The Solar Resource. In Comprehensive Renewable Energy; Sayigh, A., Ed.; Elsevier: Amsterdam, The Netherlands, 2012; Volume 3, pp. 27–84. [Google Scholar] [CrossRef]


| Ionic Species | Recorded Position (m/z)rec | Expected True Position (m/z)real | Deviation D = (m/z)real − (m/z)rec | Relative Deviation Dr (%) = D/(m/z)real × 100 |
|---|---|---|---|---|
| Ar2+ | 19.6 | 19.974 | 0.374 | 1.87 |
| Ar+ | 39.8 | 39.948 | 0.148 | 0.37 |
| ArH+ | 41.0 | 40.955 | −0.045 | −0.01 |
| Cu+ | 62.4 | 62.93 | 0.53 | 0.84 |
| 107Ag+ | 106.5 | 106.905 | 0.405 | 0.37 |
| 109Ag+ | 108.4 | 108.904 | 0.506 | 0.46 |
| 197Au+ | 197.9 | 196.966 | −0.934 | −0.47 |
| Th+ | 233.5 | 232.035 | −1.465 | −0.63 |
| Isotope | NA (%) | CA:ME (%) | CA:W/Ar (%) | ||
|---|---|---|---|---|---|
| 180W | 0.12 | - | - | ||
| 182W | 26.5 | 27.38 | 3.32 | 26.5 | 0 |
| 183W | 14.31 | 13.66 | 4.54 | 15.73 | 9.94 |
| 184W | 30.64 | 30.86 | 0.71 | 30.05 | 1.90 |
| 186W | 28.43 | 28.08 | 1.23 | 27.70 | 2.56 |
| - | - | 2.45 ± 0.06 | 3.6 ± 0.11 |
Disclaimer/Publisher’s Note: The statements, opinions and data contained in all publications are solely those of the individual author(s) and contributor(s) and not of MDPI and/or the editor(s). MDPI and/or the editor(s) disclaim responsibility for any injury to people or property resulting from any ideas, methods, instructions or products referred to in the content. |
© 2023 by the authors. Licensee MDPI, Basel, Switzerland. This article is an open access article distributed under the terms and conditions of the Creative Commons Attribution (CC BY) license (https://creativecommons.org/licenses/by/4.0/).
Share and Cite
Craciun, C.; Stoica, S.D.; Mitu, B.M.; Acsente, T.; Dinescu, G. Mass Spectra Fitting as Diagnostic Tool for Magnetron Plasmas Generated in Ar and Ar/H2 Gases with Tungsten Targets. Molecules 2023, 28, 5664. https://doi.org/10.3390/molecules28155664
Craciun C, Stoica SD, Mitu BM, Acsente T, Dinescu G. Mass Spectra Fitting as Diagnostic Tool for Magnetron Plasmas Generated in Ar and Ar/H2 Gases with Tungsten Targets. Molecules. 2023; 28(15):5664. https://doi.org/10.3390/molecules28155664
Chicago/Turabian StyleCraciun, Cristina, Silviu Daniel Stoica, Bogdana Maria Mitu, Tomy Acsente, and Gheorghe Dinescu. 2023. "Mass Spectra Fitting as Diagnostic Tool for Magnetron Plasmas Generated in Ar and Ar/H2 Gases with Tungsten Targets" Molecules 28, no. 15: 5664. https://doi.org/10.3390/molecules28155664
APA StyleCraciun, C., Stoica, S. D., Mitu, B. M., Acsente, T., & Dinescu, G. (2023). Mass Spectra Fitting as Diagnostic Tool for Magnetron Plasmas Generated in Ar and Ar/H2 Gases with Tungsten Targets. Molecules, 28(15), 5664. https://doi.org/10.3390/molecules28155664


