
Enhancing ASP Flooding by Using Special Combinations of Surfactants and Starch Nanoparticles

 , , , , , and
Abstract
:1. Introduction
2. Equipment Involved in Experimental Work
- Core Samples: These were cylindrical rock samples obtained from the reservoir, representing the porous medium where the chemical flooding experiment was conducted. Core samples allow for the study of the interaction between the chemical solution and the rock matrix.
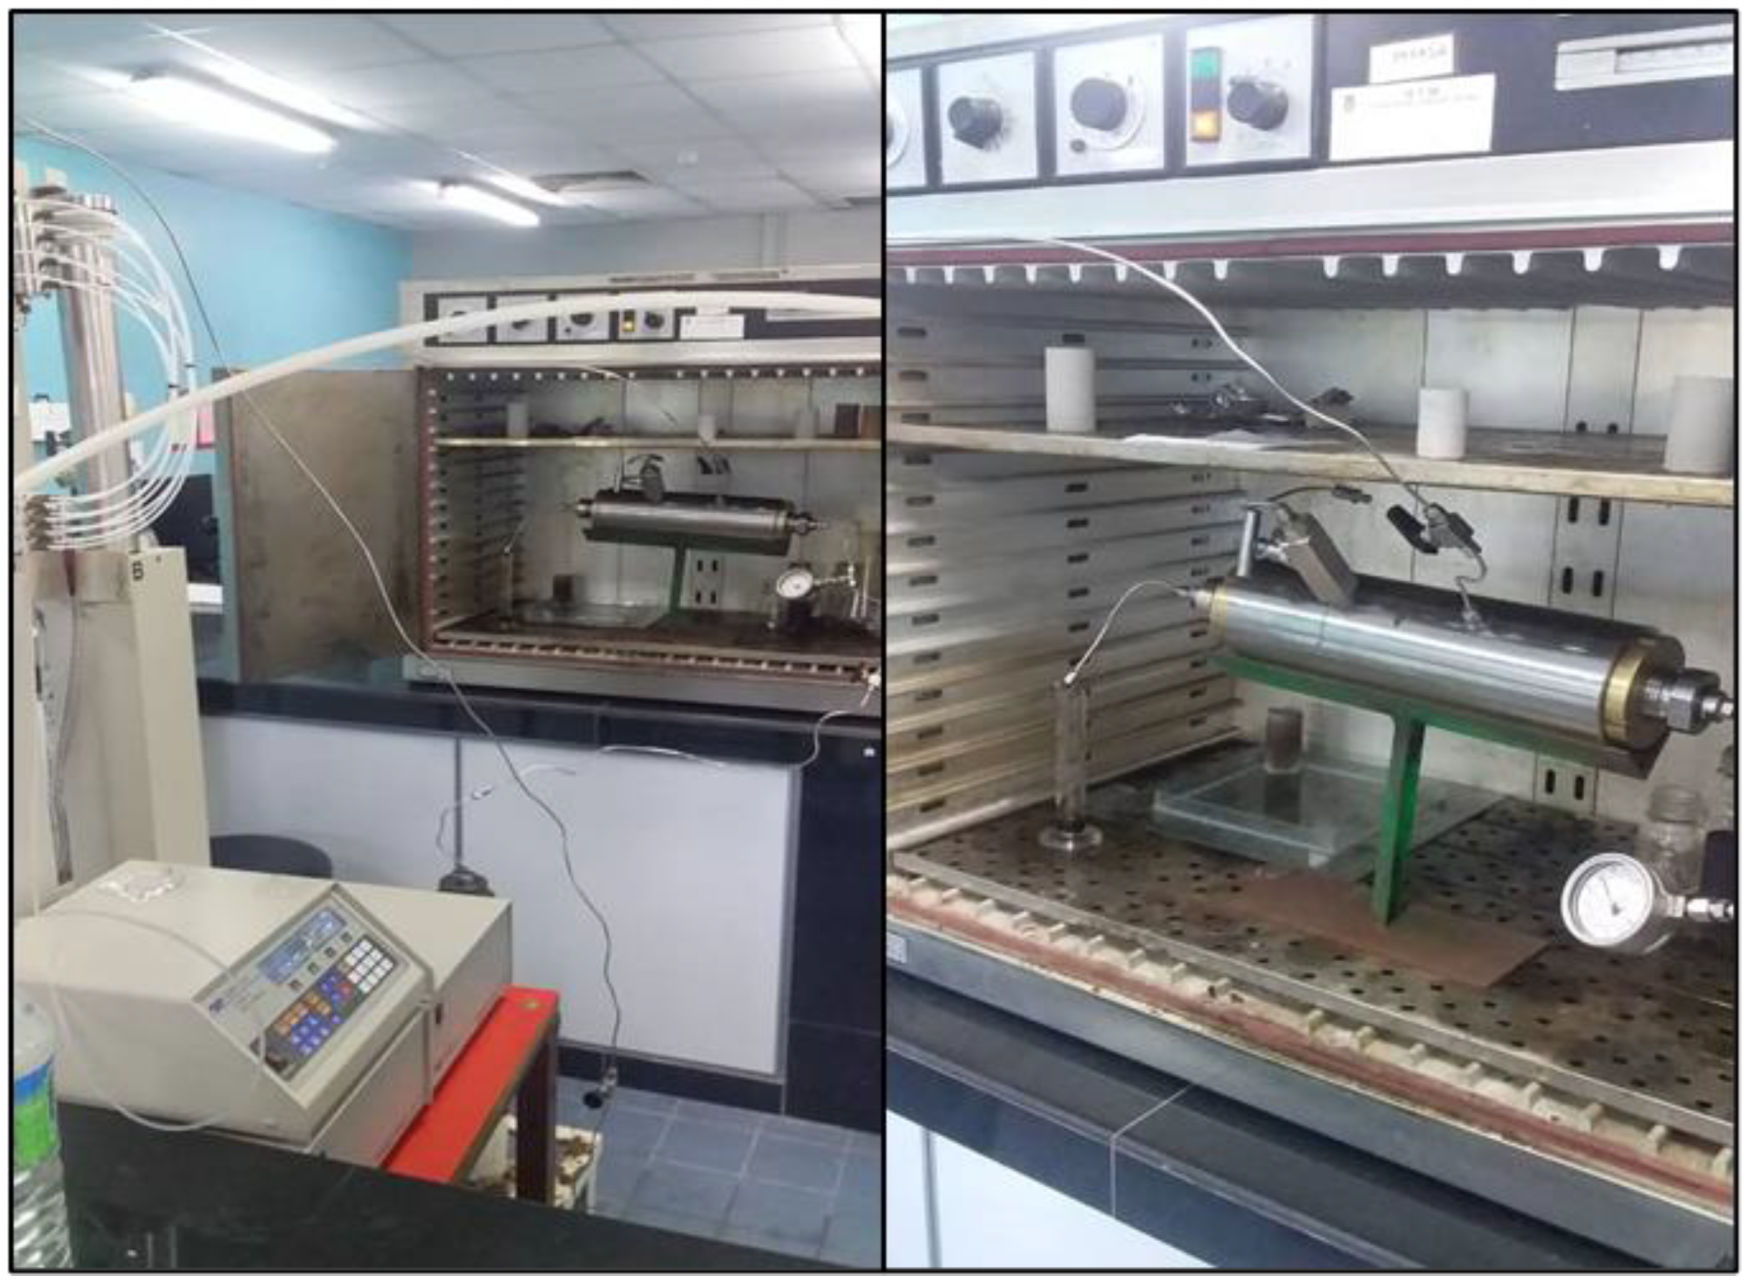
- Confining Vessel (Core Holder): A core holder was used to hold and confine the core samples during the experiment. It provided a controlled flow path for the injection of the chemical solution and allowed for the monitoring and measurement of the flow properties.
- Teledyne Injection Pump: An injection pump was used to deliver the chemical solution into the core sample at a controlled flow rate. It ensured the precise injection of the desired concentration of chemicals.
- Pressure Gauges: Pressure gauges were used in the experiment to measure the pressure changes within the core sample during the chemical flooding experiment. They provide valuable data in evaluating the performance of the chemical flooding process. The data of pressure gauge measurements are used in calculating the Resistant Factor (RF) and Residual Resistant Factor (RRF).
- Sample Collection System (Cylinder): A sample collection system was employed to collect the effluent produced from the core sample during the experiment. This allowed for an analysis of the composition and behavior of the fluid mixture after chemical injection.
- Brookfield RST Rheometer: This was utilized to measure and analyze the properties of the chemical solution, the effluent, and other relevant parameters during the experiment.
- Standard Electrical Oven: To replicate the conditions of the Langgak oilfield, a temperature of approximately 60 °C was maintained and applied on the core holder and core sample. The temperature was verified using a thermocouple measurement, ensuring that it remained at the desired level throughout the experiment.
- KRUSS EasyDyne Tensiometer K20: This is a device commonly used in surface tension measurements and interfacial analysis. It is designed to determine the surface tension of liquids and the interfacial tension between immiscible liquids. It is equipped with a high-resolution camera and advanced image processing algorithms to accurately capture and analyze the shape and dimensions of liquid drops or bubbles. The instrument allows for the precise control of the temperature, ensuring that measurements can be conducted at specific temperatures to mimic real-world conditions. The instrument operates with the Wilhelmy plate method.
3. Results and Discussion
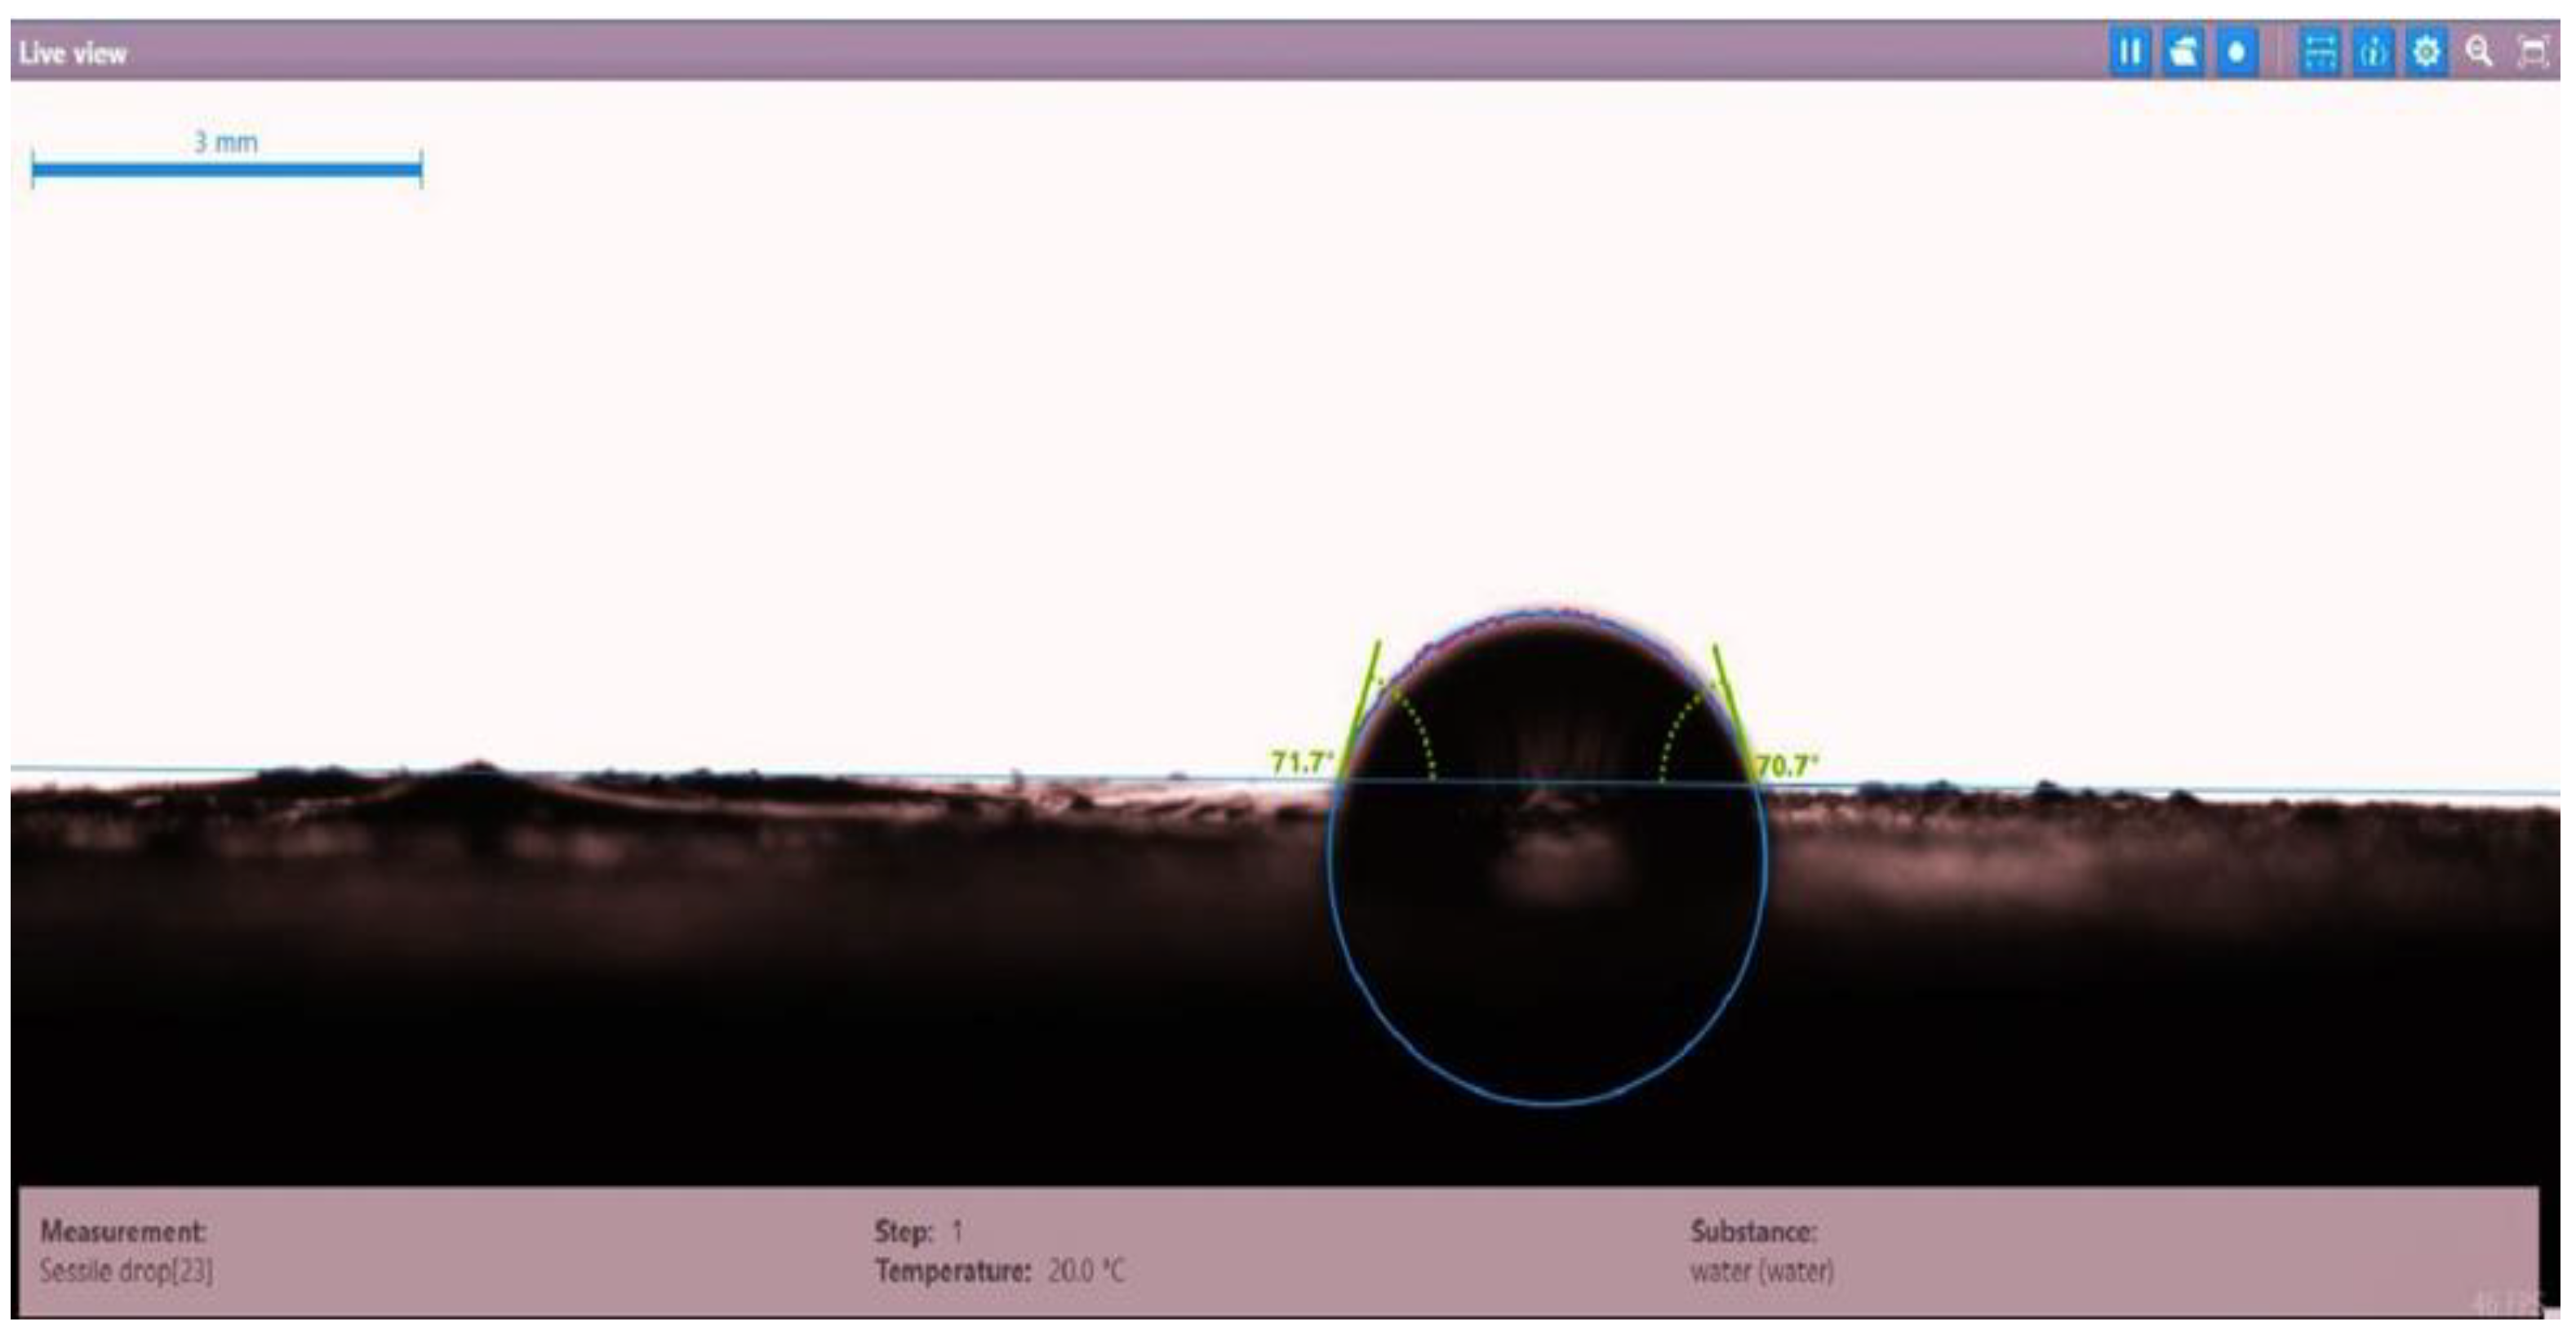
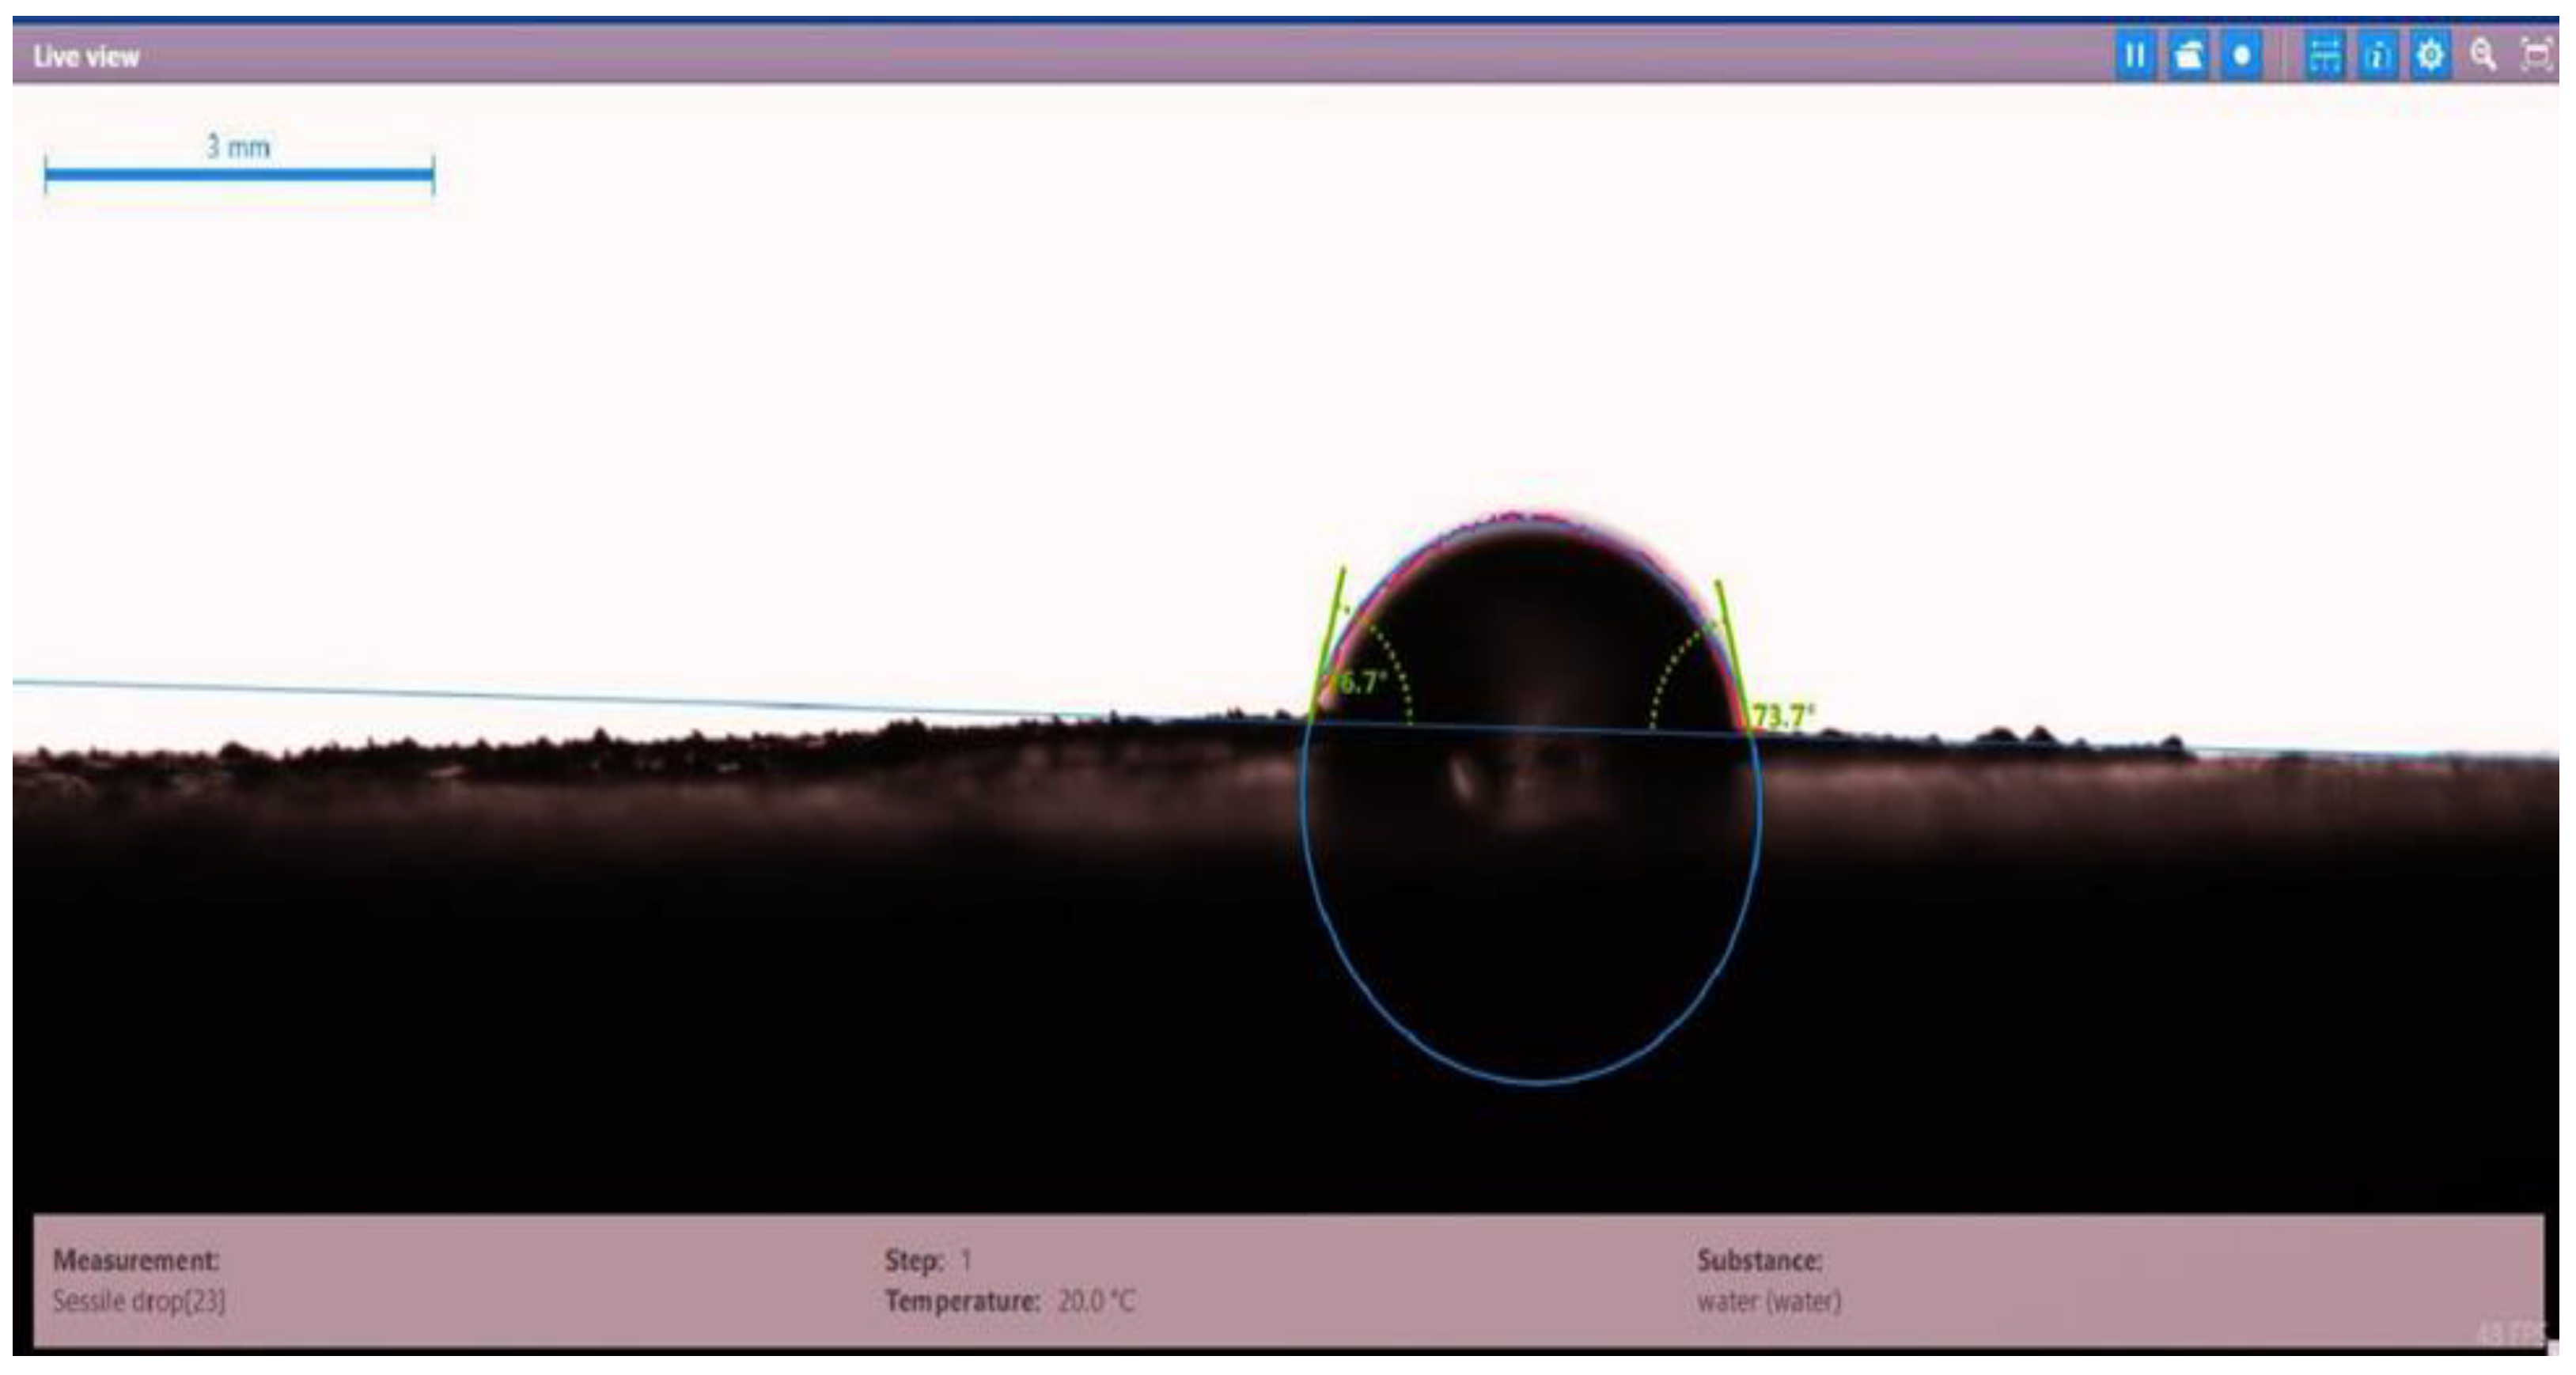
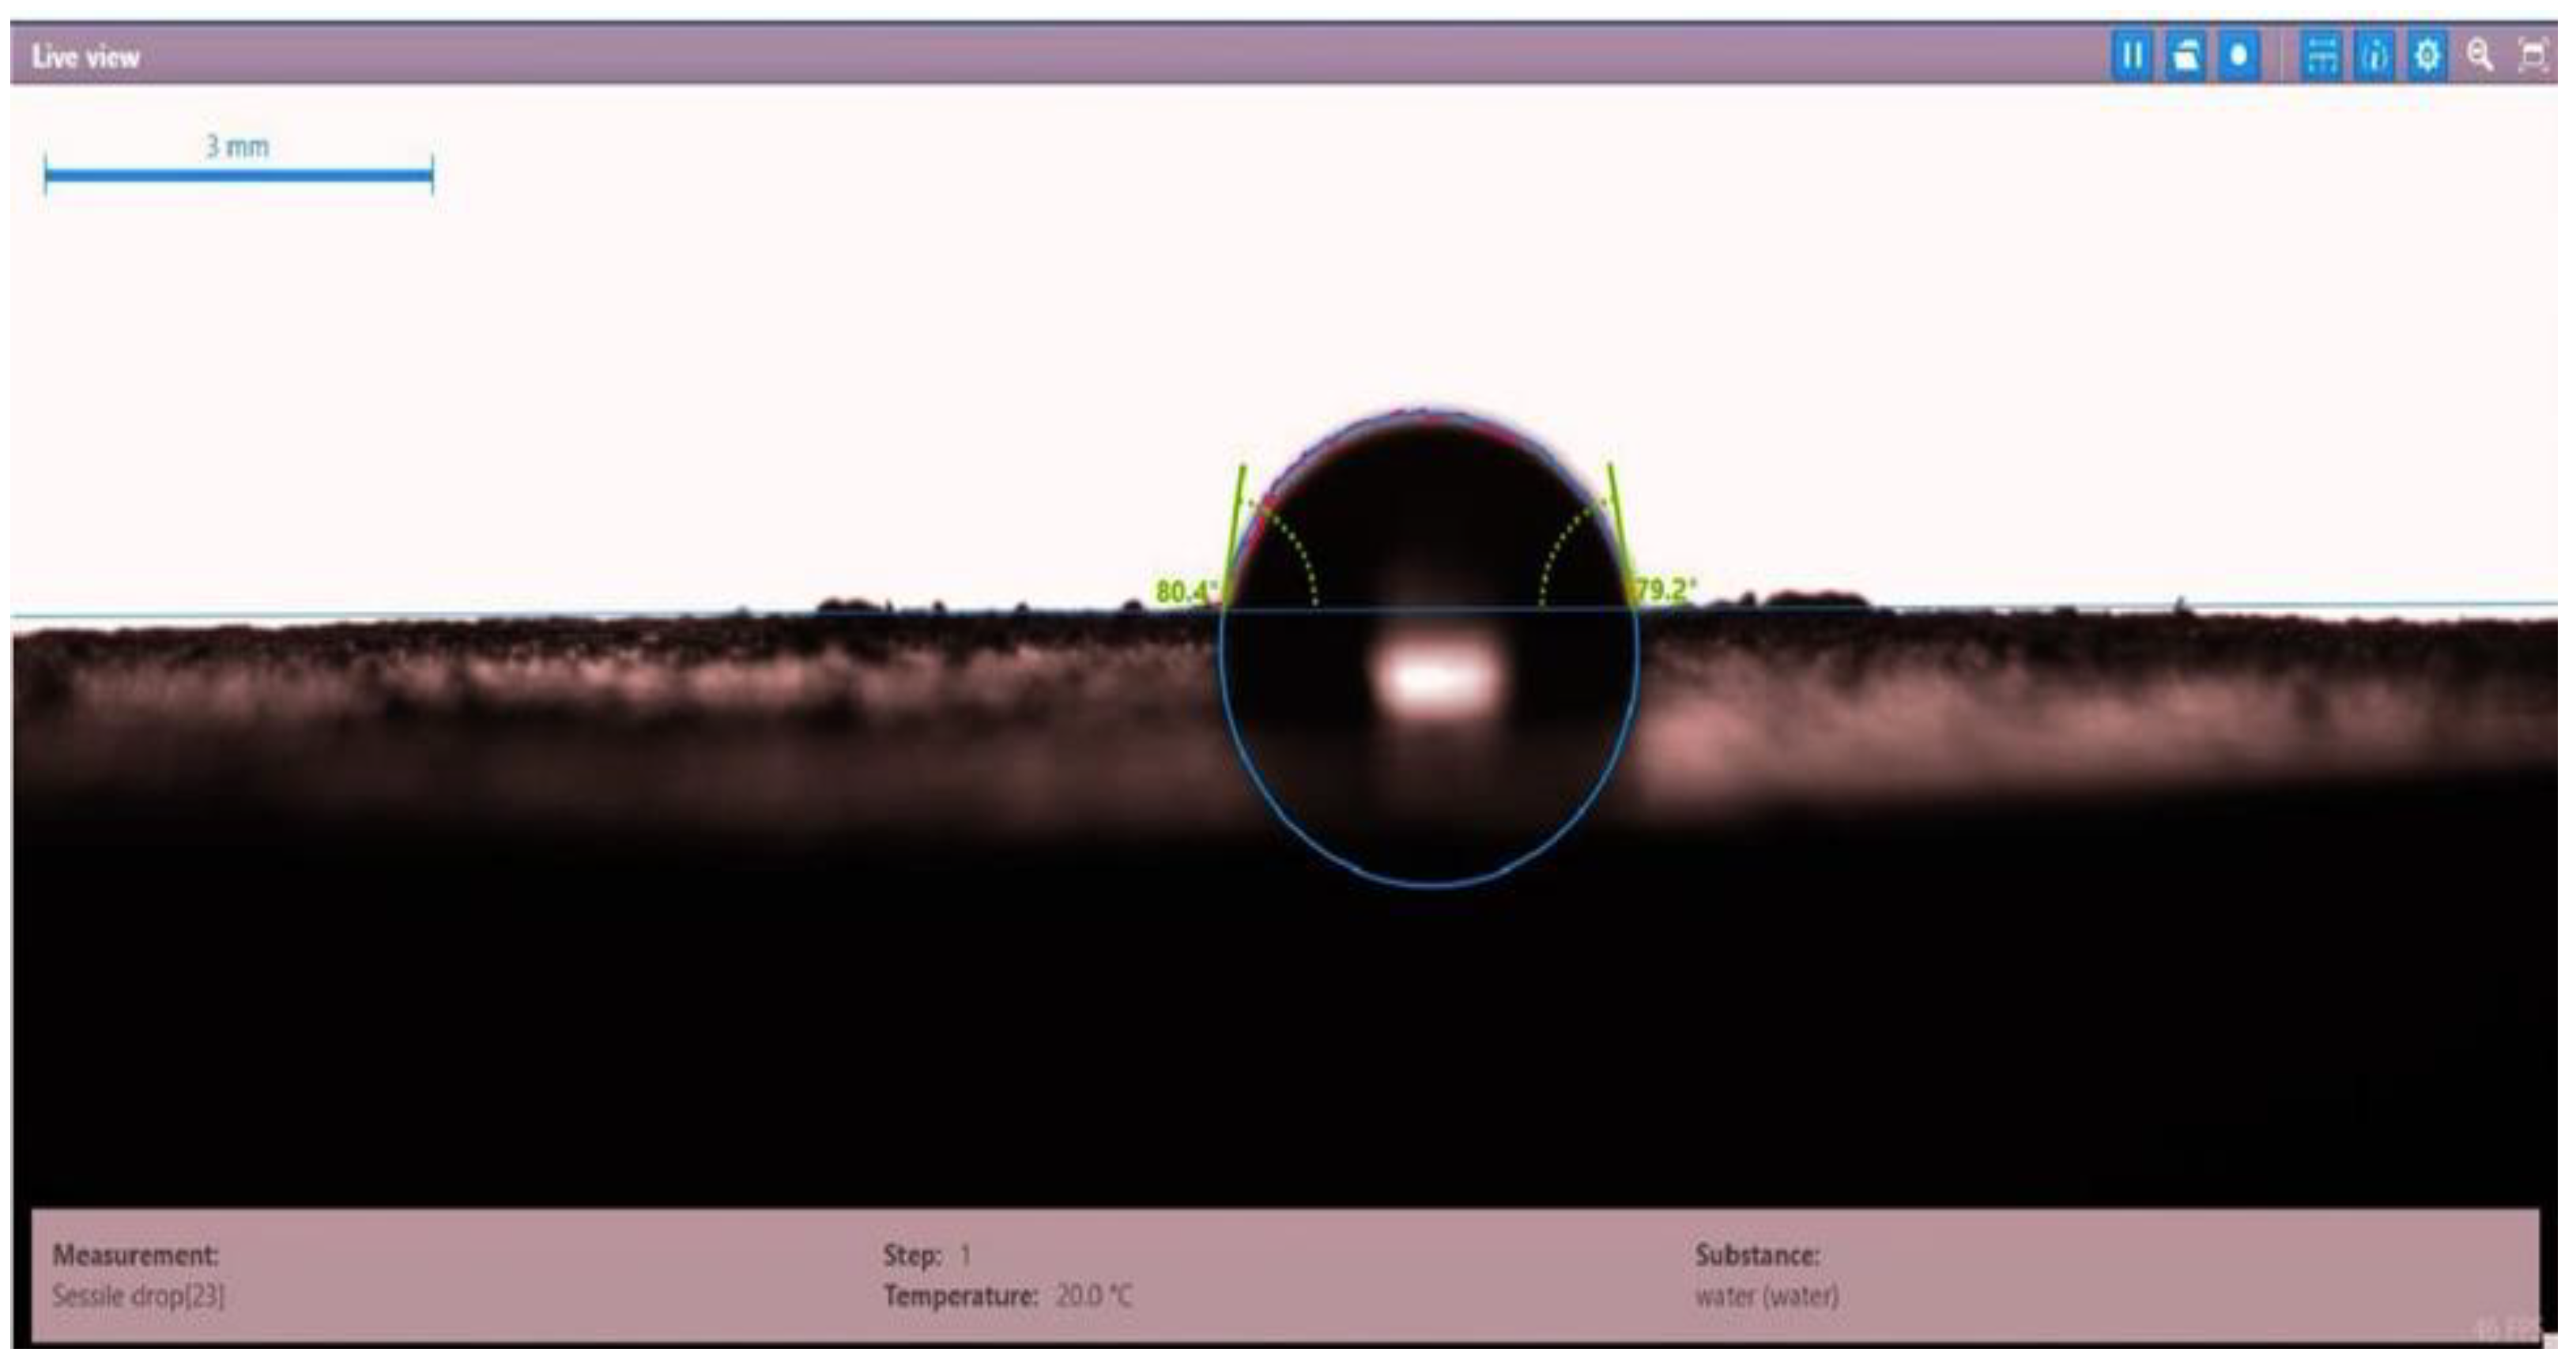
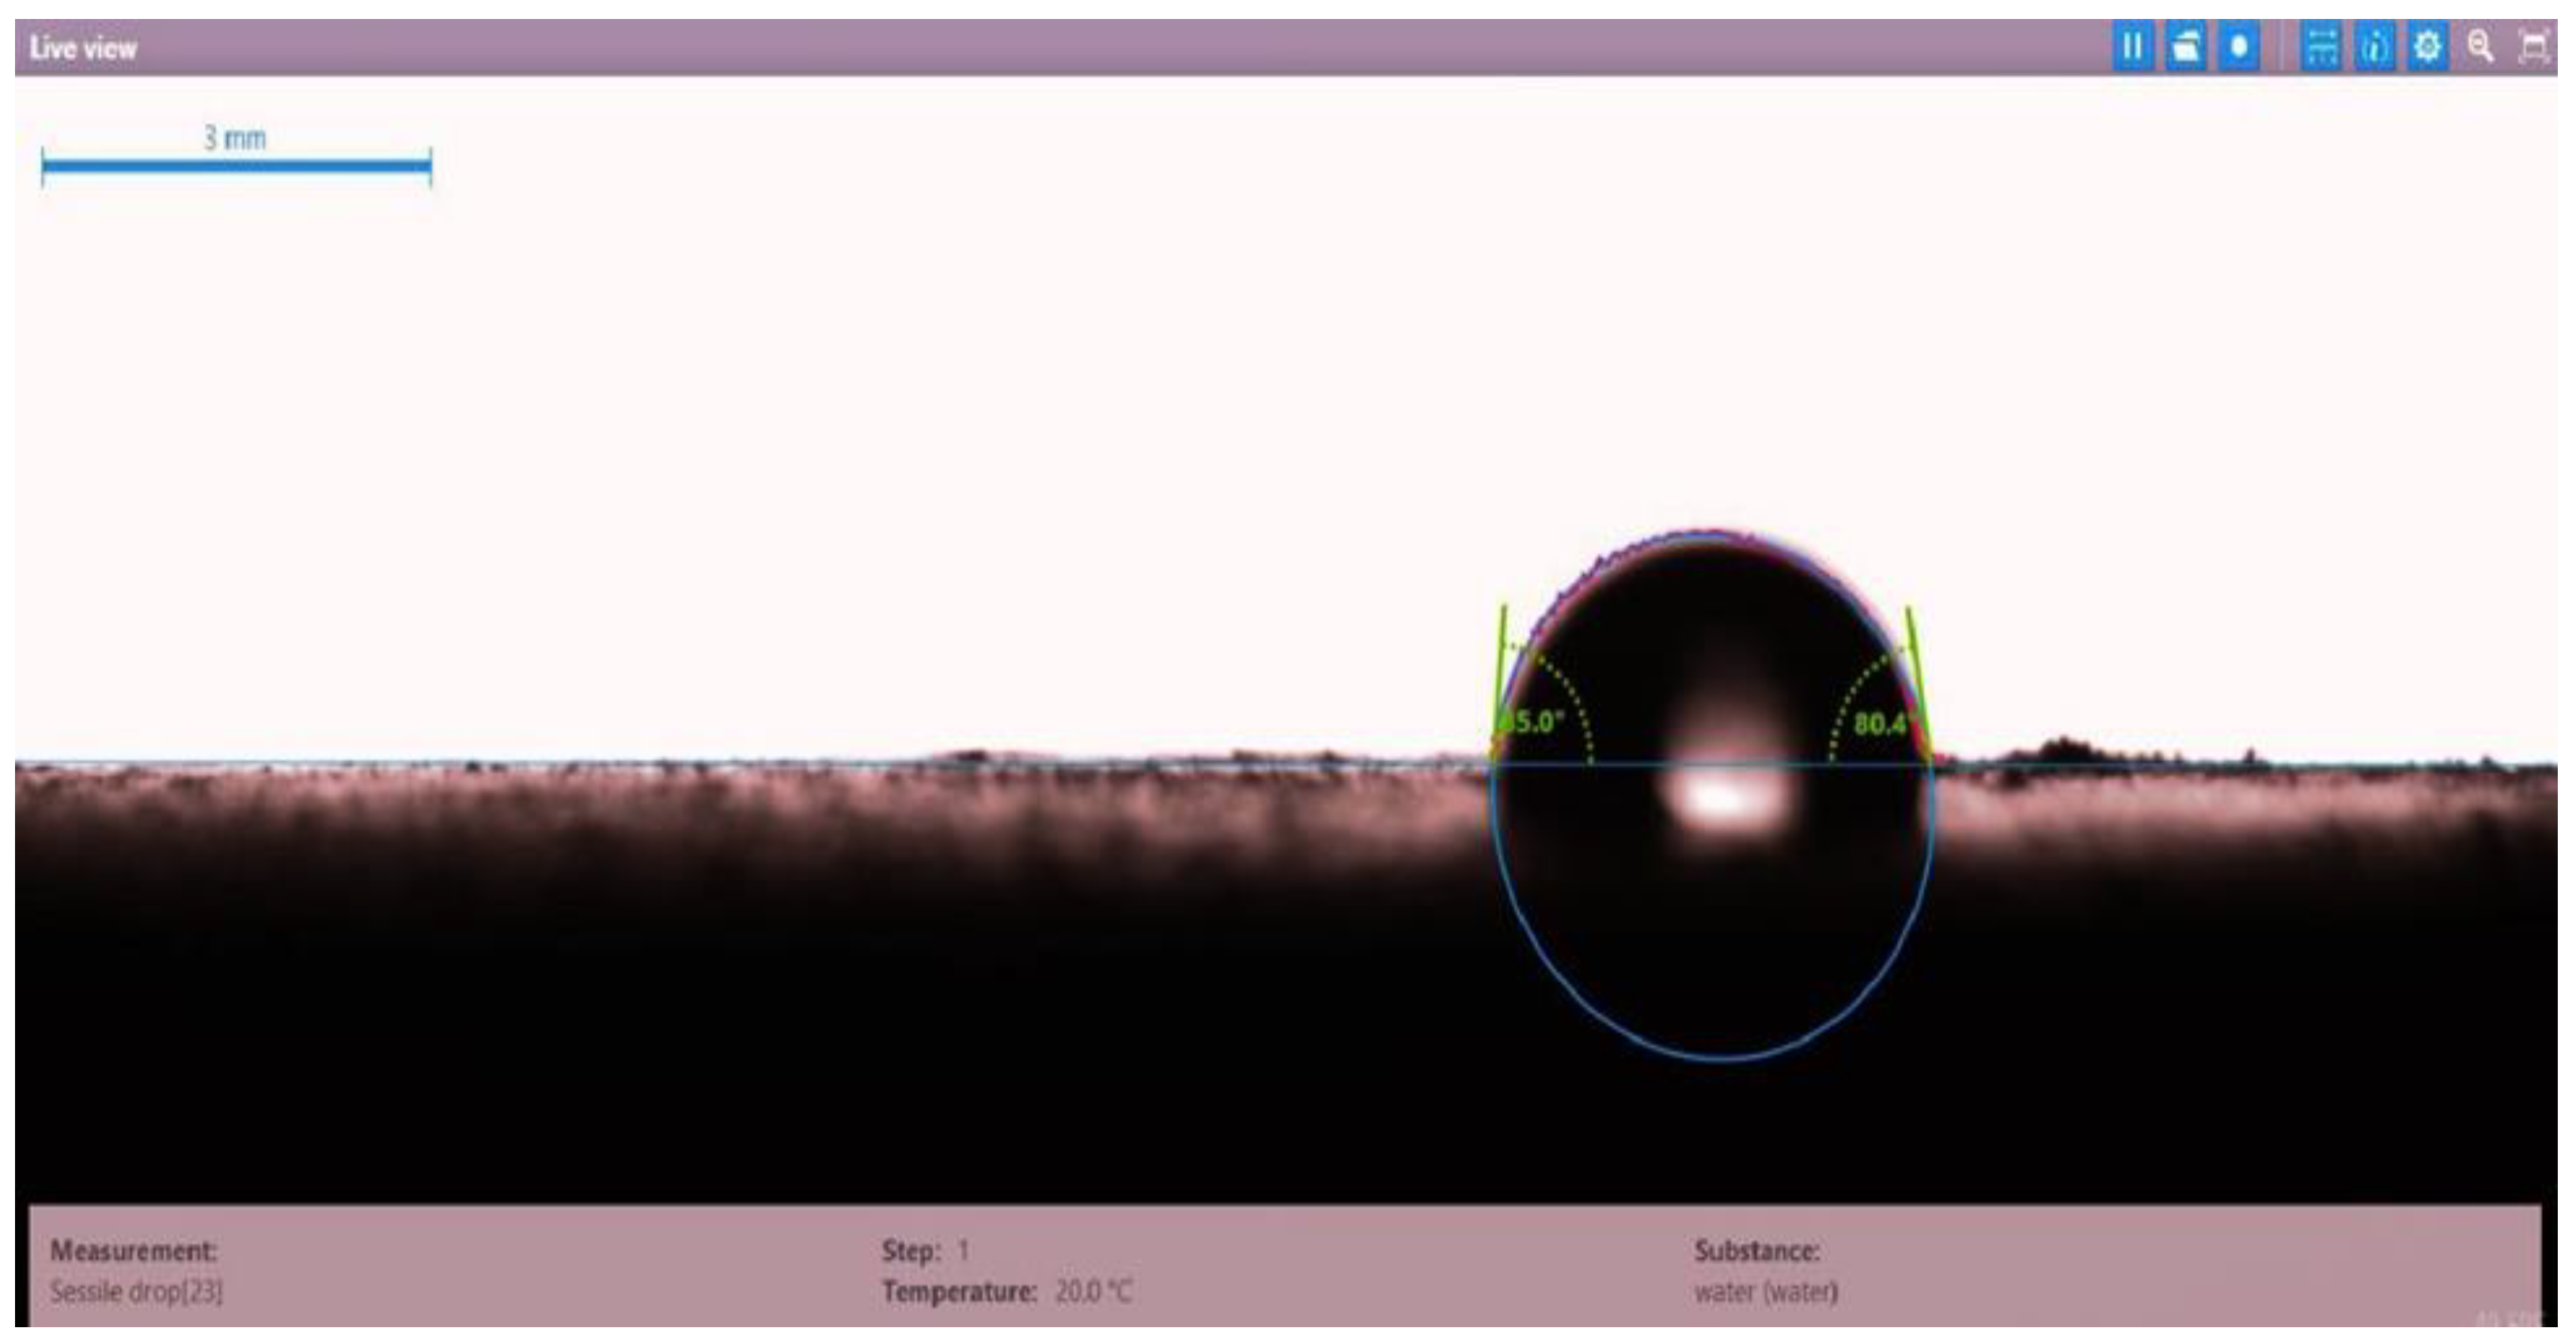
3.1. Wettability of Core Samples
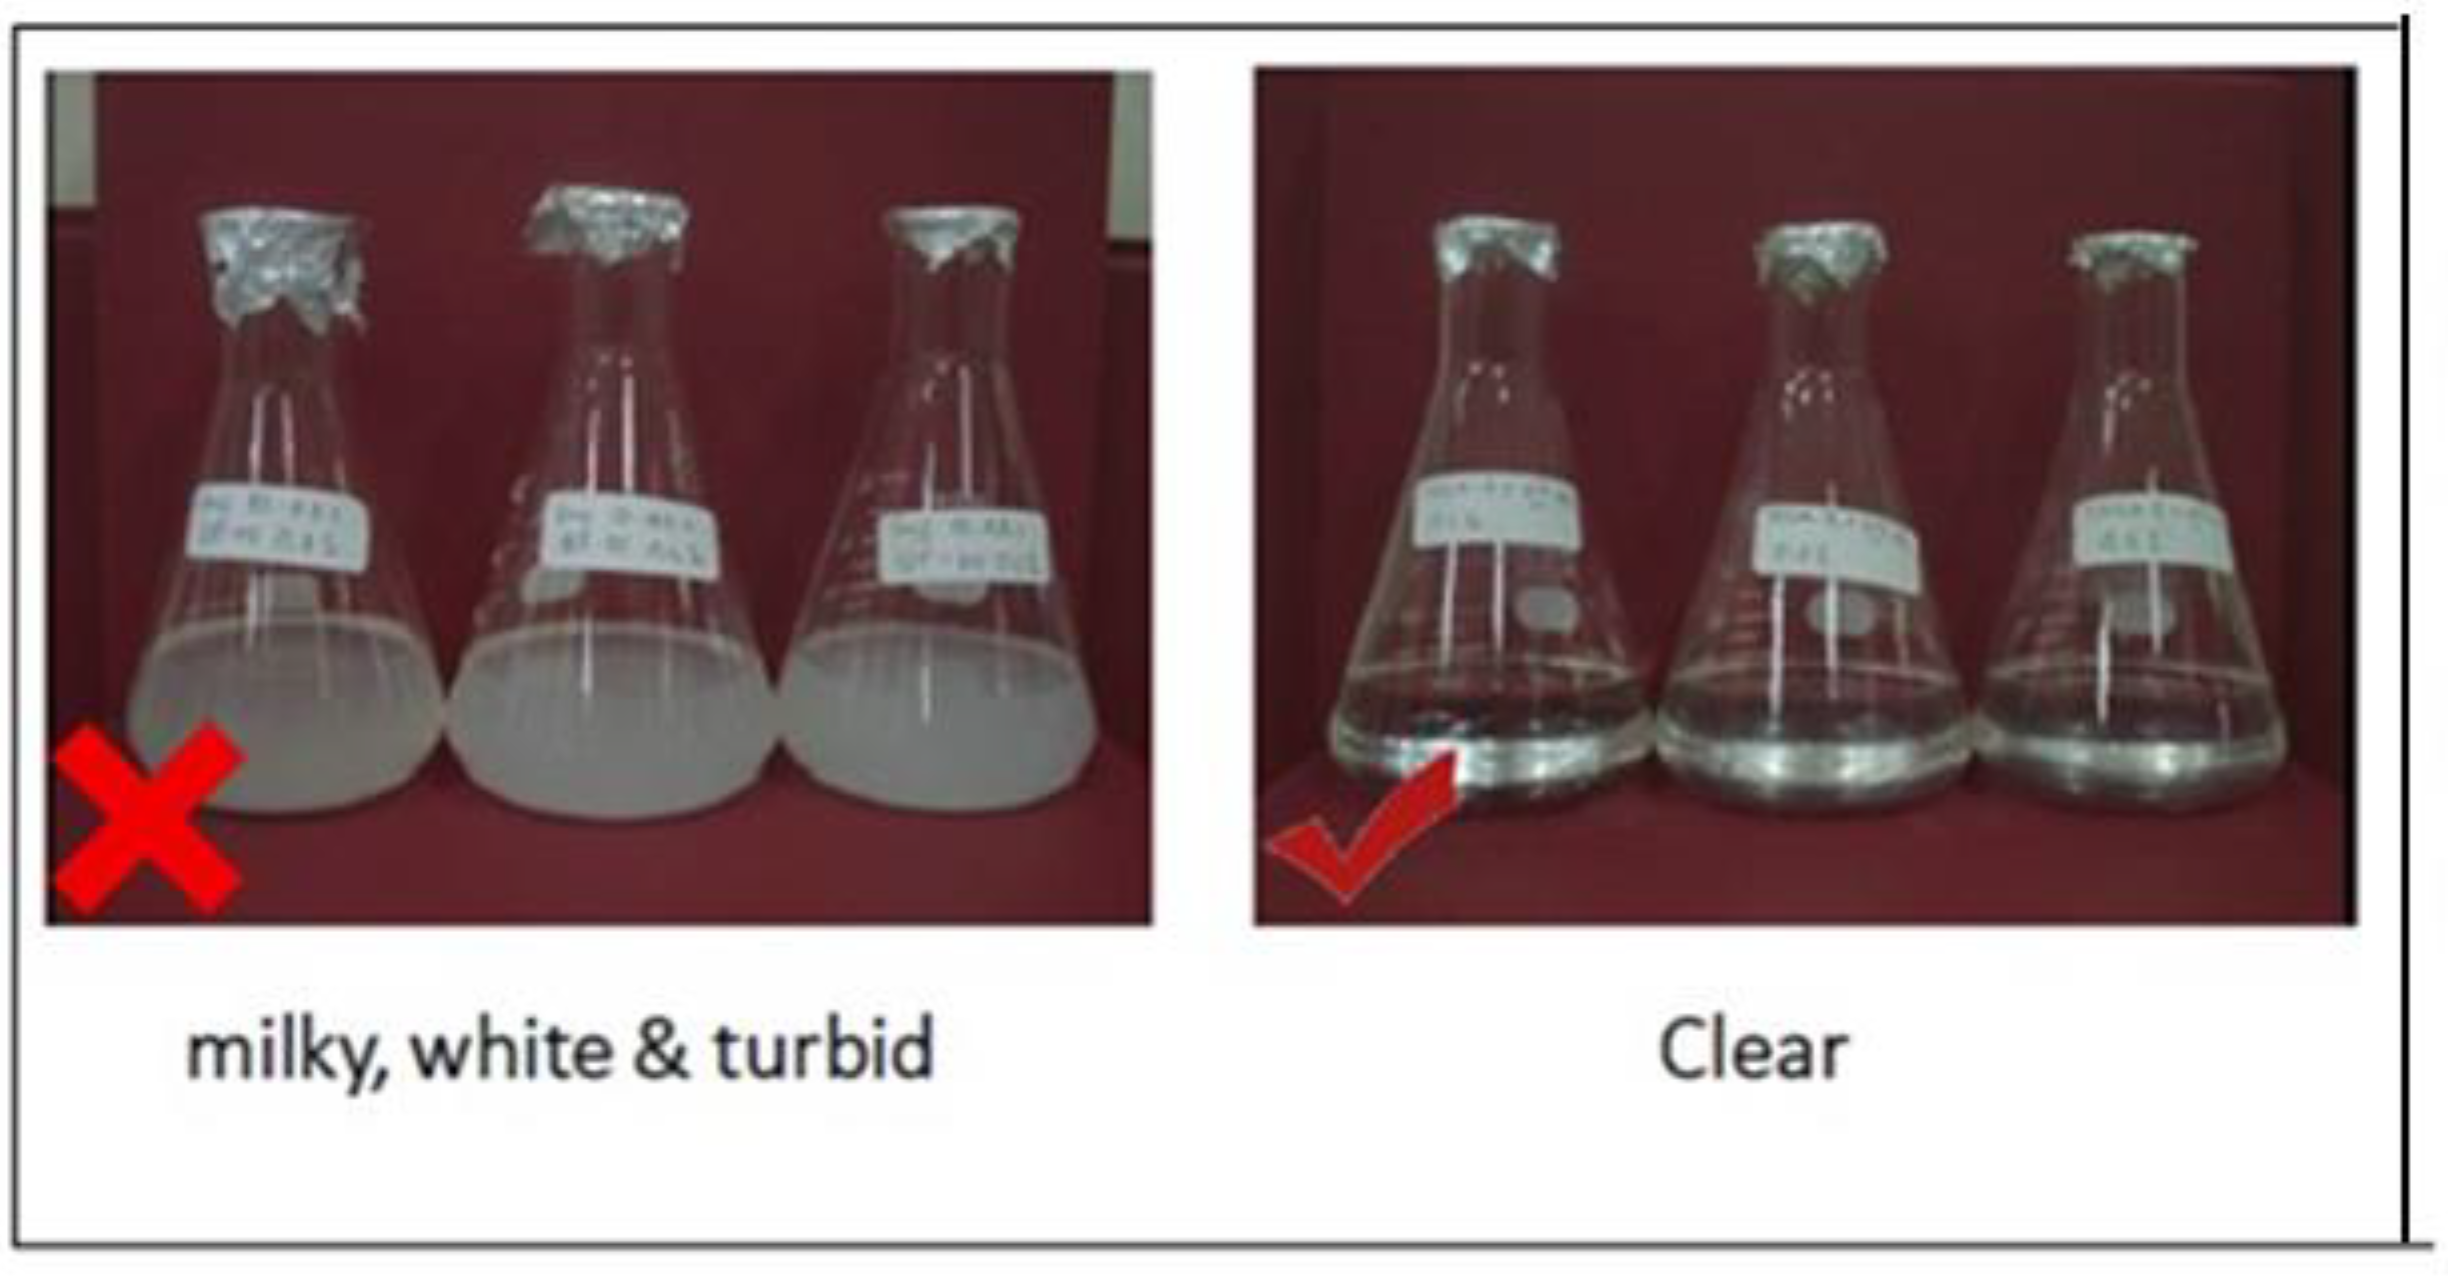
3.2. Compatibility of Surfactants
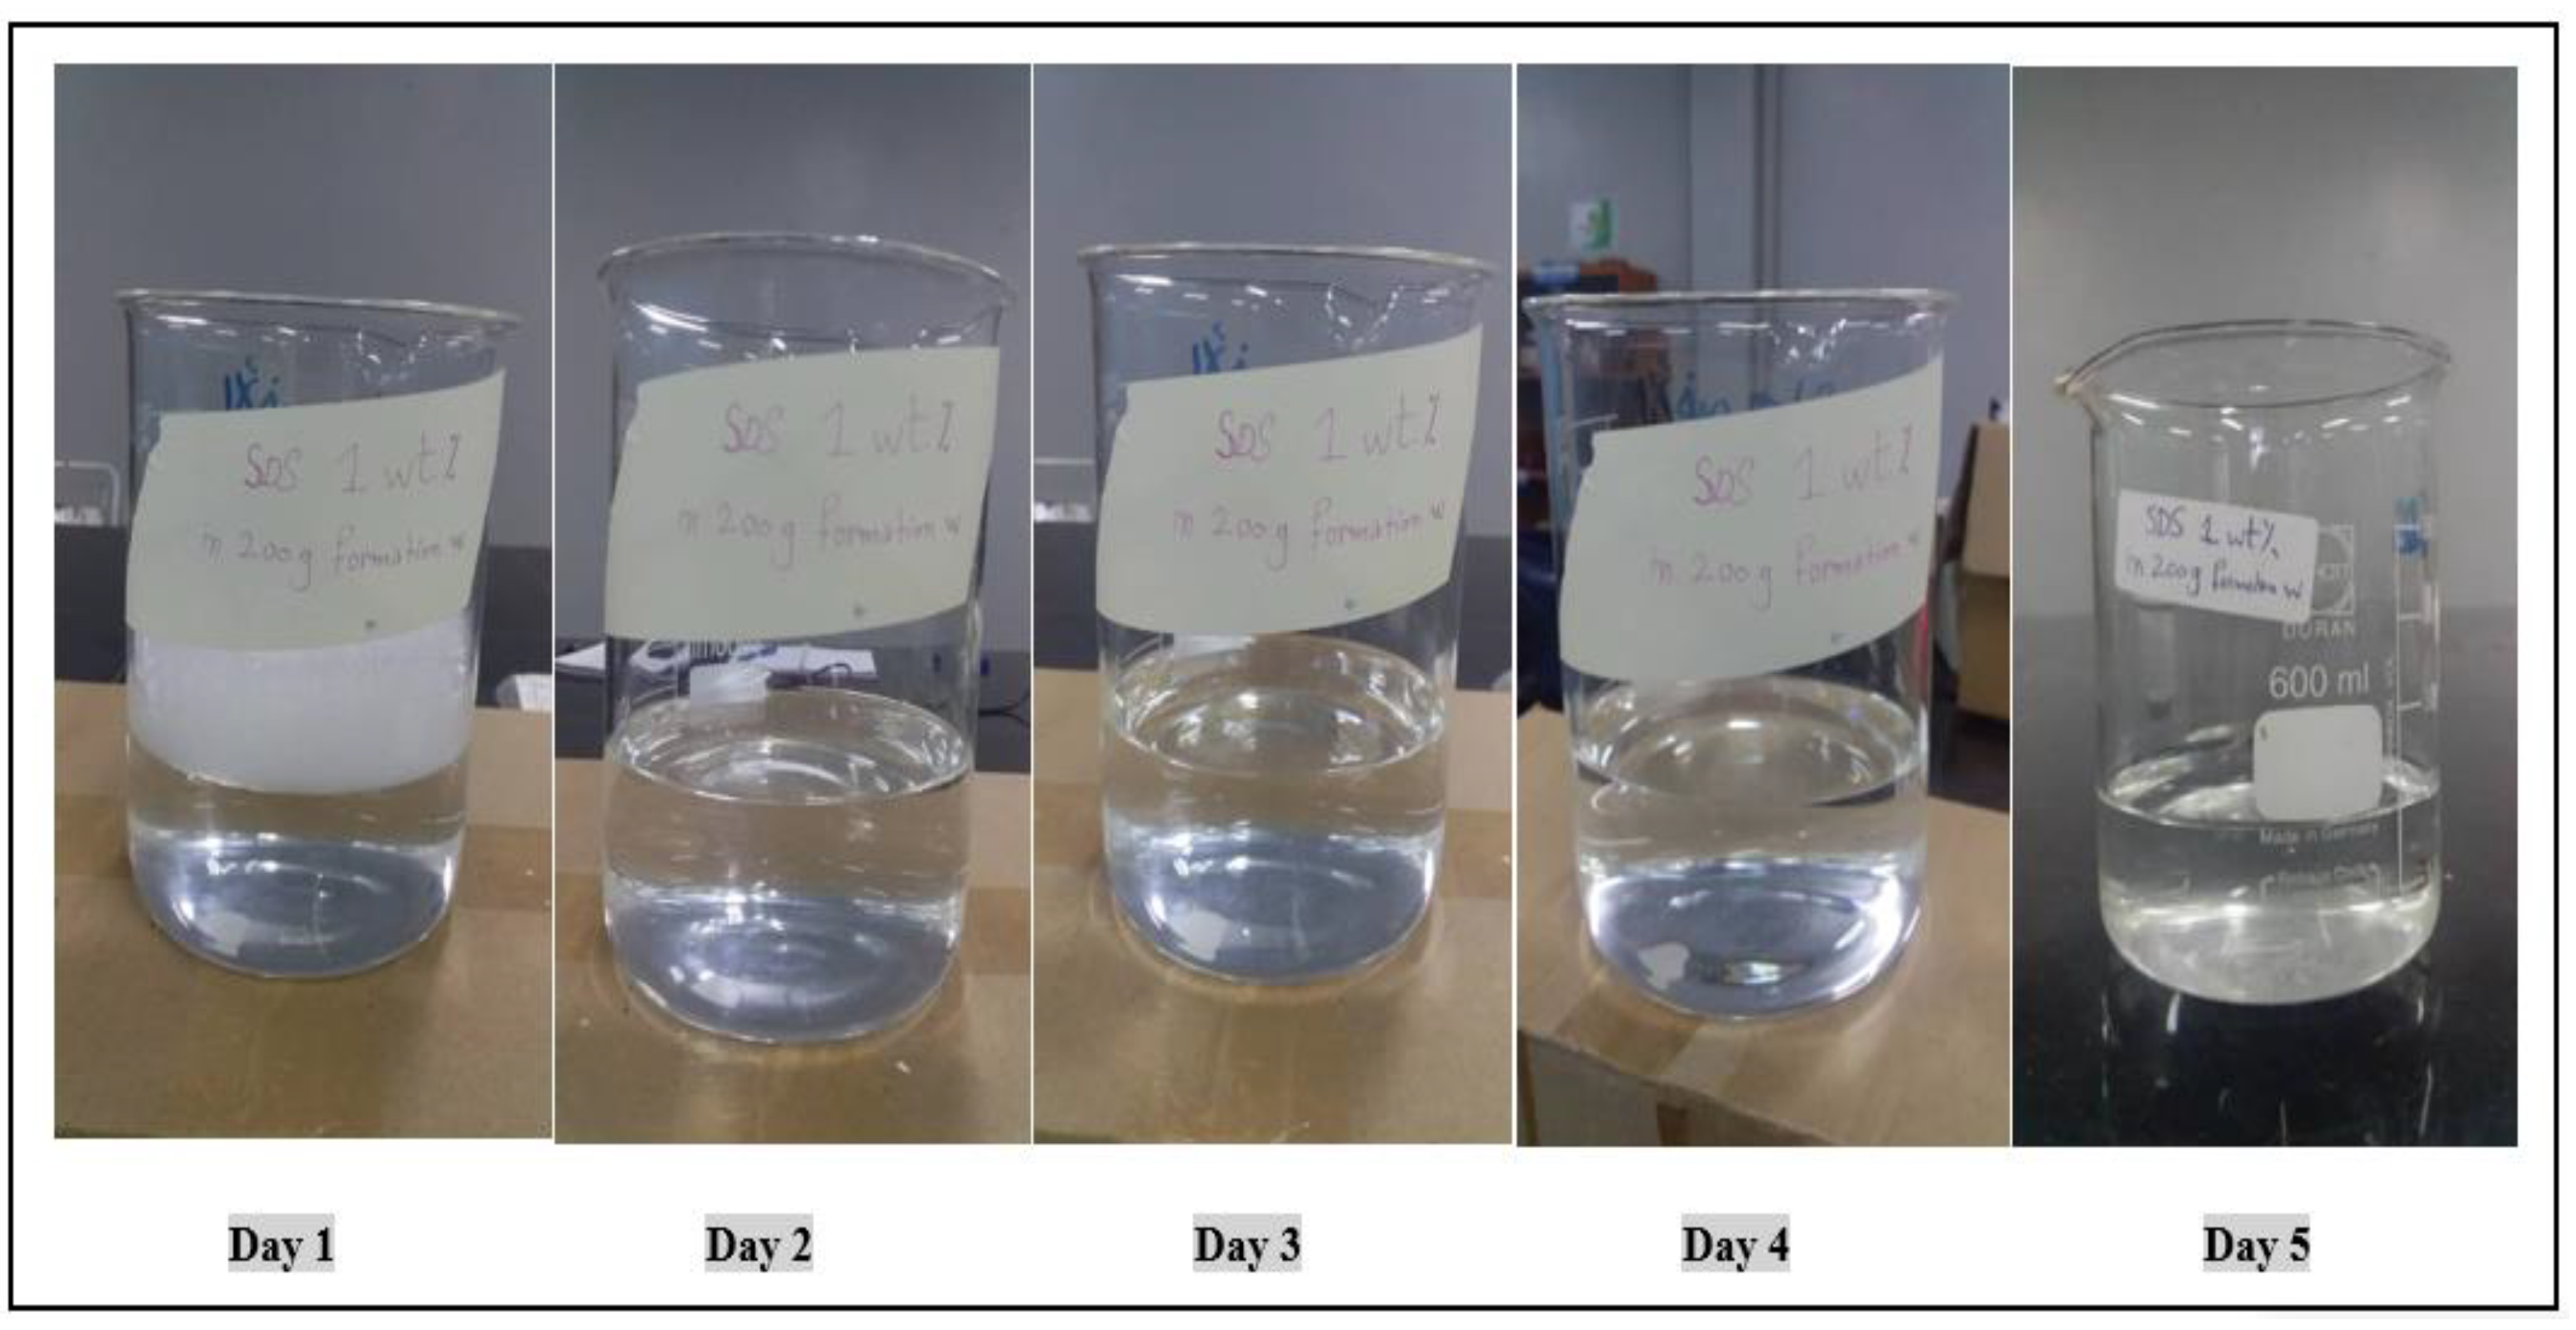
3.2.1. Sodium Dodecyl Sulfate (SDS) Solution
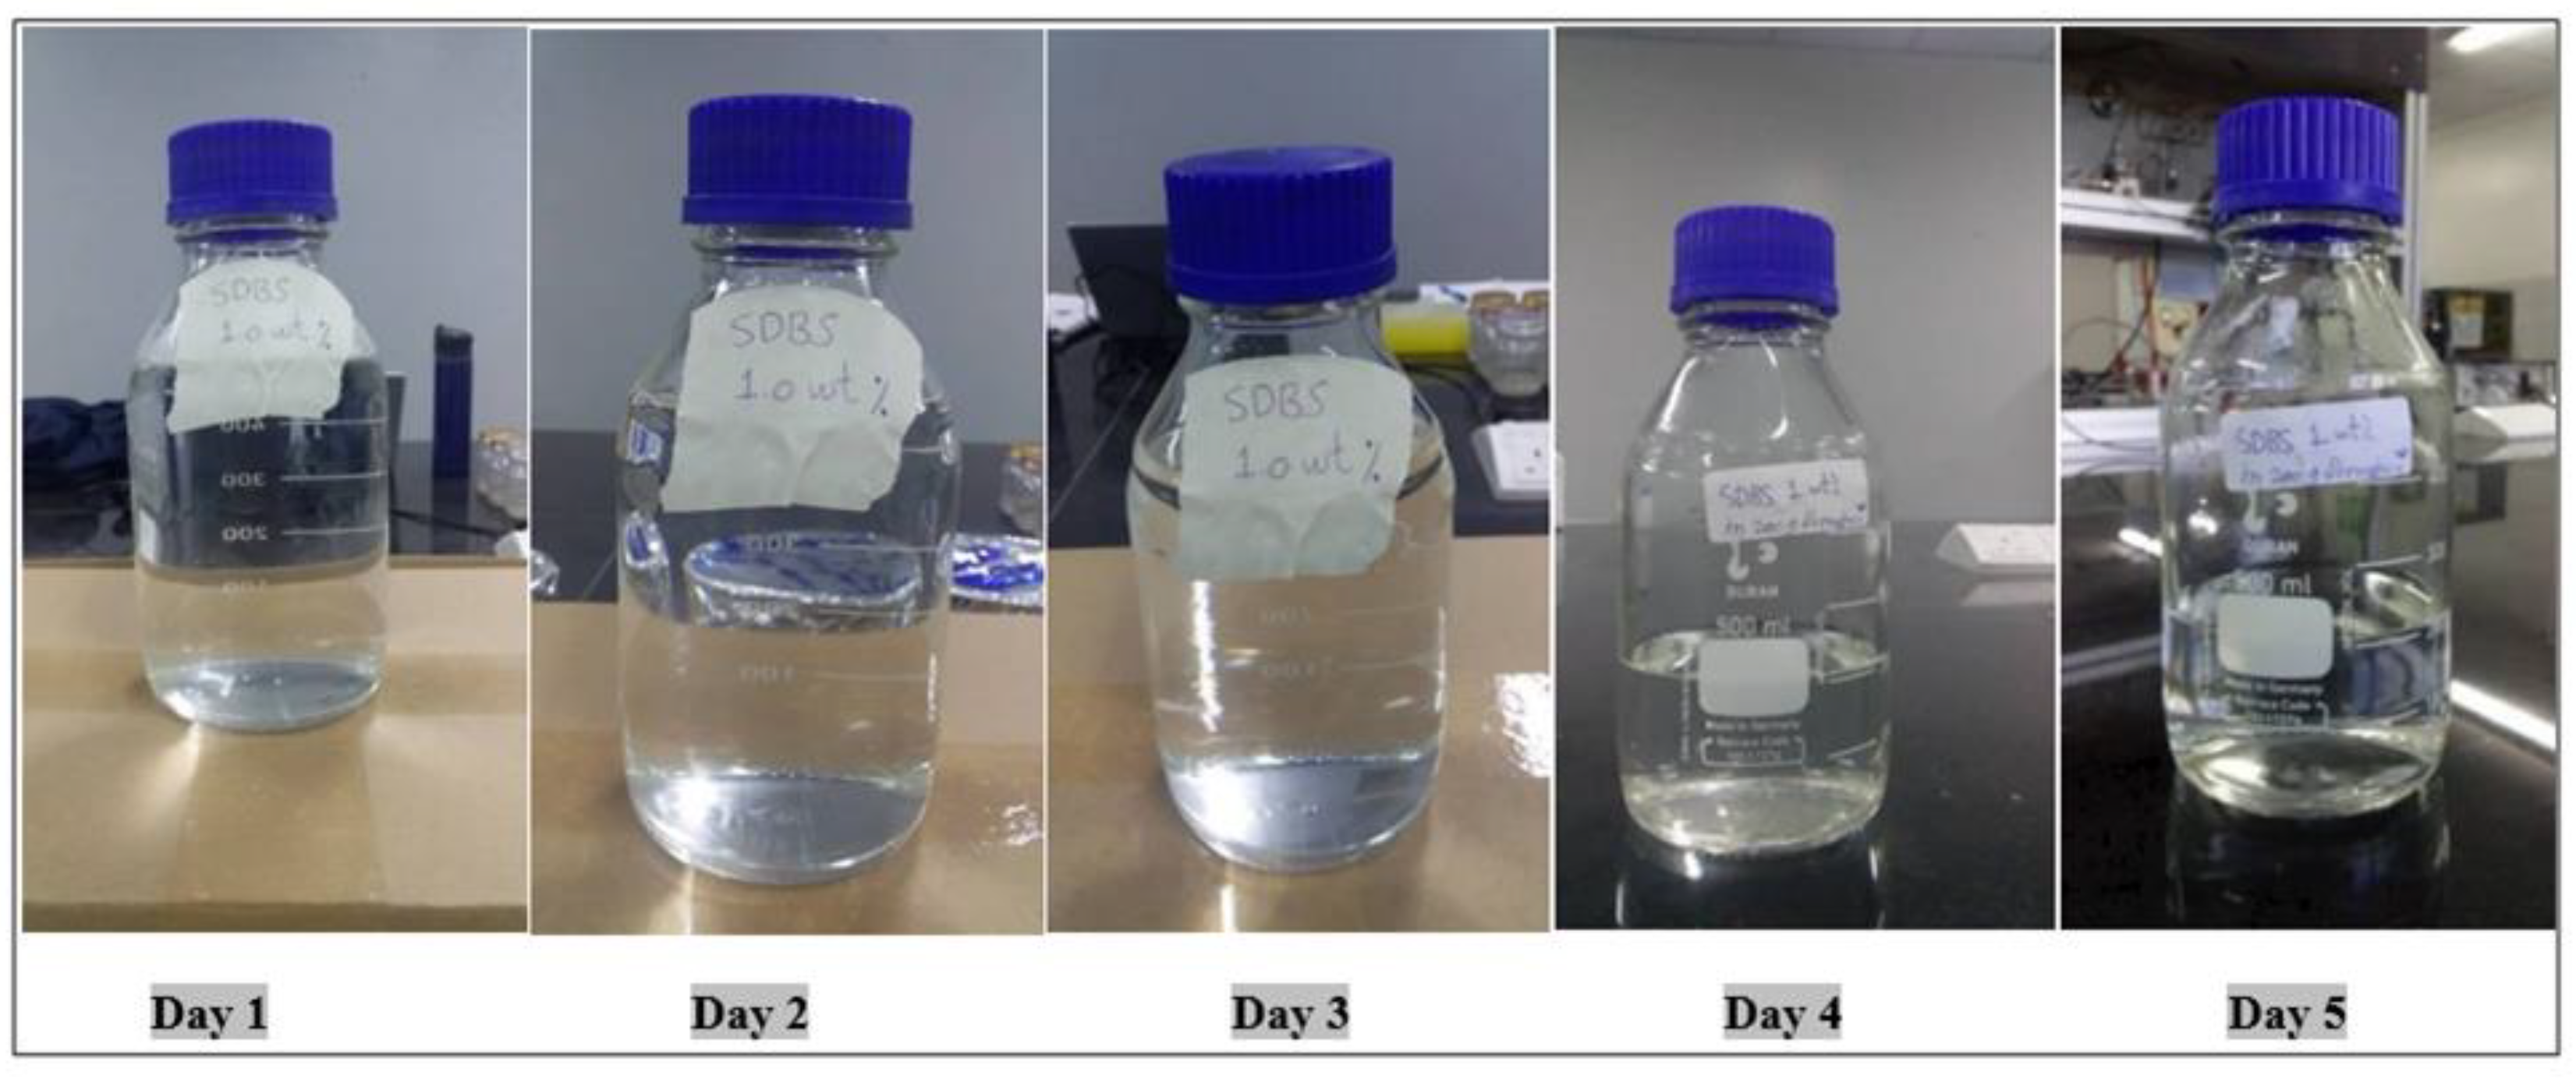
3.2.2. Sodium Dodecylbenzene Sulfonate (SDBS) Solution
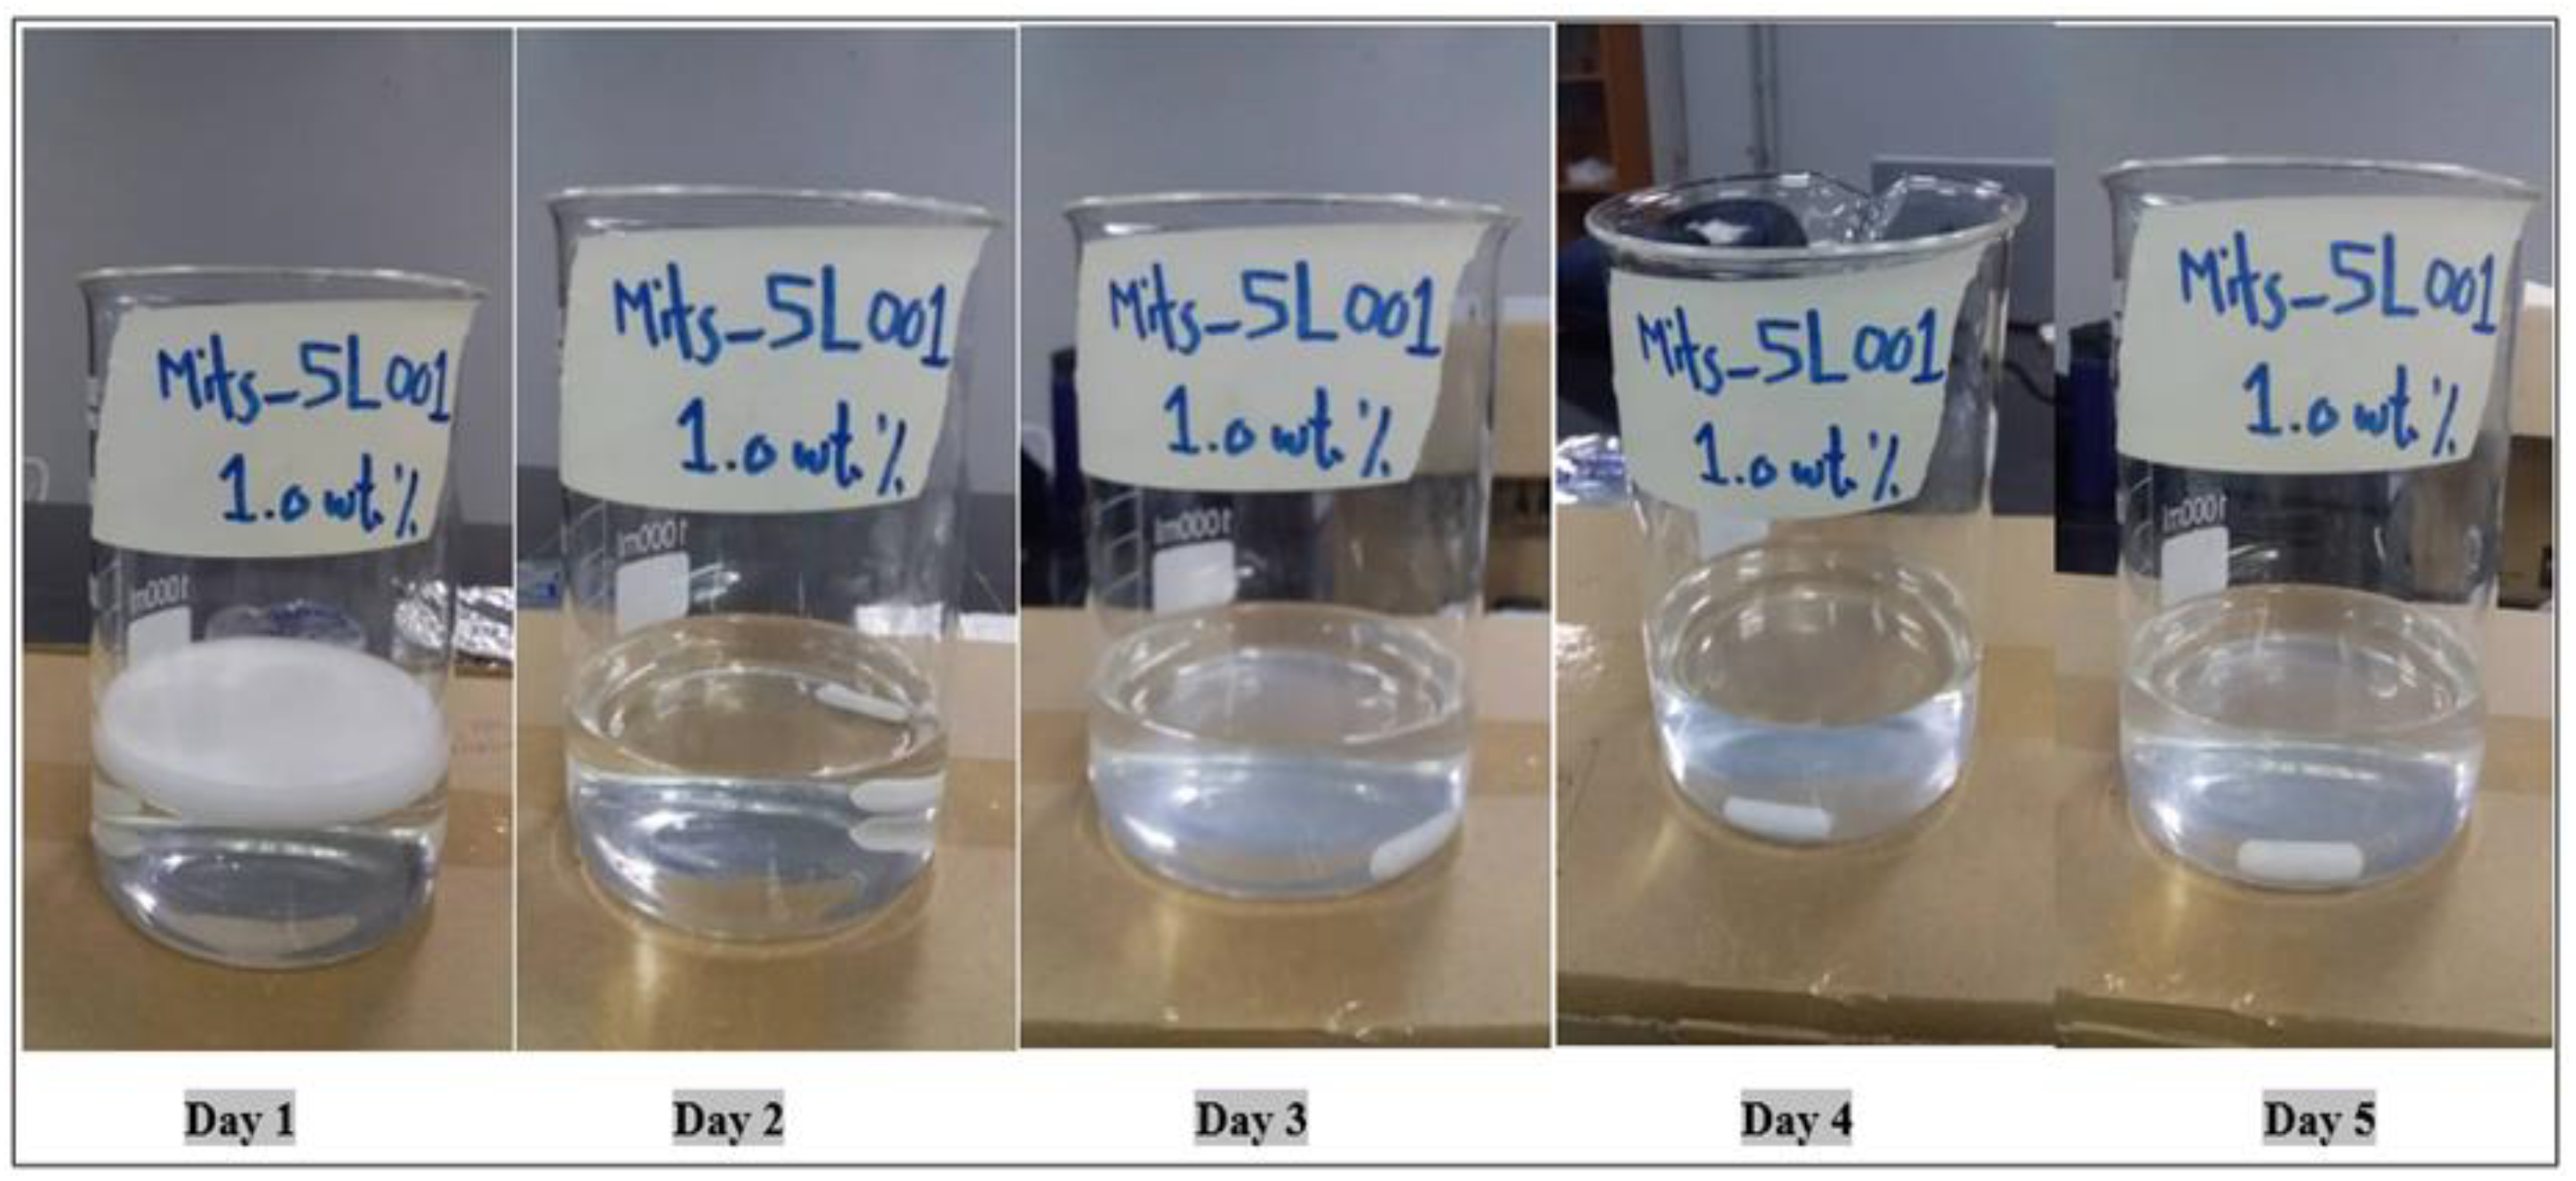
3.2.3. Mits-5L001 Solution
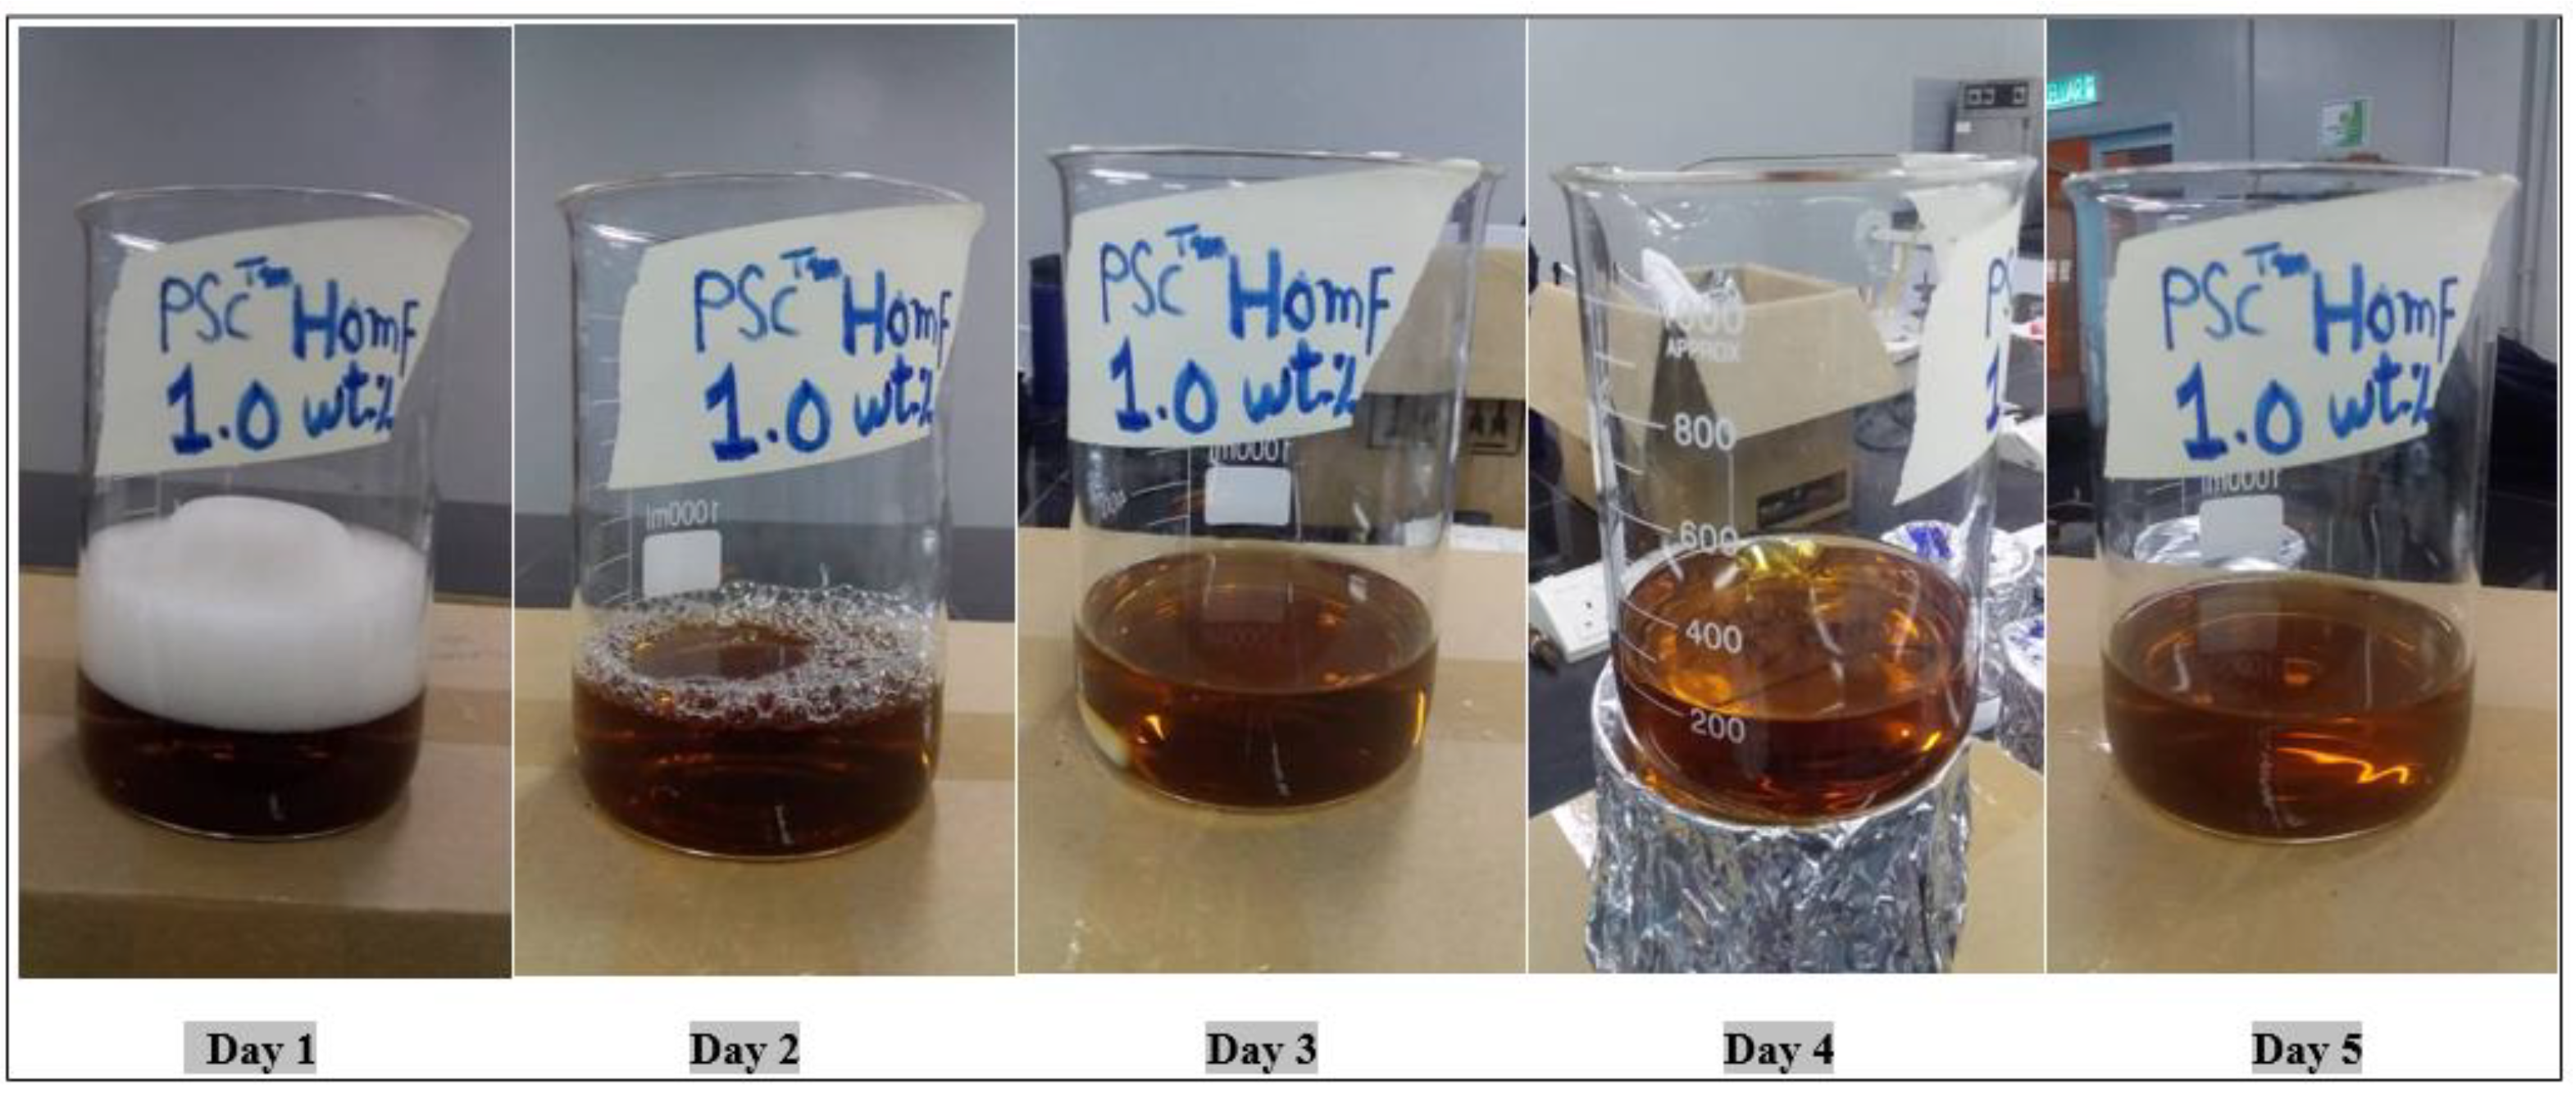
3.2.4. PCMTM HOMF Solution
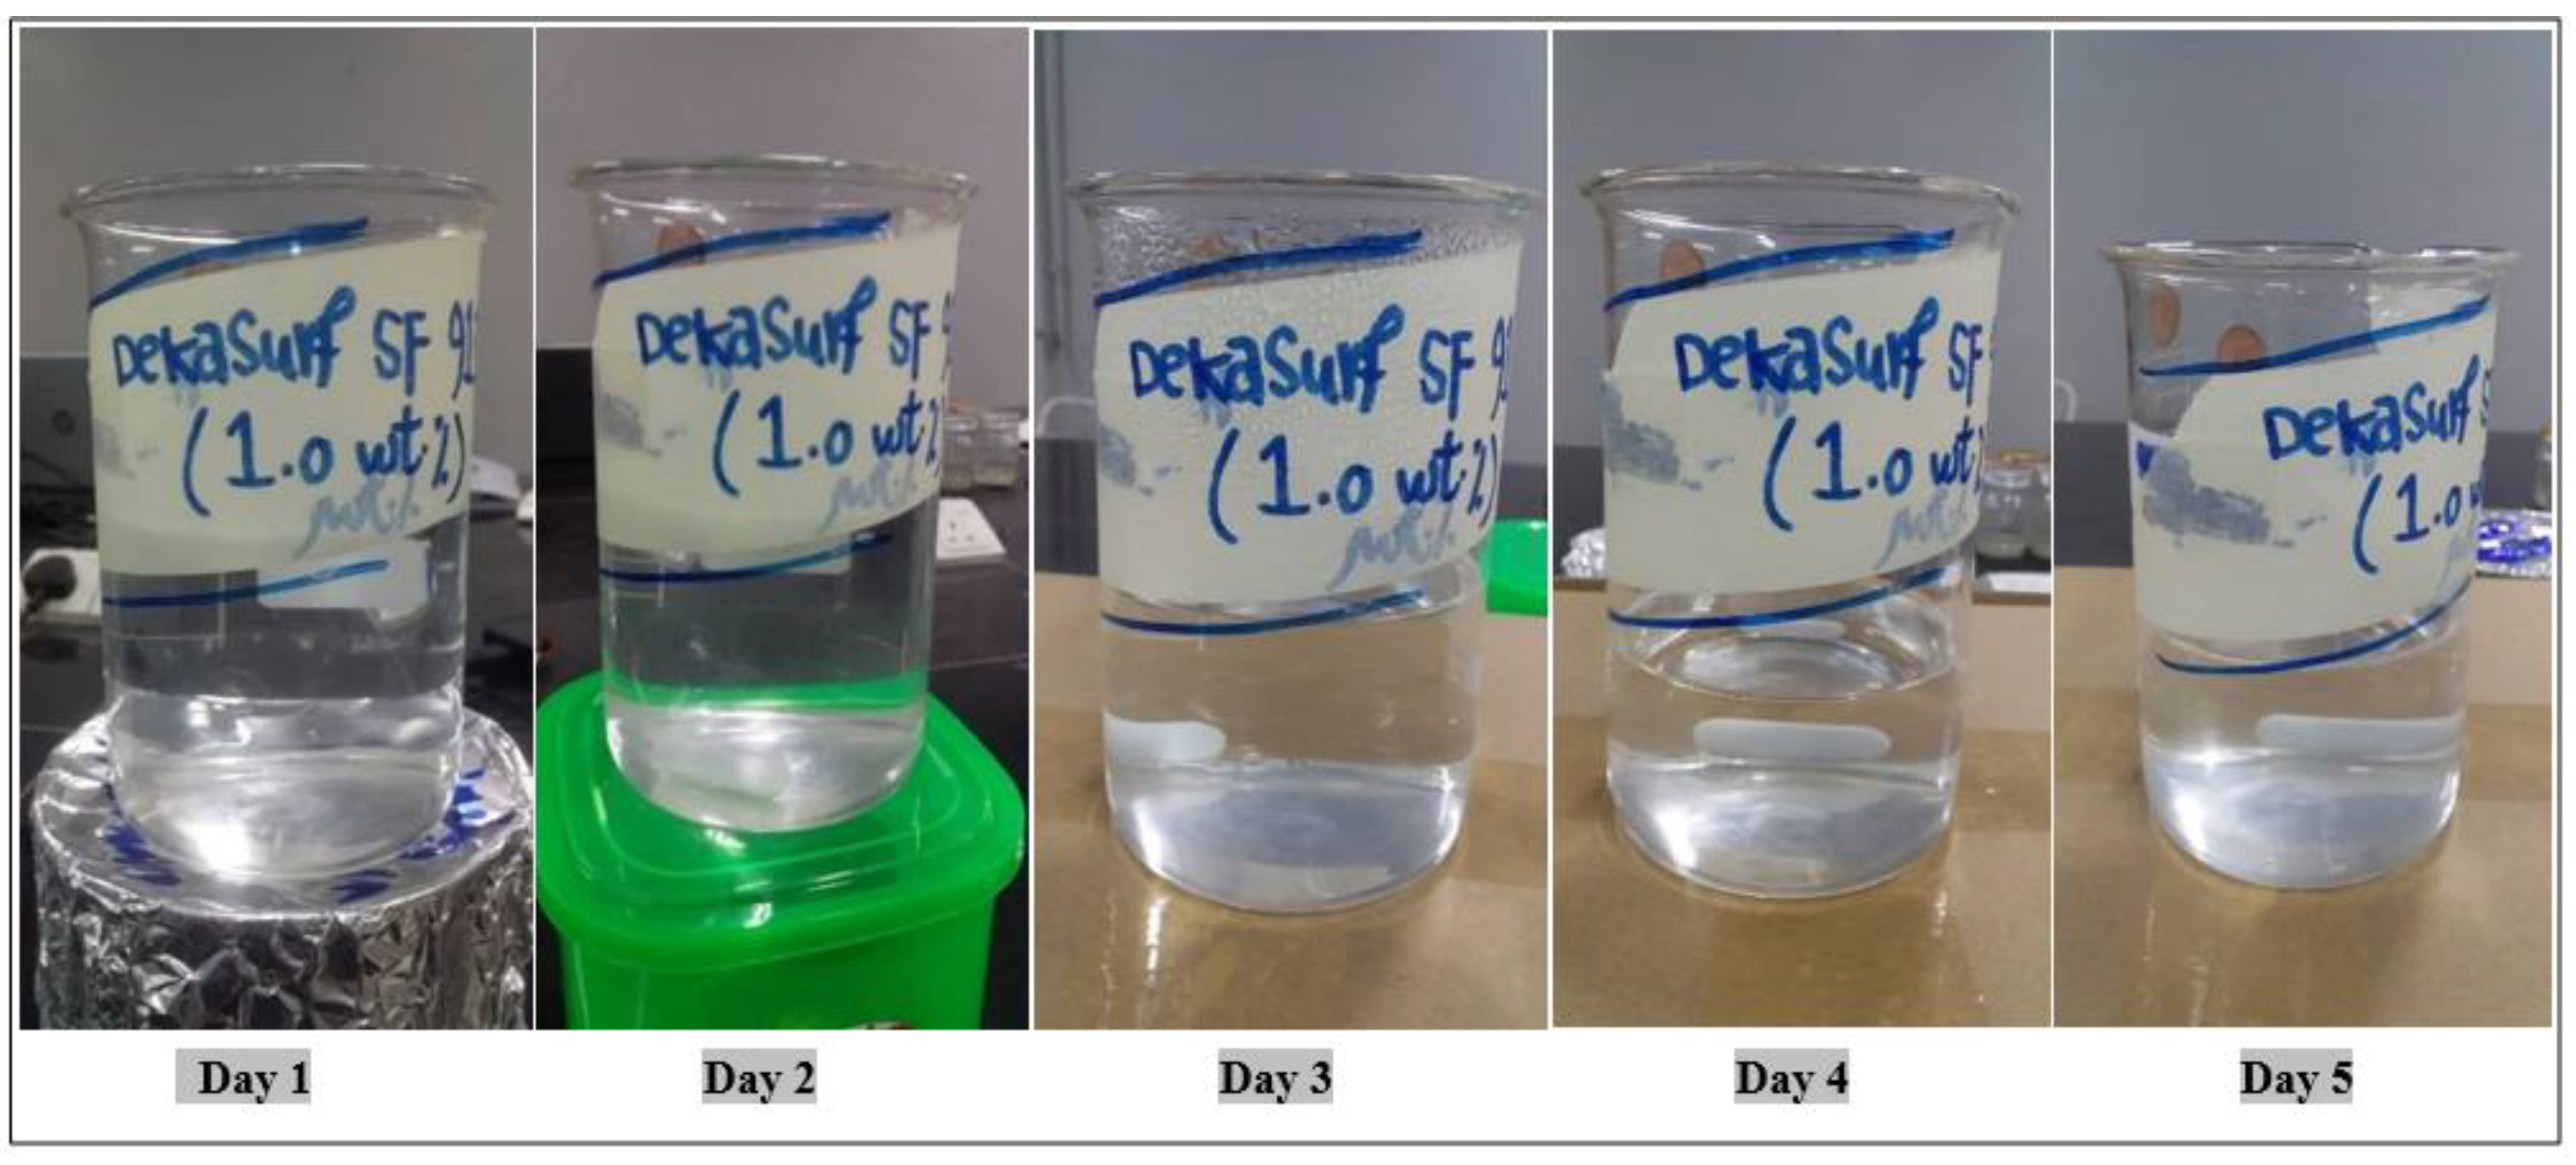
3.2.5. Dekasurf SF 9136 Solution
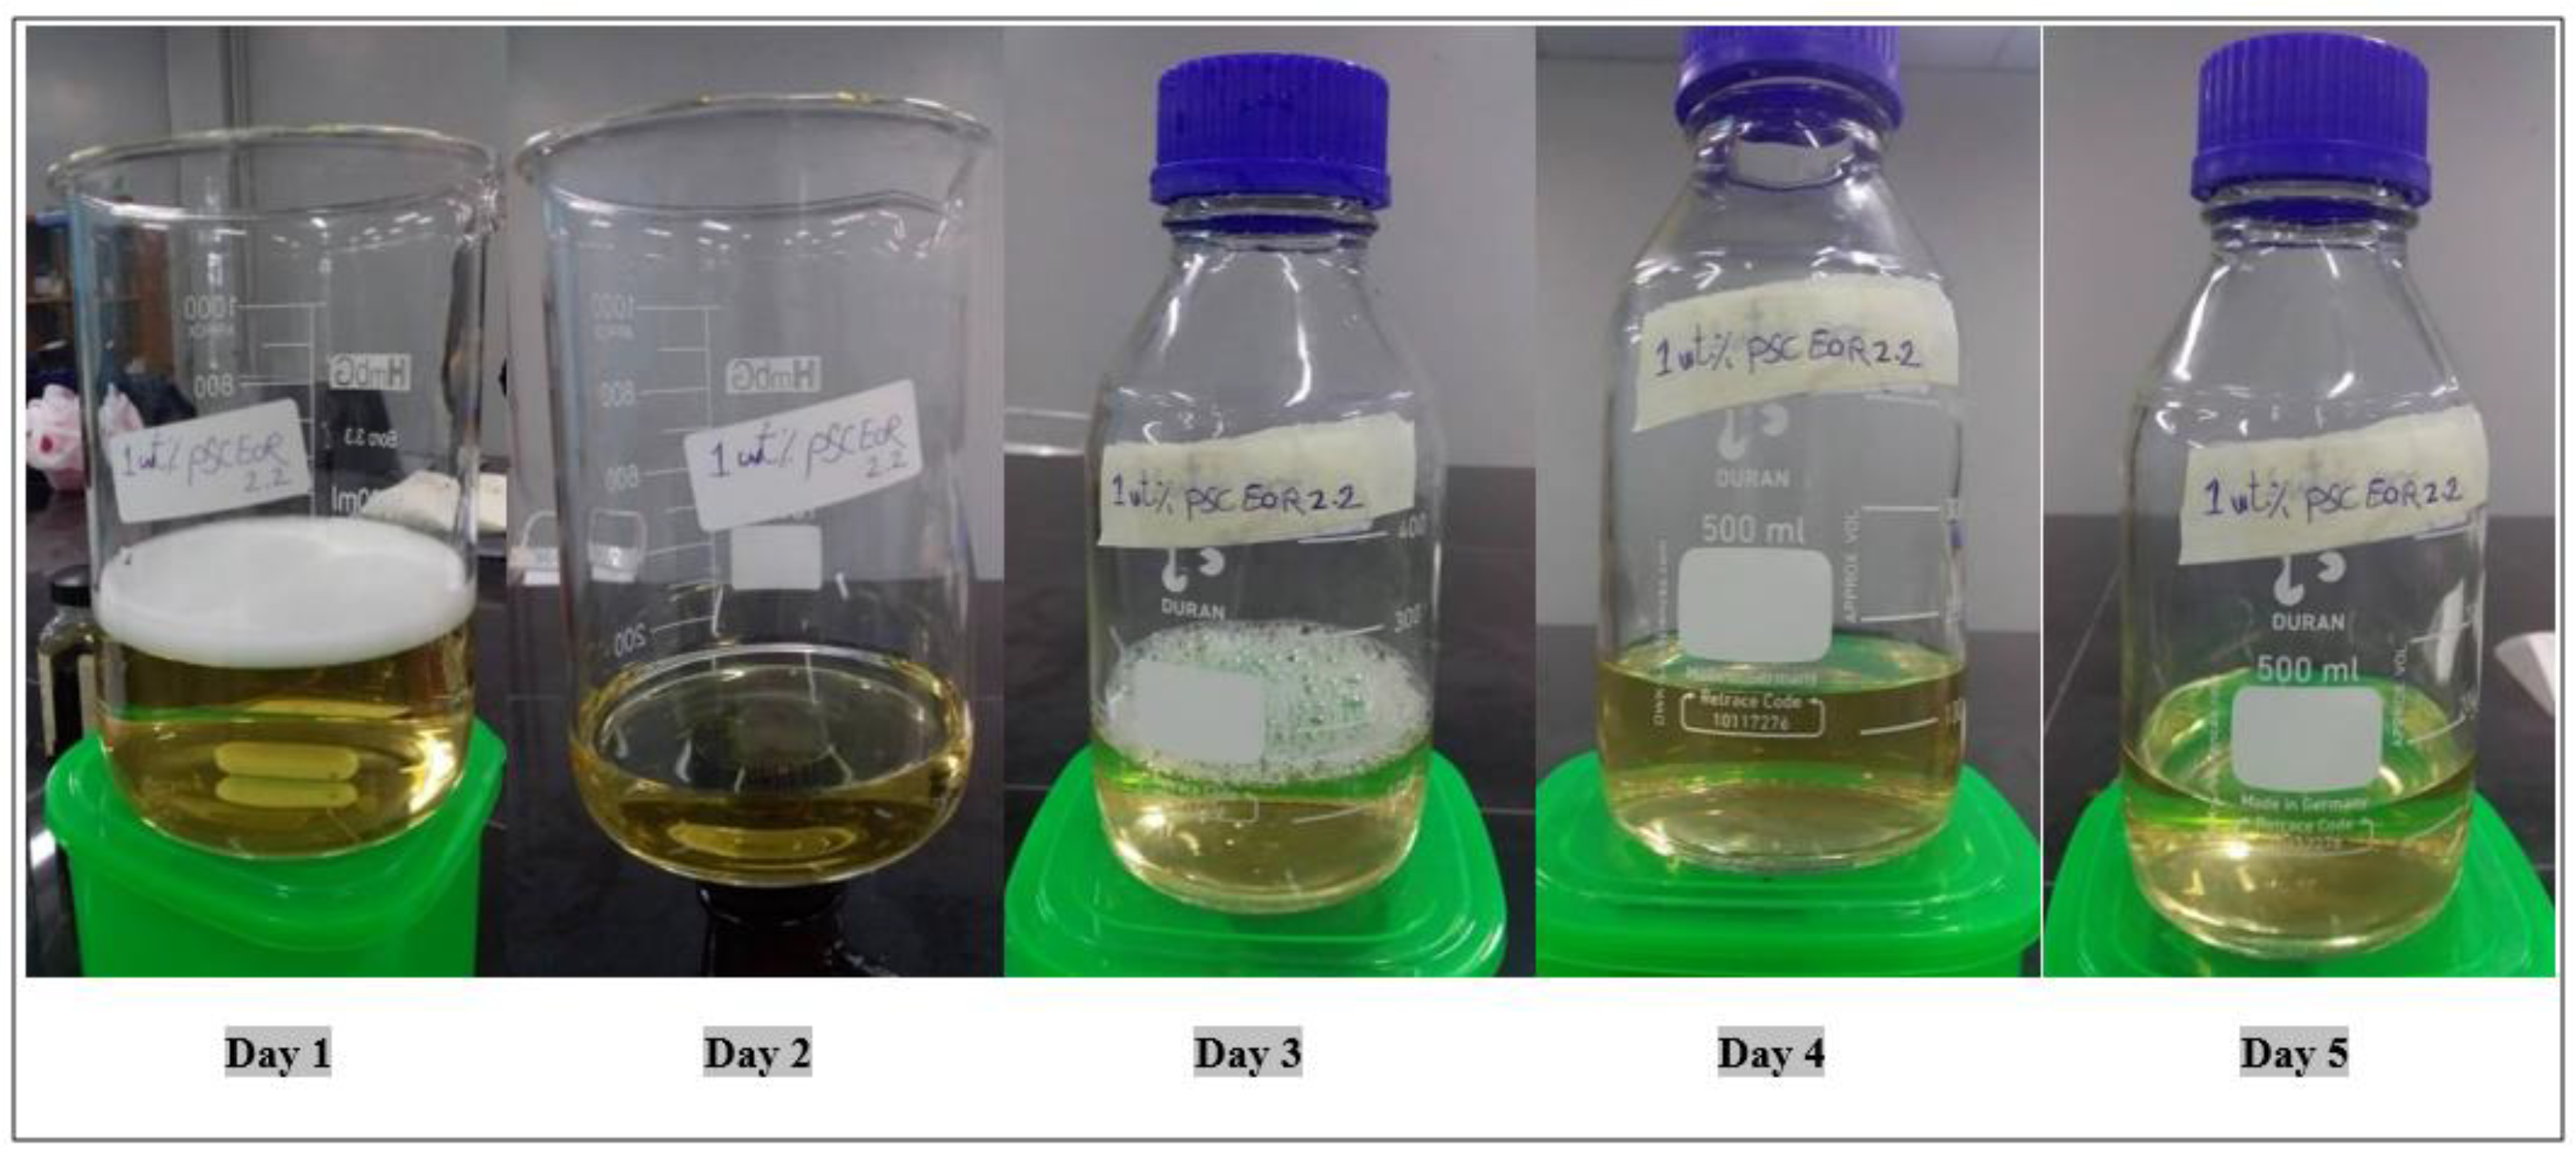
3.2.6. Proprietary Solution PSC EOR 2.2
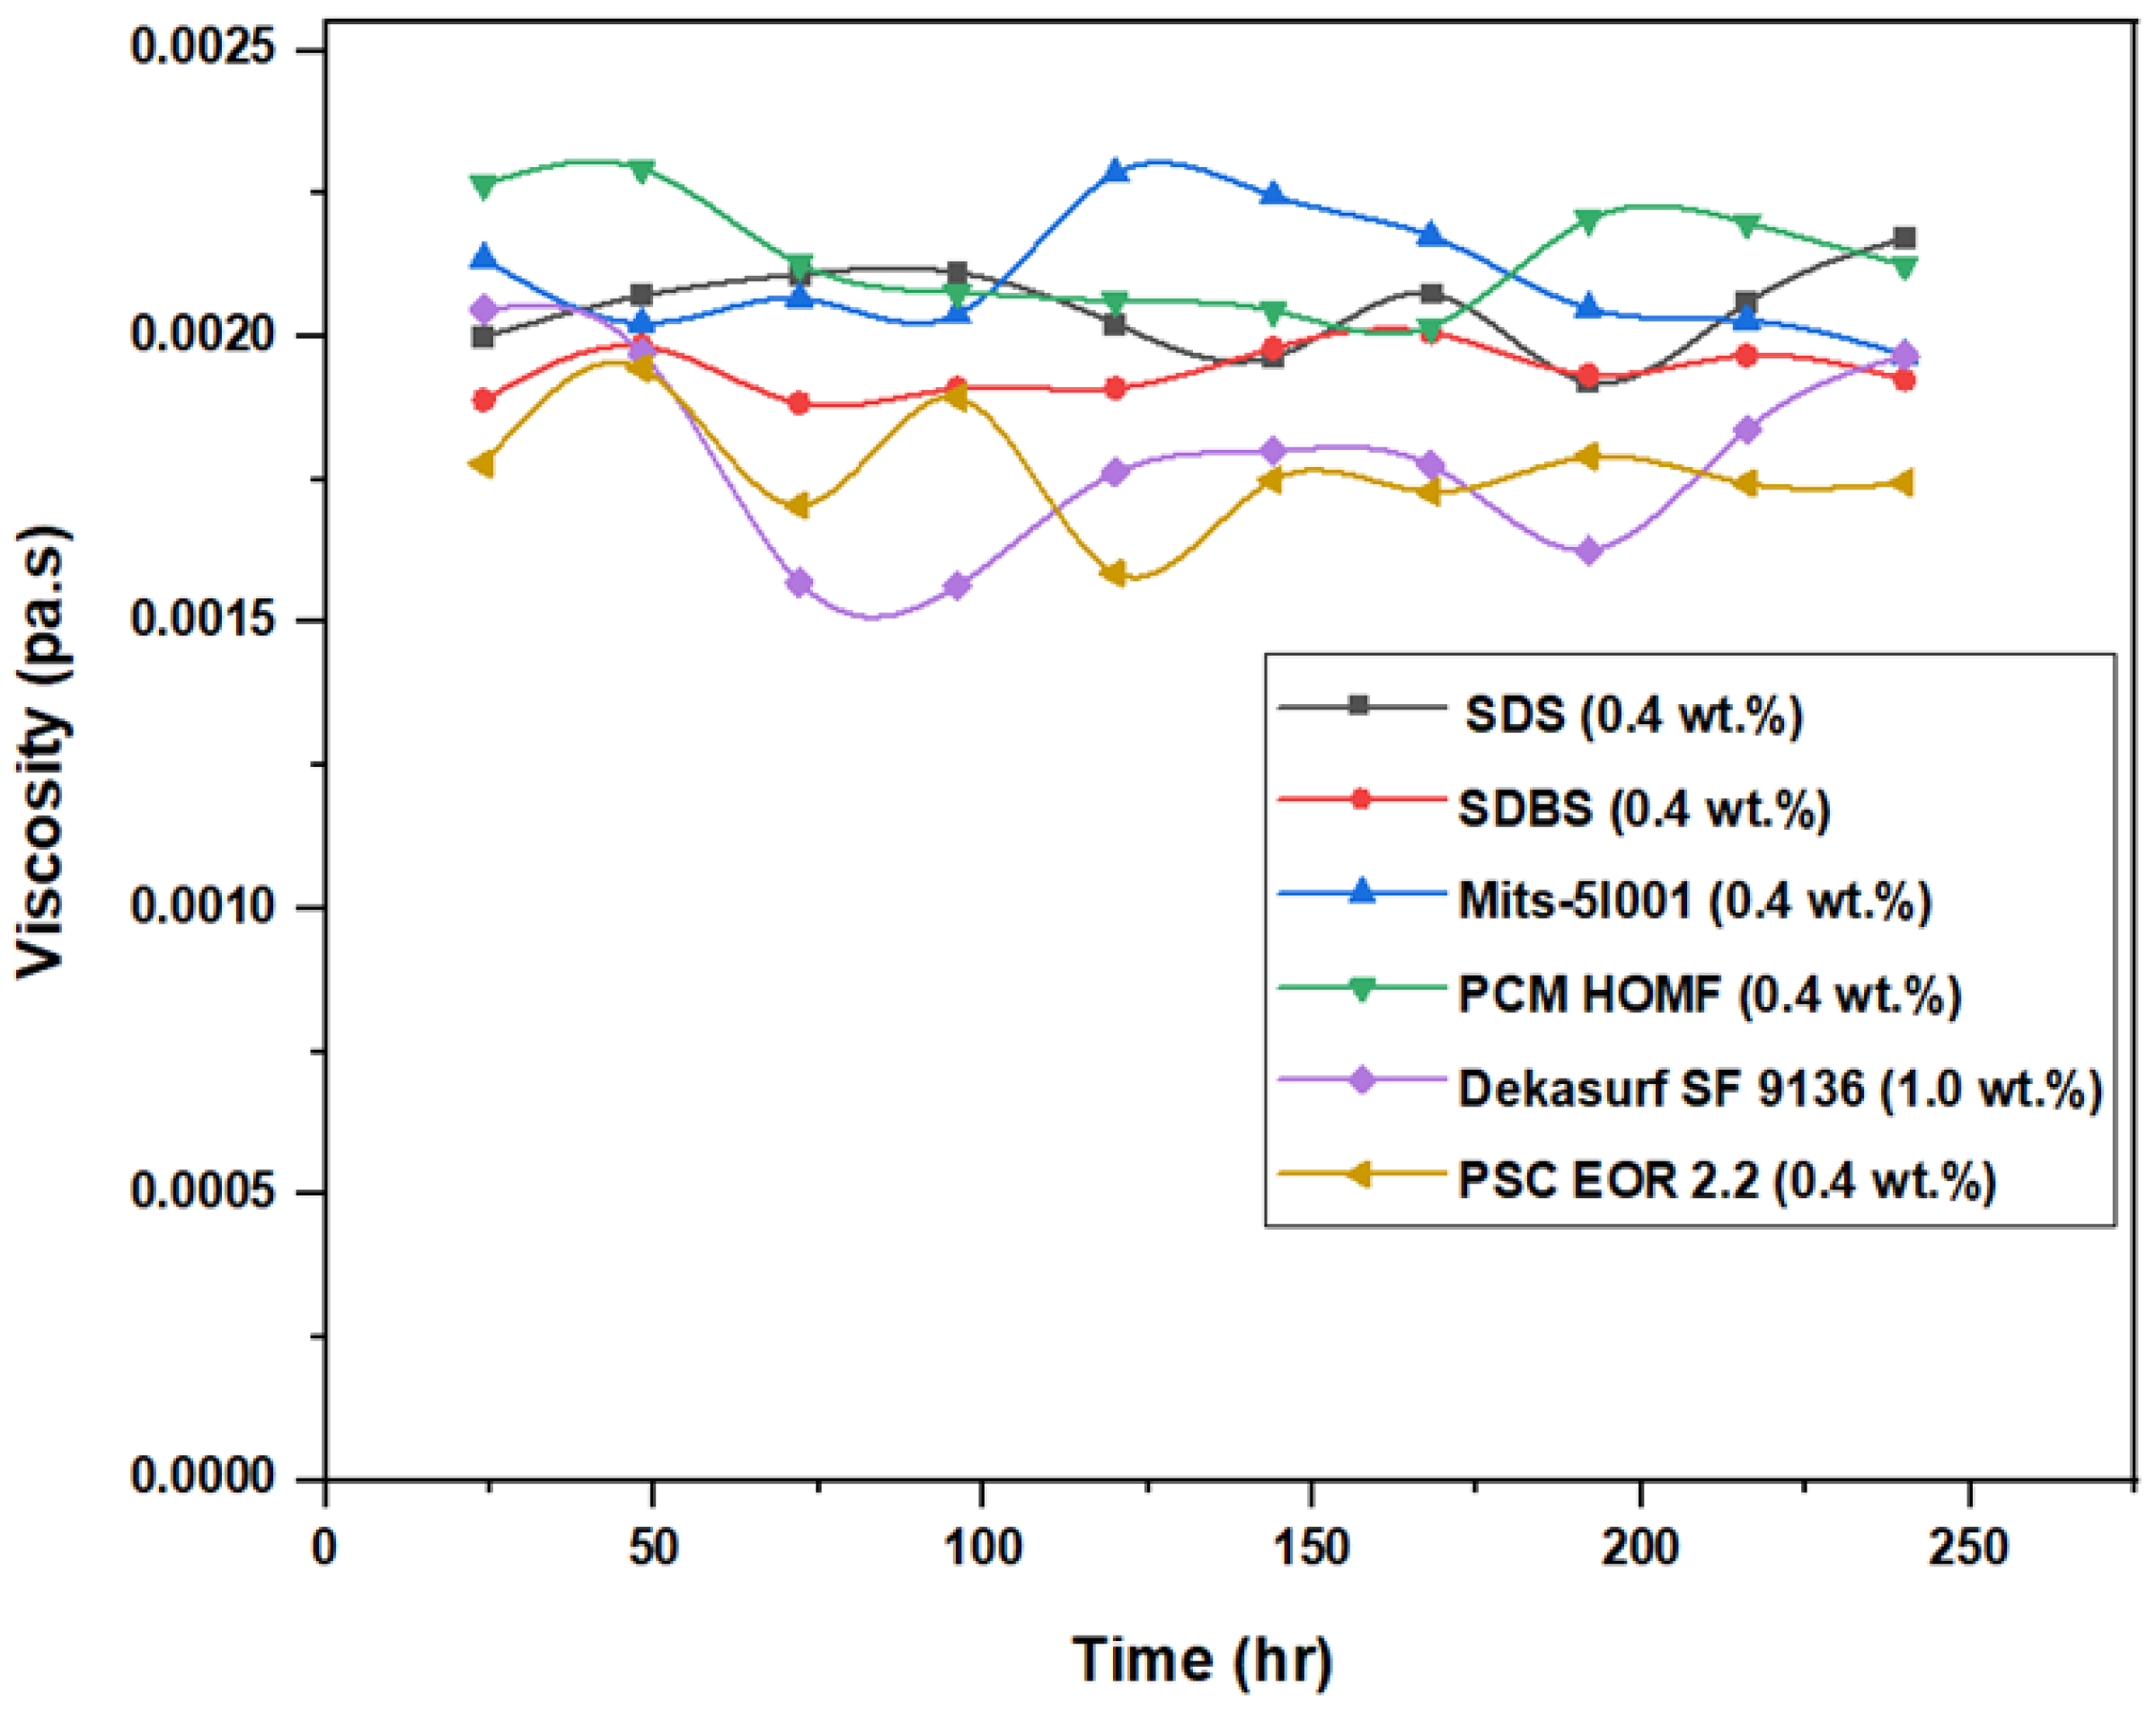
3.3. Viscosity Stability and Surface Tension Measurements
3.4. Adsorption and Injectivity Evaluation
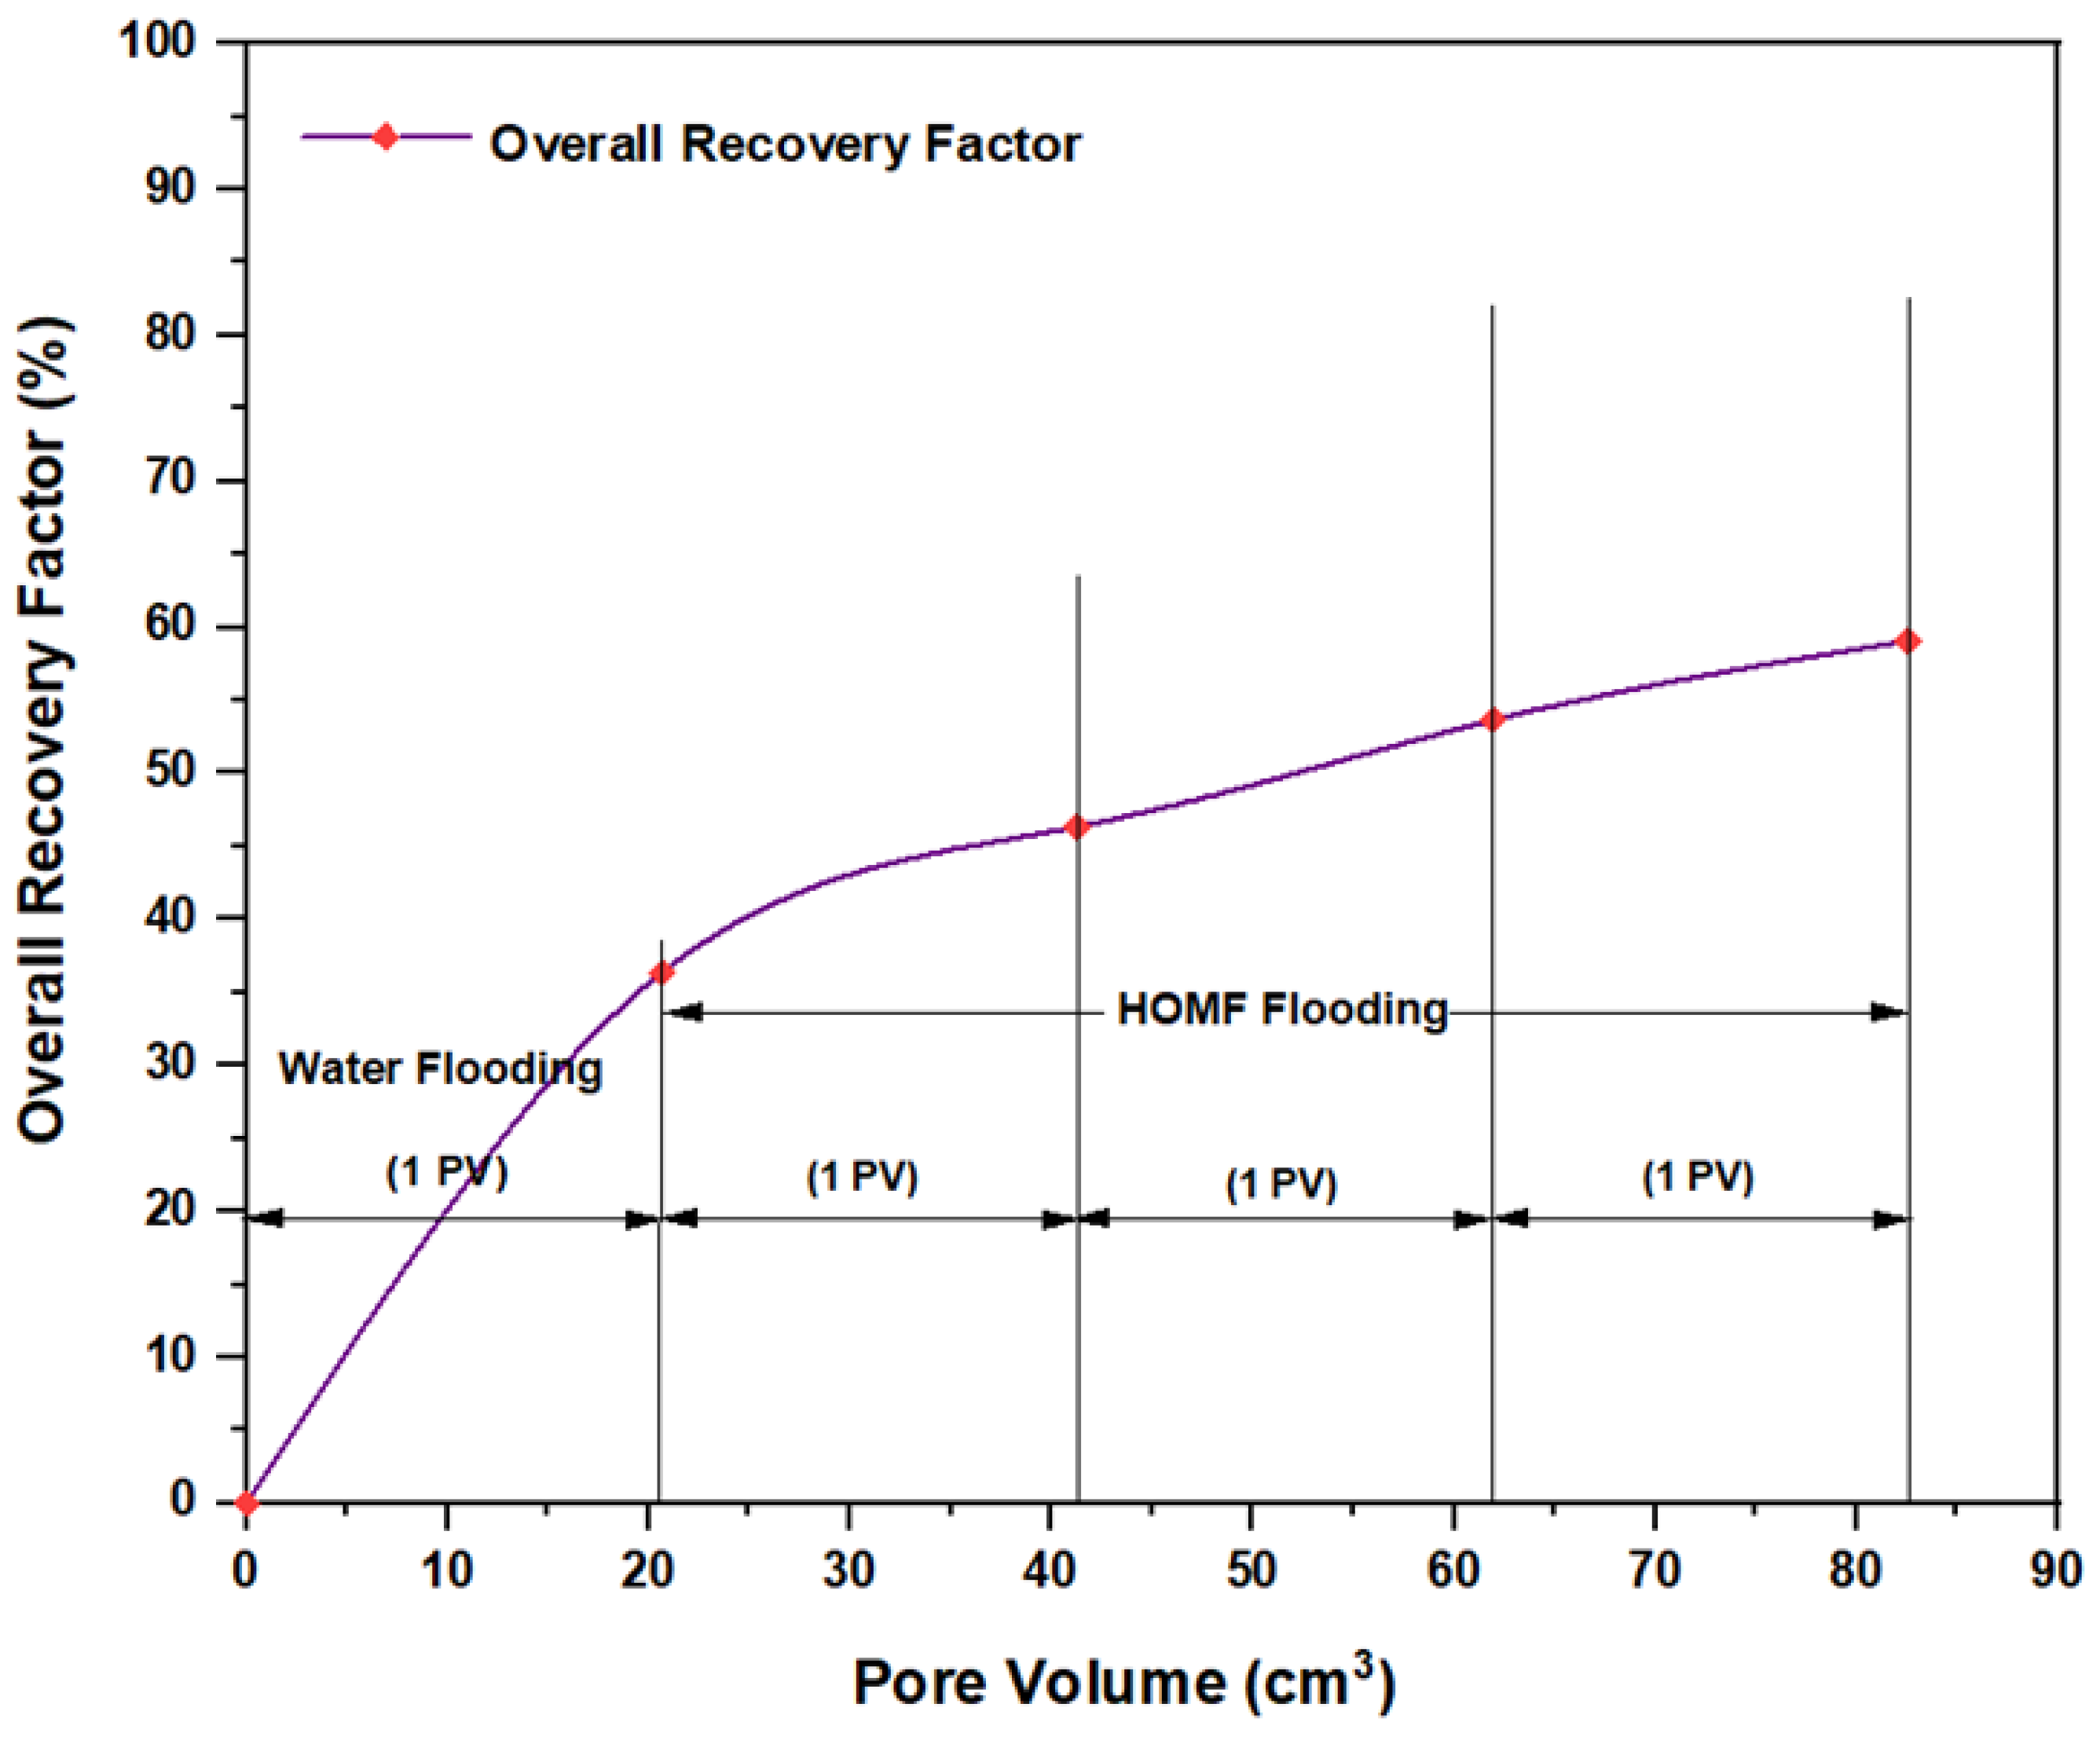
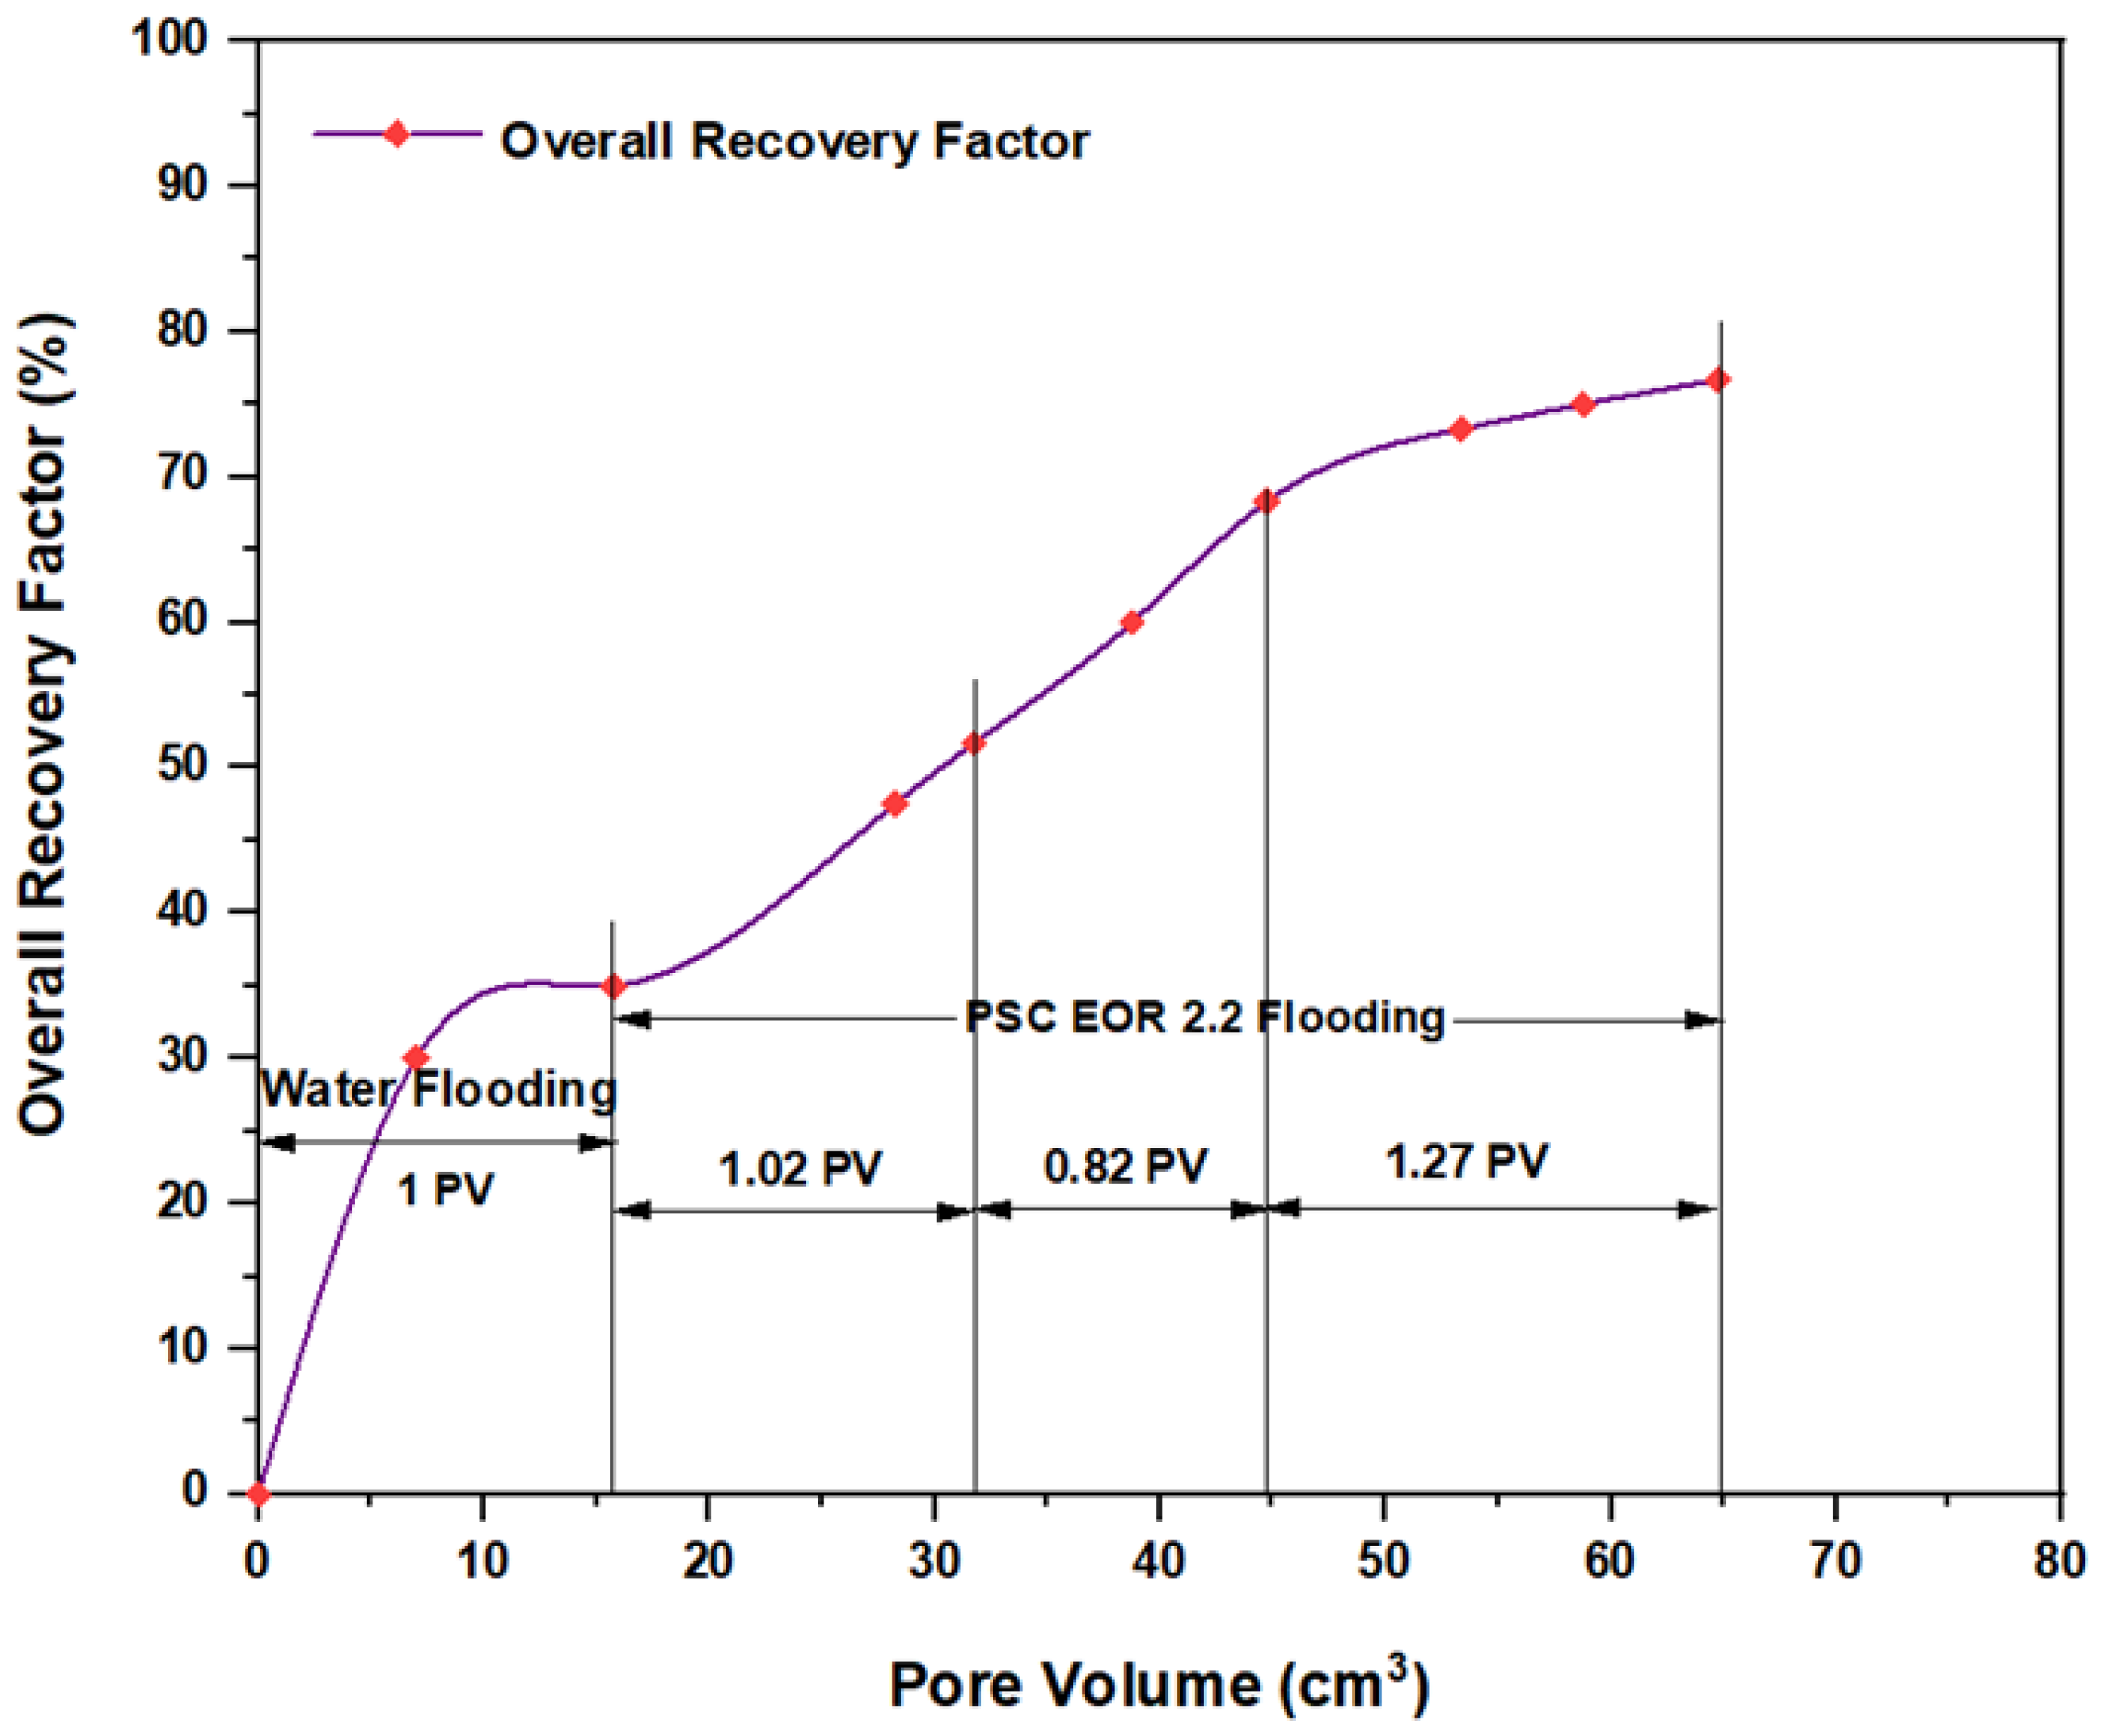
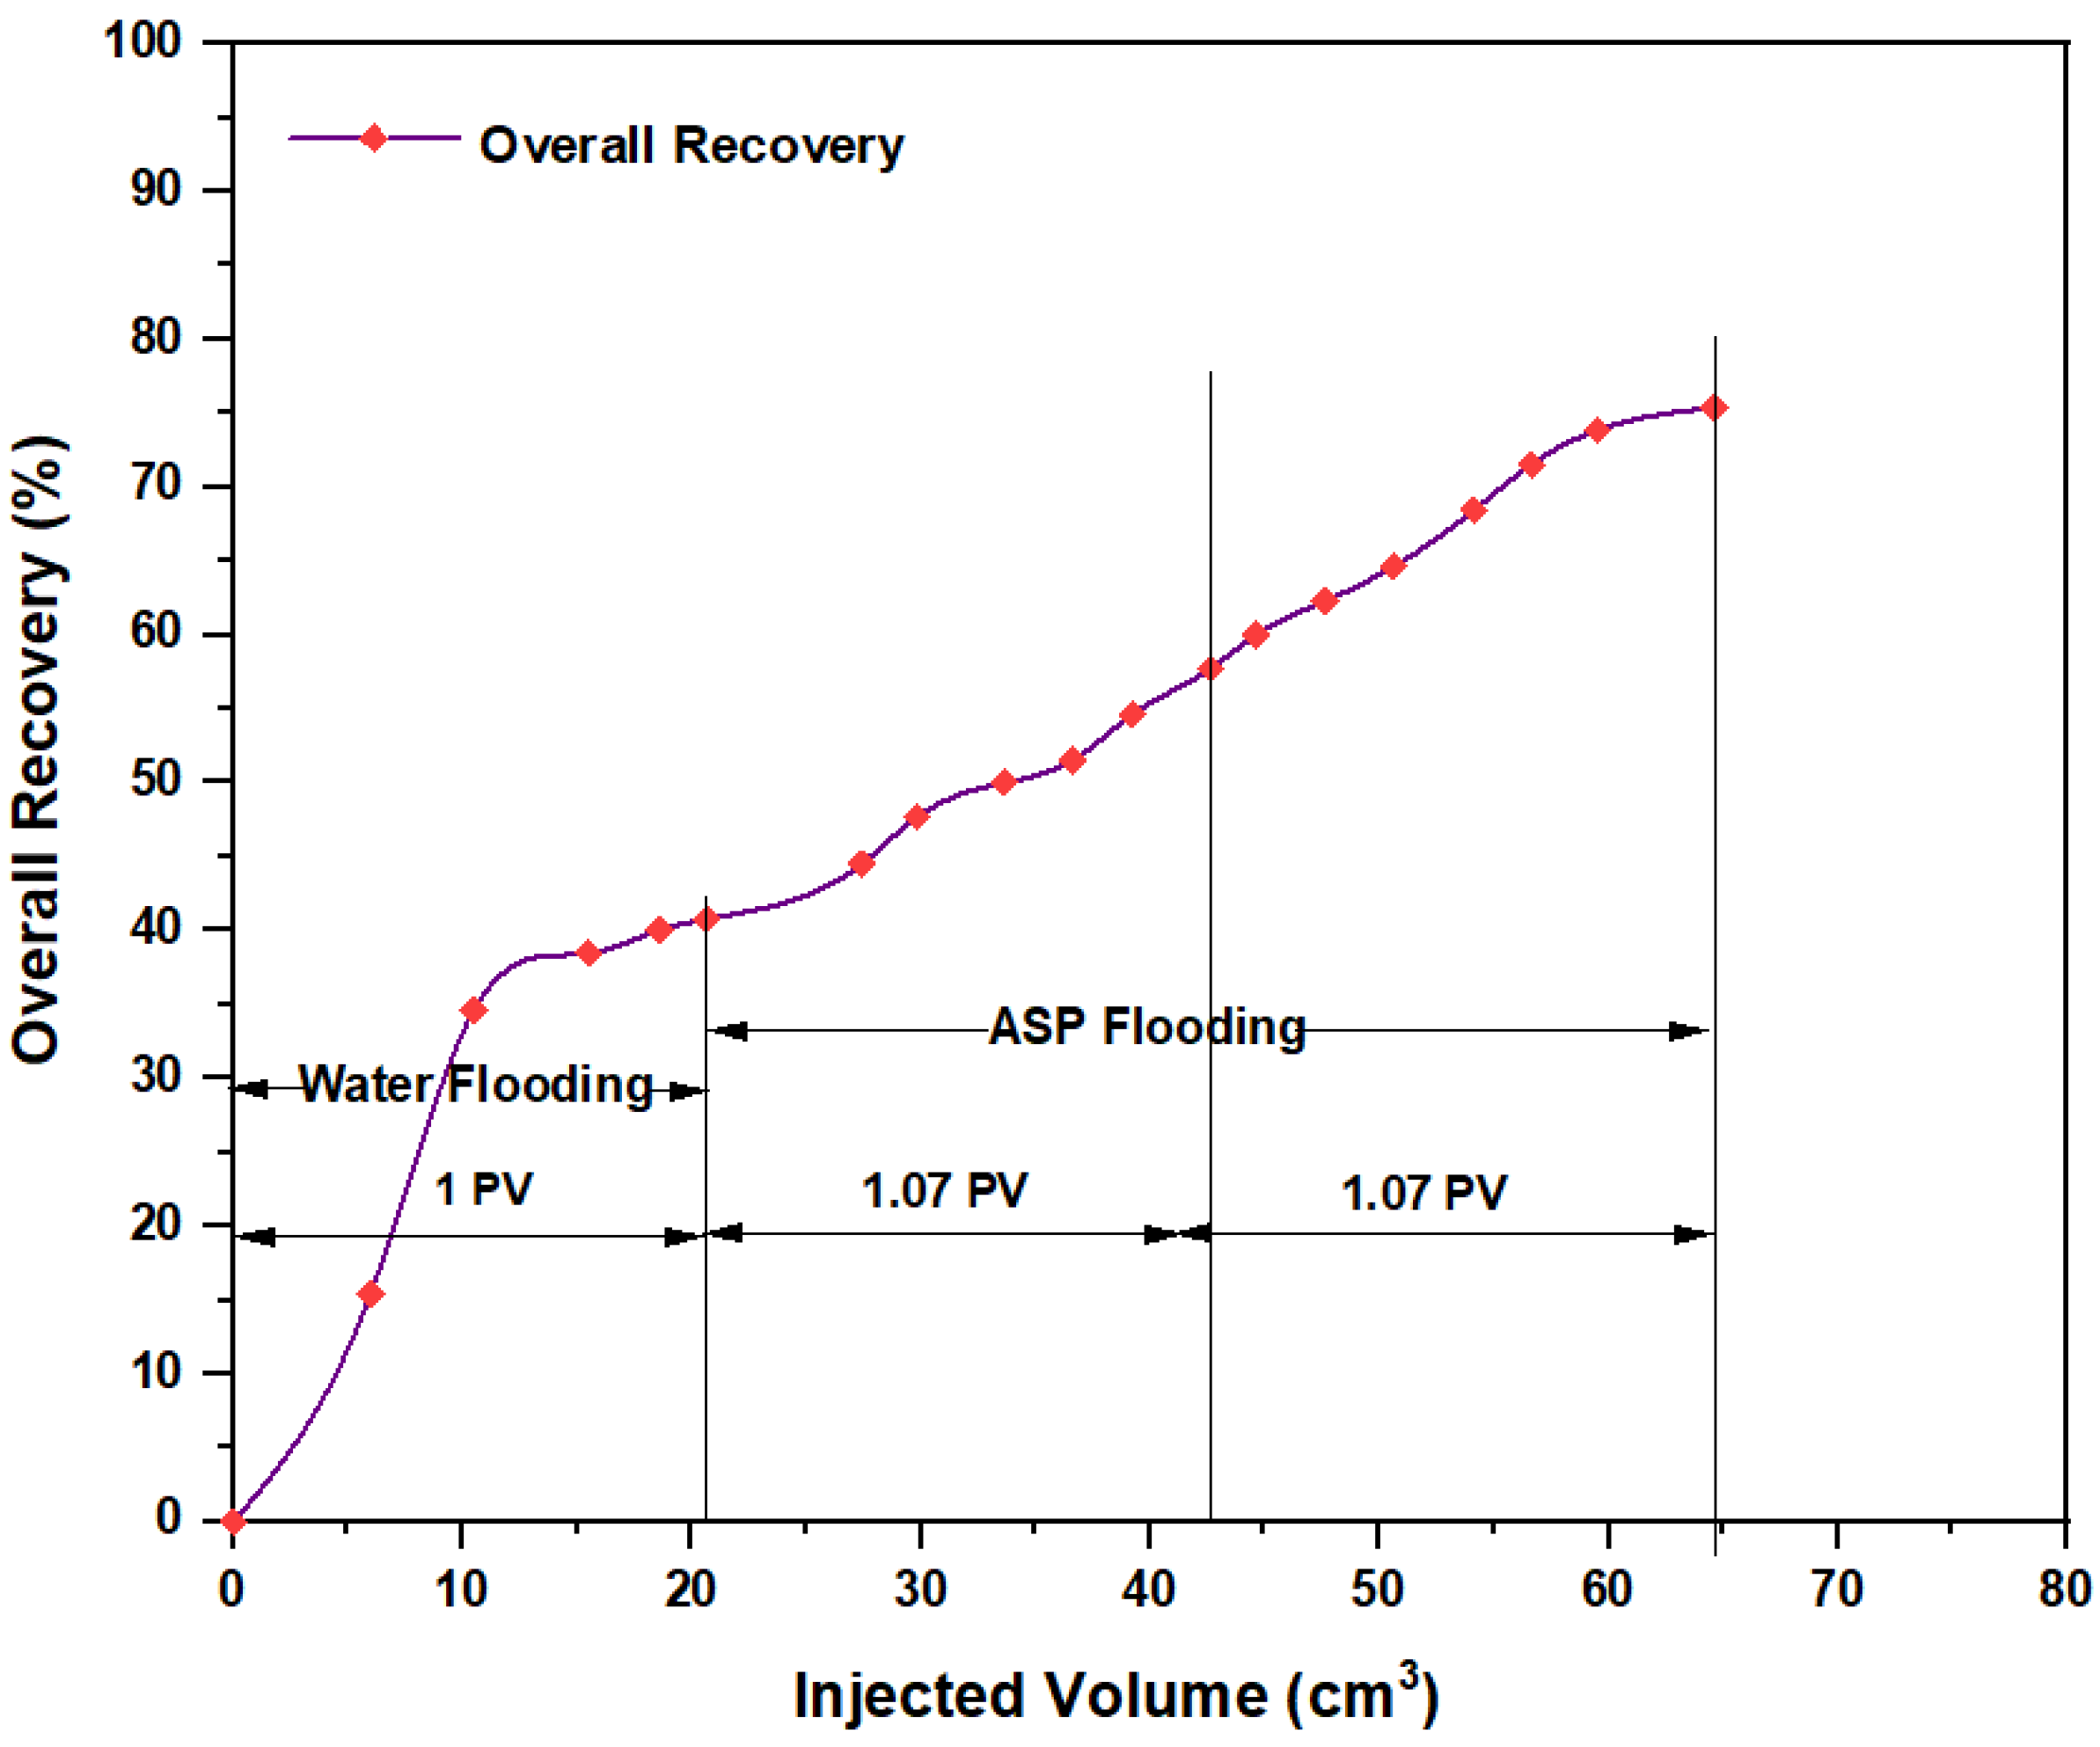
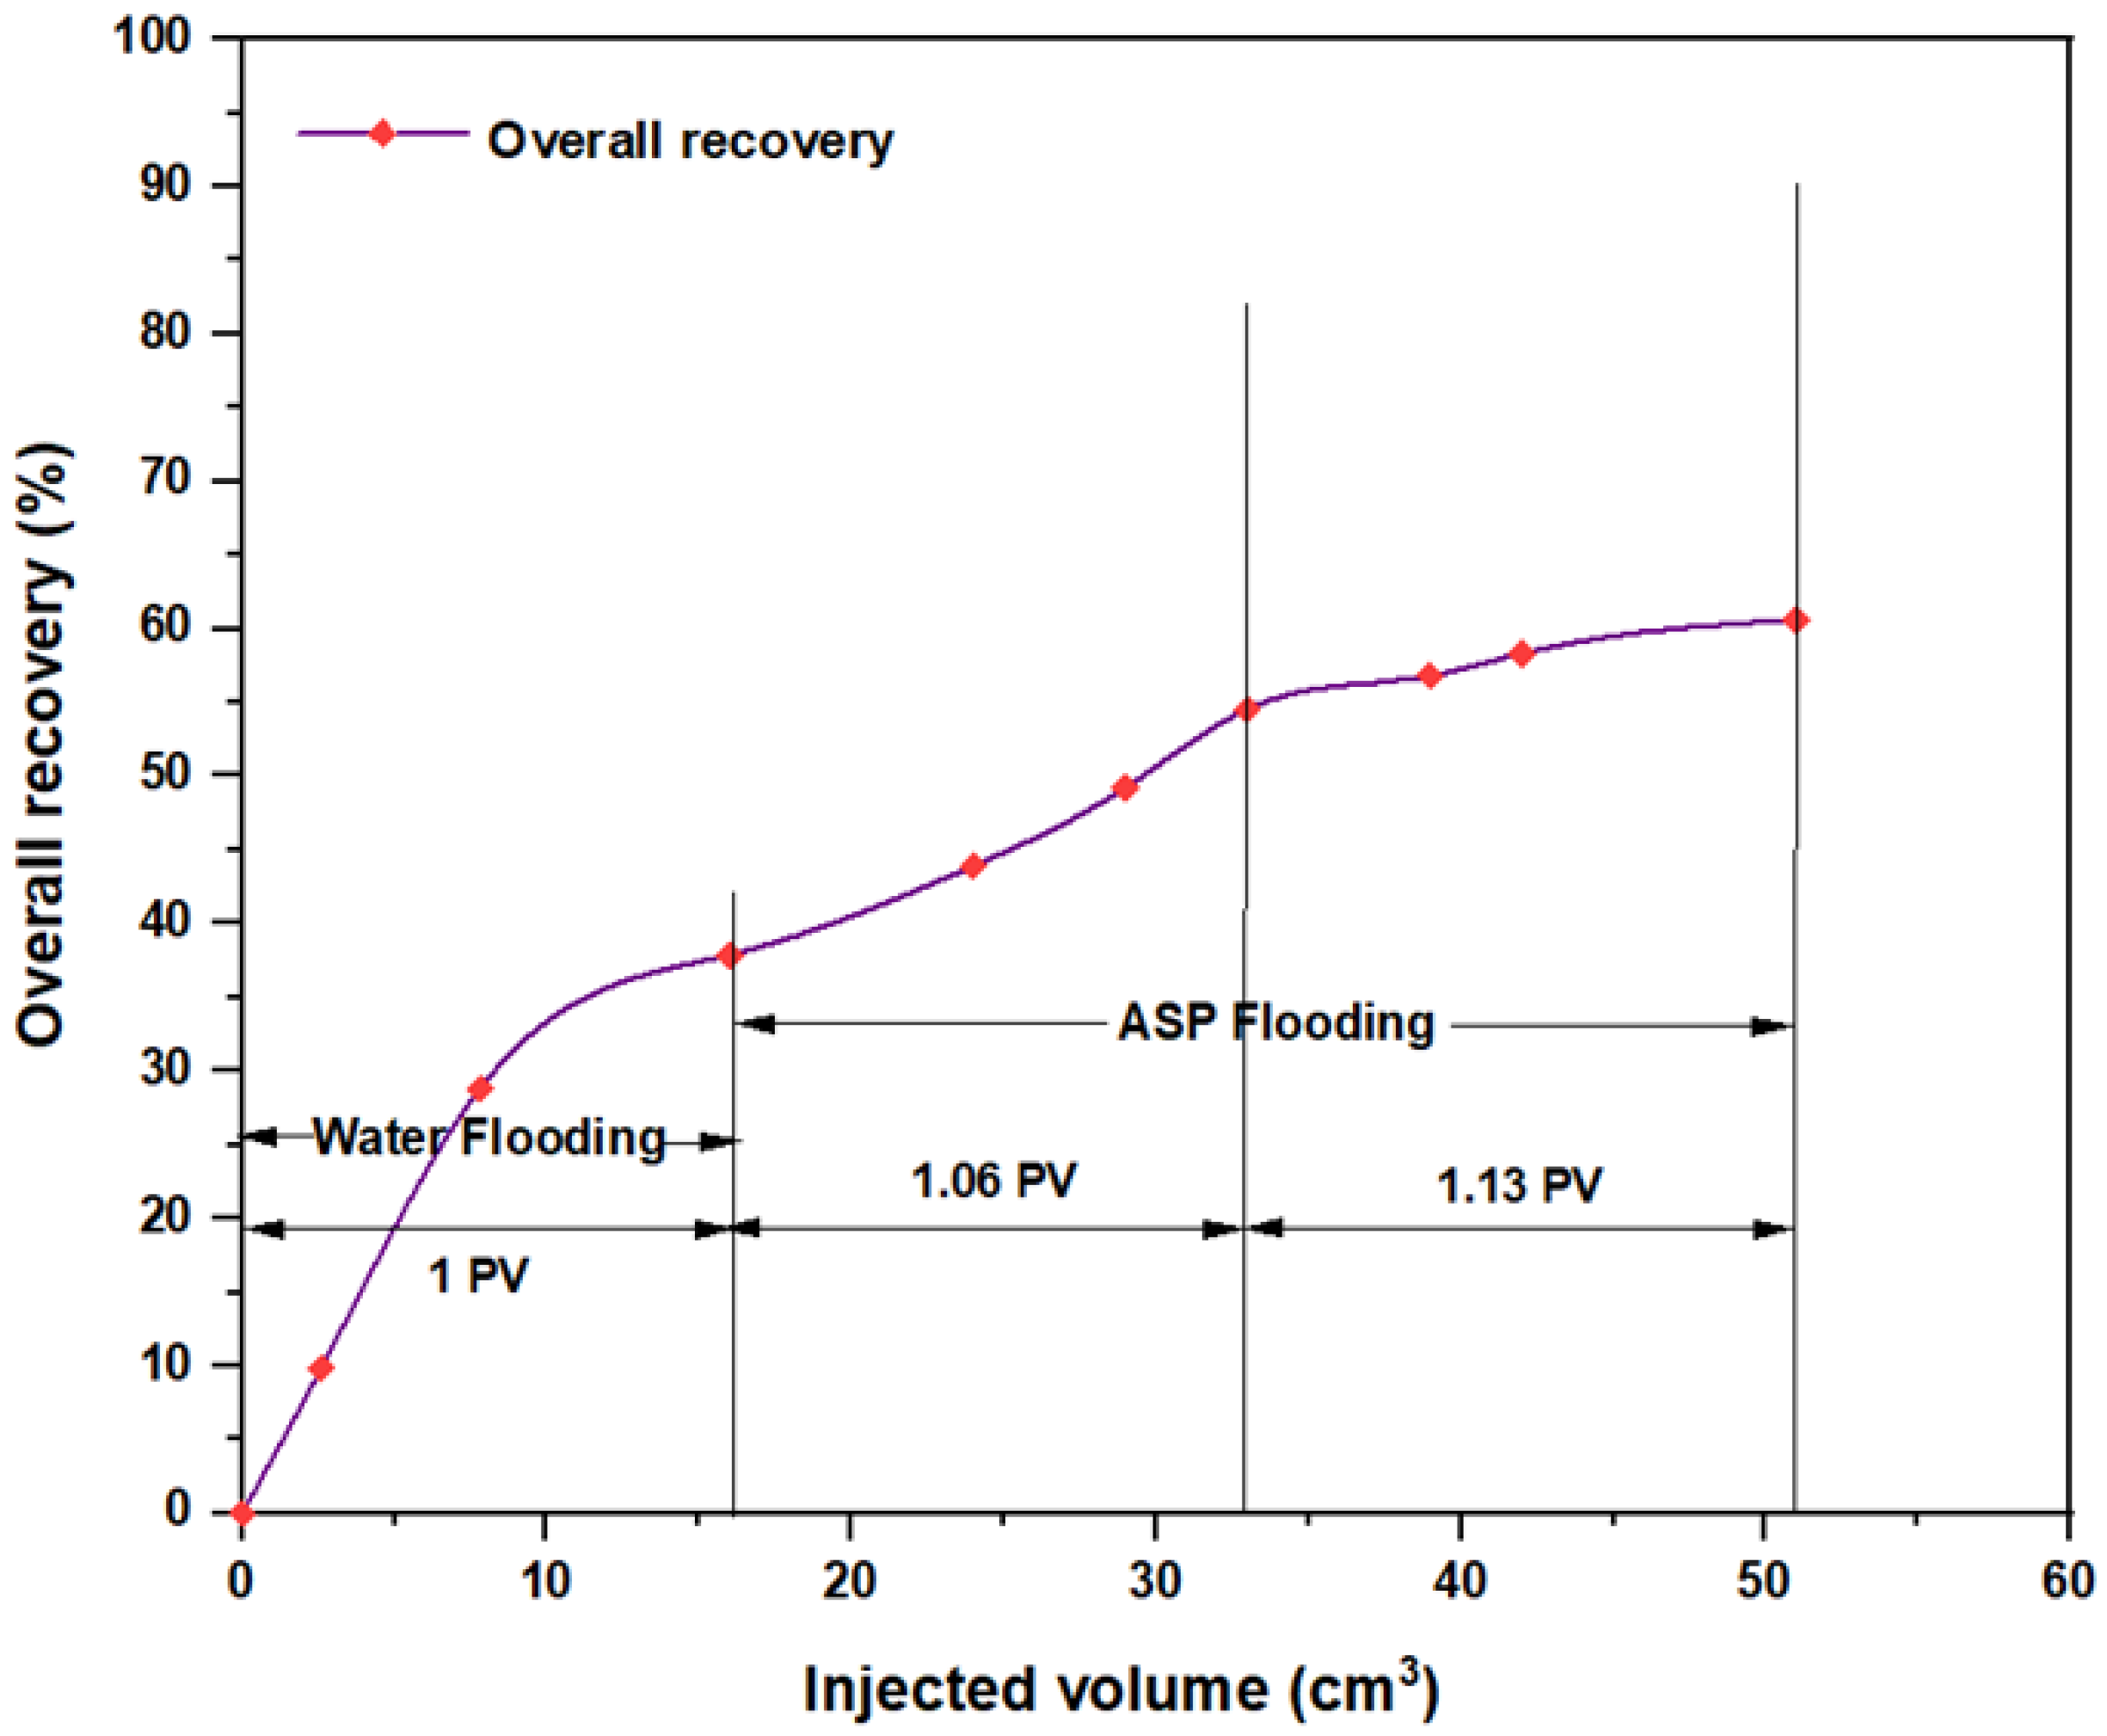
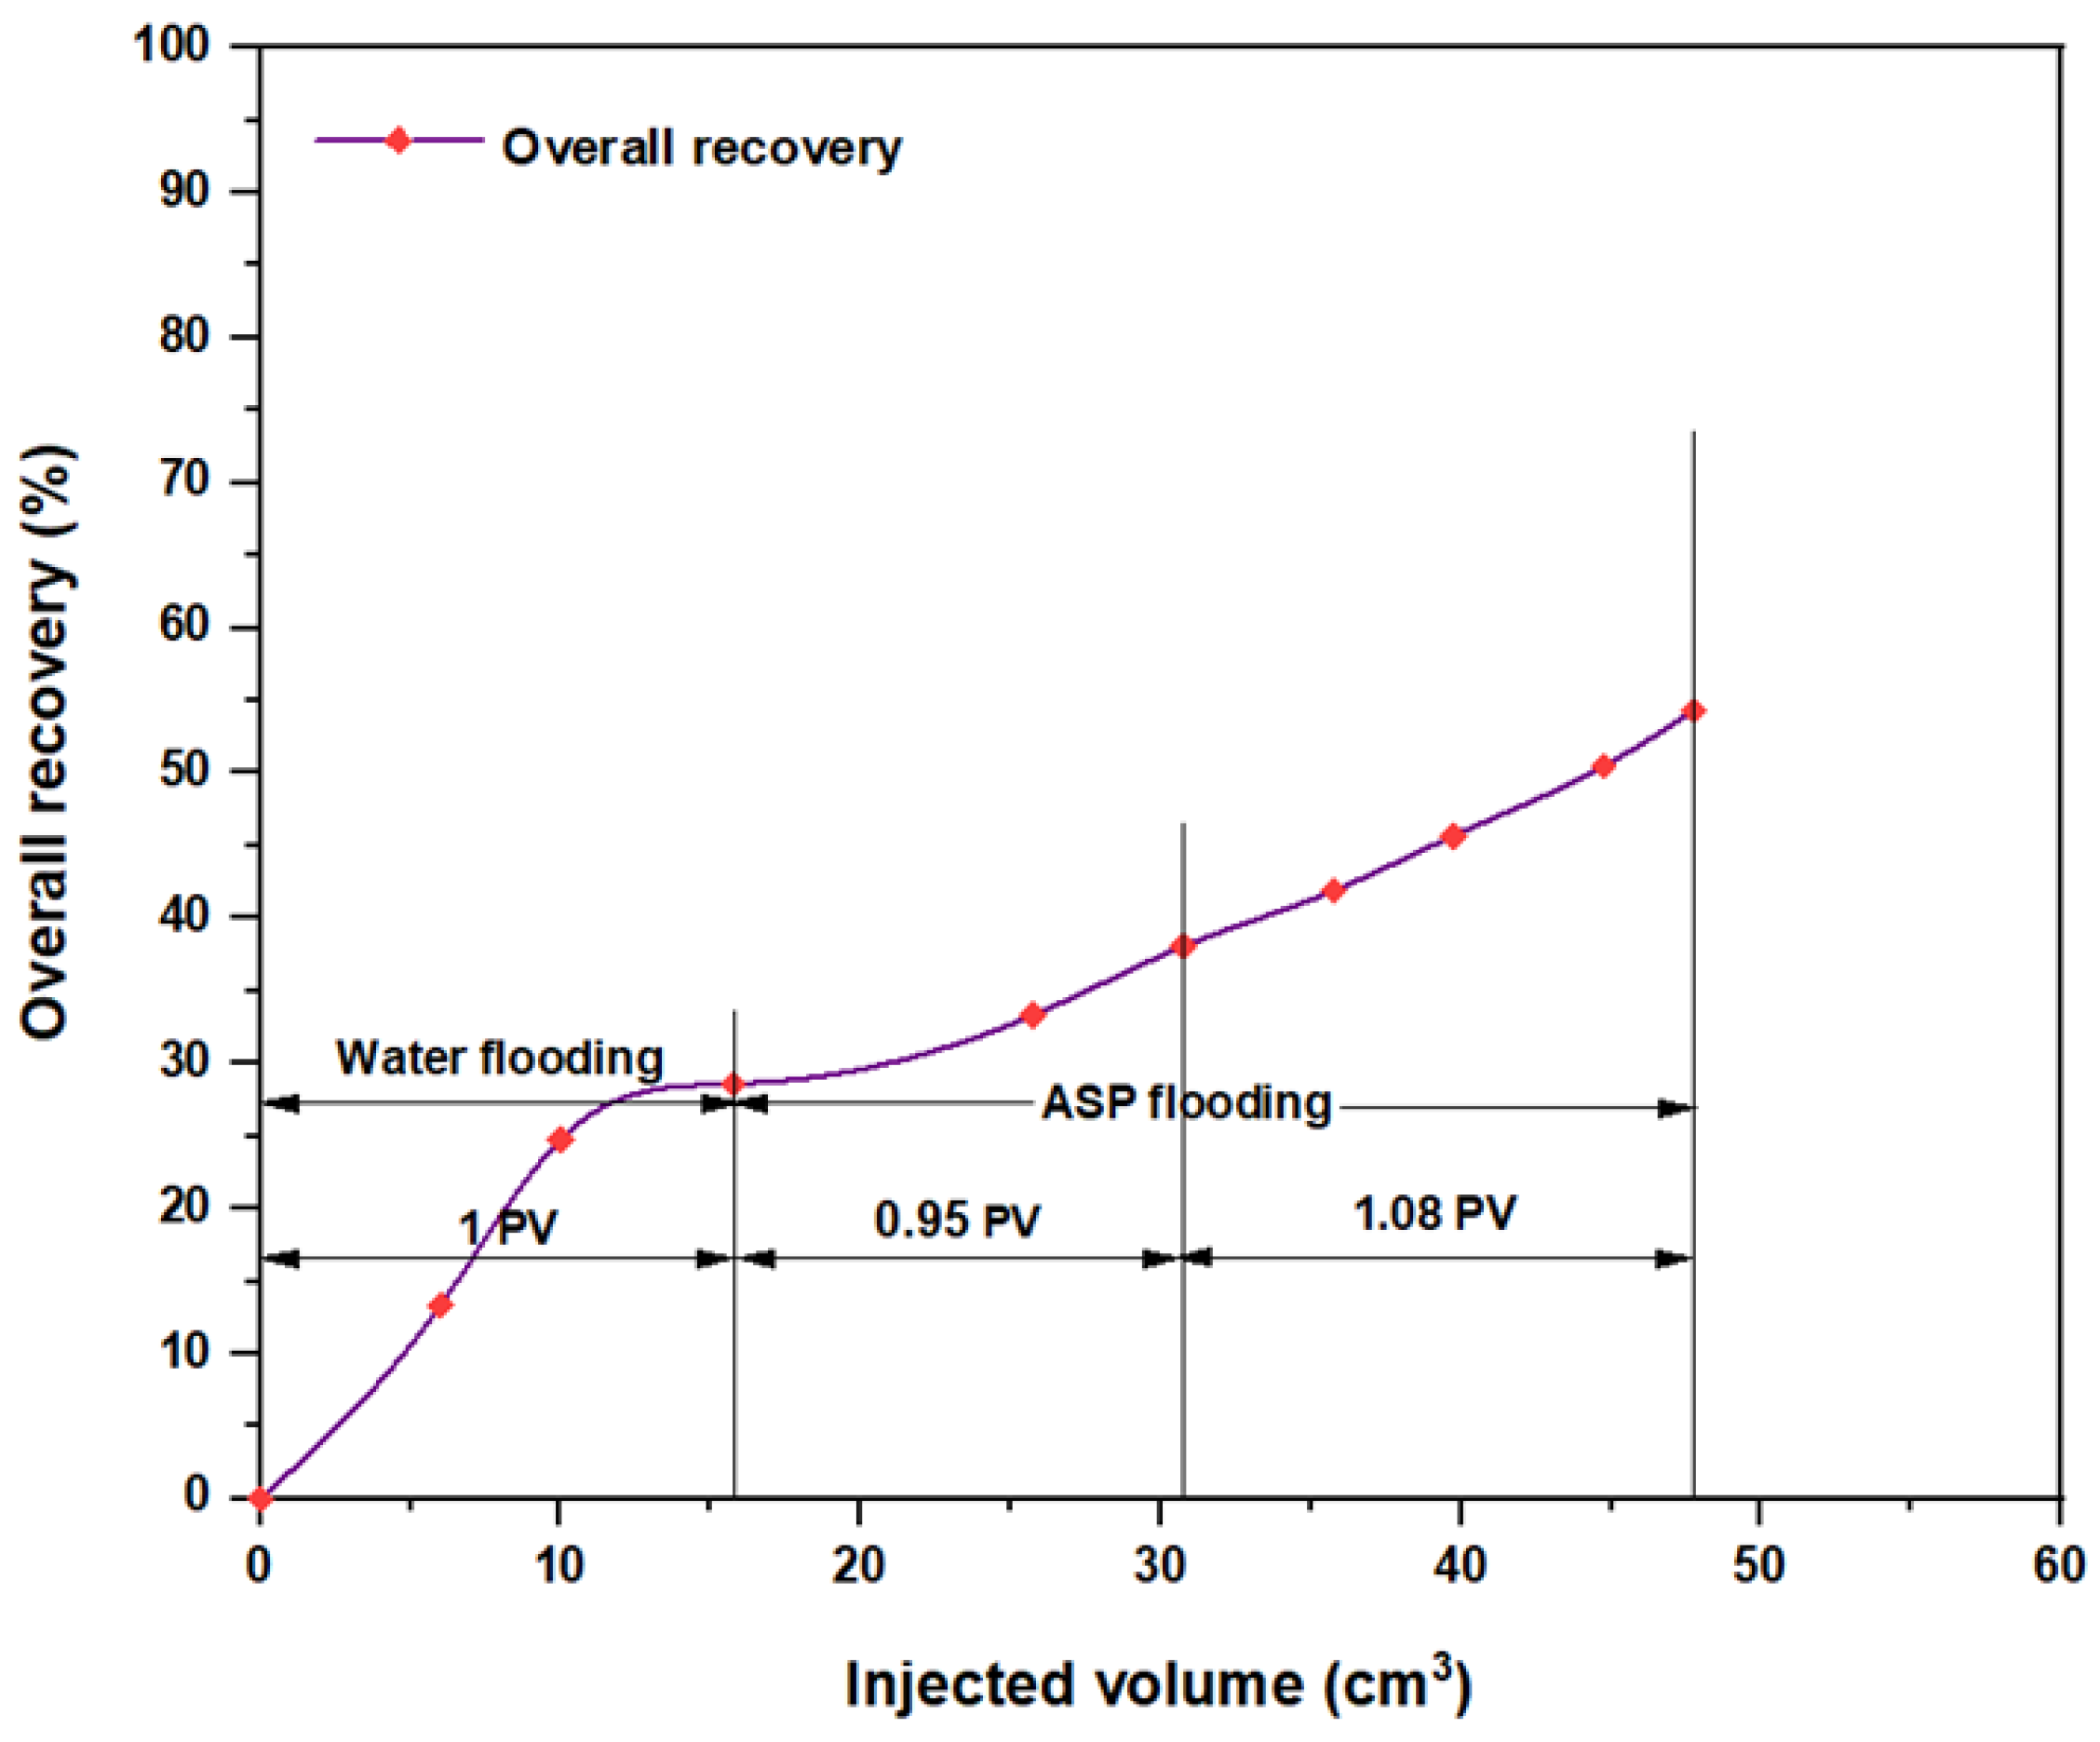
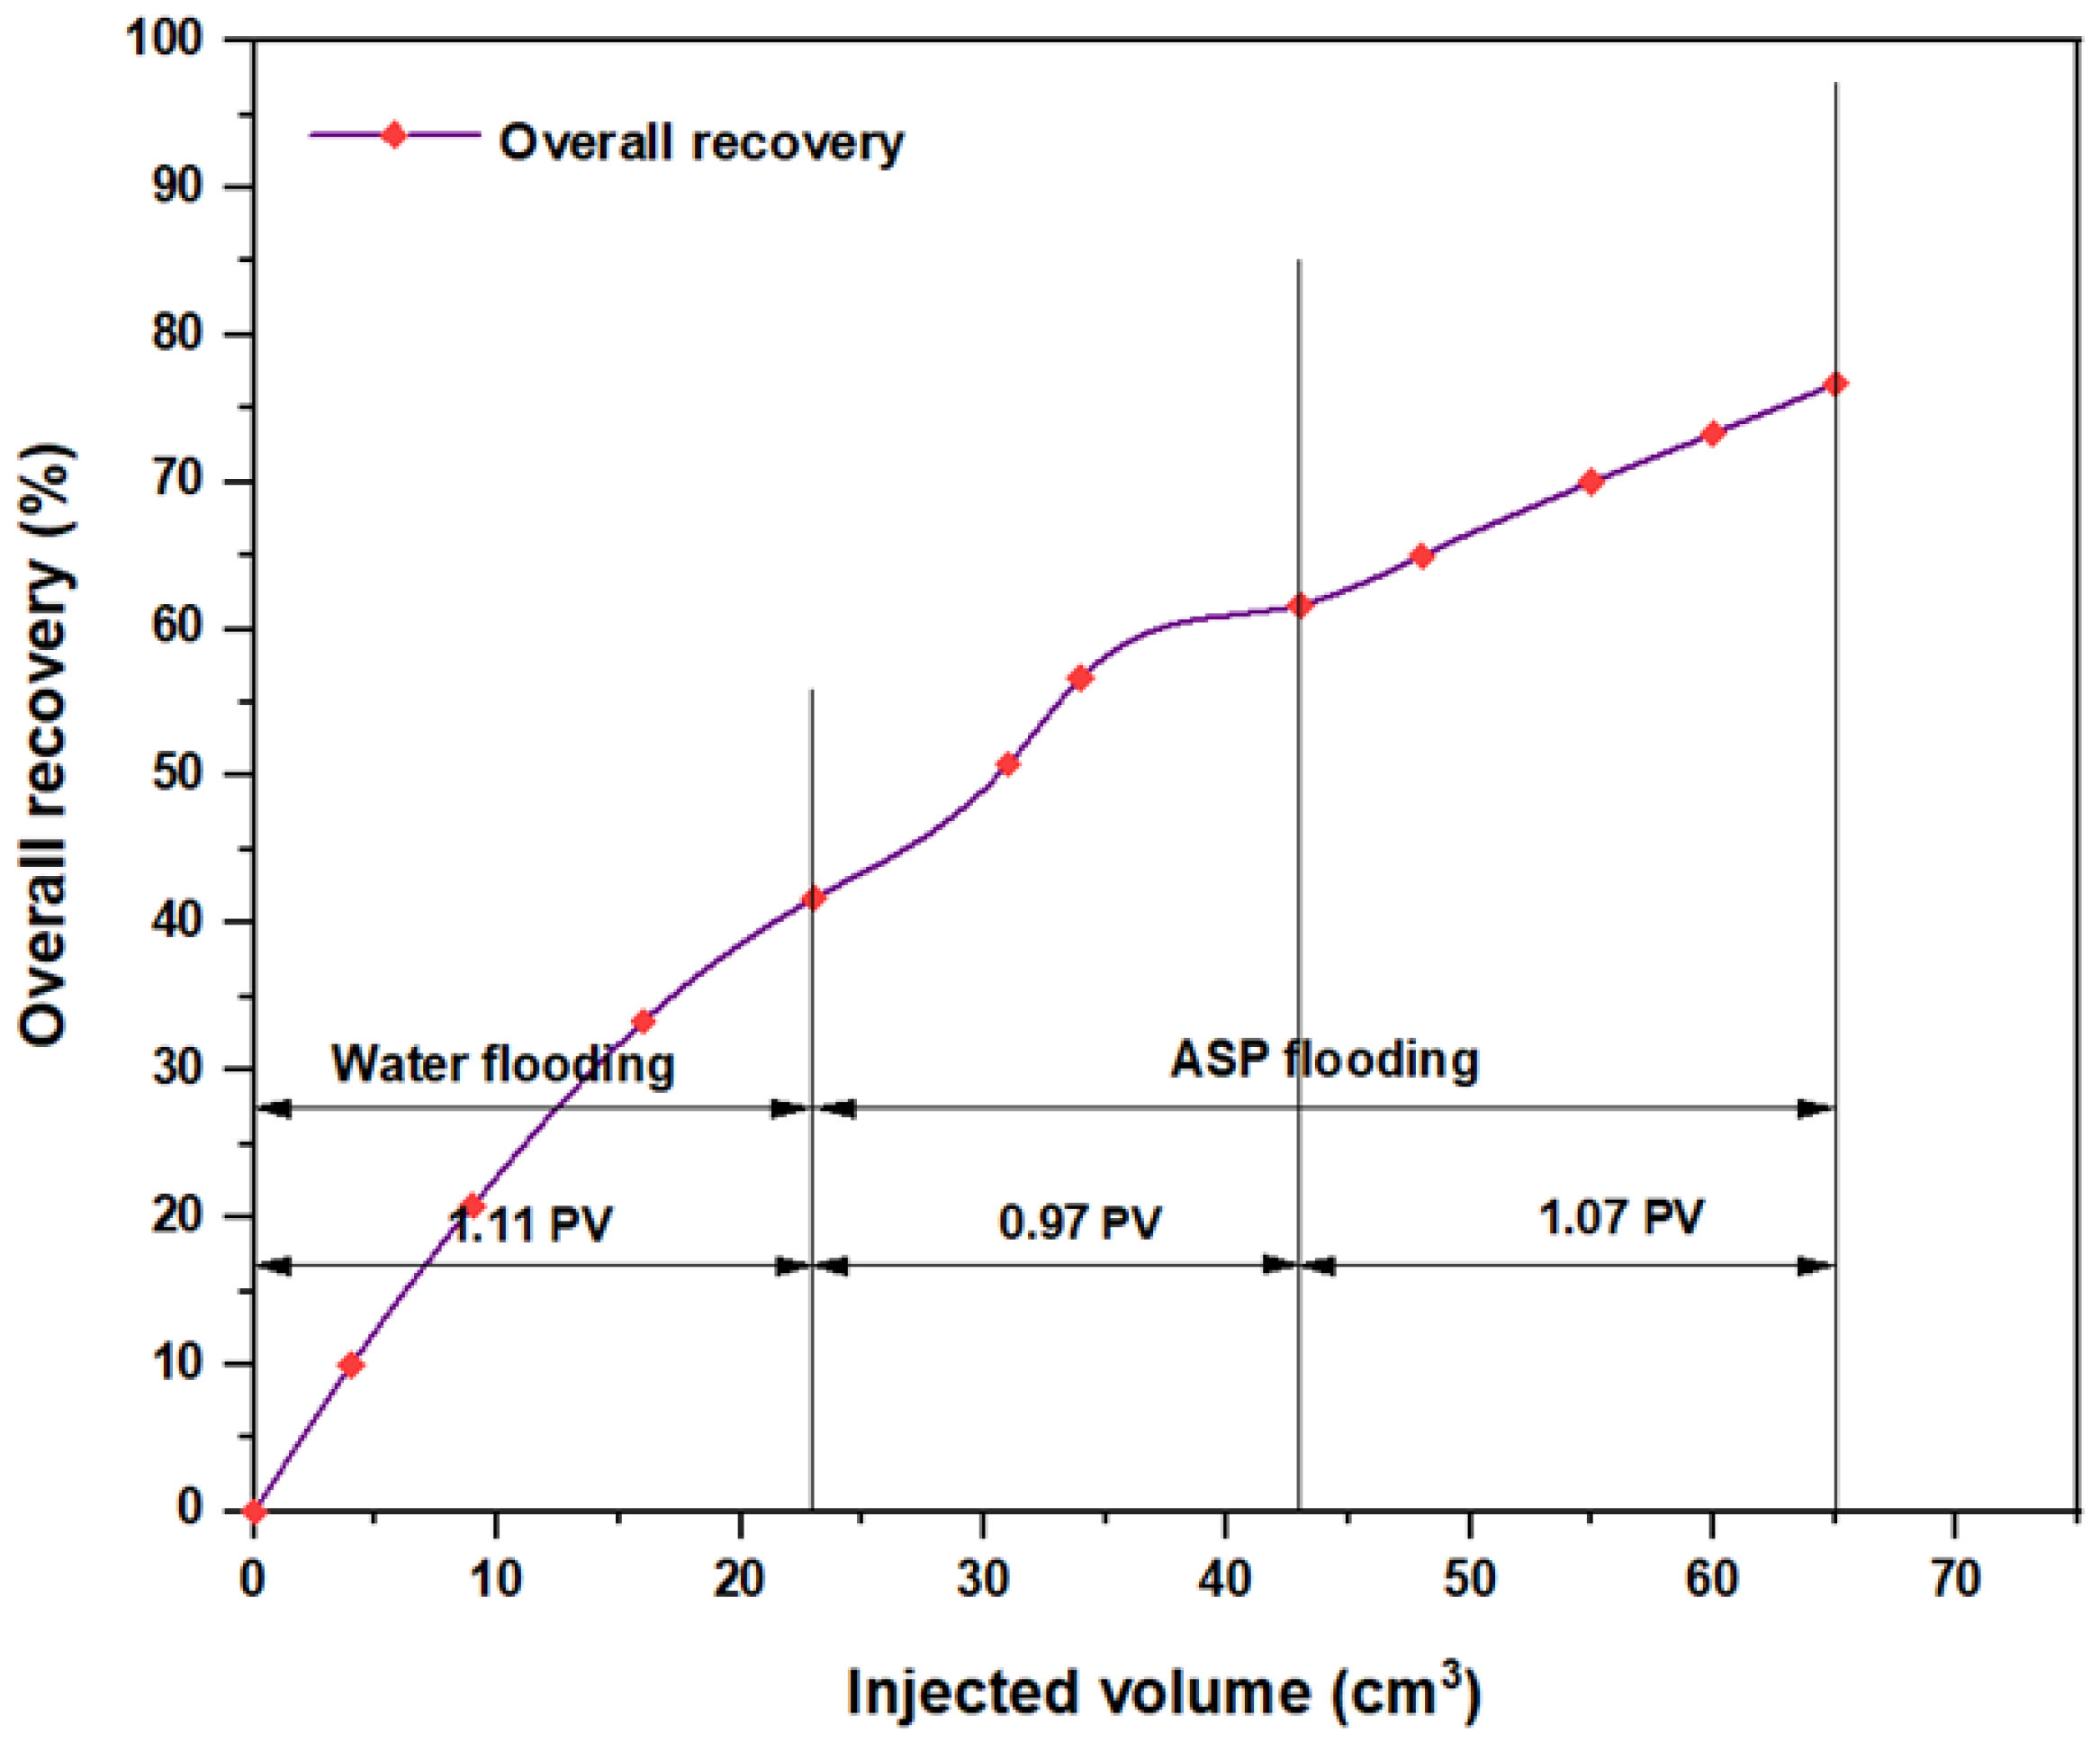
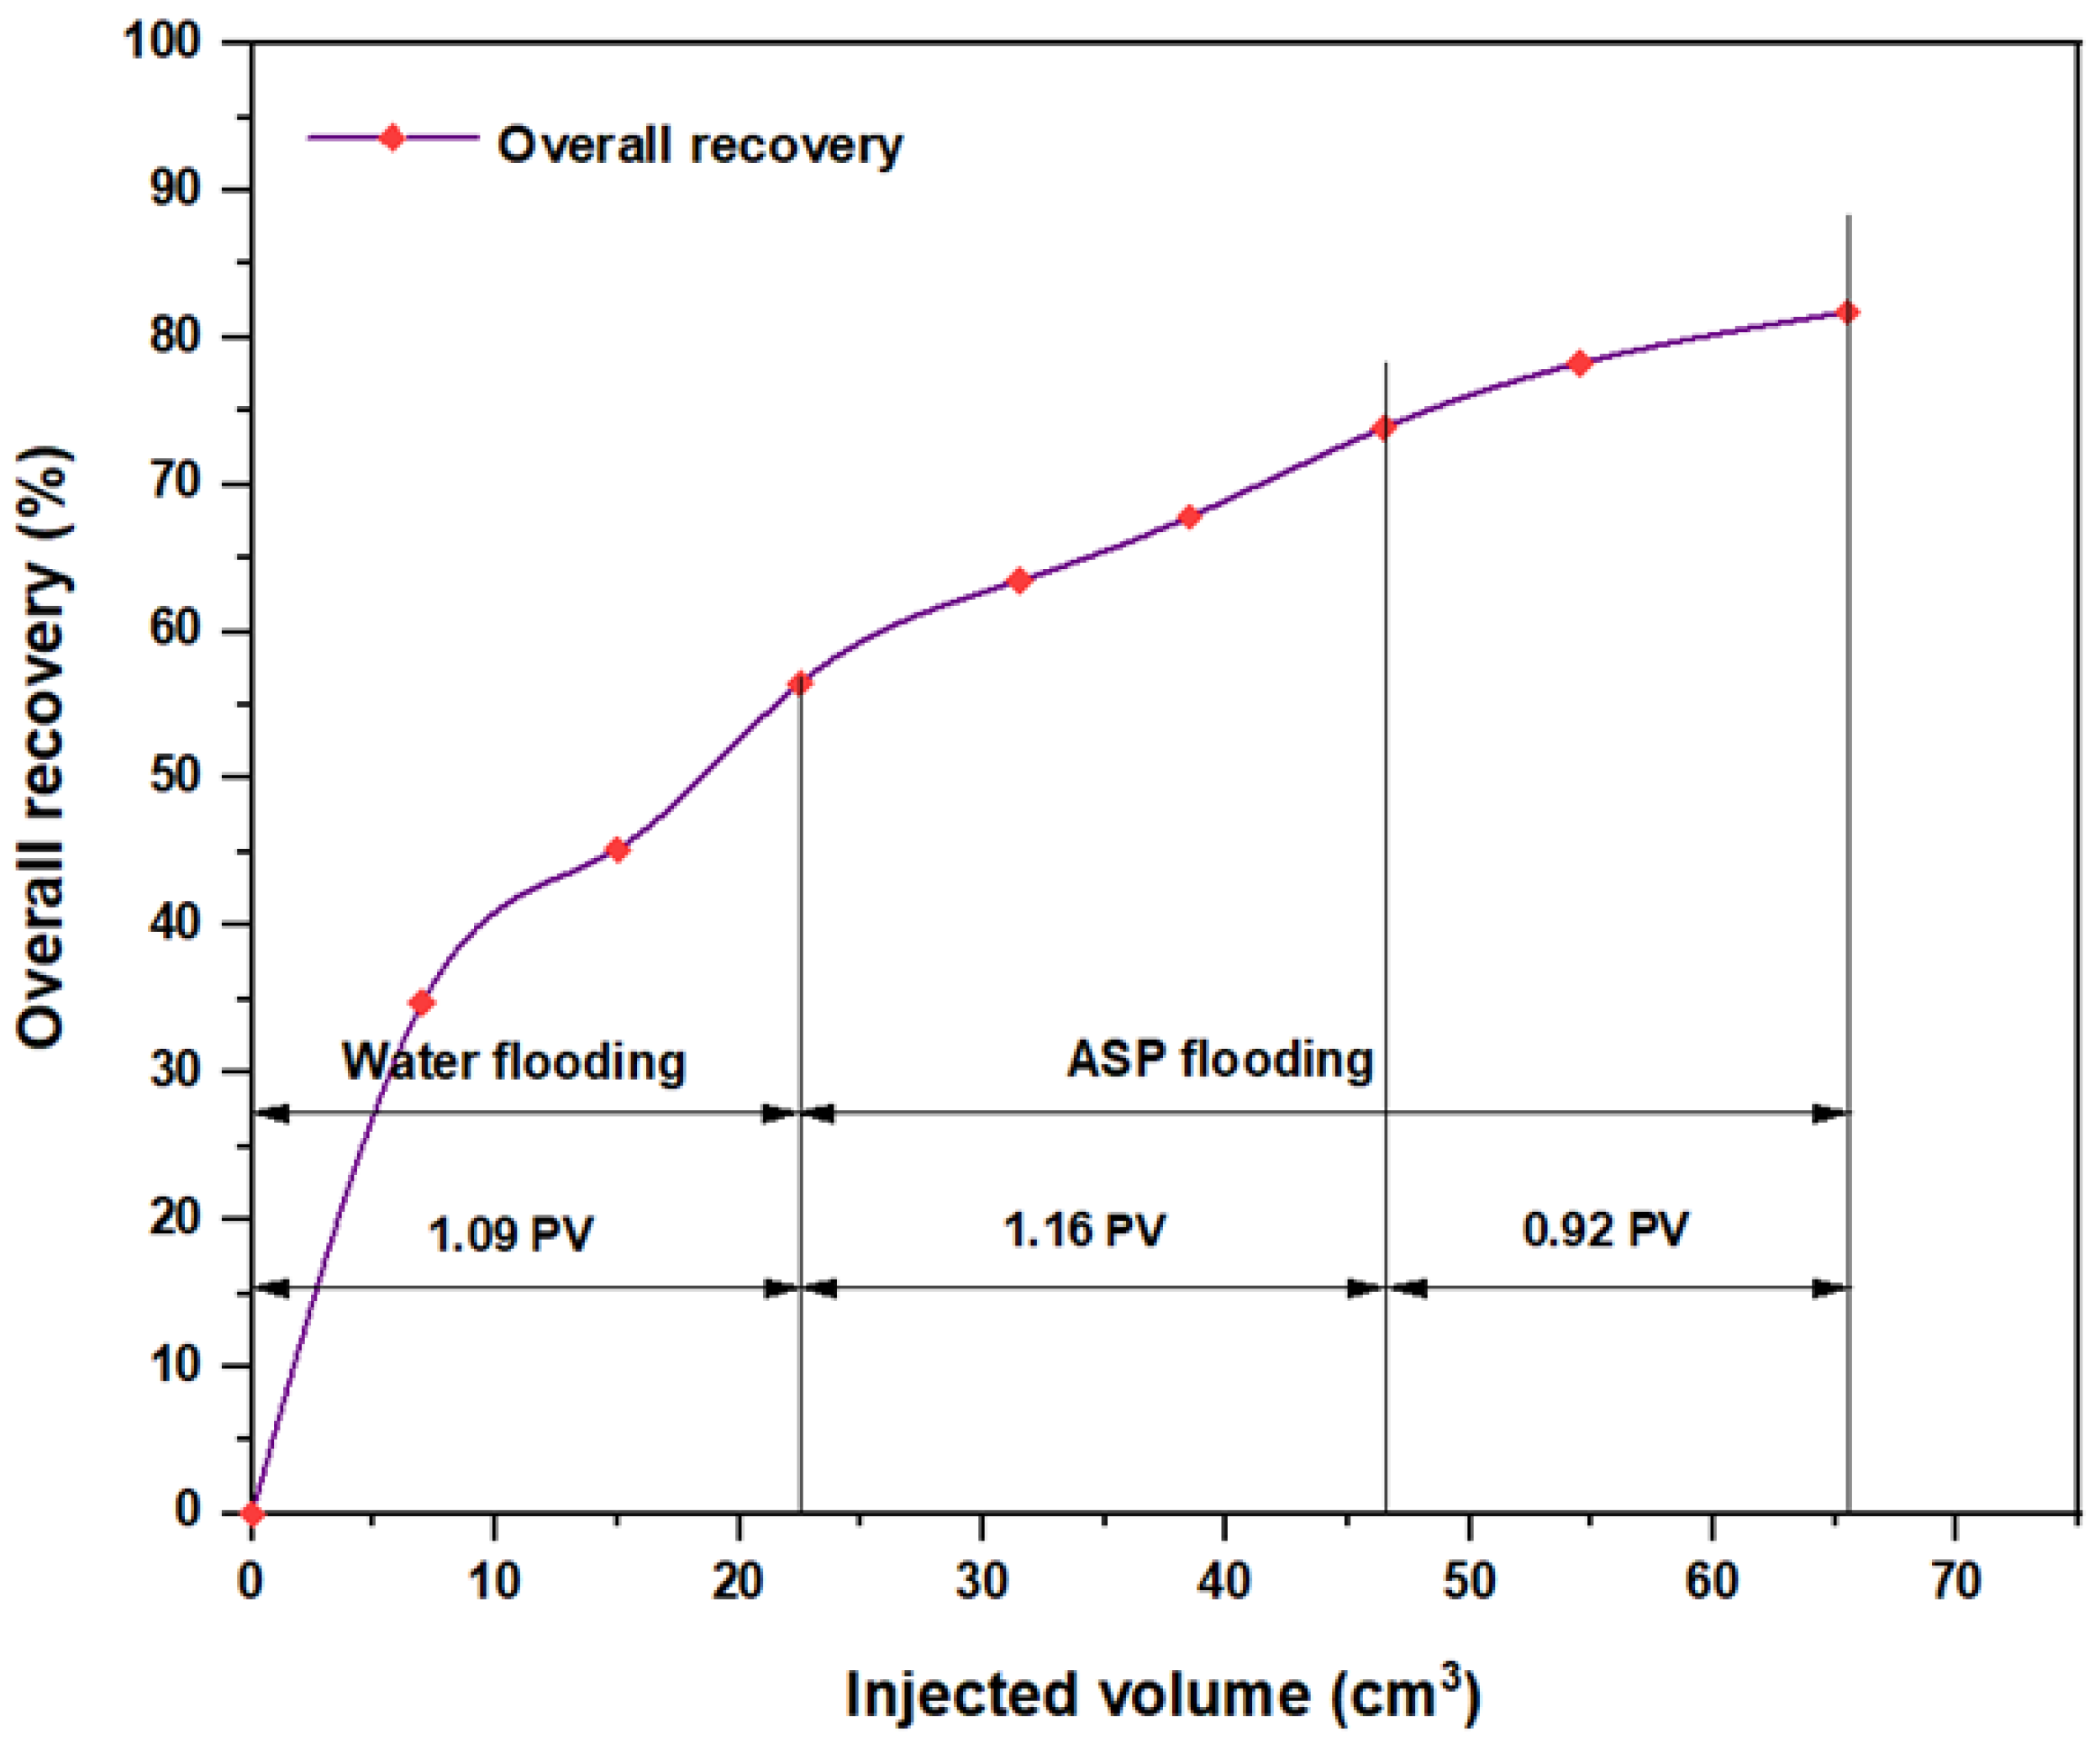
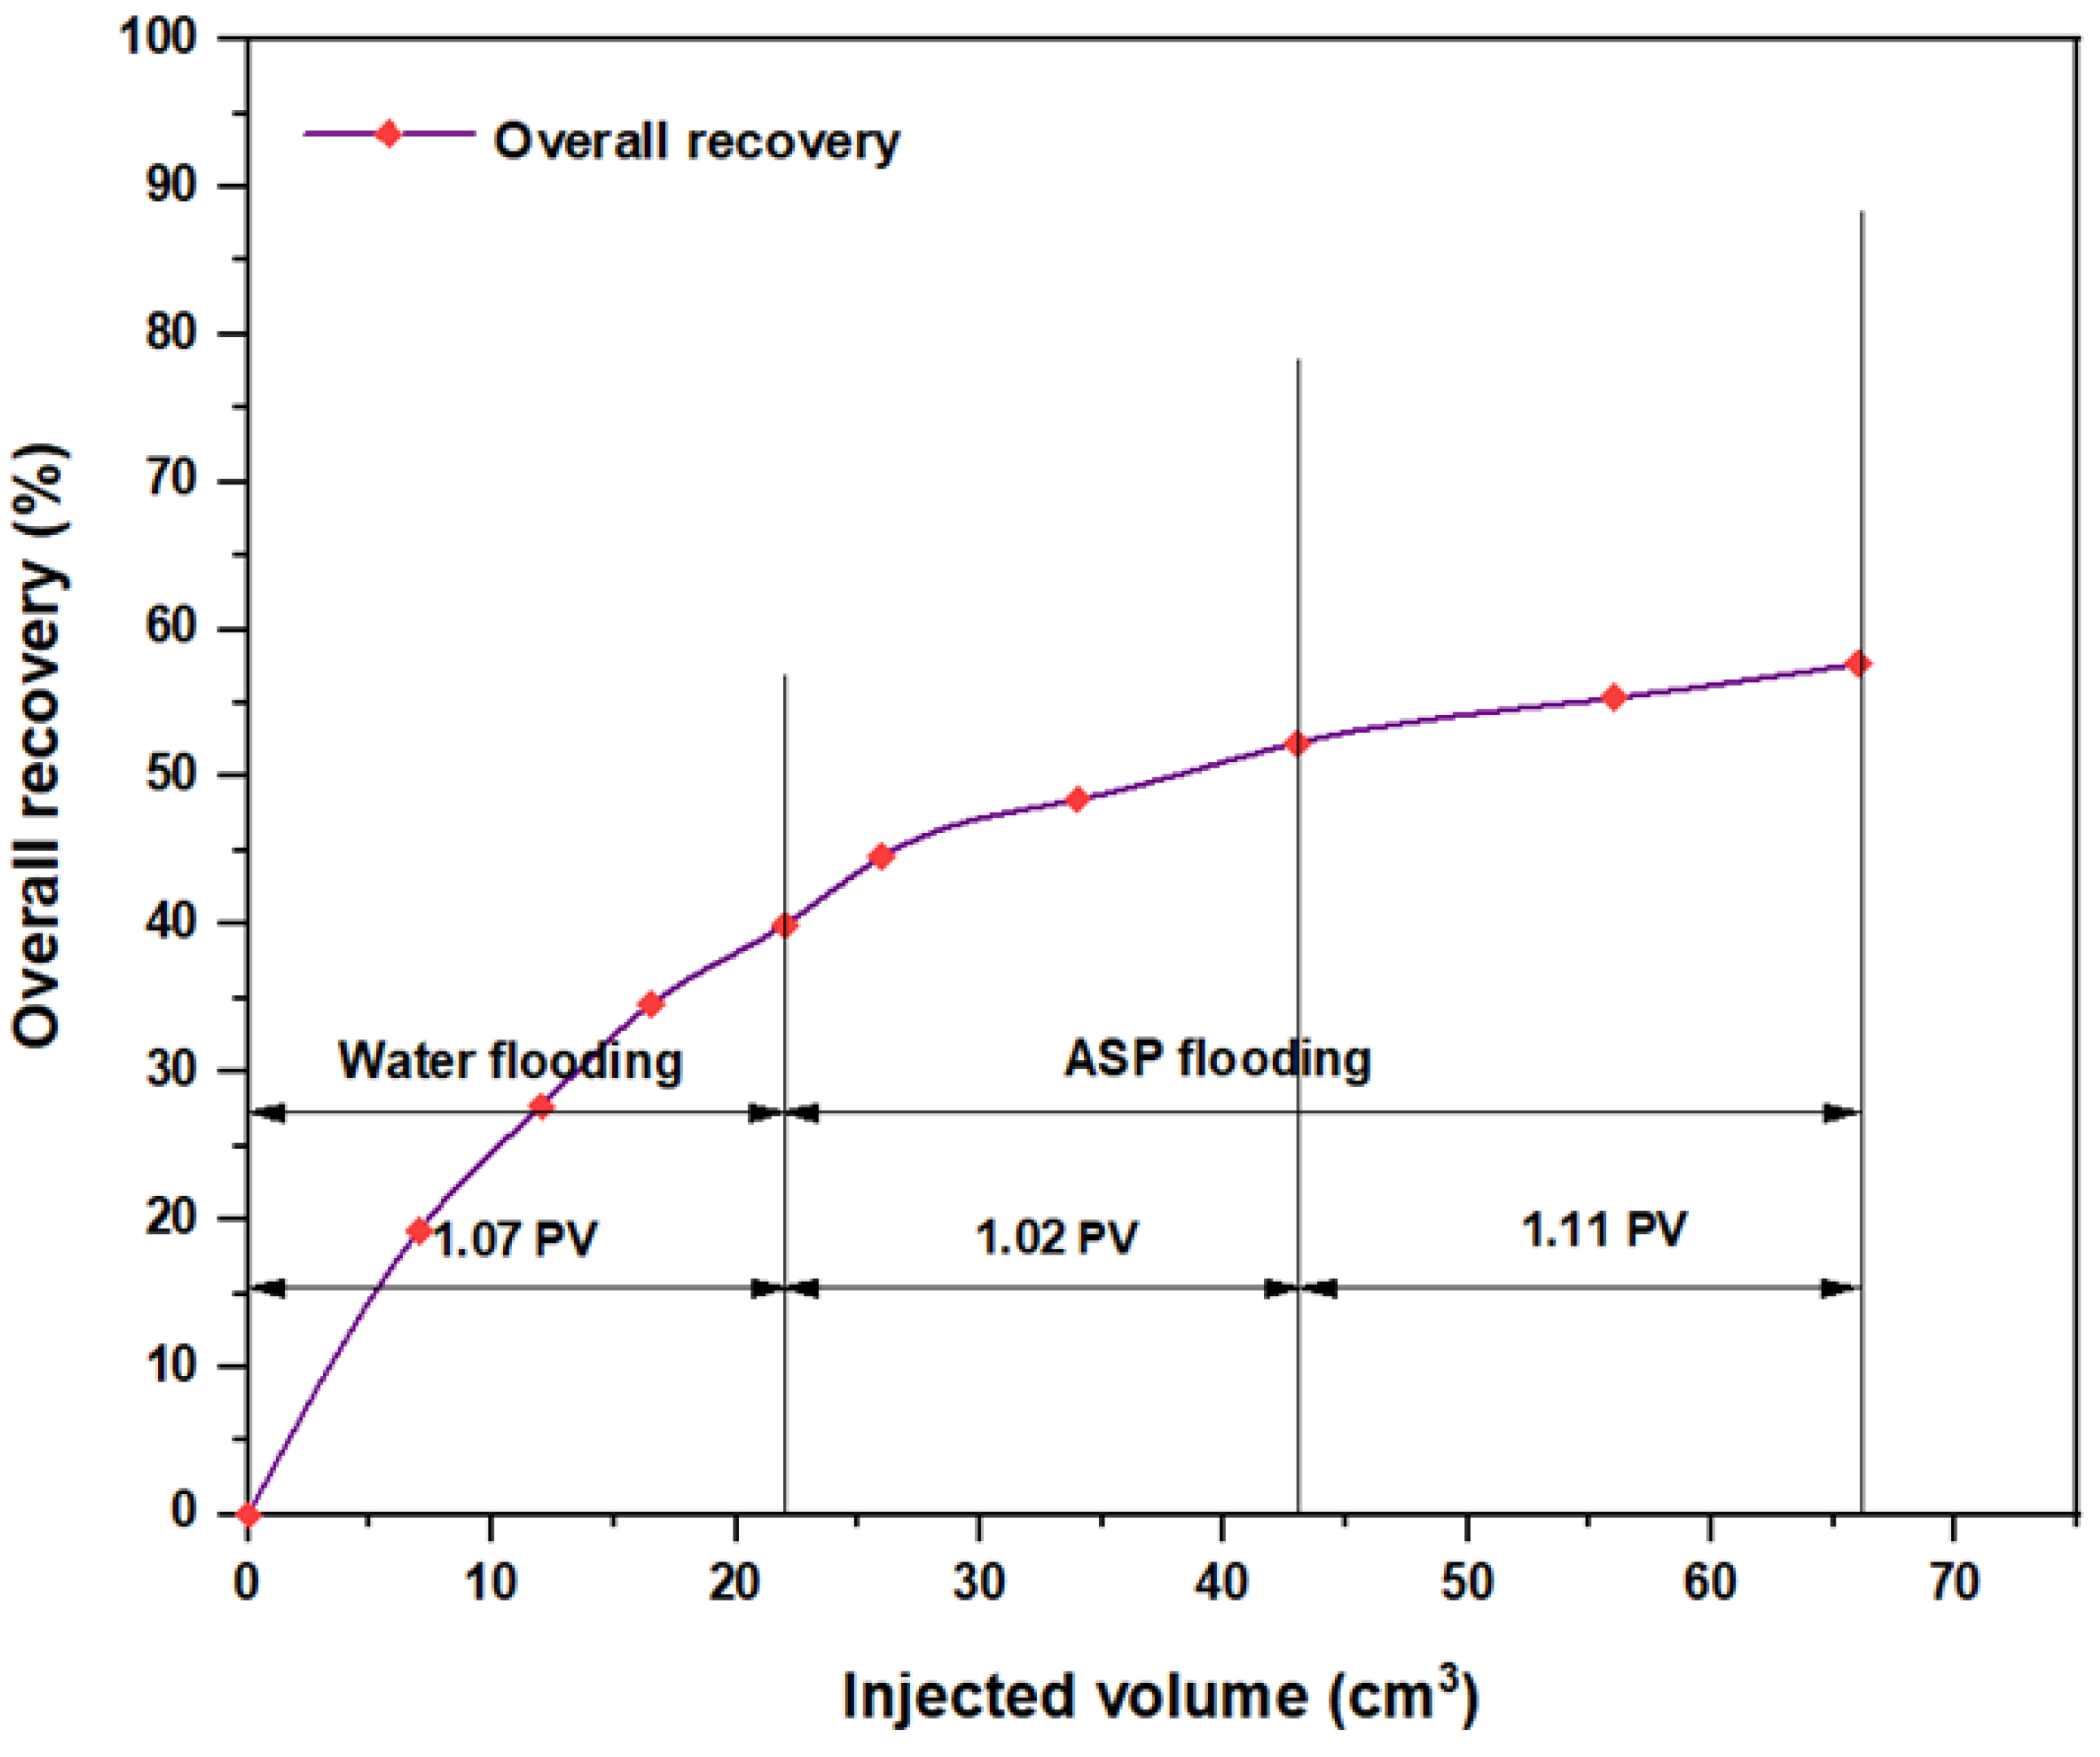
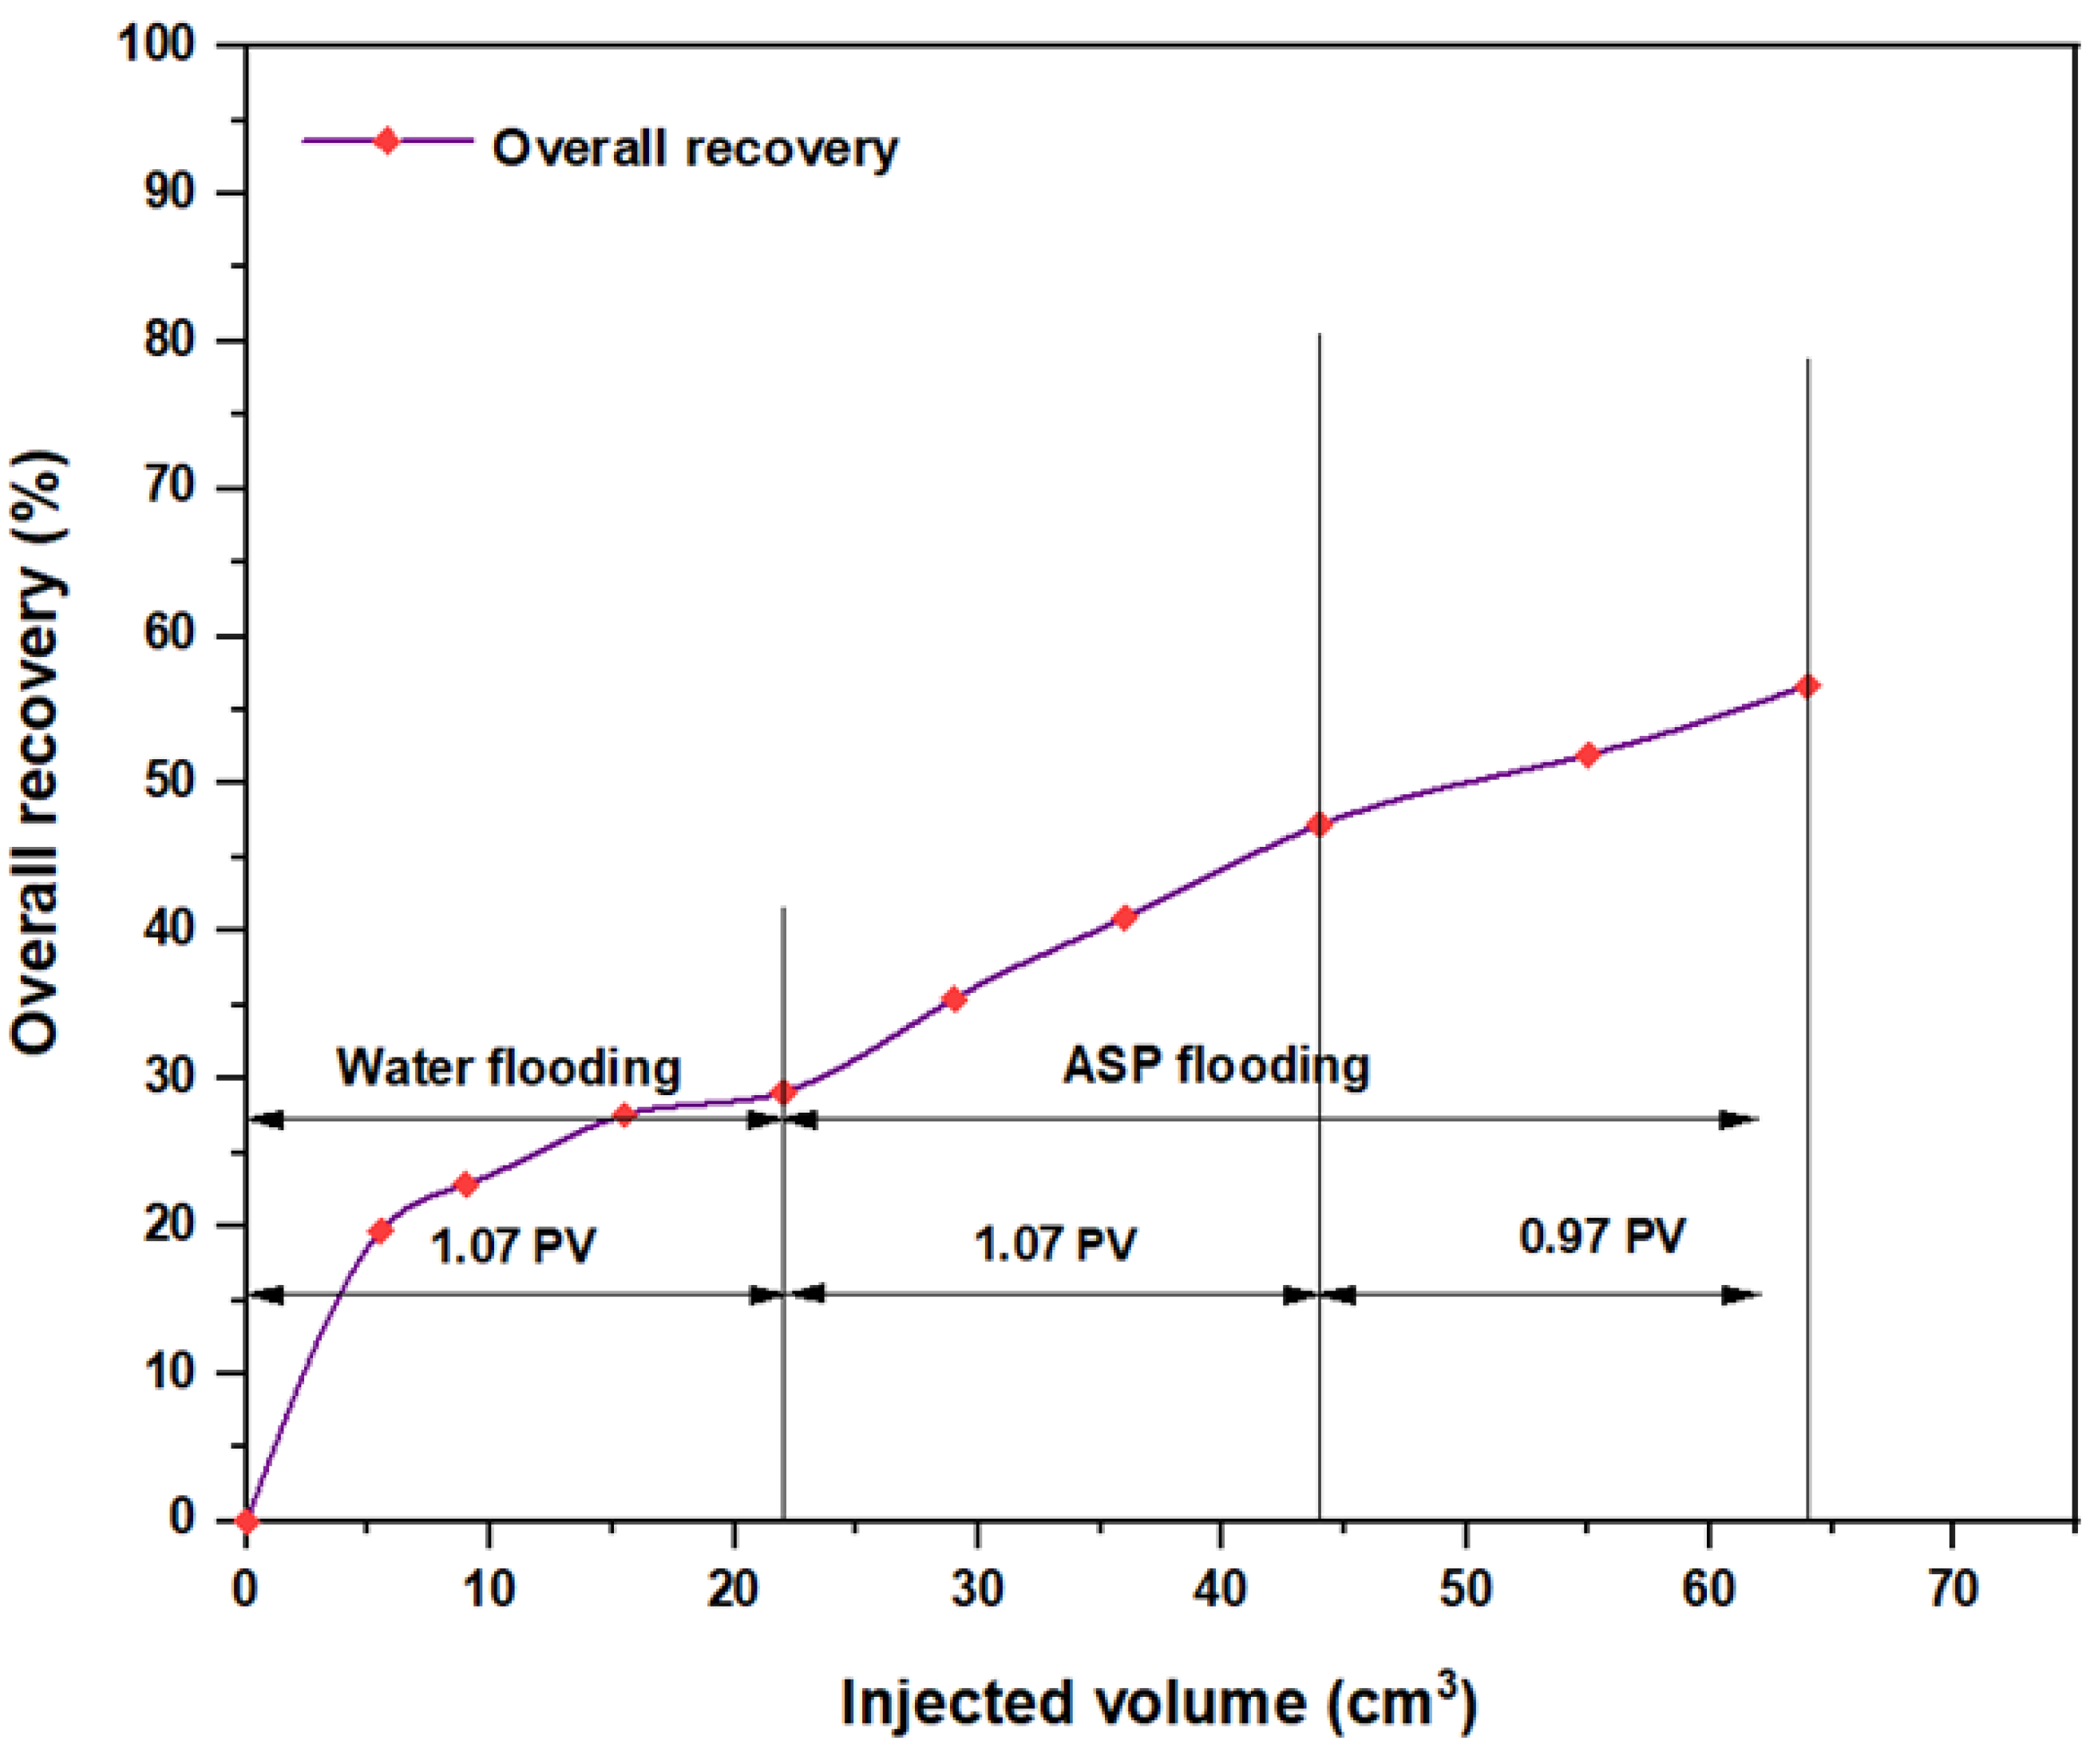
3.5. ASP Flooding Using Indonesian Surfactants
4. Materials and Methods
4.1. Materials
4.1.1. Buff Berea Core Samples
4.1.2. Crude Oil
4.1.3. Partially Hydrolyzed Polyacrylamide (HPAM)
4.1.4. Acetic Acid (CH3COOH)
4.1.5. Sodium Hydroxide (NaOH) and Sodium Carbonate (Na2CO3)
4.1.6. Sodium Dodecyl Sulphate (SDS) and Sodium Dodecyl Benzene Sulfonate (SDBS)
4.1.7. Surfactants Obtained from PT SPR Langgak Company in Indonesia
4.1.8. Purple Yam Tubers
4.1.9. Native Cassava Starch
4.2. Methods
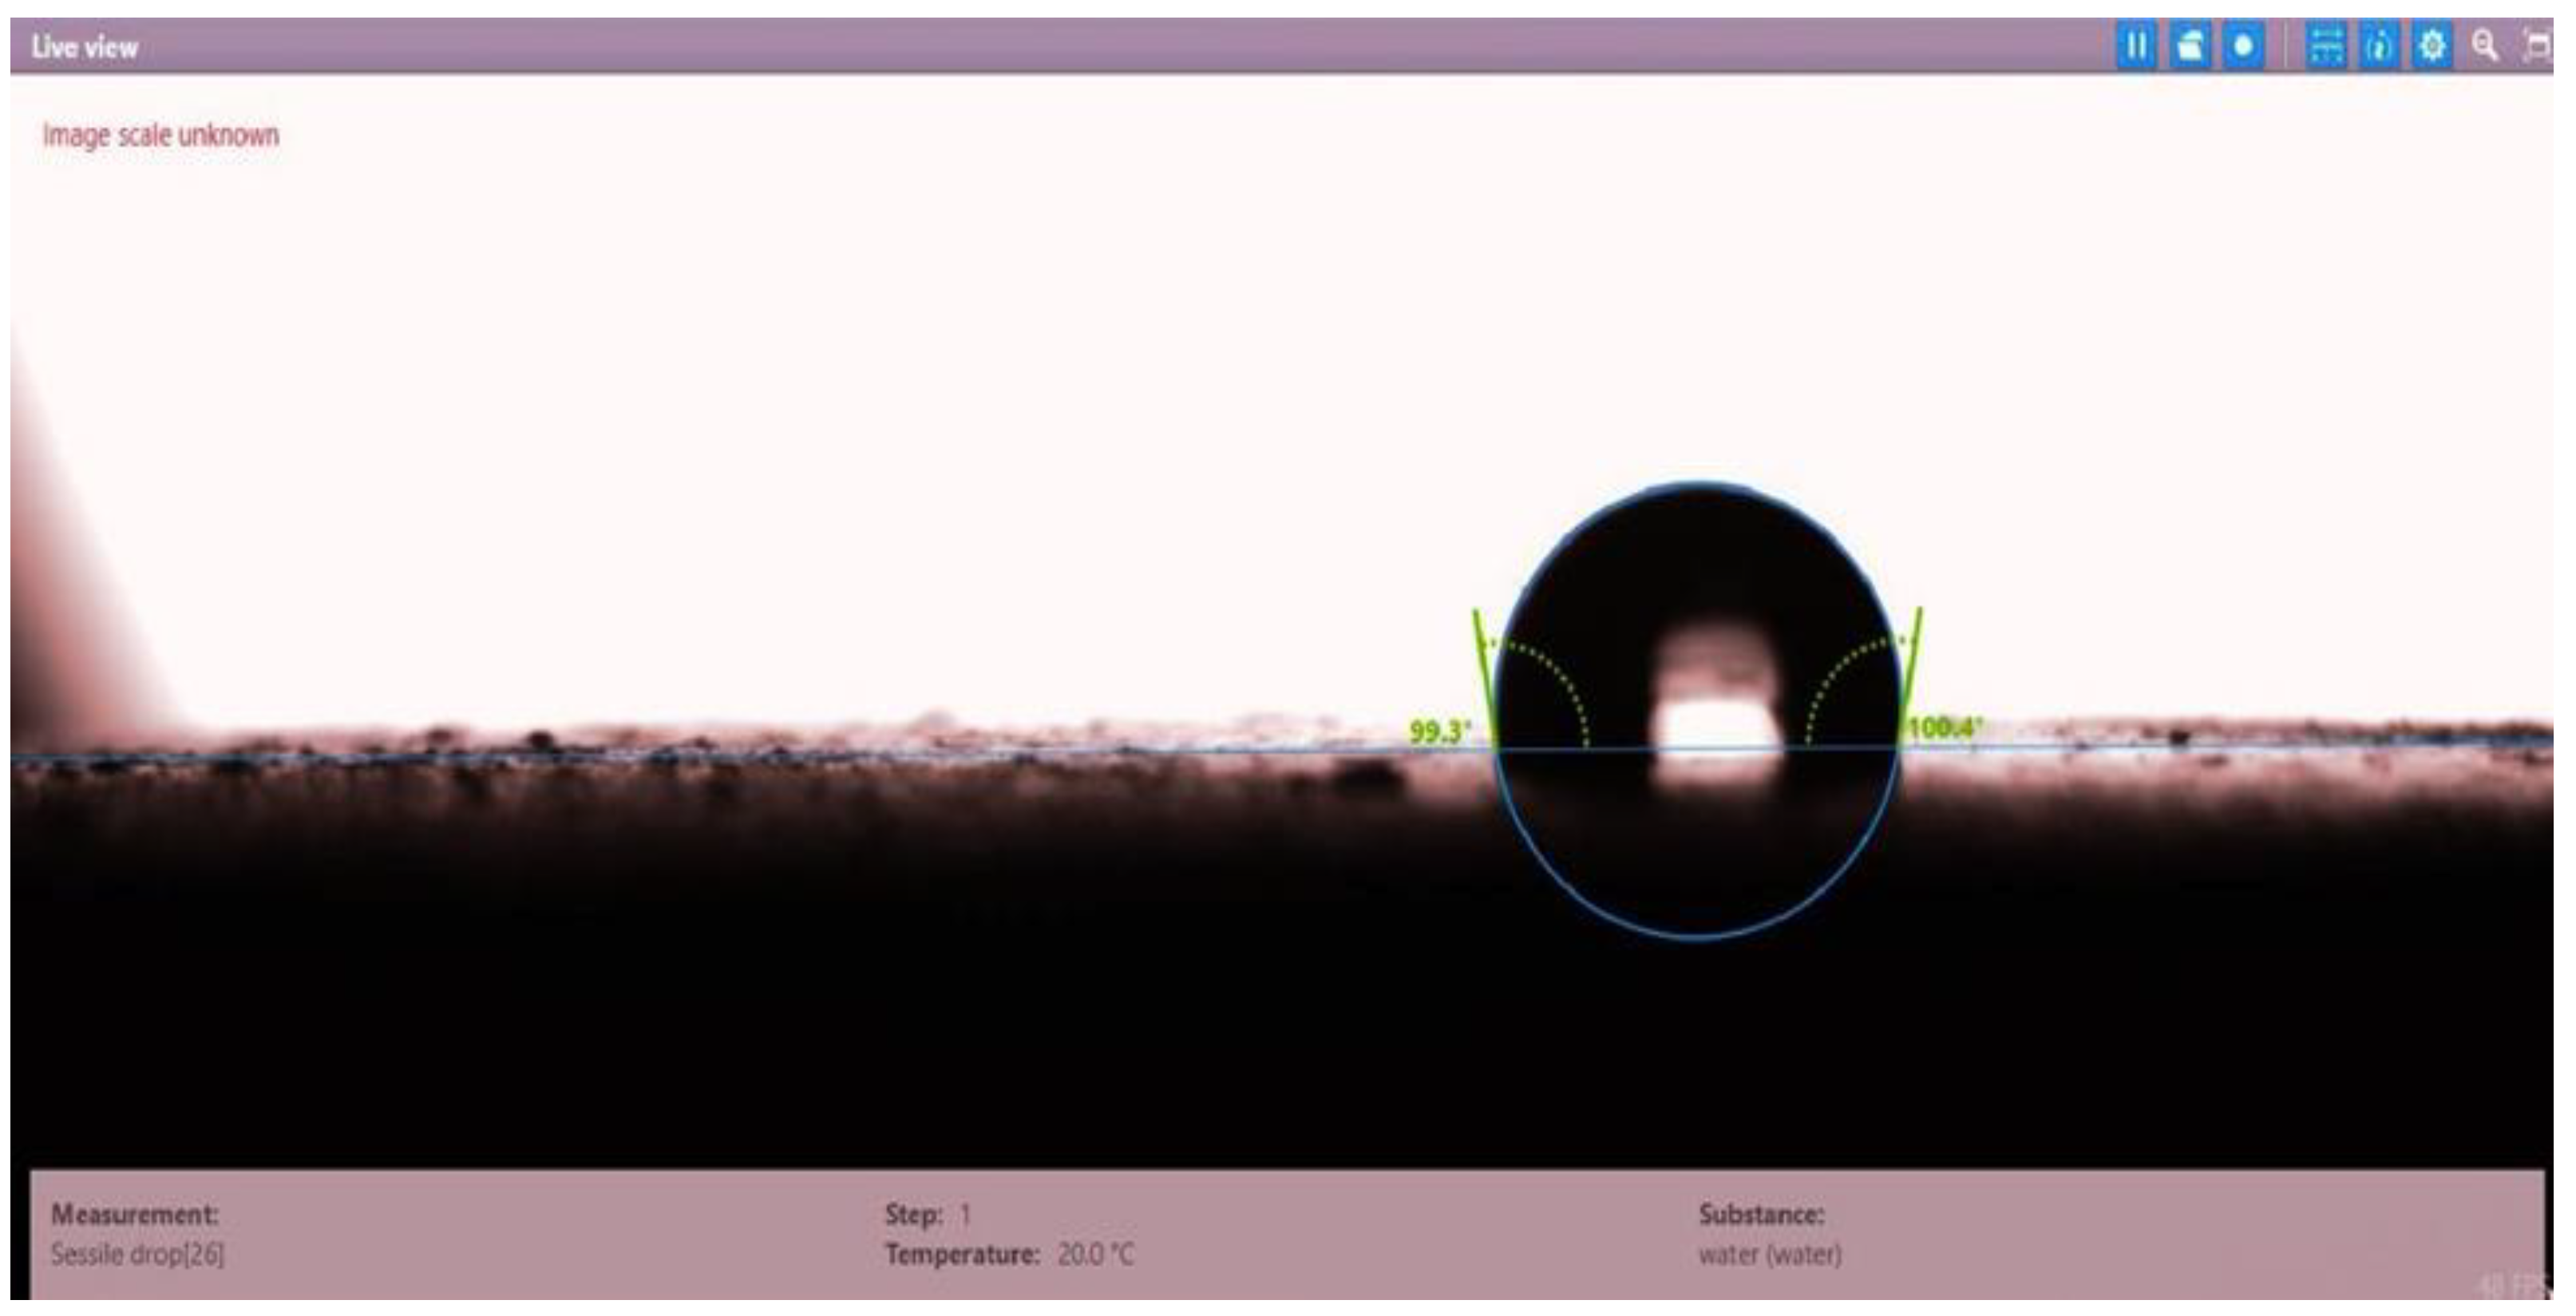
4.2.1. Determining the Wettability of Core Samples
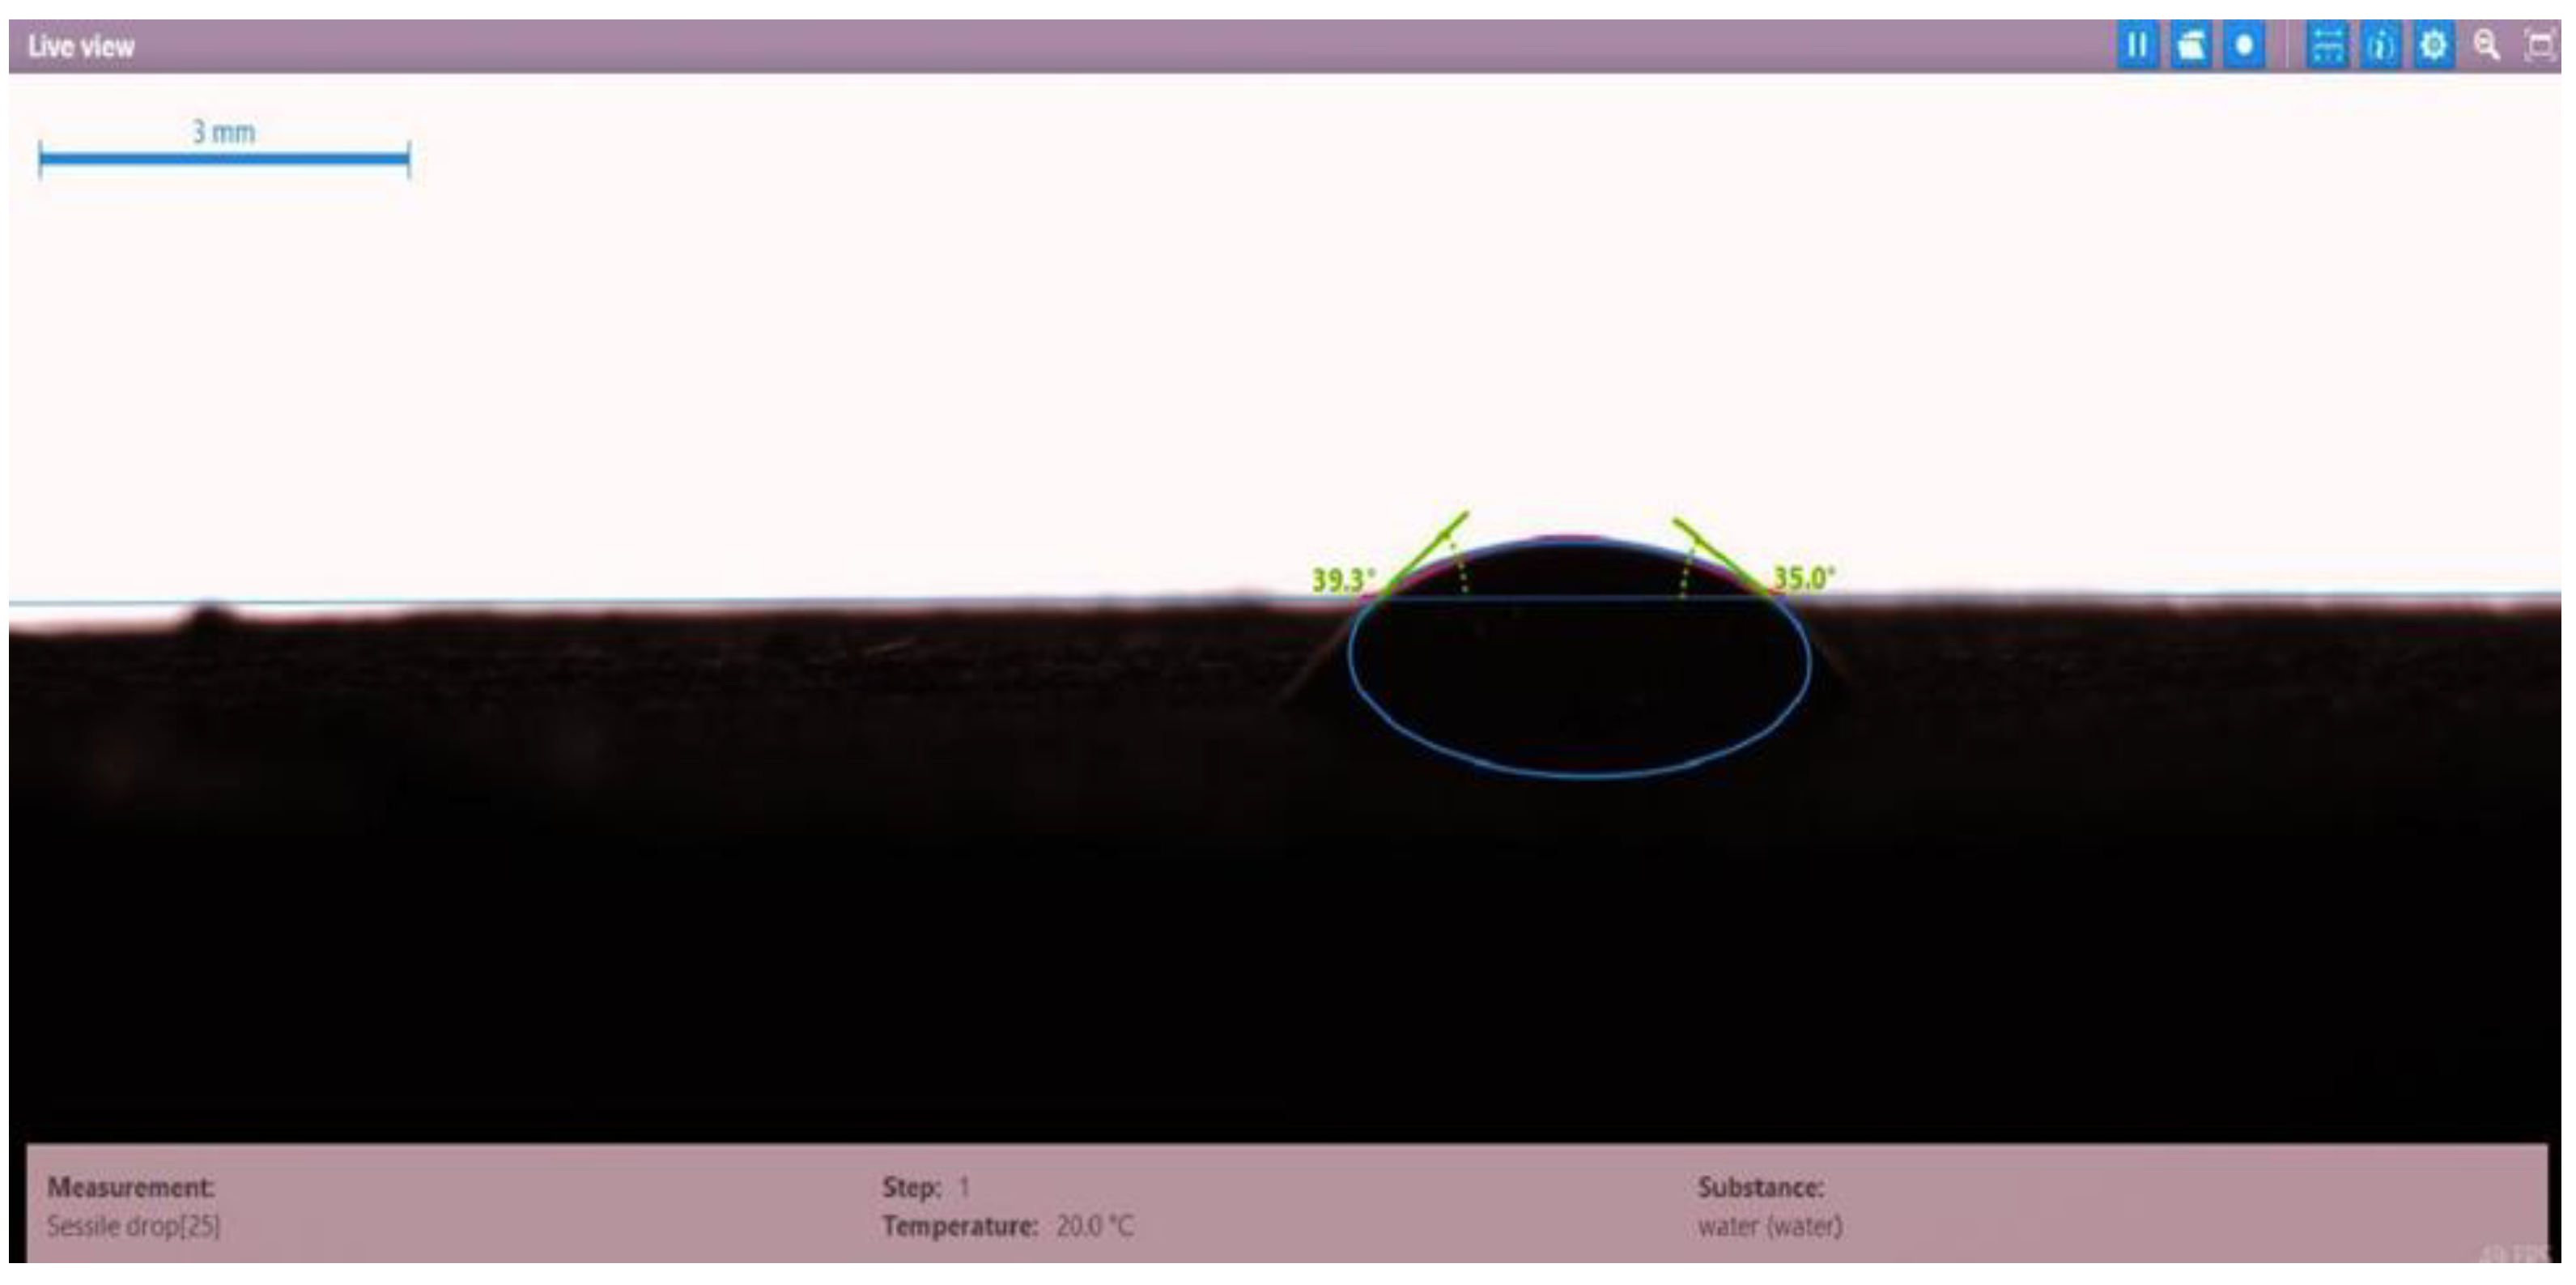
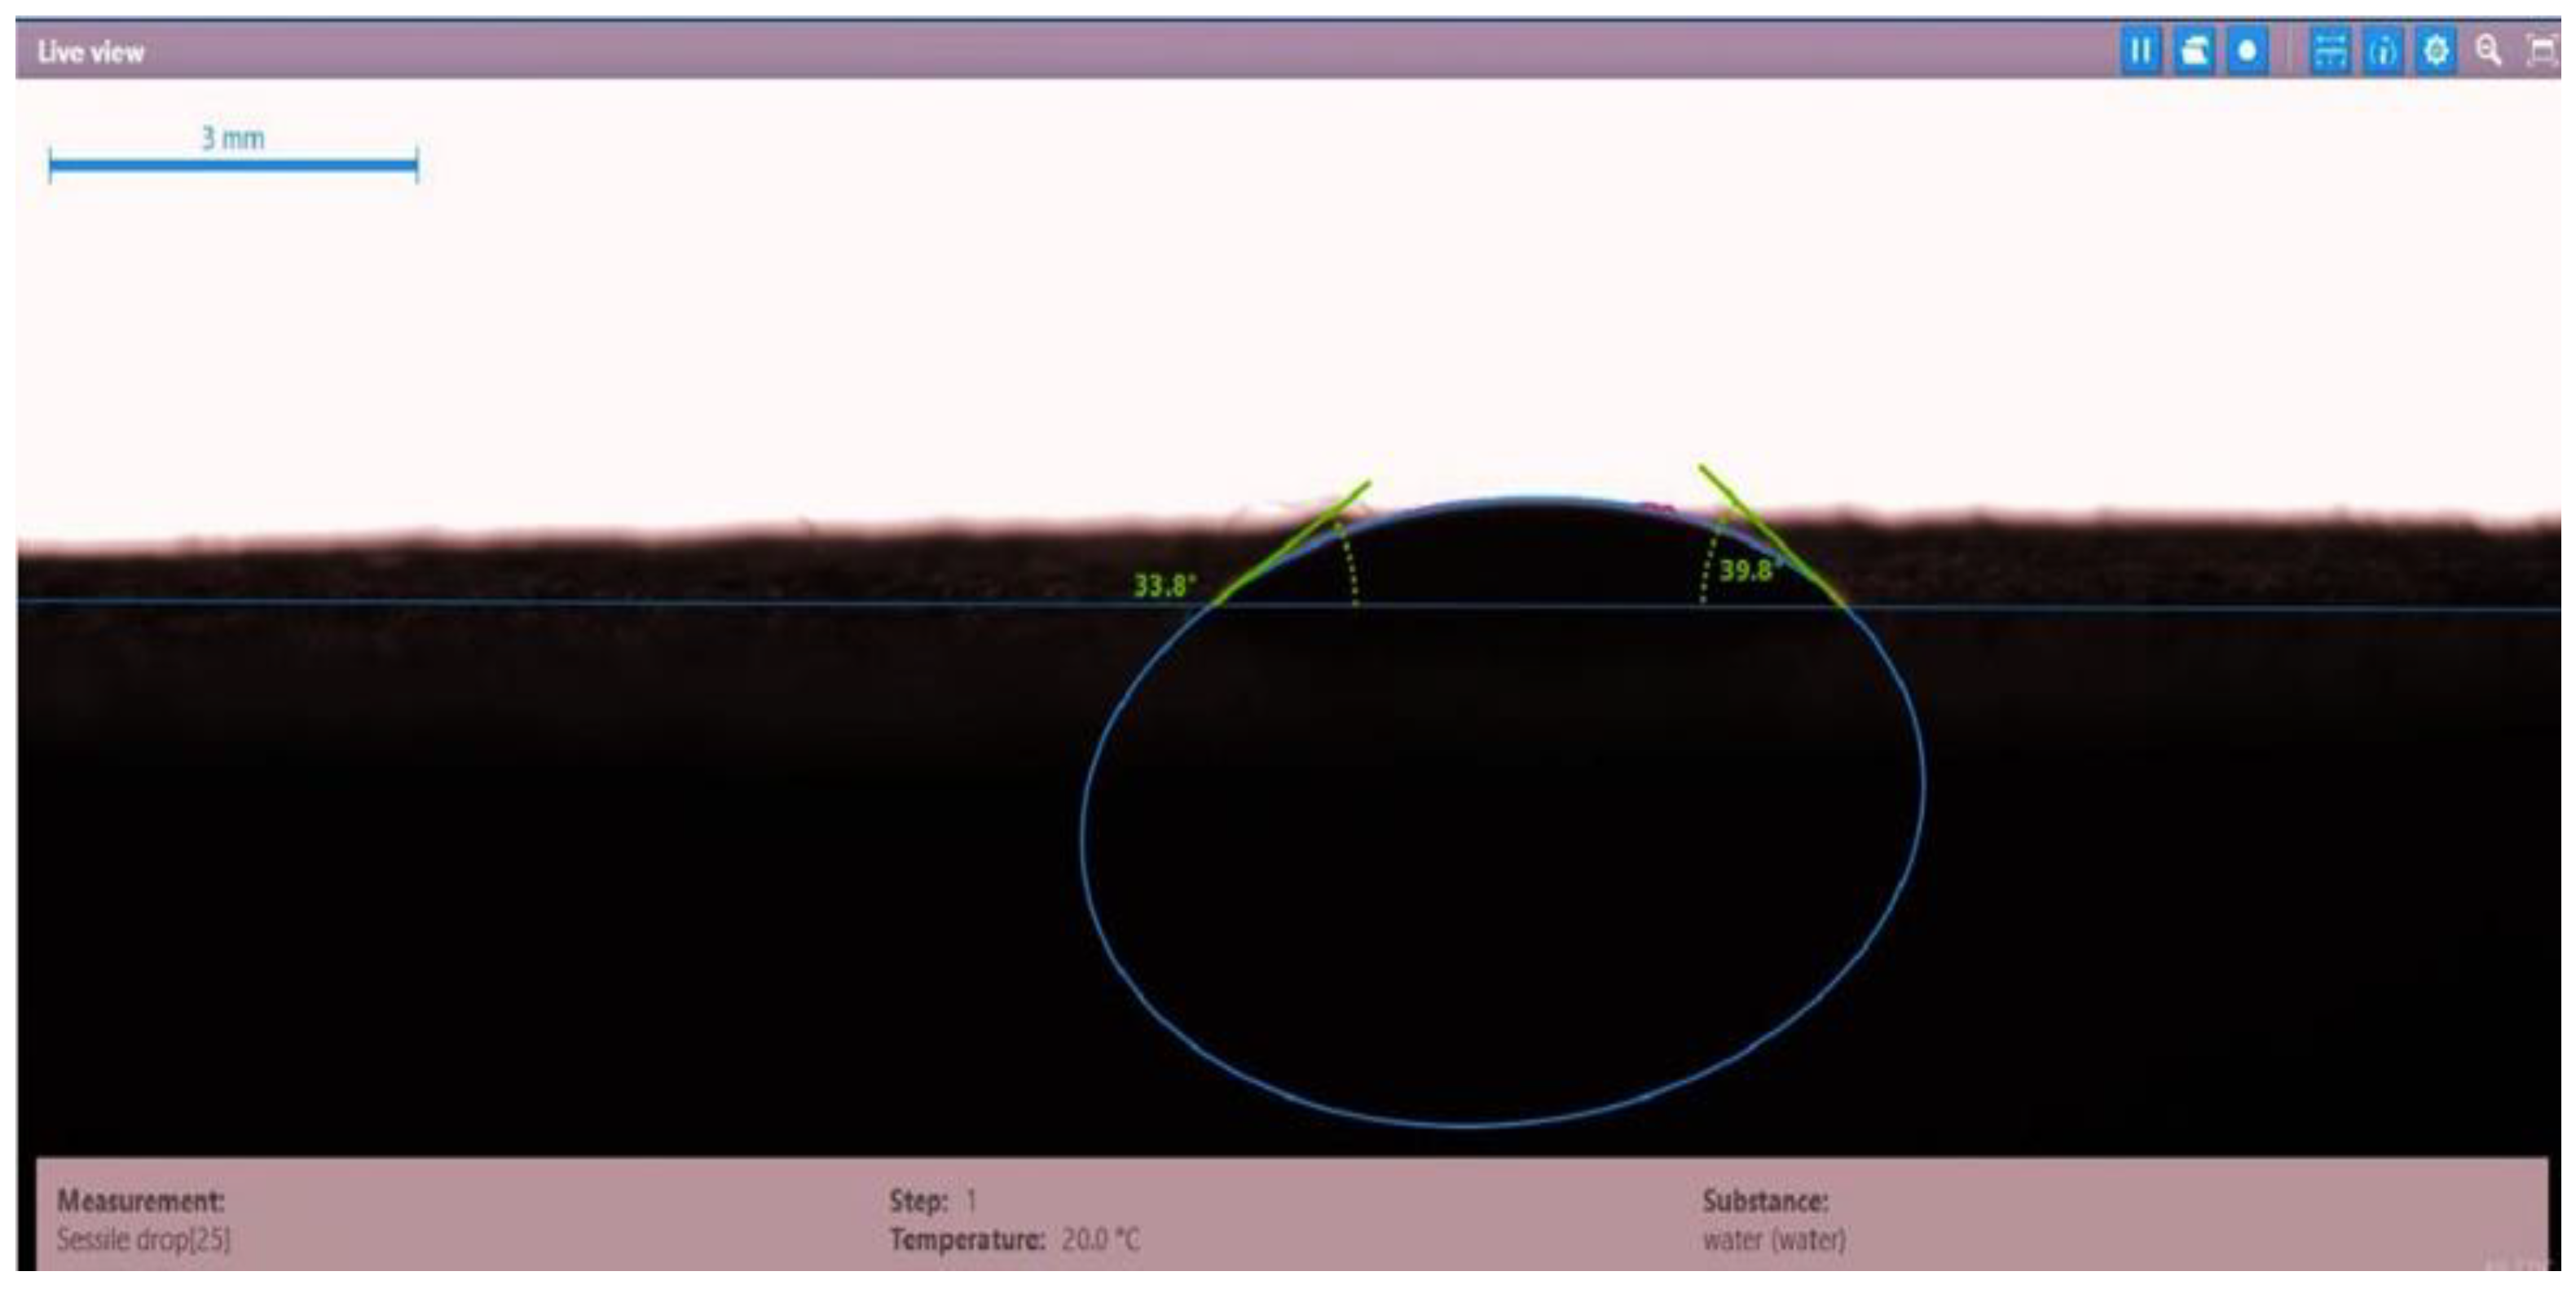
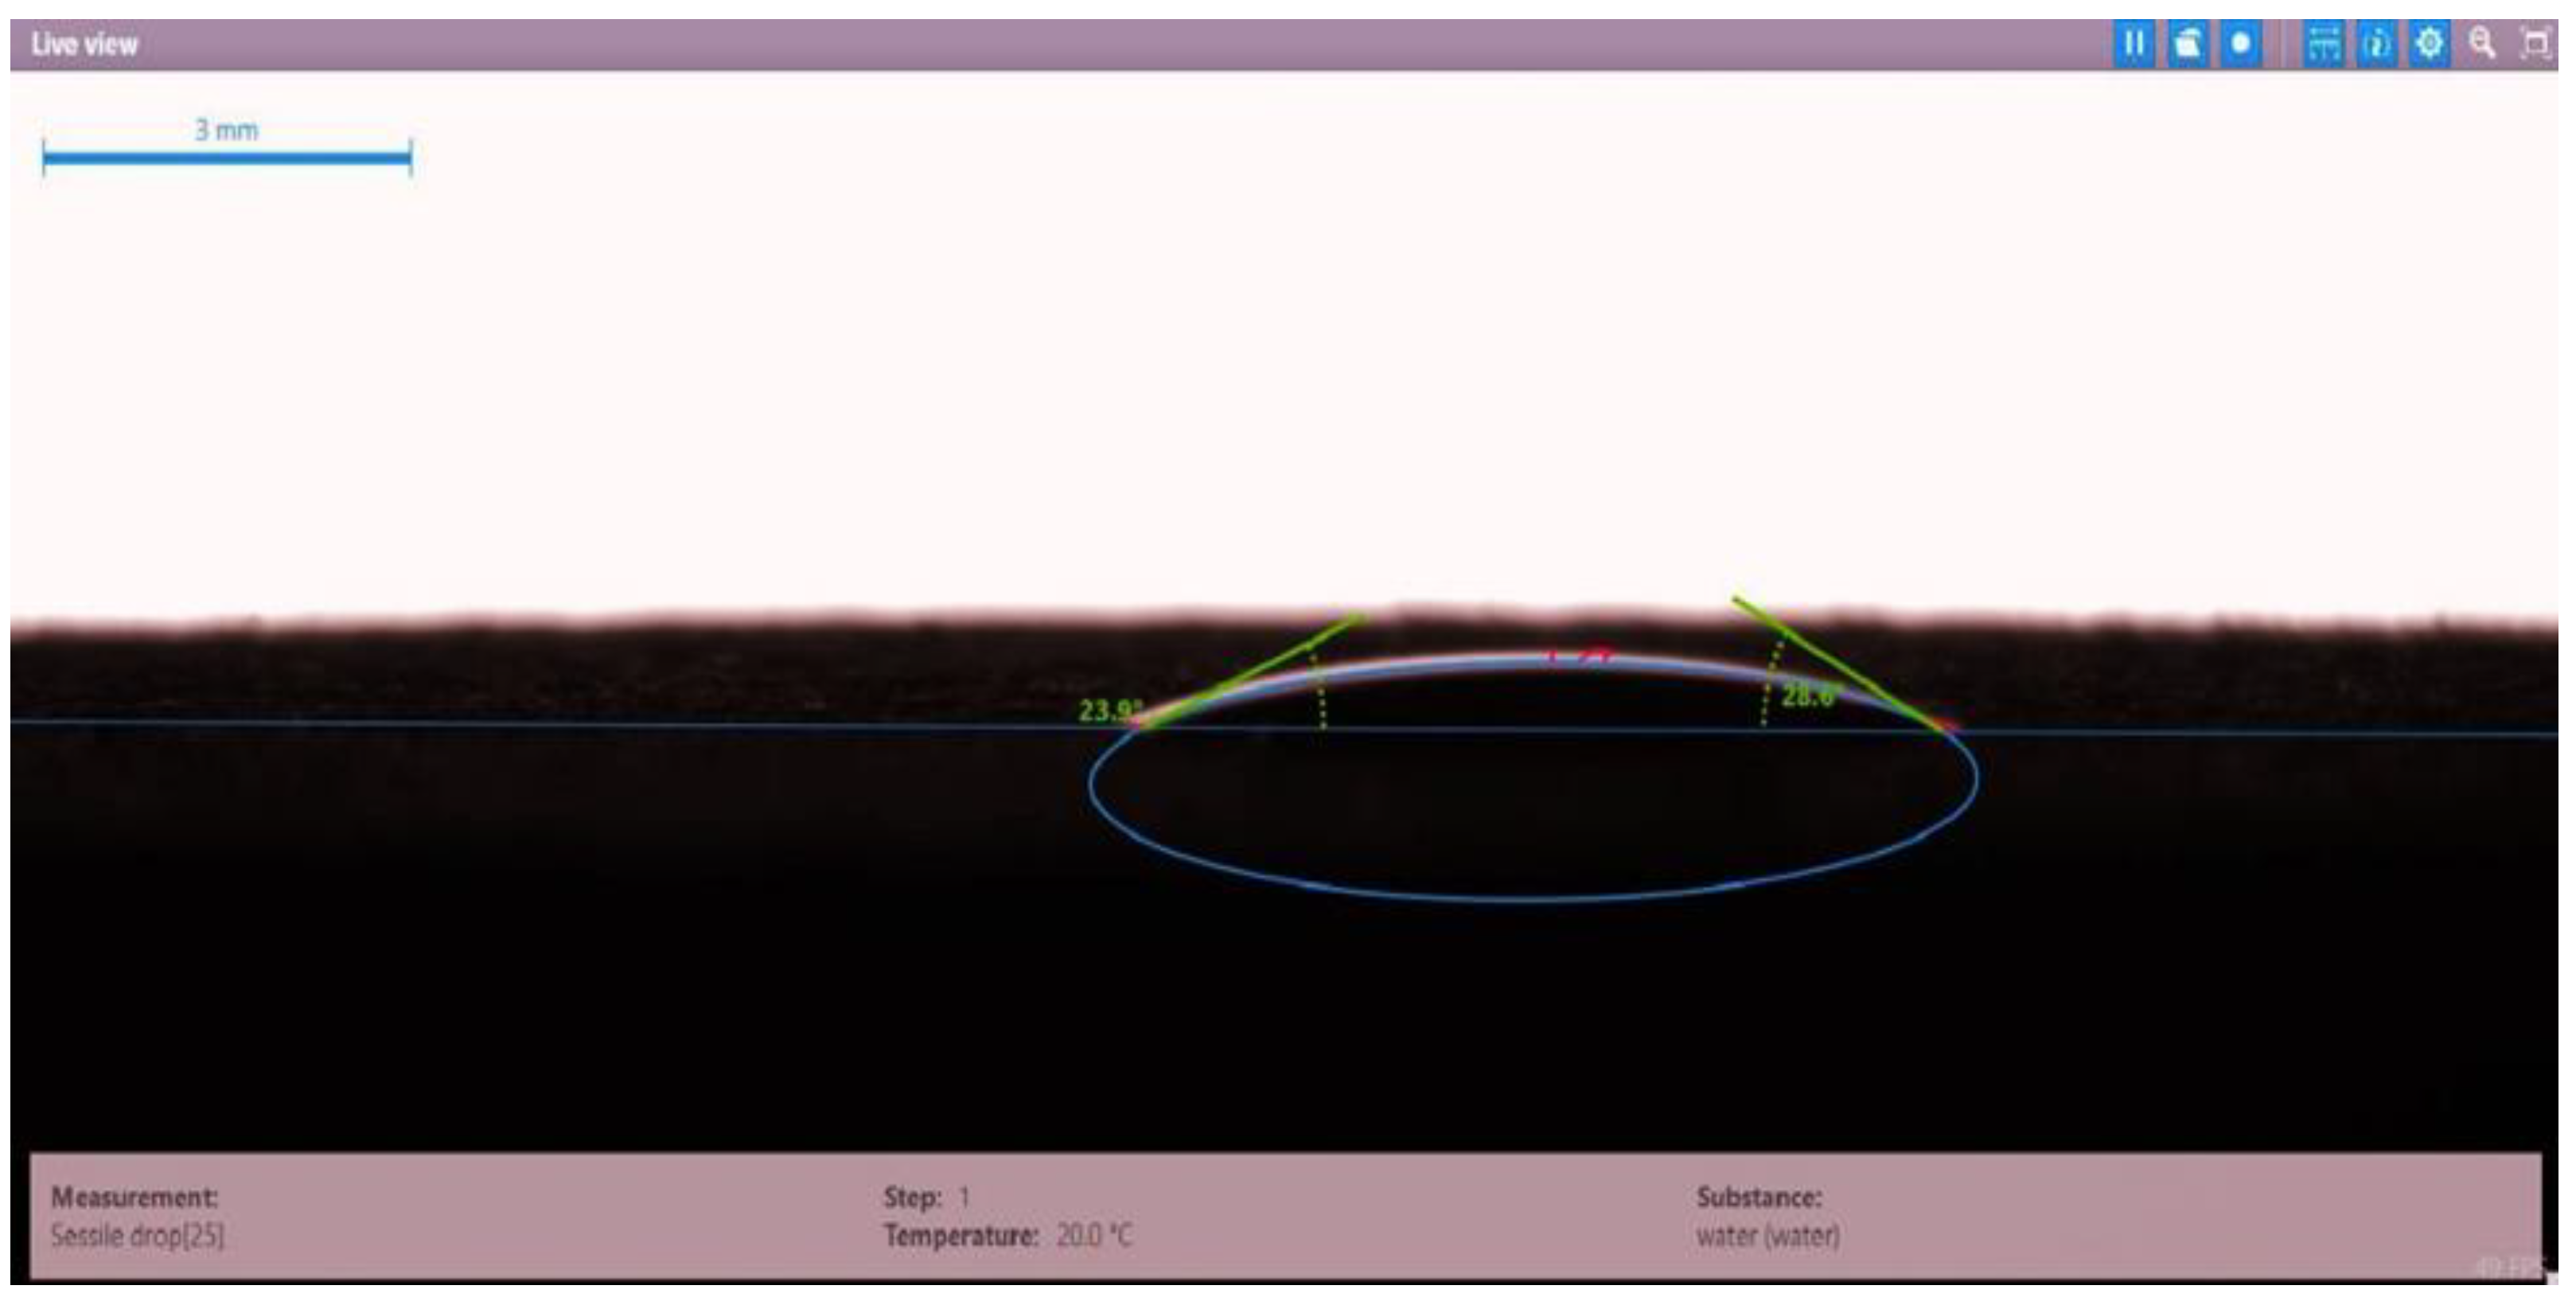
4.2.2. Compatibility for Surfactants
4.2.3. Thermal Stability
4.2.4. Adsorption and Injectivity Test
- I.
- Adsorption value < 400 μg/g;
- II.
- RF and RRF < 1.2.
4.2.5. Water and ASP Flooding
5. Conclusions
Author Contributions
Funding
Institutional Review Board Statement
Informed Consent Statement
Data Availability Statement
Acknowledgments
Conflicts of Interest
Sample Availability
Nomenclature
| ASP | Alkaline–surfactant–polymer |
| Al2O3 | Aluminum oxide |
| CAS | Cassava starch |
| CH3COOH | Acetic acid |
| CMC | Critical micelle concentration |
| cc | Cubic centimeter |
| cp | Centipoise |
| CS | Cassava starch |
| CSNF | Crystalline starch nanofluid |
| CSNPs | Starch nanoparticles |
| DSC | Differential scanning calorimetry |
| Dekasurf SF 9136 | PT SPR Langgak special surfactant |
| EOR | Enhanced oil recovery |
| FTIR | Fourier transform infrared spectroscopy |
| Fsol | F solution |
| HPAM | Partially hydrolyzed polyacrylamide |
| IFT | Interfacial tension, mN/m |
| M | Mobility ratio of water to oil |
| Mits-5L001 PT SPR | Langgak special surfactant |
| NaOH | Sodium hydroxide |
| Na2CO3 | Sodium carbonate |
| NPs | Nanoparticles |
| OOIP | Original oil in place |
| PV | Pore volume of sandstone core, cm3 |
| ppm | Parts per million |
| PSA | Particle size distribution |
| PSC HOMF | PT SPR Langgak special surfactant |
| PSC EOR 2.2 | PT SPR Langgak special surfactant |
| PYNPs | Purple yam nanoparticles |
| Q | Volumetric flow rate, cm3/min or ml/min |
| RF | Resistance factor |
| RFF | Residual resistance factor |
| Rf | Oil recovery percentage, % |
| SDBS | Sodium dodecylbenzene sulfonate |
| SDS | Sodium dodecyl sulfate |
| SFT | Surface tension, mN/m |
| SiO2 | Silicon dioxide |
| Sor | Residual oil saturation |
| TEM | Transmission electron microscopy |
| UV–VIS | Ultraviolet–visible spectrophotometer |
| ZnO | Zinc oxide |
| ΔP | Pressure difference, psi |
| ΔPPolymer | Differential pressure of polymer (or surfactant) injection, psi |
| ΔPBrine | Differential pressure of brine before polymer (or surfactant) injection, psi |
| ΔPBrine after polymer injection | ΔP of resumed brine flooding after polymer (or surfactant) injection, psi |
References
- Hongyan, C.; Jie, C.; Jian, F.; Hexin, L.; Qing, W.; Wenli, L. ASP flooding: A solution for chemical enhanced oil recovery in high temperature, low salinity reservoir. In Proceedings of the SPE Kingdom of Saudi Arabia Annual Technical Symposium and Exhibition, Dammam, Saudi Arabia, 23–26 April 2018. [Google Scholar] [CrossRef]
- Al-Jaber, H.A.; Arsad, A.; Tahir, M.; Nuhma, M.J.; Bandyopadhyay, S.; Abdulmunem, A.R.; Rahman, A.F.A.; Harun, Z.B.; Agi, A. Enhancing Oil Recovery by Polymeric Flooding with Purple Yam and Cassava Nanoparticles. Molecules 2023, 28, 4614. [Google Scholar] [CrossRef]
- Wang, W.; Peng, Y.; Chen, Z.; Liu, H.; Fan, J.; Liu, Y. Synergistic Effects of Weak Alkaline-Surfactant-Polymer and SiO2 Nanoparticles Flooding on Enhanced Heavy Oil Recovery. Energy Fuels 2022, 36, 7402–7413. [Google Scholar] [CrossRef]
- Kamal, M.S.; Adewunmi, A.A.; Sultan, A.S.; Al-Hamad, M.F.; Mehmood, U. Recent advances in nanoparticles enhanced oil recovery: Rheology, interfacial tension, oil recovery, and wettability alteration. J. Nanomater. 2017, 2017, 2473175. [Google Scholar] [CrossRef] [Green Version]
- Zuo, X.; Li, S.; Li, W.; Song, R.; Wang, T.; Xu, H. A Study on the Remaining Oil After Strong Base ASP flooding. In Proceedings of the SPE Annual Technical Conference and Exhibition, San Antonio, TX, USA, 8 October 2012. [Google Scholar] [CrossRef]
- Arvis, A.; Le Van, S.; Chon, B.H. Feasibility Study of Alkali-Surfactant-Polymer Flooding on Enhancing Heavy-Oil Recovery in a Heterogeneous Thin Reservoir. Int. J. Appl. Eng. Res. 2017, 12, 7225–7237. [Google Scholar]
- Yin, D.; Zhao, N.; Gao, J.; Gai, J. Experimental study of enhancing oil recovery with weak base alkaline/surfactant/polymer. Int. J. Polym. Sci. 2017, 2017, 4652181. [Google Scholar] [CrossRef] [Green Version]
- Guo, H.; Li, Y.; Wang, F.; Gu, Y. Comparison of strong-alkali and weak-alkali ASP-flooding field tests in Daqing oil field. SPE Prod. Oper. 2018, 33, 353–362. [Google Scholar] [CrossRef]
- Huang, M. Recovery Characteristics of Weak Alkali ASP Flooding in Second Oil Reservoir. IOP Conf. Ser. Earth Environ. Sci. 2020, 446, 052057. [Google Scholar] [CrossRef]
- Cheraghian, G.; Rostami, S.; Afrand, M. Nanotechnology in enhanced oil recovery. Processes 2020, 8, 1073. [Google Scholar] [CrossRef]
- Wang, M.-R.; Deng, L.; Liu, G.-C.; Wen, L.; Wang, J.-G.; Huang, K.-B.; Tang, H.-T.; Pan, Y.-M. Porous organic polymer-derived nanopalladium catalysts for chemoselective synthesis of antitumor benzofuro[2,3-b] pyrazine from 2-Bromophenol and Isonitriles. Org. Lett. 2019, 21, 4929–4932. [Google Scholar] [CrossRef]
- Zuo, C.; Chen, Q.; Tian, L.; Waller, L.; Asundi, A. Transport of intensity phase retrieval and computational imaging for partially coherent fields: The phase space perspective. Opt. Lasers Eng. 2015, 71, 20–32. [Google Scholar] [CrossRef]
- Zhang, H.; Guan, W.; Zhang, L.; Guan, X.; Wang, S. Degradation of an Organic Dye by Bisulfite Catalytically Activated with Iron Manganese Oxides: The Role of Superoxide Radicals. ACS Omega 2020, 5, 18007–18012. [Google Scholar] [CrossRef]
- Zhang, H.; Sun, M.; Song, L.; Guo, J.; Zhang, L. Fate of NaClO and membrane foulants during in-situ cleaning of membrane bioreactors: Combined effect on thermodynamic properties of sludge. Biochem. Eng. J. 2019, 147, 146–152. [Google Scholar] [CrossRef]
- Zhang, K.; Huo, Q.; Zhou, Y.-Y.; Wang, H.-H.; Li, G.-P.; Wang, Y.-W. Textiles/Metal–Organic Frameworks Composites as Flexible Air Filters for Efficient Particulate Matter Removal. ACS Appl. Mater. Interfaces 2019, 11, 17368–17374. [Google Scholar] [CrossRef] [PubMed]
- Gao, T.; Li, C.; Jia, D.; Zhang, Y.; Yang, M.; Wang, X.; Cao, H.; Li, R.; Ali, H.M.; Xu, X. Surface morphology assessment of CFRP transverse grinding using CNT nanofluid minimum quantity lubrication. J. Clean. Prod. 2020, 277, 123328. [Google Scholar] [CrossRef]
- Hu, Y.; Zhao, Z.; Dong, H.; Mikhailova, M.V.; Davarpanah, A. Hybrid Application of Nanoparticles and Polymer in Enhanced Oil Recovery Processes. Polymers 2021, 13, 1414. [Google Scholar] [CrossRef]
- Eseimokumoh, I.B.; Woyintonye, I.; Eniye, O.; Preye, T.-A.N.; Young, E.E. Improving Oil Recovery Efficiency Using Corn starch as a Local Polymer for Enhanced Oil Recovery Processes. Int. J. Curr. Sci. Res. Rev. 2021, 4, 1525–1536. [Google Scholar] [CrossRef]
- Agi, A.; Junin, R.; Abdullah, M.O.; Jaafar, M.Z.; Arsad, A.; Sulaiman, W.R.W.; Norddin, M.M.; Abdurrahman, M.; Abbas, A.; Gbadamosi, A.; et al. Application of polymeric nanofluid in enhancing oil recovery at reservoir condition. J. Pet. Sci. Eng. 2020, 194, 107476. [Google Scholar] [CrossRef]
- Ramos, G.A.R.; Akanji, L.T.; Afzal, W. A Novel Surfactant–Polymer/Alkaline–Surfactant–Polymer Formulation for Enhanced Oil Recovery (EOR) Processes. Energy Fuels 2020, 34, 1230–1239. [Google Scholar] [CrossRef]
- Alvarado, V.; Manrique, E. Enhanced Oil Recovery: An Update Review. Energies 2010, 3, 1529–1575. [Google Scholar] [CrossRef] [Green Version]
- Alagorni, A.H.; Pahang, M.U.M.; Bin Yaacob, Z.; Nour, A.H. An Overview of Oil Production Stages: Enhanced Oil Recovery Techniques and Nitrogen Injection. Int. J. Environ. Sci. Dev. 2015, 6, 693–701. [Google Scholar] [CrossRef] [Green Version]
- Al-Murayri, M.T.; Al-Mayyan, H.E.; Al-Mahmeed, N.; Muthuswamy, A.; Shahin, G.T.; Shukla, S.R. Alkali-Surfactant Adsorption and Polymer Injectivity Measurements Using Reservoir Core from a Giant High Temperature and High Salinity Clastic Reservoir to Design an ASP Pilot. In Proceedings of the SPE Kuwait Oil and Gas Show and Conference, Mishref, Kuwait, 13 October 2019. [Google Scholar] [CrossRef]
- Cheraghian, G.; Nezhad, S.S.K.; Kamari, M.; Hemmati, M.; Masihi, M.; Bazgir, S. Adsorption polymer on reservoir rock and role of the nanoparticles, clay and SiO2. Int. Nano Lett. 2014, 4, 114. [Google Scholar] [CrossRef] [Green Version]
- Van der Werff, J.; de Kruif, C.; Dhont, J. The shear-thinning behaviour of colloidal dispersions: II. Experiments. In Physica A: Statistical Mechanics and Its Applications; Elsevier: Amsterdam, The Netherlands, 1989; Volume 160, pp. 205–212. [Google Scholar] [CrossRef]
- Vafaei, M.T.; Eslamloueyan, R.; Enfeali, L.; Ayatollahi, S. Analysis and simulation of steam distillation mechanism during the steam injection process. Energy Fuels 2008, 23, 327–333. [Google Scholar] [CrossRef]
- Ali, J.A.; Kolo, K.; Manshad, A.K.; Mohammadi, A.H. Recent advances in application of nanotechnology in chemical enhanced oil recovery: Effects of nanoparticles on wettability alteration, interfacial tension reduction, and flooding. Egypt. J. Pet. 2018, 27, 1371–1383. [Google Scholar] [CrossRef]
- Assef, Y.; Pourafshary, P.; Hejazi, H. Controlling interactions of colloidal particles and porous media during low salinity water flooding and alkaline flooding by MgO Nanoparticles. In Proceedings of the SPE EOR Conference at Oil and Gas West Asia, Muscat, Oman, 21 March 2016. [Google Scholar] [CrossRef]
- Bera, A.; Kumar, T.; Ojha, K.; Mandal, A. Adsorption of surfactants on sand surface in enhanced oil recovery: Isotherms, kinetics and thermodynamic studies. Appl. Surf. Sci. 2013, 284, 87–99. [Google Scholar] [CrossRef]
- Angellier, H.; Choisnard, L.; Molina-Boisseau, S.; Ozil, P.; Dufresne, A. Optimization of the preparation of aqueous suspensions of waxy maize starch nanocrystals using a response surface methodology. Biomacromolecules 2004, 5, 1545–1551. [Google Scholar] [CrossRef]
- Shahrodin, N.S.M.; Rahmat, A.R.; Arsad, A. Synthesis and Characterization of Cassava Starch Nanocrystals by Hydrolysis Method. Adv. Mater. Res. 2015, 1113, 446–452. [Google Scholar] [CrossRef]
- Madras, G.; Kumar, S.; Chattopadhyay, S. Continuous distribution kinetics for ultrasonic degradation of polymers. Polym. Degrad. Stab. 2000, 69, 73–78. [Google Scholar] [CrossRef]
- He, F.; Zhao, D. Preparation and characterization of a new class of starch-stabilized bimetallic nanoparticles for degradation of chlorinated hydrocarbons in water. Environ. Sci. Technol. 2005, 39, 3314–3320. [Google Scholar] [CrossRef]
- Rosen, M.J.; Wang, H.; Shen, P.; Zhu, Y. Ultralow interfacial tension for enhanced oil recovery at very low surfactant concentrations. Langmuir 2005, 21, 3749–3756. [Google Scholar] [CrossRef]
- Cheraghian, G.; Kiani, S.; Nassar, N.N.; Alexander, S.; Barron, A.R. Silica nanoparticle enhancement in the efficiency of surfactant flooding of heavy oil in a glass micromodel. Ind. Eng. Chem. Res. 2017, 56, 8528–8534. [Google Scholar] [CrossRef] [Green Version]
- Hamedi-Shokrlu, Y.; Babadagli, T. Stabilization of nanometal catalysts and their interaction with oleic phase in porous media during enhanced oil recovery. Ind. Eng. Chem. Res. 2014, 53, 8464–8475. [Google Scholar] [CrossRef]
- Khan, M.Y.; Samanta, A.; Ojha, K.; Mandal, A. Design of alkaline/surfactant/polymer (ASP) slug and its use in enhanced oil recovery. Pet. Sci. Technol. 2009, 27, 1926–1942. [Google Scholar] [CrossRef]
- Negin, C.; Ali, S.; Xie, Q. Application of nanotechnology for enhancing oil recovery—A review. Petroleum 2016, 2, 324–333. [Google Scholar] [CrossRef]
- Moghaddam, R.N.; Bahramian, A.; Fakhroueian, Z.; Karimi, A.; Arya, S. Comparative study of using nanoparticles for enhanced oil recovery: Wettability alteration of carbonate rocks. Energy Fuels 2015, 29, 2111–2119. [Google Scholar] [CrossRef]
- Ogolo, N.A.; Olafuyi, O.A.; Onyekonwu, M.O. Enhanced oil recovery using nanoparticles. In Proceedings of the SPE Saudi Arabia Section Technical Symposium and Exhibition, Al-Khobar, Saudi Arabia, 8–11 April 2012; pp. 276–284. [Google Scholar] [CrossRef] [Green Version]
- Ma, X.; Jian, R.; Chang, P.R.; Yu, J. Fabrication and characterization of citric acid-modified starch nanoparticles/plasticized-starch composites. Biomacromolecules 2008, 9, 3314–3320. [Google Scholar] [CrossRef] [PubMed]
- Husein, N.; Yunan, M.H.; Ismail, I.; Rosli Wan Sulaiman, W.; Boyou, N.V. Enhanced Oil Recovery by Alkaline-Surfactant-Polymer Alternating with Waterflooding. Chem. Eng. Trans. 2018, 63, 823–828. [Google Scholar] [CrossRef]
- Zhu, Y.; Hou, Q.; Liu, W.; Ma, D.; Liao, G.-Z. Recent progress and effects analysis of ASP flooding field tests. In Proceedings of the SPE Symposium on Improved Oil Recovery, Tulsa, OK, USA, 14 April 2012; Volume 1, pp. 51–58. [Google Scholar] [CrossRef]


| Disc Label | Left Contact Angle (deg.) | Right Contact Angle (deg.) | Average Contact Angle (deg.) |
|---|---|---|---|
| Disc 1 | 71.7 | 70.7 | 71.2 |
| Disc 2 | 76.7 | 73.7 | 75.2 |
| Disc 3 | 80.4 | 79.2 | 79.8 |
| Disc 4 | 85.0 | 80.4 | 82.7 |
| Disc 5 | 99.3 | 100.4 | 99.85 |
| Disc 6 | 83.2 | 84.9 | 84.05 |
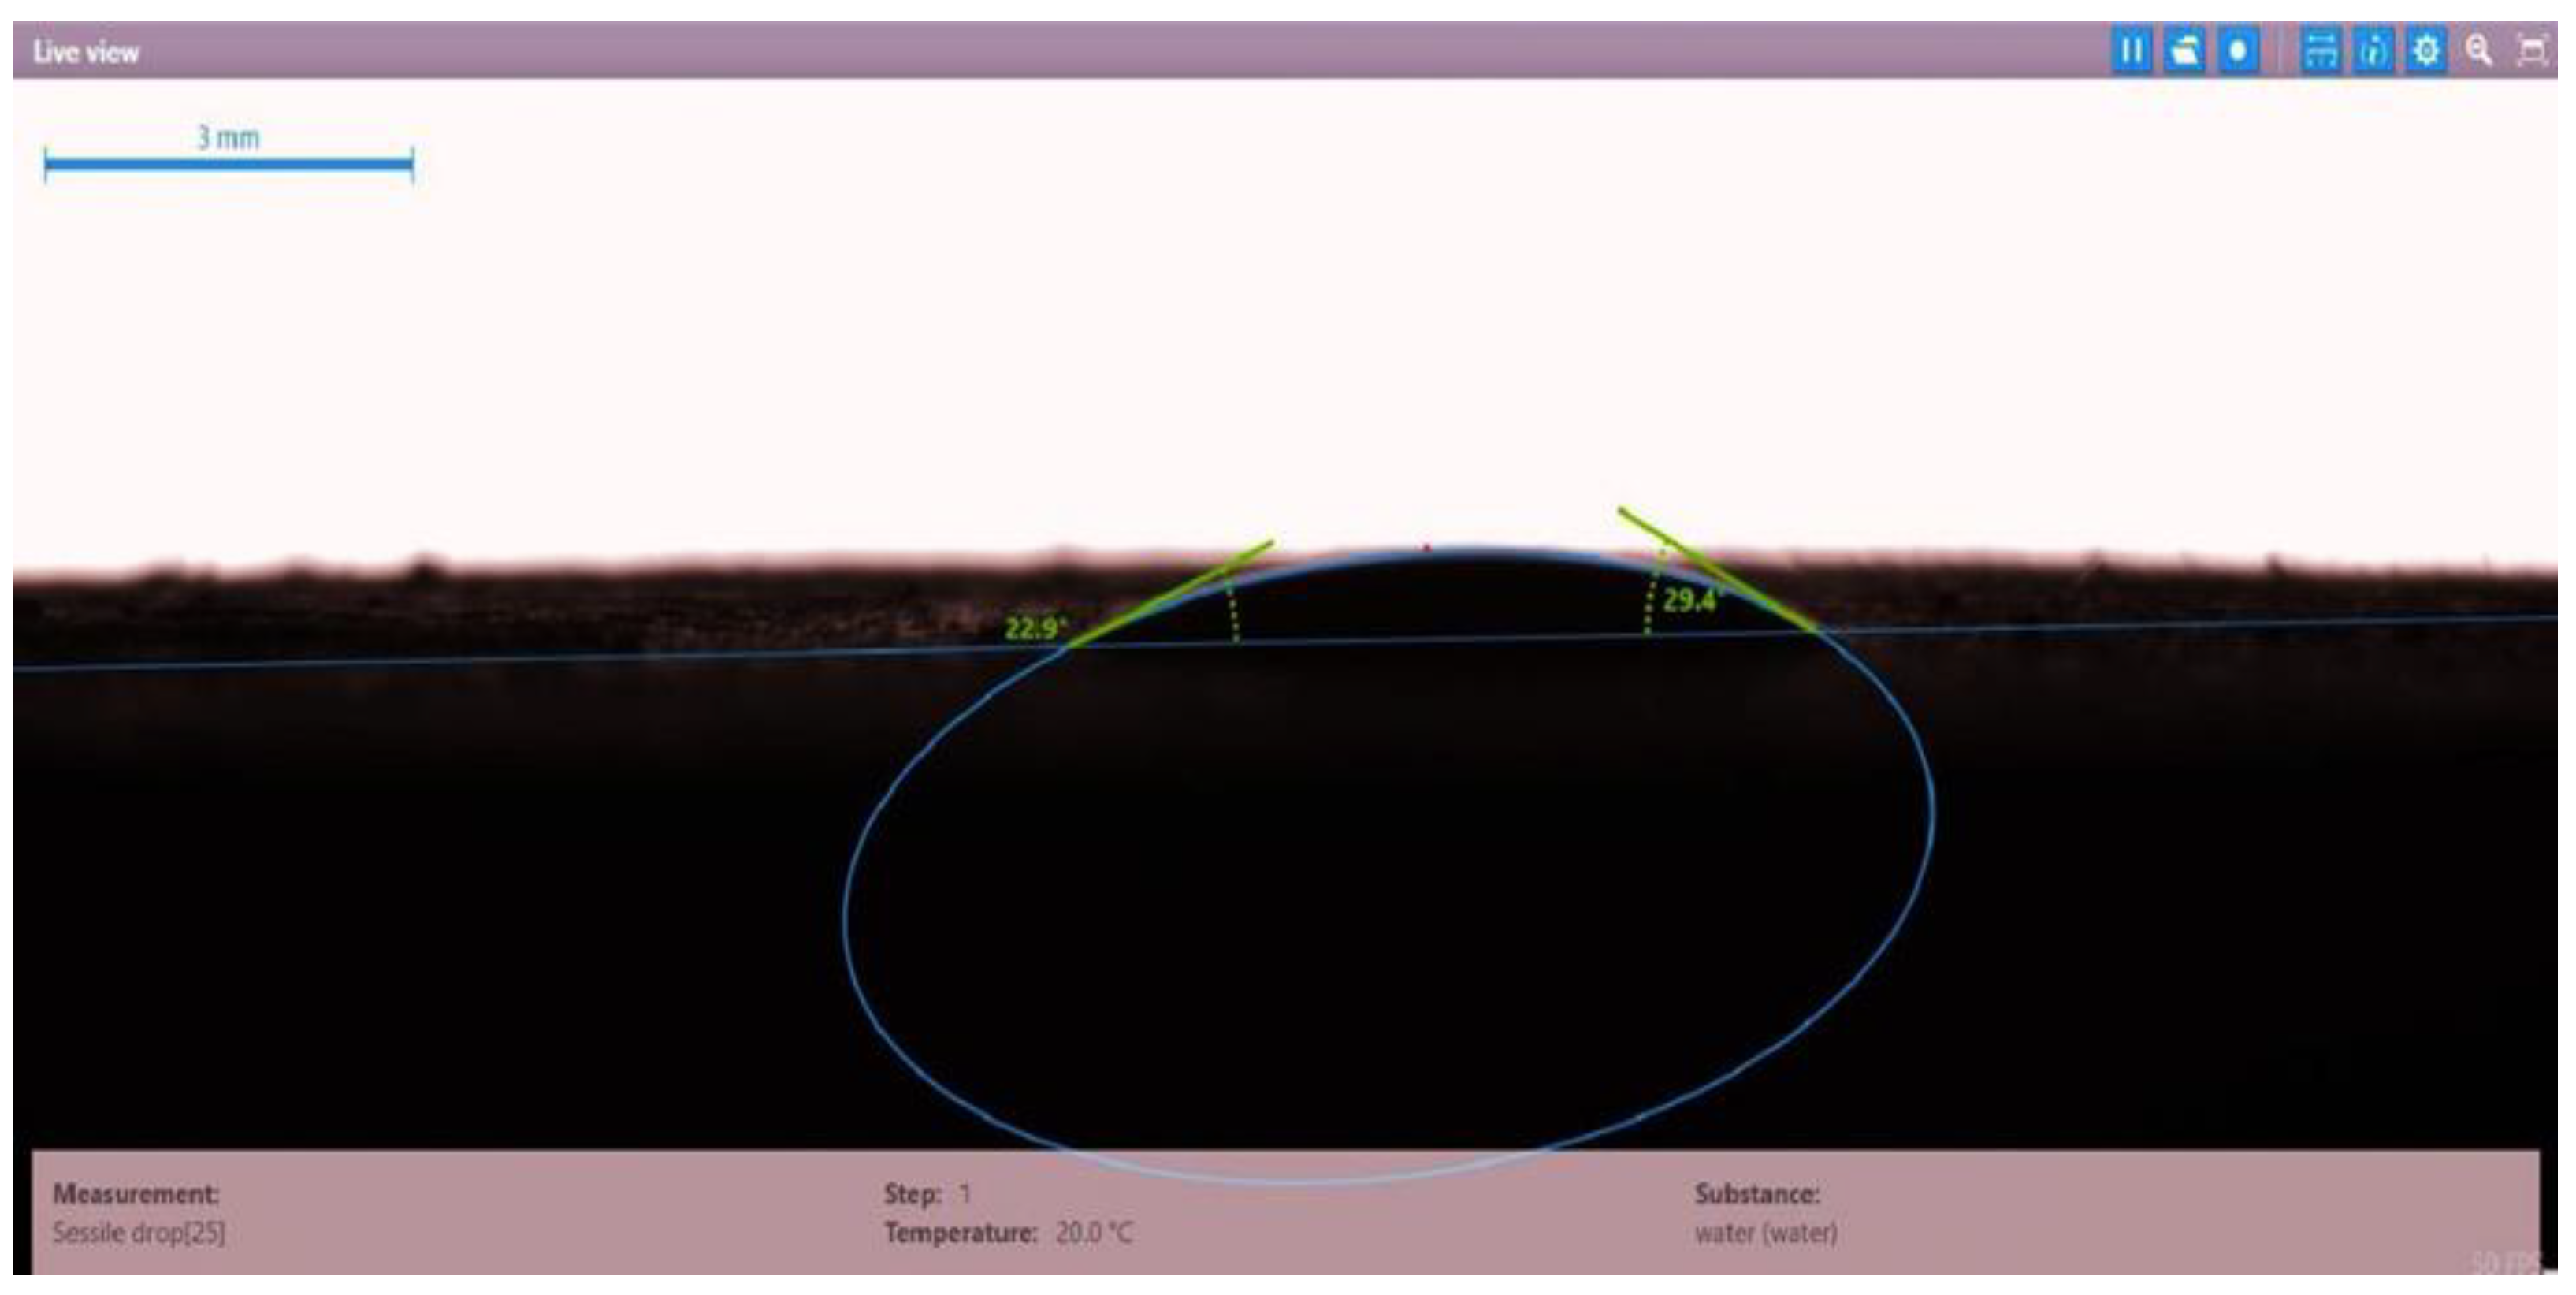
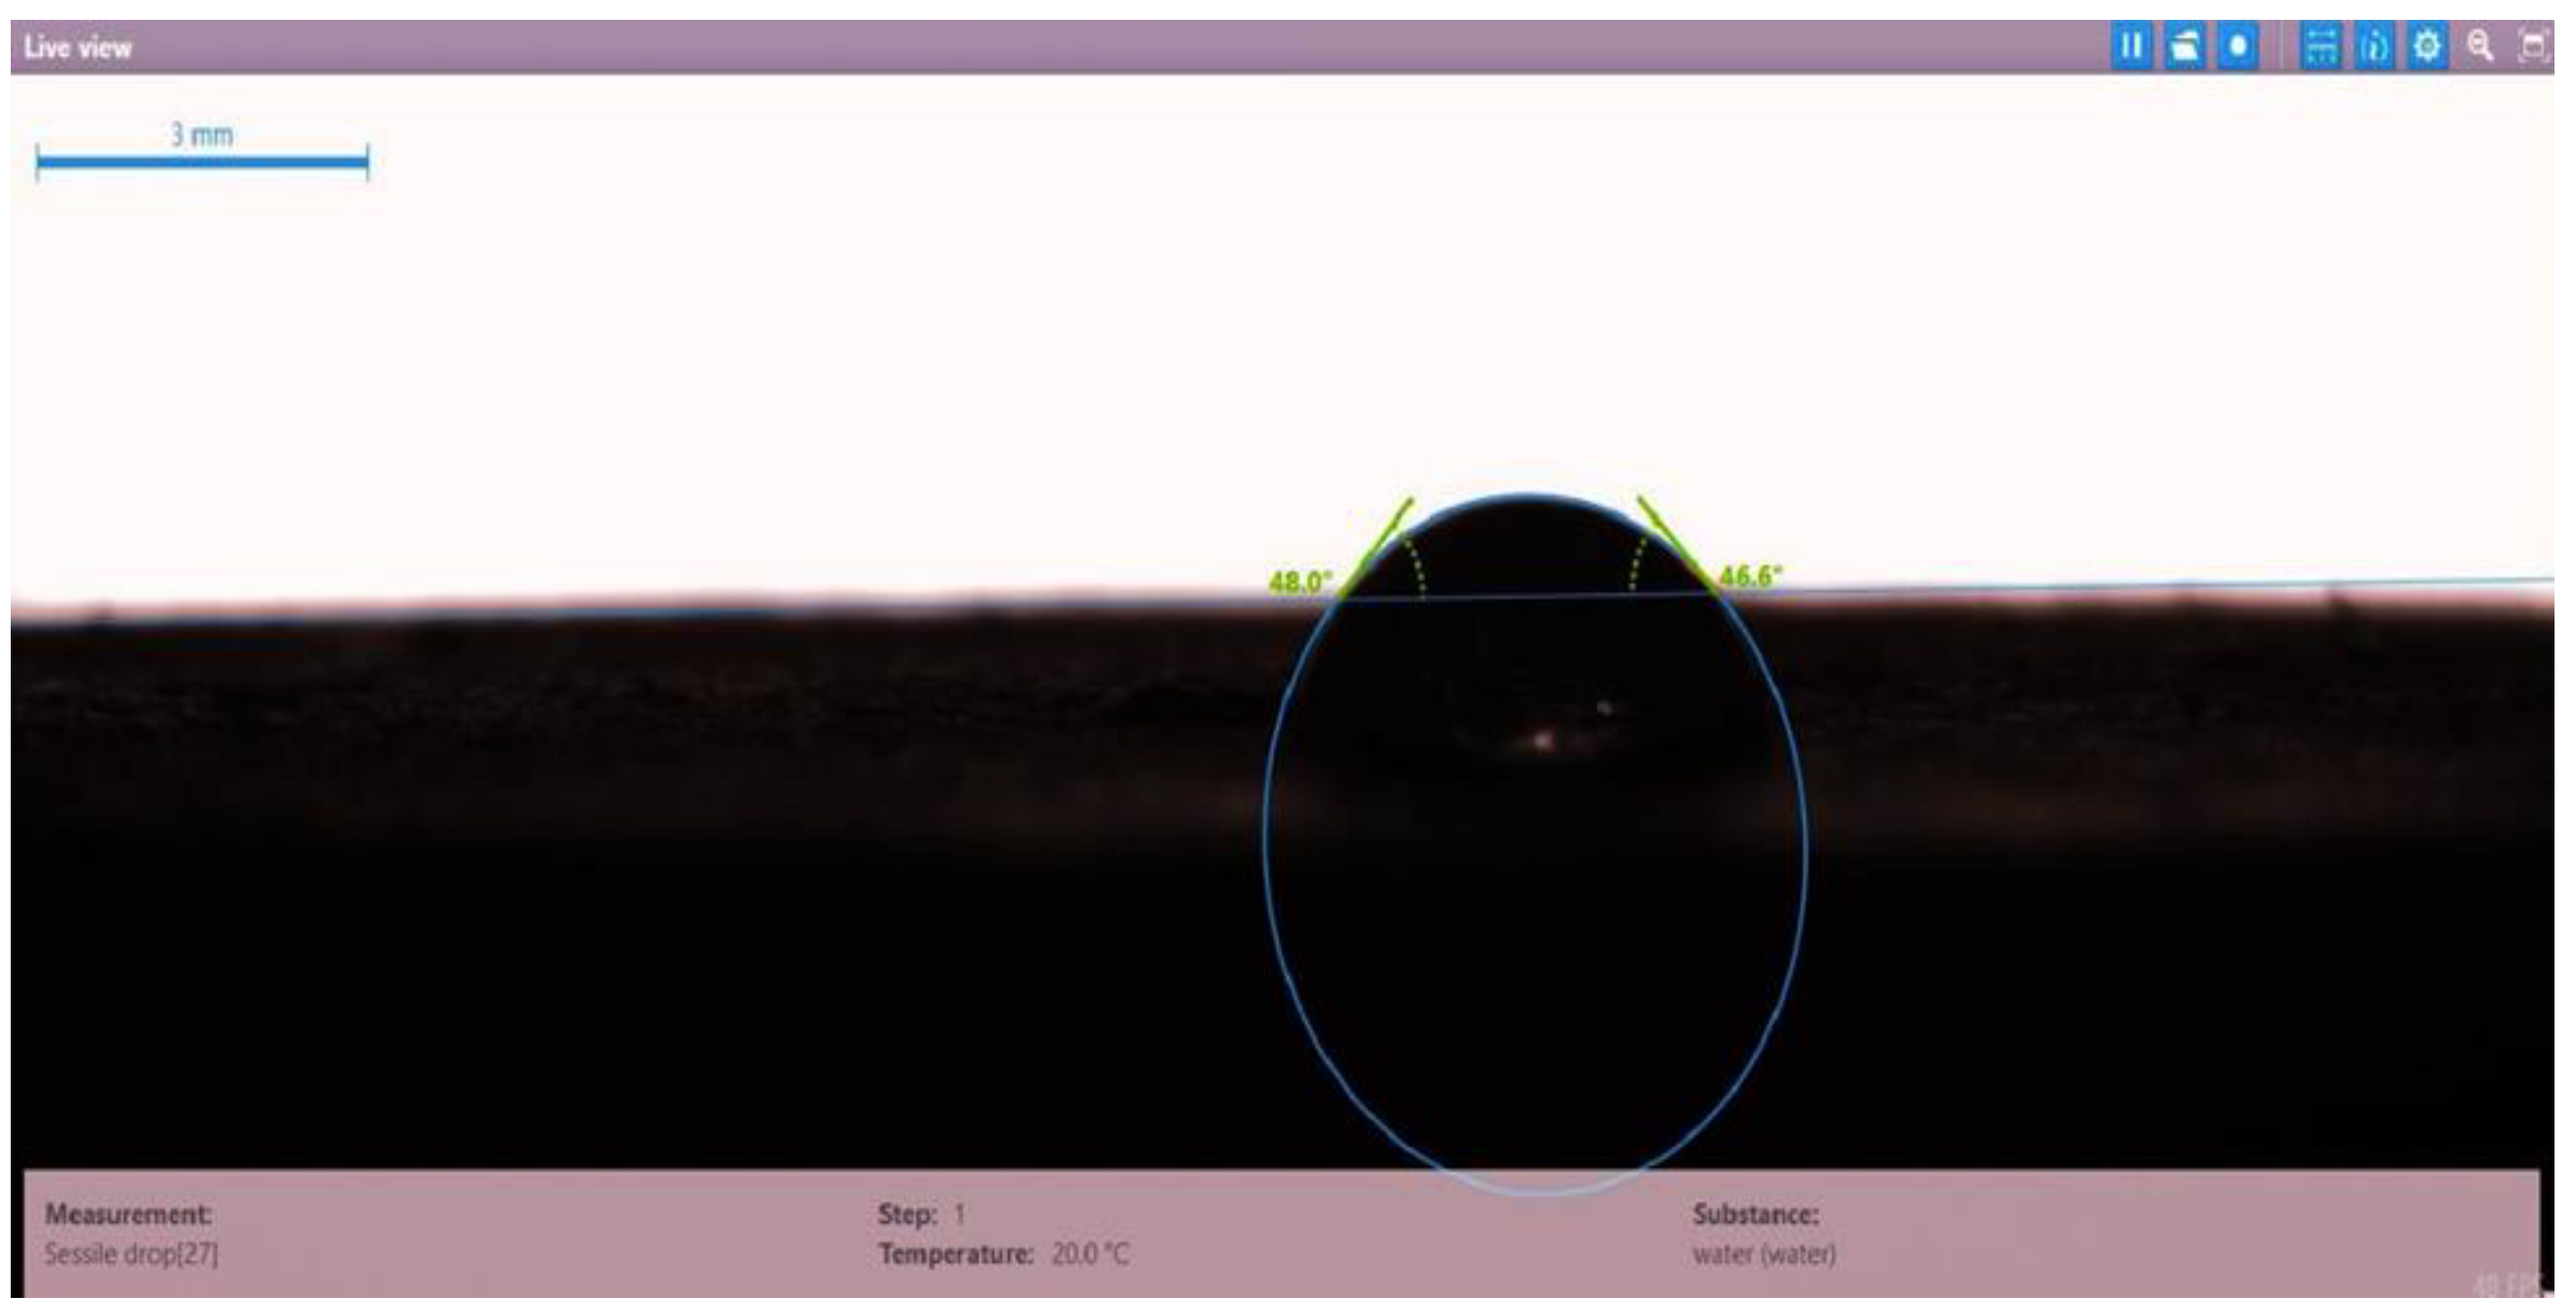
| Disc Label | Solution Type | Left Contact Angle (deg.) | Right Contact Angle (deg.) | Average Contact Angle (deg.) |
|---|---|---|---|---|
| Disc 1 | PSC HOMF (0.63 wt.%) | 39.3 | 35.0 | 37.15 |
| Disc 2 | Dekasurf SF 9136 (1.24 wt.%) | 33.8 | 39.8 | 36.8 |
| Disc 3 | Mits-5L001 (1.0 wt.%) | 23.9 | 28.0 | 25.95 |
| Disc 4 | PSC EOR 2.2 (0.98 wt.%) | 22.9 | 29.4 | 26.15 |
| Disc 5 | HPAM (2000 ppm) + PYNPs (1.25 wt.%) | 48.0 | 46.6 | 47.3 |
| Disc 6 | HPAM (2000 ppm) + CSNPs (1.25 wt.%) | 55.8 | 54.3 | 55.05 |
| Chemicals Inspected | Material Injected | Pressure Difference, ΔP, atm | Volumetric Flow Rate, cm3/sec | Conc. wt.% | Permeability, mD | Resistance Factor, RF | Residual Resistance Factor, RFF | Adsorption Rate, mg/g |
|---|---|---|---|---|---|---|---|---|
| HPAM | HPAM | 0.0851 | 0.005 | 0.10 | 109.25 | 0.4098 < 1.2 * | - | |
| Brine Re-Injected | 0.2674 | 0.0333 | 0.010 | 231.6 | - | 1.2885 > 1.2 ** | - | |
| HPAM + Purple Yam NPs | HPAM + Purple Yam NPs | 0.1837 | 0.005 | 0.1 (HPAM) + 1.25 (PYNPs) | 50.61 | 0.40298 < 1.2 | - | |
| Brine Re-Injected | 0.54641 | 0.0333 | 0.01 | 113.32 | - | 1.1985 < 1.2 | - | |
| HPAM + Cassava NPs | HPAM + Cassava NPs | 0.23816 | 0.005 | 0.1 (HPAM) + 1.25 (CSNPs) | 39.04 | 0.35 < 1.2 | - | |
| Brine Re-Injected | 0.56478 | 0.0333 | 0.01 | 109.63 | - | 0.83 < 1.2 | - | |
| SDS | SDS | 0.1429 | 0.005 | 0.625 | 65.1 | 1.75 > 1.2 | - | 3.25 > 0.4 *** |
| Brine Re-Injected | 0.42529 | 0.0333 | 0.01 | 145.59 | - | 5.208 > 1.2 | - | |
| SDBS | SDBS | 0.2688 | 0.005 | 0.5 | 34.59 | 1.681 > 1.2 | - | 3.0 > 0.4 |
| Brine Re-Injected | 0.25177 | 0.0333 | 0.01 | 216.89 | - | 1.574 > 1.2 | - | |
| Mits-5L001 | Mits-5L001 | 0.21502 | 0.005 | 0.10 | 43.24 | 1.239 > 1.2 | - | 0.3 < 0.4 **** |
| Brine Re-Injected | 0.18713 | 0.0333 | 0.010 | 330.89 | - | 1.0784 < 1.2 | - | |
| PSC HOMF | PSC HOMF | 0.32322 | 0.005 | 0.10 | 28.764 | 0.475 < 1.2 | - | 0.28 < 0.4 |
| Brine Re-Injected | 0.57158 | 0.0333 | 0.01 | 108.33 | - | 0.475 < 1.2 | - | |
| Dekasurf SF 9136 | Dekasurf SF 9136 | 0.63963 | 0.005 | 0.10 | 14.54 | 0.752 < 1.2 | - | 0.5 > 0.4 |
| Brine Re-Injected | 0.89820 | 0.0333 | 0.01 | 68.938 | - | 1.056 < 1.2 | - | |
| PSC EOR 2.2 | PSC EOR 2.2 | 0.51034 | 0.005 | 0.10 | 18.218 | 0.42857 < 1.2 | - | 0.39 < 0.4 |
| Brine Re-Injected | 1.29287 | 0.0333 | 0.01 | 47.893 | - | 1.0857 < 1.2 | - |
| S. | Component | Type of Component | Concentration (wt.%) |
|---|---|---|---|
| 1 | Sodium hydroxide (NaOH) | Alkaline | 1.28 |
| 2 | Sodium carbonate (Na2CO3) | Alkaline | 0.90 |
| 3 | PSC HOMF | Surfactant | 0.63 wt.% |
| 4 | Dekasurf SF 9136 | Surfactant | 1.24 wt.% |
| 5 | Mits-5L001 | Surfactant | 1.0 wt.% |
| 6 | PSC EOR 2.2 | Surfactant | 0.98 wt.% |
| S. | Alkali | Surfactant | Polymer | Concentration of ASP Slug wt.% | Net Incremental Oil Recovery (%) |
|---|---|---|---|---|---|
| 1 | NaOH | PSC HOMF | (HPAM + PYNPs) | 1.28 − 0.63 − (0.2 + 0.60) | 34.61 |
| 2 | NaOH | Mits-5L001 | (HPAM + PYNPs) | 1.28 − 1.0 − (0.2 + 0.60) | 22.73 |
| 3 | NaOH | PSC EOR 2.2 | (HPAM + PYNPs) | 1.28 − 0.98 − (0.2 + 0.60) | 39.17 |
| 4 | Na2CO3 | PSC HOMF | (HPAM + PYNPs) | 0.90 − 0.63 − (0.2 + 0.60) | 25.39 |
| 5 | Na2CO3 | Mits-5L001 | (HPAM + PYNPs) | 0.90 − 1.0 − (0.2 + 0.60) | 25.72 |
| 6 | Na2CO3 | PSC EOR 2.2 | (HPAM + PYNPs) | 0.90 − 0.98 − (0.2 + 0.60) | 22.73 |
| 7 | NaOH | PSC HOMF | (HPAM + CSNPs) | 1.28 − 0.63 − (0.2 + 0.80) | 35.0 |
| 8 | NaOH | Mits-5L001 | (HPAM + CSNPs) | 1.28 − 1.0− (0.2 + 0.80) | 23.15 |
| 9 | NaOH | PSC EOR 2.2 | (HPAM + CSNPs) | 1.28 − 0.98 − (0.2 + 0.80) | 25.22 |
| 10 | Na2CO3 | PSC HOMF | (HPAM + CSNPs) | 0.90 − 0.63 − (0.2 + 0.80) | 17.69 |
| 11 | Na2CO3 | Mits-5L001 | (HPAM + CSNPs) | 0.90 − 1.0 − (0.2 + 0.80) | 27.56 |
| 12 | Na2CO3 | PSC EOR 2.2 | (HPAM + CSNPs) | 0.90 − 0.98 − (0.2 + 0.80) | 21.66 |
| Product ID | Formation | Permeability | Porosity | UCS | Steer by |
|---|---|---|---|---|---|
| SS-104 | Upper Devonian | 150–350 mD KCL 400–500 Md N2 | 20–22% | 3800–4500 psi | KCL/N2 |
| Acid Hydrolysis Parameters | Processability Ranges | |
|---|---|---|
| Minimum | Maximum | |
| Acid concentration, mol/L | 2.2 | 3.6 |
| Temperature, °C | 40 | 60 |
| Time, days | 3 | 7 |
| Property | Sodium Hydroxide | Sodium Carbonate |
|---|---|---|
| Purity | 98% | 99~100% |
| Molecular weight | 39.997 g/mol | 105.99 g/mol |
| Physical state | Solid | Powder |
| Odor | Odorless | Odorless |
| Color | Colorless | White |
| Melting temperature | 323 °C | 851 °C |
| Boiling temperature | 1390 °C | 1600 °C @ 760 mmHg |
| pH value | ~14 at (50 g/L H2O, 20 °C) | - |
| Solubility in water | 1090 g/L (at 20 °C) | 22 g/100 mL (at 20 °C) |
| Solubility in ethanol | 139 g/L | - |
| Specific gravity | - | 2.53 |
| Chemical formula | NaOH | Na2CO3 |
Disclaimer/Publisher’s Note: The statements, opinions and data contained in all publications are solely those of the individual author(s) and contributor(s) and not of MDPI and/or the editor(s). MDPI and/or the editor(s) disclaim responsibility for any injury to people or property resulting from any ideas, methods, instructions or products referred to in the content. |
© 2023 by the authors. Licensee MDPI, Basel, Switzerland. This article is an open access article distributed under the terms and conditions of the Creative Commons Attribution (CC BY) license (https://creativecommons.org/licenses/by/4.0/).
Share and Cite
Al-Jaber, H.A.; Arsad, A.; Bandyopadhyay, S.; Abdurrahman, M.; Abdulfatah, M.Y.; Agi, A.; Yusuf, S.M.; Abdulmunem, A.R.; Tahir, M.; Nuhma, M.J. Enhancing ASP Flooding by Using Special Combinations of Surfactants and Starch Nanoparticles. Molecules 2023, 28, 5770. https://doi.org/10.3390/molecules28155770
Al-Jaber HA, Arsad A, Bandyopadhyay S, Abdurrahman M, Abdulfatah MY, Agi A, Yusuf SM, Abdulmunem AR, Tahir M, Nuhma MJ. Enhancing ASP Flooding by Using Special Combinations of Surfactants and Starch Nanoparticles. Molecules. 2023; 28(15):5770. https://doi.org/10.3390/molecules28155770
Chicago/Turabian StyleAl-Jaber, Hasanain A., Agus Arsad, Sulalit Bandyopadhyay, Muslim Abdurrahman, Mohammad Yasin Abdulfatah, Augustine Agi, Suriatie Mat Yusuf, Abdulmunem R. Abdulmunem, Muhammad Tahir, and Mustafa Jawad Nuhma. 2023. "Enhancing ASP Flooding by Using Special Combinations of Surfactants and Starch Nanoparticles" Molecules 28, no. 15: 5770. https://doi.org/10.3390/molecules28155770