
Simple Rate Expression for Catalyzed Ammonia Decomposition for Fuel Cells


Otto H. York Department of Chemical and Materials Engineering, New Jersey Institute of Technology, Newark, NJ 07102, USA
Molecules 2023, 28(16), 6006; https://doi.org/10.3390/molecules28166006
Submission received: 19 July 2023
/
Revised: 2 August 2023
/
Accepted: 7 August 2023
/
Published: 10 August 2023
Abstract
:This paper examines NH3 decomposition rates based on a literature-proven six-step elementary catalytic (Ni-BaZrO3) mechanism valid for 1 × 10⁵ Pa pressure in a 650–950 K range. The rates are generated using a hypothetical continuous stirred tank catalytic reactor model running the literature mechanism. Excellent correlations are then obtained by fitting these rates to a simple overall kinetic expression based on an assumed slow step, with the remaining steps in fast pseudo-equilibria. The robust overall simple rate expression is then successfully demonstrated in various packed bed reactor applications. This expression facilitates engineering calculations without the need for a complex, detailed mechanism solver package. The methodology used in this work is independent of the choice of catalyst. It relies on the availability of a previously published and validated elementary reaction mechanism.
1. Background
Motivated by global warming, the worldwide movement to decarbonize national economies continues to grow. Fuels high in hydrogen content (e.g., CH4 or pure H2) are preferred. Compressed natural gas for transportation fleets is well known. The popularity and performance of battery-powered pure electric vehicles are growing despite limited charging stations and relatively long battery recharging times.
As a non-carbon fuel, liquid NH3 is attracting increasing attention [1]. It combines the advantages of easy storage and transport without producing greenhouse gases. Anhydrous liquid NH3 is typically stored at 9.6 × 10⁵ Pa absolute at room temperature. “Green” NH3 can be catalytically produced from N2 and H2 using solar power [2]. Ammonia as a H2 source is gaining considerable attention [3].
While direct NH3 combustion produces H2O and N2 as major products, temperatures can easily exceed 1000 K, resulting in pollutant nitrogen oxides [4]. To avoid these temperatures, fuel cells are preferred for the oxidation of the H2 from NH3 decomposition [2,5]. Ammonia-powered fuel cells are now being tested for freight-hauling vehicles, including large trucks [6] and locomotives [7].
Production of H2 from NH3 can be accomplished in various ways, including catalytic decomposition from either gaseous or solution NH3 [3]. Various metals (e.g., Ru, Ir, Ni, and Rh) and supports have been investigated as catalysts for the decomposition of gaseous NH3 [3,8]. While Ru shows excellent activity, its high cost and limited availability make Ni more attractive [8]. An alternative approach is the decomposition of NH3 in solution using electrocatalysts [3].
In the typical ammonia-powered fuel cell, H2 produced from gaseous NH3 decomposition yields protons at the anode, thus releasing electrons into the external load circuit. The protons diffuse across a membrane to the cathode, where they react with O2 (typically from air) to form H2O vapor, and the electron circuit is completed. In ceramic fuel cells, temperatures can exceed 1000 K due to H2 oxidation exothermicity. At this level, the kinetics of the endothermic NH3 decomposition are sufficiently fast that NH3 can directly feed the fuel cell [9]. However, the risk of NOx formation still exists. Therefore, care is needed for NH3 decomposition catalyst and fuel cell designs to avoid these temperatures.
In this paper, a simple kinetic engineering model is developed for NH3 decomposition over a Ni-BaZrO3 catalyst. This model is calibrated over a relevant temperature range using reaction rates obtained from a detailed published elementary reaction mechanism [9]. The performance of this model is then compared to that of the detailed mechanism in simulations of packed bed (plug flow PBR) ideal adiabatic reactors. The utility of the engineering model is further demonstrated with simulations of PBRs with heat transfer and H2 diffusion. This simple model is intended to facilitate quick engineering calculations and screening studies for fuel cell design.
It should be noted that the purpose of this paper is the demonstration of a calculation methodology assuming the availability of a proven, detailed reaction mechanism. Catalyst choice, design, and effectiveness are beyond the scope of this work.
2. Equilibrium
Ammonia decomposition [] is endothermic ( = 45,900 J) and becomes thermodynamically favorable above approximately 450 K (at 1 × 10⁵ Pa). Figure 1 shows the equilibrium conversion over a wide temperature range at 1 × 10⁵ Pa pressure for pure NH3 feed, with complete conversion above 650 K. The calculation uses an online equilibrium calculator [10], with results consistent with published species thermodynamic properties [11]. The temperature range of this study is 650–950 K at 1 × 10⁵ Pa pressure. Therefore, the decomposition is not thermodynamically limited under the conditions of this study.
3. Kinetics and Mechanism
A common mechanism in the literature [9] for NH3 decomposition on a Ni-based catalyst consists of the following six elementary reversible steps:
where S represents an unoccupied catalytic site, and is an adsorbed species. Zhu et al. [9] validated this mechanism for a Ni-BaZrO3 catalyst over ~650–950 K range at 1 × 10⁵ Pa pressure using experimental data from Okura et al. [8]. The kinetic parameters are presented there for both the forward and reverse steps. This eliminates the need for any estimates of thermodynamics for surface-adsorbed species that would be needed if kinetic parameters were provided for only the forward steps.
The entire mechanism is “thermodynamically consistent”. This means that accurate (thermodynamically) reaction equilibrium gas compositions (NH3, N2, and H2) are achieved if a time-dependent (kinetic) ammonia decomposition PBR flow reactor simulation is carried out for a sufficiently long time. These kinetic parameters are used in this study as described below. This was demonstrated by Karakaya et al. [12] with an elementary catalytic mechanism for methane oxidative coupling.
A two-pronged strategy is used in the current study. In the first portion, simulations of catalyzed NH3 decomposition are performed using continuously stirred tank reactor (CSTR, perfectly mixed) calculations together with the detailed mechanism shown above. These provide rates of NH3 decomposition as functions of NH3, H2, and N2 partial pressures. These rates are then used to calibrate a proposed single overall kinetic expression for NH3 decomposition derived from a fast pseudo-equilibrium analysis applied to the detailed six-step mechanism shown above. In the second portion, the calibrated single kinetic rate expression is used in simple packed bed reactor (PBR, perfect plug flow) simulations to demonstrate its utility in engineering and screening calculations.
4. Simplified Overall Rate Expression
The six-step, detailed elementary reaction mechanism described above is authoritative for kinetic reactor simulations. However, such simulations require a computation package such as Detchem® [13]. It is often desirable to reduce such mechanisms to a simple kinetic rate expression for relatively quick engineering calculations. Such a reduction is applied here using the fast pseudo-equilibrium approach based on the Langmuir–Hinshelwood algorithm [14].
4.1. Derivation by Langmuir–Hinshelwood Algorithm
The algorithm applied to the six-step mechanism begins with choosing a rate-determining (slow) step. The slow step is taken as effectively irreversible. The remaining steps are assumed to be in fast pseudo-equilibrium (FPE). Consider Step 5 to be the slow step, as recommended by Bell and Torrente-Murciano [15] for a Ni-based NH3 decomposition catalyst:
where is the surface concentration of the adsorbed species j, and CS is the concentration of vacant sites. Step 4 can be used to estimate by applying the FPE:
where . The FPE claims , which implies:
Similarly, steps 3, 2, 1, and 6 are used in succession to derive , , , and , respectively. Substitution as needed produces a preliminary rate expression:
The CS derives from the “site balance”: . Bell and Torrente-Murciano [15] suggest that adsorbed N atoms are the dominant adsorbed species. Therefore, the site balance simplifies to: , from which:
Substituting Equation (5) into (4) reveals the overall rate expression, assuming desorption and recombination of N atoms (Step 5) is rate-determining:
where k and are lumped constants: and . For the remaining discussion below, the parameter replaces .
4.2. Preparation for Calibration of Overall Rate Expression
The CSTR calculation offers a simple way to generate rate data. The ideal CSTR model assumes perfect mixing, with the rate obtained from the steady CSTR species balance. For the NH3 decomposition:
In this study, the species net rates are related by the stoichiometry: .
Using a familiar nomenclature (Fogler, 2020), the species partial pressures are given by:
where and . For the above overall stoichiometry, . The stoichiometric coefficients are: , , .
The lumped parameters in the simplified rate expression (Equation (6)) will be calibrated using rate data obtained from Detchem® CSTR® simulations run with the detailed NH3 decomposition mechanism [8] shown above. Available online [13] with numerous applications, the Detchem® software package is widely used [16,17] and quite versatile. This package executes detailed material, energy, and momentum balances using a user-supplied elementary reaction mechanism and required reactor input and parameter information.
Since the detailed mechanism is validated on experimental data [8], using the simulated rate data here obtained with this mechanism is equivalent to calibrating against experimental data directly. Because the Zhu et al. [8] detailed mechanism does such an excellent job modeling the XNH3 vs. temperature data of Okura et al. [8], calculations with it can be used as the “data” source against which the overall rate expression (Equation (6)) is calibrated. The same catalyst, temperature, and pressure range as Okura et al. [8] are used.
In this study, separate packed bed (plug flow) and continuous stirred tank (perfectly mixed) reactor simulations were performed with Detchem® PBED® and CSTR® applications, respectively. The governing PBED® and CSTR® equations are described in the Detchem® manual [13] and listed elsewhere [18].
At a given temperature and pressure, the Detchem® CSTR® application is run over a wide range of pure NH3 feed rates FNH3,o to generate gaseous reactor effluent mole fractions, yj. Any pressure drop across the reactor is assumed to be small enough to ignore. The exit mole fractions are used to calculate the corresponding partial pressures, Pj. Knowing Pj, Equation (9) is used to determine the corresponding NH3 conversion, XNH3:
Similarly, PH2 and PN2 are used to test for XNH3 consistency:
With XNH3 data in hand, Equation (7) is used to generate rate data. At the given temperature, the partial pressure, conversion, and rate data sets, based on exit mole fraction data from the Detchem® CSTR® runs and Equations (7), (10), and (11), are used below to calibrate the overall rate expression (Equation (6)) through the lumped constants k and .
5. Calibration of the Simplified Overall Rate Expression
An extensive series of Detchem® CSTR® simulations with a pure NH3 feed over a wide temperature range was performed. Details appear in Table 1. The runs were isothermal at constant pressure. The feed rate range for each temperature was chosen such that the XNH3 ranged from near zero to almost 1. The gas volume and catalytic surface area values listed are consistent with the PBED® simulations described later.
For a given temperature and pure NH3 feed, all data sets were used to calibrate the Equation (6) overall rate expression through the constants k and . It should be noted that the Langmuir–Hinshelwood algorithm was used to derive different overall rate expressions, such as Equation (6), each based on a different assumed slow step. All expressions were subjected to testing with the generated data sets. These results are not shown here because the only statistically acceptable rate form was Equation (6), which is based on an assumed slow step of N adatom recombination, which is consistent with Bell and Torrente-Murciano [15].
5.1. Calibration Results
The generated data sets show that, for all relevant temperatures, the rates decrease with increasing NH3 conversion. Sample results are shown in Figure 2 (650 K) and Figure 3 (950 K). The simple overall rate expression (Equation (6)) does an excellent job for all pure NH3 feed cases. It is satisfying that the overall rate expression shows the inflections in the curves at higher XNH3s.
With excellent modeling obtained at all five temperatures for the pure NH3 feed, the rate parameters k and as functions of temperature are presented in Figure 4. The non-Arrhenius curves are each regressed to the form:
The values of a, b, and c are presented in Table 2. This form is for the sake of convenience. The modest non-linearities in Figure 4 do not necessarily mean a change in rate-determining step over the temperature range. Both parameters k and are lumped, consisting of multiple single constants, each with its own temperature dependence. For example, reflects both dissociative adsorptions and an associative desorption, which would have contrary temperature dependencies.
Figure 2 and Figure 3 present additional curves, based on the calibrated Equation (6), and data points, based on Detchem® CSTR® simulations, wherein 25% of the NH3 feed is replaced with H2 or N2 at the same total feed rate. The H2 cases result in lower NH3 decomposition rates, as suggested by Equation (6). The impact is more pronounced at lower temperatures. The impact of adding N2 in this role is less clear. Equation (6) suggests little impact beyond a dilution effect on H2 and NH3 partial pressures. In both of these tests, the overall simplified rate expression (Equation (6)) calibrated on pure NH3 feed runs did well in predicting the detailed mechanism-based rate results.
6. PBR Species and Energy Balances Used with Overall Rate Expression
The overall calibrated rate expression is now used to simulate NH3 decomposition in the packed bed reactor found in an idealized ammonia fuel cell. The species balances used are shown in Equations (13) and (14). The PBR assumes perfect plug flow.
Zhu et al. [9] show that the NH3 decomposition can occur within the anode structure of the fuel cell or in the catalytic zone outside the fuel cell itself. If inside, the “diffusion” term on the right side of Equation (14) crudely approximates the passage of H2 through the fuel cell membrane to the cathode, where it is oxidized. If outside, then kc = 0. The PBR energy balance is:
If the PBR is assumed adiabatic, then . If heat from the cathodic oxidation of H2 conducts through the fuel cell membrane to the anode to satisfy some of the NH3 decomposition endothermicity, the heat transfer rate can be crudely approximated by:
The thermal data (cp,j and are presented in the Appendix A. Constant pressure and ideal gas are assumed throughout this study. Equations (17) provide additional values:
6.1. Packed Bed Reactor Simulations
We begin with packed bed calculations performed using the Detchem® PBED® package. Table 3 presents the data for the simulations. Both high and low pure NH3 feed rates were used, together with a range of feed temperatures. These runs produce the data against which the single rate expression engineering model will be tested.
The engineering model (Equations (13)–(17)) uses the overall single rate expression (Equation (6)) together with the temperature-fitted rate constants in Equation (12). The Polymath® ODE package [19] solved the engineering model for the packed bed reactor.
Figure 5 and Figure 6 present the comparative results. Results in Figure 5 for a pure NH3 feed (1 × 10⁻⁵ mole/s) at 800 K show that the engineering model does an excellent job predicting the detailed mechanism axial profiles for both NH3 content and reactor temperature. Similar excellent results are shown in Figure 6 over a range of feed temperatures at a higher feed rate (1 × 10⁻⁴ mol/s). The fits of the NH3 mole fractions are excellent, while the temperatures are predicted within 3 K. With the credibility of the engineering model with single overall rate expression now established, this model was applied for varied applications for which Detchem® PBED® is not applicable.

Table 3.
Data for Detchem® PBED® and Engineering Model PBR Simulations.
| Bed radius: 5 × 10⁻³ m | Bed length: 0.1 m |
| Catalyst area/bed volume: 2.19 × 10⁵ m−1 | Total catalyst area: 0.172 m2 |
| Bed porosity: 0.38 | Particle diameter: 2 × 10⁻⁵ m |
| Feed: pure NH3 | Total feed rates: 1 × 10⁻⁵, 1 × 10⁻⁴ mole/s |
| Pressure: 1 × 10⁵ Pa (constant) | Feed temperature range: 650–950 K |
| Diffusion coefficient kc (Equation (5)): 5 × 10⁻⁷ mol/s-m-Pa | (used for Figure 7, Figure 8, Figure 9 and Figure 10 only) |
| Heat transfer factor f (Equation (7)): 0.12 | (used for Figure 7, Figure 8, Figure 9 and Figure 10 only) |
6.2. Extended PBR Simulations
The simulations for Figure 5 and Figure 6 assume the NH3 decomposition occurs in an adiabatic packed bed reactor external to any fuel cell. However, this decomposition can occur as part of the anode structure of the fuel cell [9]. In this case, H2 diffusion through the membrane for exothermic oxidation at the cathode accompanies the NH3 breakdown. In addition, heat transfer from the cathode across the membrane to the anode can supply some of the decomposition endothermicity. Additional PBR calculations were performed to crudely simulate these cases with only the engineering model (Equations (13)–(17)) and simplified rate expression (Equations (6) and (12)). The Polymath® ODE solver [19] was used.
Figure 7, Figure 8, Figure 9 and Figure 10 show a sequence of additional cases that are easily obtained with the engineering model and overall rate expression, with details provided in Table 3. The three cases shown are H2 diffusion off (kc = 0) and adiabatic (f = 0), diffusion on (kc = 5 × 10⁻⁷ mol/s-m-Pa) and adiabatic, and diffusion on with heat transfer on (f = 0.12). The models of H2 diffusion and heat transfer are crude, but they illustrate the utility of the engineering model with the overall rate expression.
![Molecules 28 06006 g007]()
Figure 7.
Impact of H2 diffusion and heat transfer on axial temperature in PBR; 950 K feed temperature; pure NH3 feed = 1 × 10⁻⁴ mol/s (see Table 3 for remaining conditions). Calculations based on engineering model with overall decomposition rate expression Equations (6) and (12).
Figure 7.
Impact of H2 diffusion and heat transfer on axial temperature in PBR; 950 K feed temperature; pure NH3 feed = 1 × 10⁻⁴ mol/s (see Table 3 for remaining conditions). Calculations based on engineering model with overall decomposition rate expression Equations (6) and (12).

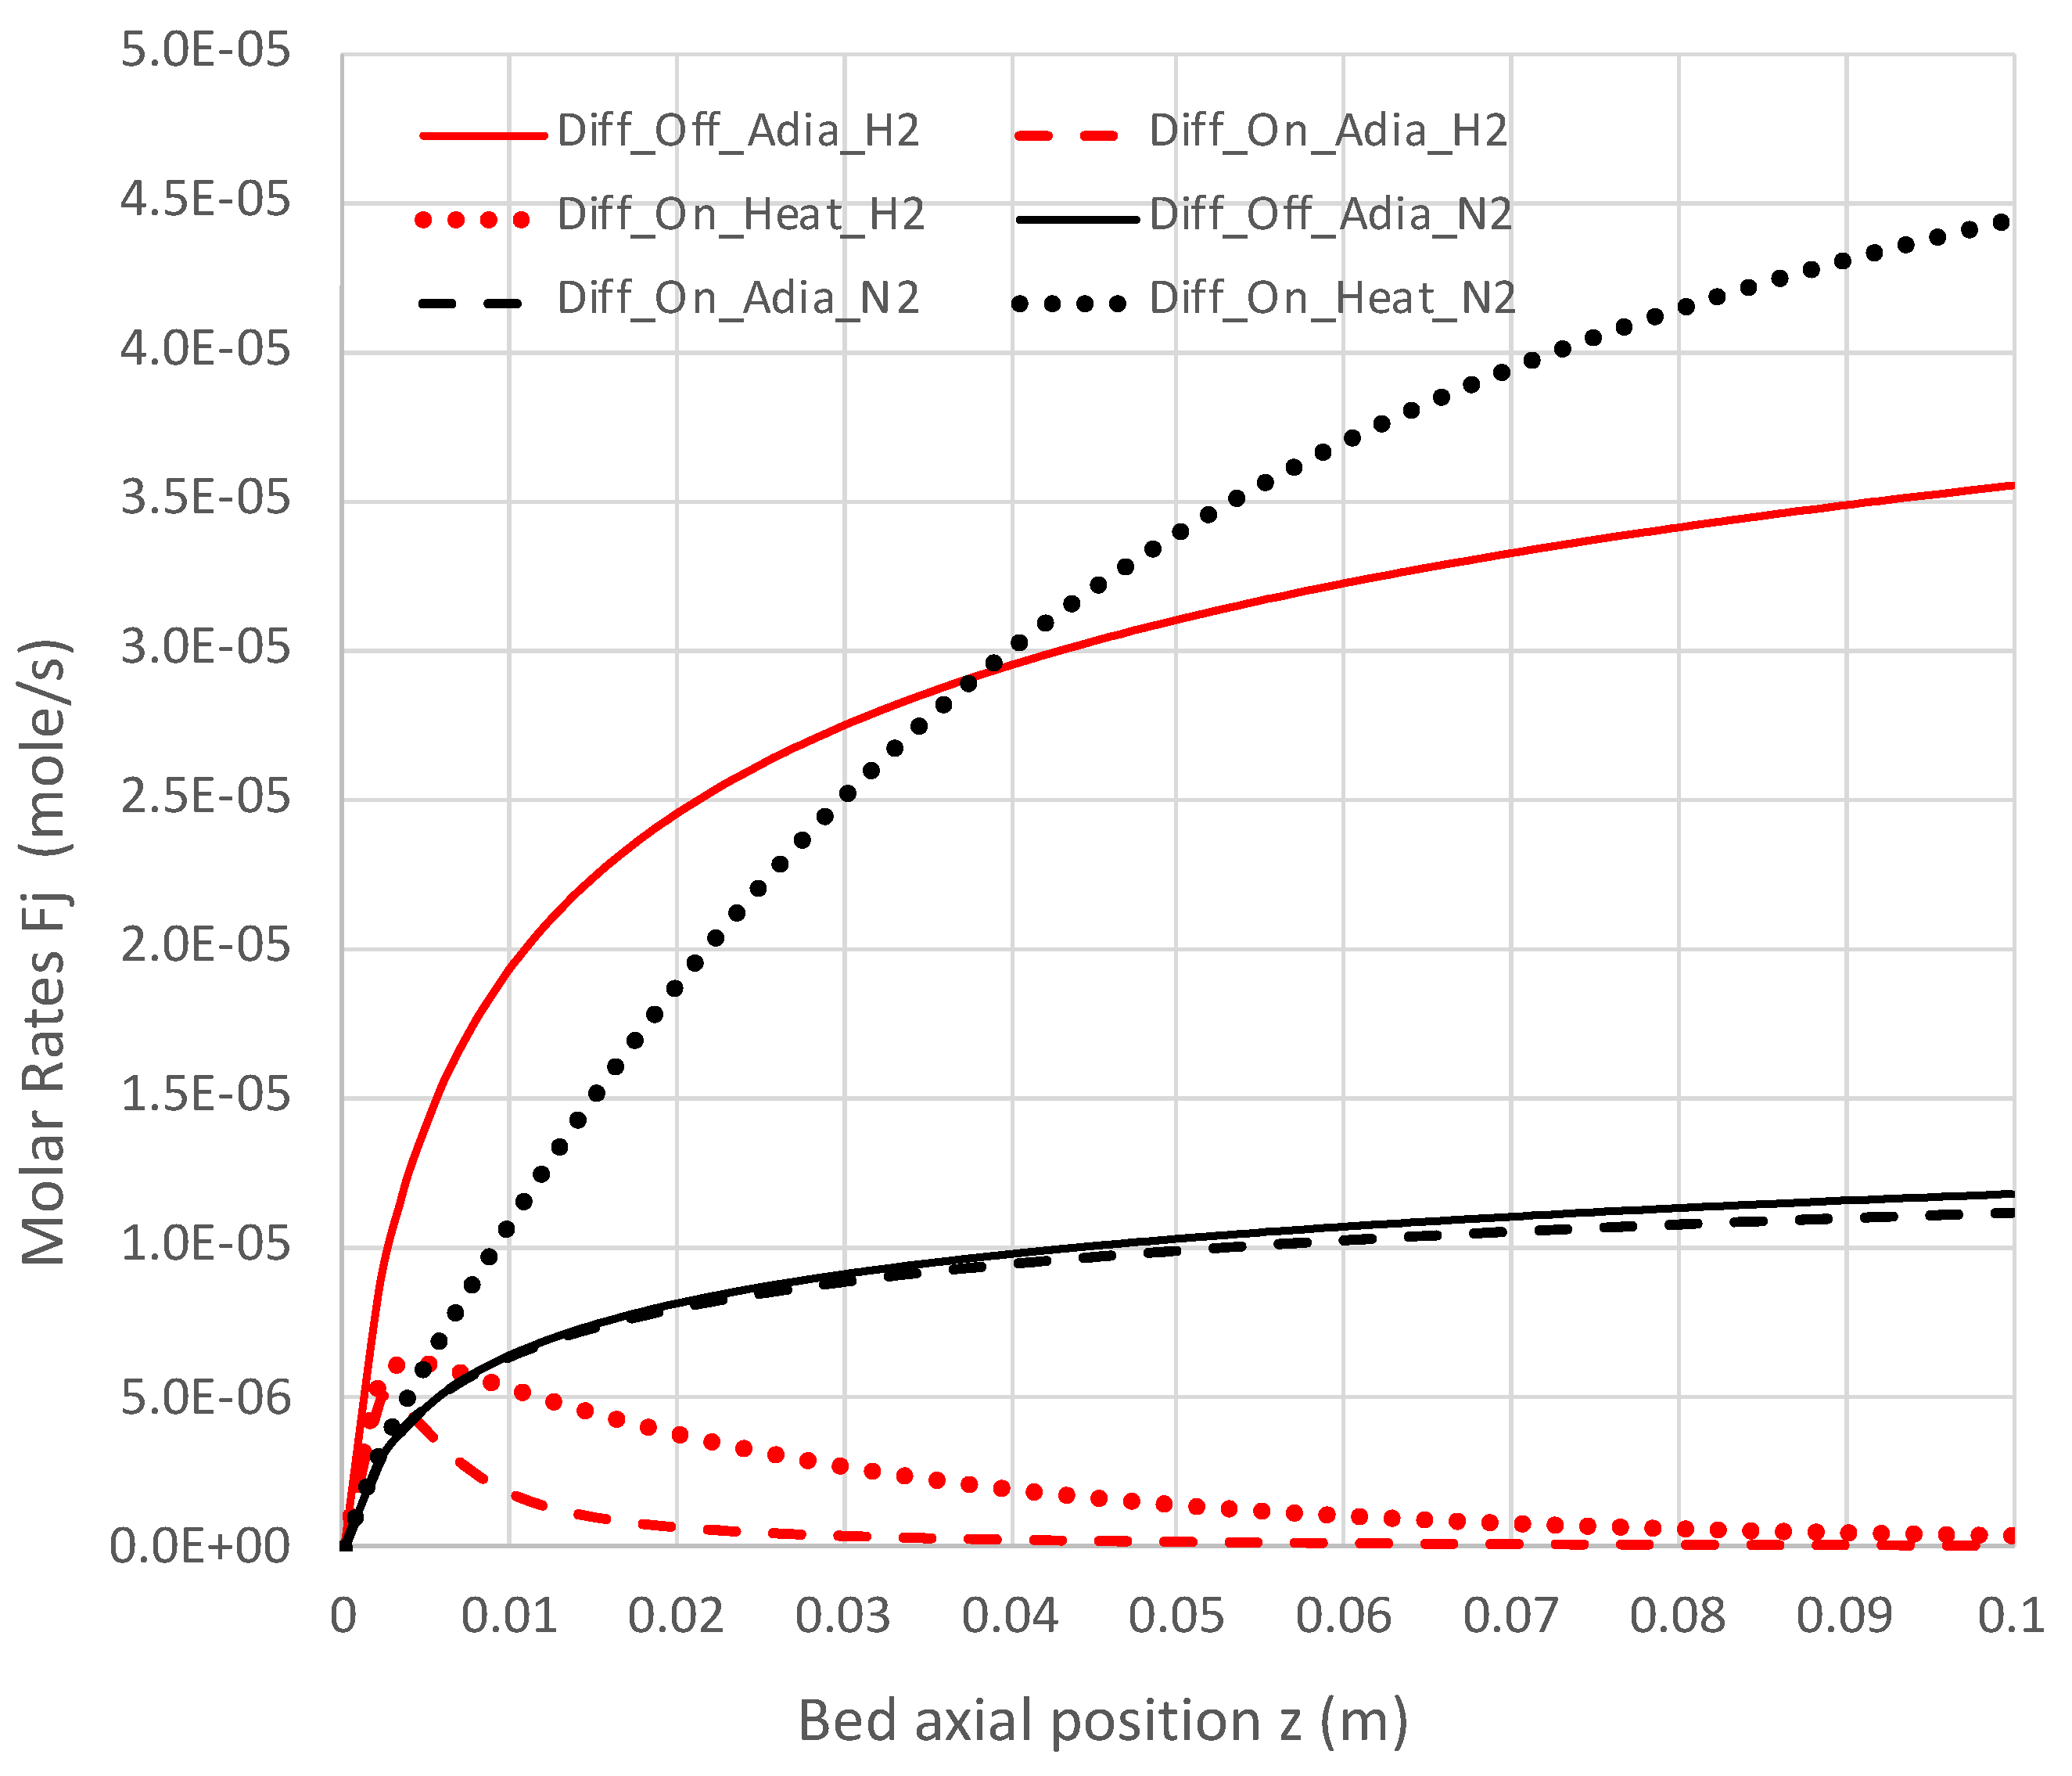
Under adiabatic conditions, the temperature drops rapidly due to the endothermicity of the NH3 pyrolysis, as shown in Figure 7. This is accompanied by only modest conversion (Figure 8). Loss of H2 by diffusion has little impact on the bulk flow temperature, even though the drop in H2 flow rate is large, as shown in Figure 10. Figure 9 shows that the NH3 flow rate has not dropped much, as is also evident in Figure 8, with only an approximately 23% conversion.
Allowing heat to flow into the packed bed has a significant impact. The slower temperature drop (Figure 7) results in a significantly smaller NH3 rate (Figure 9) and hence a larger NH3 conversion (Figure 8). Even more H2 is available for diffusion (Figure 10). The N2 flow rate also increases due to the higher NH3 conversion.
Figure 8.
Impact of H2 diffusion and heat transfer on NH3 conversion in PBR; 950 K feed temperature; pure NH3 feed = 1 × 10⁻⁴ mol/s (see Table 3 for remaining conditions). Calculations are based on engineering model with overall decomposition rate expression (Equations (6) and (12)).
Figure 8.
Impact of H2 diffusion and heat transfer on NH3 conversion in PBR; 950 K feed temperature; pure NH3 feed = 1 × 10⁻⁴ mol/s (see Table 3 for remaining conditions). Calculations are based on engineering model with overall decomposition rate expression (Equations (6) and (12)).

Figure 9.
Impact of H2 diffusion and heat transfer on axial NH3 flow rate in PBR; 950 K feed temperature; pure NH3 feed = 1 × 10⁻⁴ mol/s (see Table 3 for remaining conditions). Calculations use engineering model with single overall decomposition rate expression (Equations (6) and (12)).
Figure 9.
Impact of H2 diffusion and heat transfer on axial NH3 flow rate in PBR; 950 K feed temperature; pure NH3 feed = 1 × 10⁻⁴ mol/s (see Table 3 for remaining conditions). Calculations use engineering model with single overall decomposition rate expression (Equations (6) and (12)).
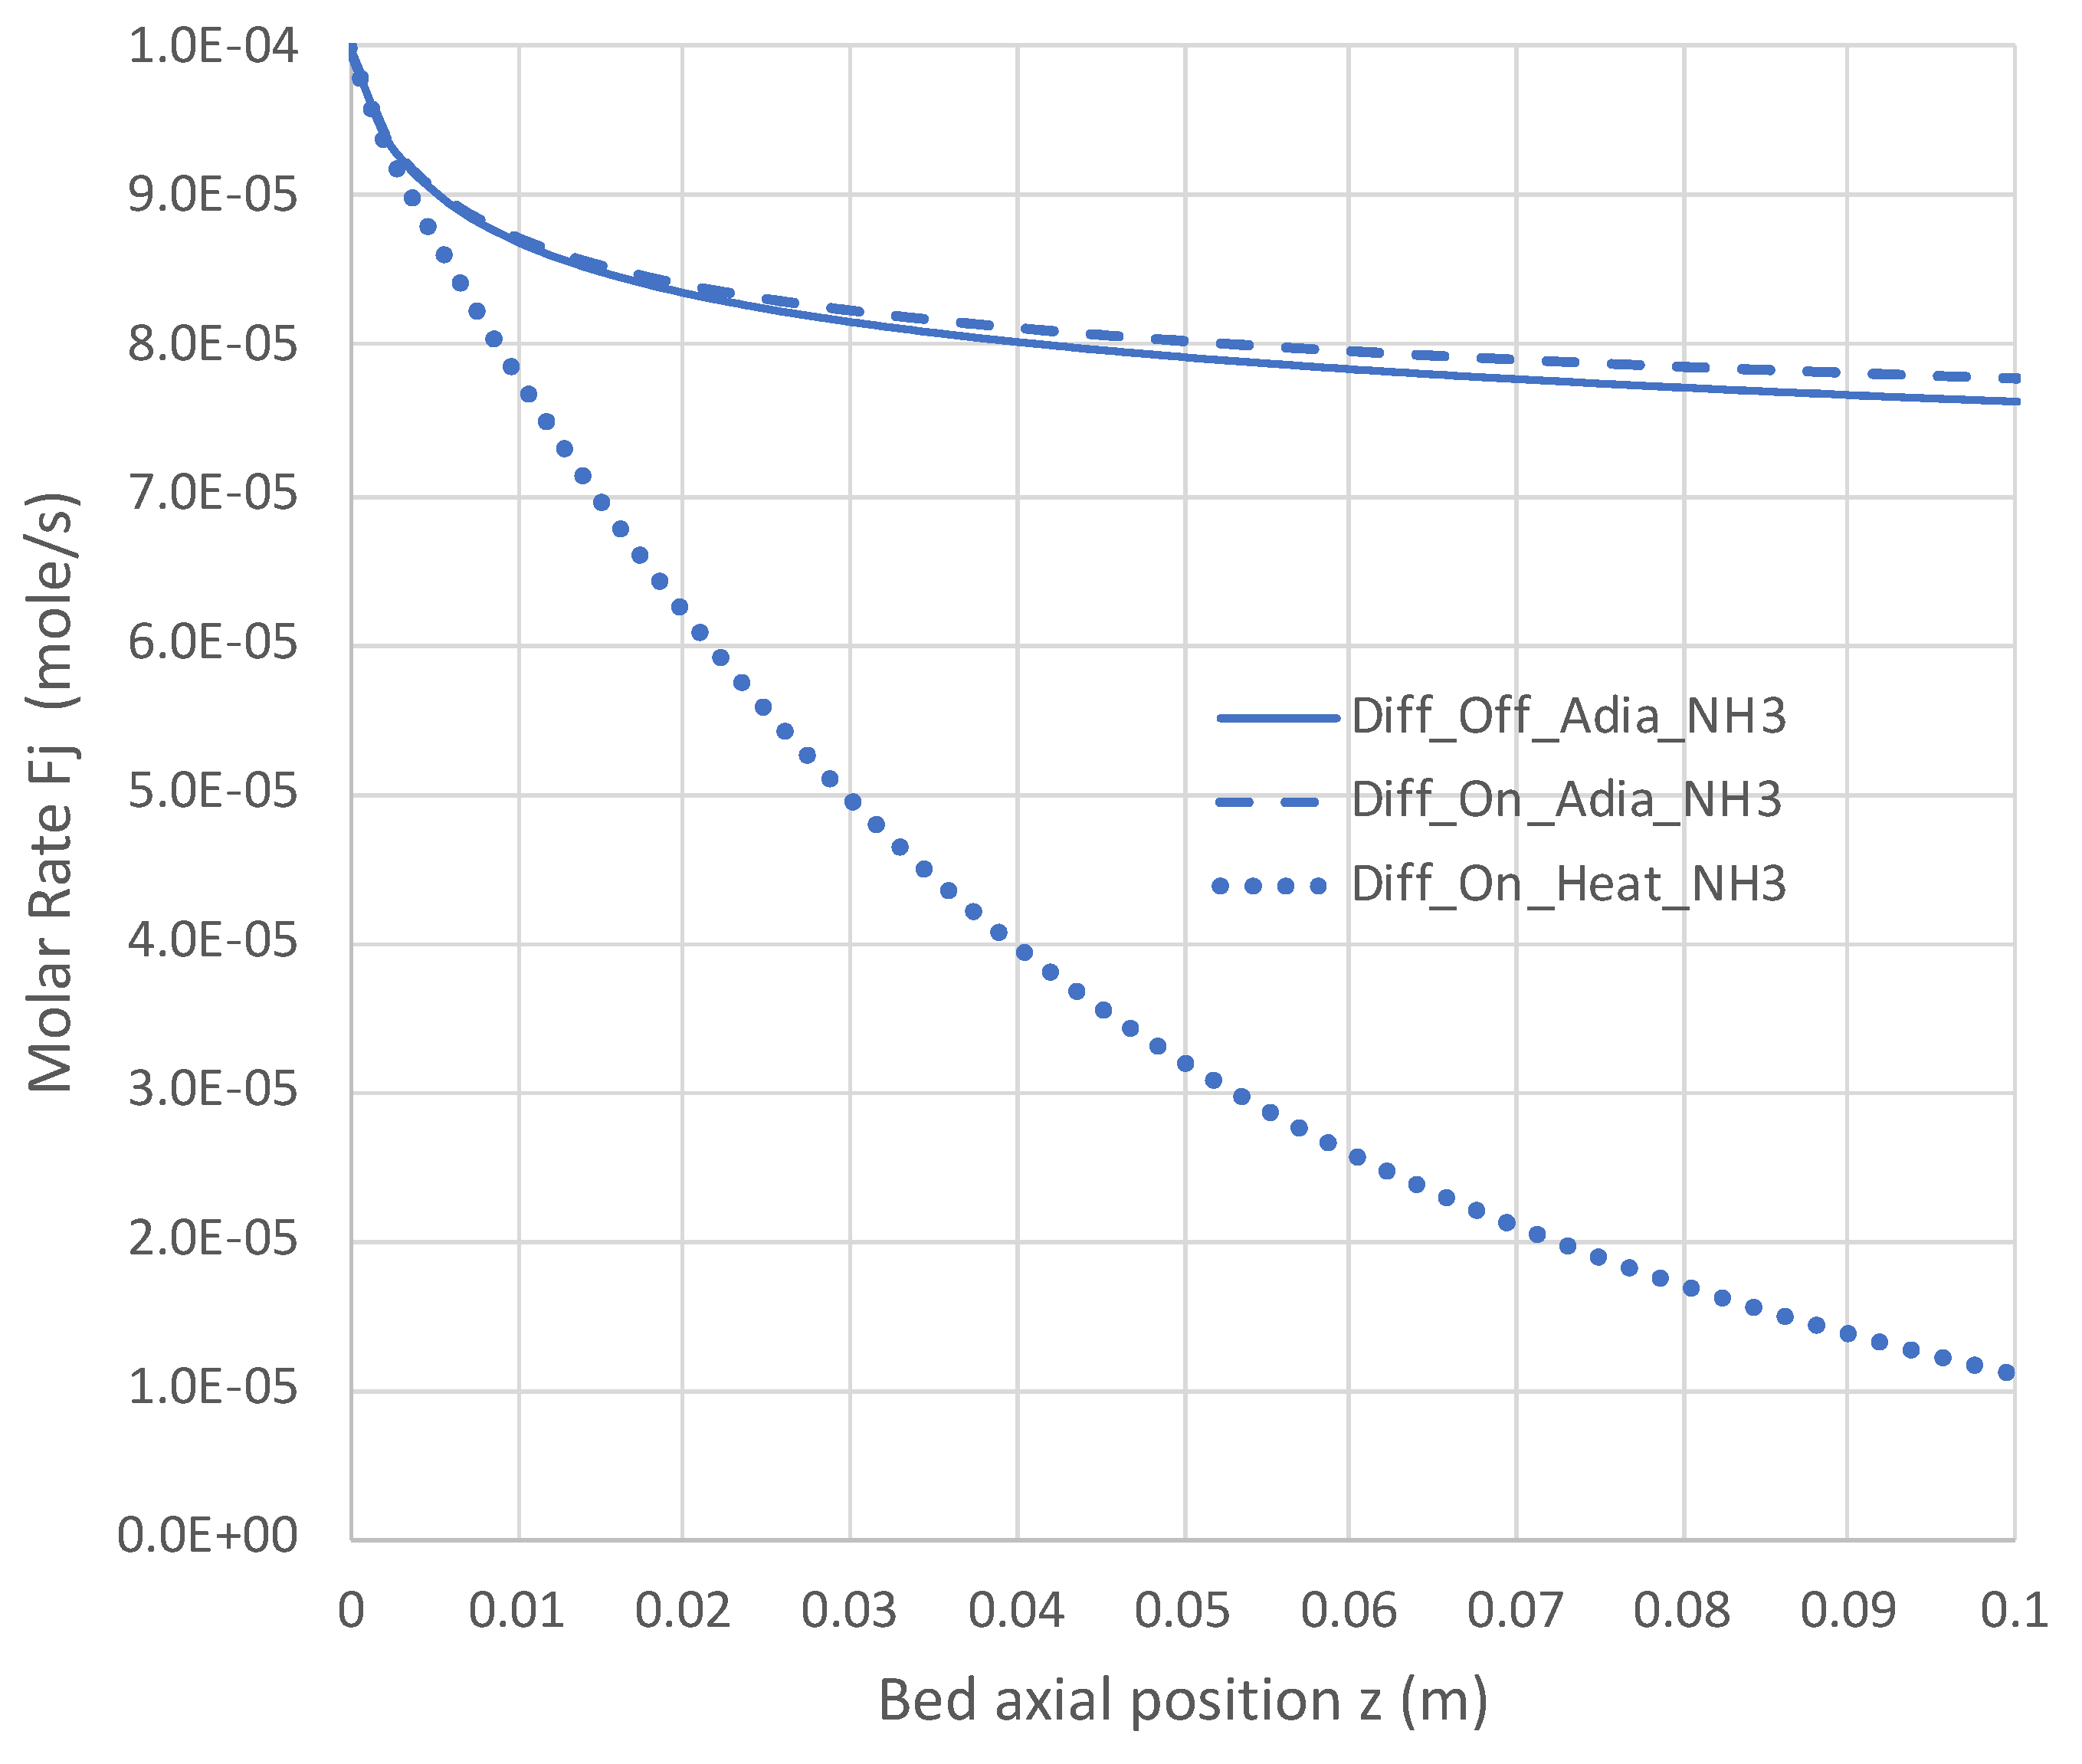
Figure 10.
Impact of H2 diffusion and heat transfer on axial N2 and H2 flow rates in PBR; 950 K feed temperature; pure NH3 feed = 1 × 10⁻⁴ mol/s (see Table 3 for remaining conditions). Calculations use engineering model with overall decomposition rate expression (Equations (6) and (12)).
Figure 10.
Impact of H2 diffusion and heat transfer on axial N2 and H2 flow rates in PBR; 950 K feed temperature; pure NH3 feed = 1 × 10⁻⁴ mol/s (see Table 3 for remaining conditions). Calculations use engineering model with overall decomposition rate expression (Equations (6) and (12)).
7. Conclusions
An overall rate expression, based on an assumed slow step (desorption of adsorbed N atoms to form N2) with five remaining elementary steps in fast pseudo-equilibria, has been derived to accurately simulate the decomposition of NH3 over a Ni-BaZrO3 catalyst at 1 × 10⁵ Pa at 650–950 K. The expression was calibrated using decomposition rates calculated with a six-step elementary mechanism from the literature proven independently against experimental data. The overall rate expression, with two temperature-dependent parameters, and its implementation in an engineering model successfully predicted NH3 decomposition performance in a packed bed reactor as calculated with the detailed mechanism. The utility of the engineering model with the overall rate expression was further demonstrated with simulations of NH3 decomposition in a packed bed reactor allowing for H2 diffusion and heat transfer in an approximation of a fuel cell anode feeding NH3. The methodology used in this work is independent of the choice of catalyst. It relies on the availability of a previously published and validated elementary reaction mechanism.
Author Contributions
The author accepts responsibility for the entire content of this manuscript. All authors have read and agreed to the published version of the manuscript.
Funding
This research received no external funding.
Institutional Review Board Statement
Not applicable.
Informed Consent Statement
Not applicable.
Data Availability Statement
Data is available from the author upon request.
Conflicts of Interest
The author declares no conflict of interest regarding this article.
Nomenclature
| a | first of three fitted parameters for lumped kinetic constants (Equation (12) |
| Ac | packed bed reactor cross section (m2) |
| ACSTR | catalytic surface area for CSTR (m2) |
| av | catalytic surface area/packed bed volume (m2/m3) |
| b | second of three fitted parameters for lumped kinetic constants (Equation (12) |
| c | last of three fitted parameters for lumped kinetic constants (Equation (12) |
| surface concentration of adsorbed species j (mol/m2) | |
| cp,j | heat capacity of species j (J/mol-K) |
| CS | concentration of vacant surface sites (mole/m2) |
| CT | total concentration of surface sites (mole/m2) |
| f | assumed fraction of H2 oxidation heat transferring from cathode to anode |
| , Fjo, FT | molar rate of species j (mol/s) - subscript “o” for feed, “T” for total |
| k | lumped constant (mol-Pa/s-m2) |
| lumped constants (Pa0.5) | |
| ki,-i | rate constants (forward/reverse) for reaction “i” in decomposition mechanism |
| Ki | equilibrium constant for reaction “i” in decomposition mechanism |
| kc | mass transfer coefficient for H2 diffusion across cell membrane (mol/s-m-Pa) |
| partial pressure of species j (Pa) - subscript “o” indicates feed | |
| local external heat transfer rate in packed bed reactor (J/s-m) | |
| catalytic surface-based reaction rate of species j (mol/s-m2) | |
| T | temperature (K) - subscript “o” indicates feed |
| fractional conversion of NH3 | |
| yj | gaseous species j mole fraction |
| z | packed bed reactor axial length (m) |
| net change in moles per mole of key reactant (NH3) as per reaction stoichiometry | |
| heat of reaction (J/mol of j) | |
| product of feed mole fraction of key reactant and net change in moles by reaction | |
| ratio of feed flow rate of species j to feed rate of key reactant (NH3) | |
| stoichiometric coefficient (+/−) assuming key reactant coefficient (NH3) is unity |
Appendix A
Table A1.
Thermal Data.
| cp,j (J/mol-K) | |
| H2 | 29.66 |
| N2 | 31.42 |
| NH3 | 0.02815 T + 28.64 |
| (J/mol) | |
| NH3 = 0.5N2 + 1.5H2 | 45,900. (per mol NH3) at 298 K * |
| H2 + 0.5O2 = H2O | −241,830. (per mol H2O) |
* .
References
- Service, R.F. Ammonia—A renewable fuel made from sun, air, and water—Could power the globe without carbon. Science, 12 July 2018. Available online: https://www.science.org/content/article/ammonia-renewable-fuel-made-sun-air-and-water-could-power-globe-without-carbon (accessed on 1 March 2023).
- Cha, J.; Jo, Y.S.; Jeong, H.; Han, J.; Nam, S.W.; Song, K.H.; Yoon, C.W. Ammonia as an efficient COx-free hydrogen carrier: Fundamentals and feasibility analyses for fuel cell applications. Appl. Energy 2018, 224, 194–204. [Google Scholar] [CrossRef]
- Lucentini, I.; Garcia, X.; Vendrell, X.; Llorca, J. Review of the Decomposition of Ammonia to Generate Hydrogen. Ind. Eng. Chem. Res. 2021, 60, 18560–18611. [Google Scholar] [CrossRef]
- Appari, S.; Janardhanan, V.M.; Jayanti, S.; Maier, L.; Tischer, S.; Deutschmann, O. Micro-kinetic modeling of NH3 decomposition on Ni and its application to solid oxide fuel cells. Chem. Eng. Sci. 2011, 66, 5184–5191. [Google Scholar] [CrossRef]
- Afif, A.; Radenahmad, N.; Cheok, Q.; Shams, S.; Kim, J.H.; Azad, A.K. Ammonia-fed fuel cells: A comprehensive review. Renew. Sustain. Energy Rev. 2016, 60, 822–835. [Google Scholar] [CrossRef]
- Amogy. Amogy Presents World’s First Ammonia-Powered, Zero-Emission Semi Truck. 2023. Available online: https://amogy.co/amogy-presents-worlds-first-ammonia-powered-zero-emission-semi-truck/ (accessed on 1 March 2023).
- Stephens, B. Canadian Pacific’s hydrogen-powered locomotive makes first revenue run. Trains, 15 November 2022. [Google Scholar]
- Okura, K.; Miyazaki, K.; Muroyama, H.; Matsui, T.; Eguchi, K. Ammonia decomposition over Ni catalysts supported on perovskite-type oxides for the on-site generation of hydrogen. RSC Adv. 2018, 8, 32102–32110. [Google Scholar] [CrossRef] [PubMed]
- Zhu, H.; Karakaya, C.; Kee, R.J. Modeling ammonia-fueled co-flow dual-channel protonic-ceramic fuel cells. Int. J. Green Energy 2022, 19, 1568–1582. [Google Scholar] [CrossRef]
- NASA. Available online: https://www.grc.nasa.gov/www/CEAWeb/ceaHome.htm (accessed on 1 March 2023).
- NIST. Available online: https://webbook.nist.gov/chemistry/ (accessed on 1 March 2023).
- Karakaya, C.; Zhu, H.; Zohour, B.; Senkan, S. Detailed Reaction Mechanisms for the Oxidative Coupling of Methane over La2O3/CeO2 Nanofiber Fabric Catalysts. ChemCatChem 2017, 9, 4538–4551. [Google Scholar] [CrossRef]
- Deutschmann, O.; Tischer, S.; Correa, C.; Chatterjee, D.; Kleditzsch, S.; Janardhanan, V.M.; Mladenov, N.; Minh, H.D.; Karadeniz, H.; Hettel, M. DETCHEM Software Package, v. 2.5; DETCHEM: Karlsruhe, Germany, 2014; Available online: www.detchem.com (accessed on 11 January 2022).
- Fogler, H.S. Elements of Chemical Reaction Engineering, 6th ed.; Pearson: London, UK, 2020. [Google Scholar]
- Bell, T.E.; Torrente-Murciano, L. H2 Production via Ammonia Decomposition Using Non-Noble Metal Catalysts: A Review. Top. Cat. 2016, 59, 1438–1457. [Google Scholar] [CrossRef]
- Chacko, R.; Keller, K.; Tischer, S.; Shirsath, A.B.; Lott, P.; Angeli, S.; Deutschmann, O. Automating the Optimization of Catalytic Reaction Mechanism Parameters Using Basin-Hopping: A Proof of Concept. J. Phys. Chem. C 2023, 127, 7628–7639. [Google Scholar] [CrossRef]
- Lott, P.; Mokashi, M.; Muller, H.; Heitlinger, D.J.; Lichtenberg, S.; Shirsath, A.B.; Janzer, C.; Tischer, S.; Maier, L.; Deutschmann, O. Hydrogen Production and Carbon Capture by Gas-Phase Methane Pyrolysis: A Feasibility Study. ChemSusChem 2022, 16, e202300300. [Google Scholar]
- Rivera, S.; Molla, A.; Pera, P.; Landaverde, M.; Barat, R. Reactor engineering calculations with a detailed reaction mechanism for the oxidative coupling of methane. Int. J. Chem. React. Eng. 2020, 18, 20200138. [Google Scholar] [CrossRef]
- Polymath®. Available online: https://polymathplus.org/# (accessed on 1 March 2023).
Figure 1.
Equilibrium NH3 conversion for pure NH3 feed at 1 × 10⁵ Pa pressure. Calculation based on NASA CEA equilibrium code [10].
Figure 1.
Equilibrium NH3 conversion for pure NH3 feed at 1 × 10⁵ Pa pressure. Calculation based on NASA CEA equilibrium code [10].
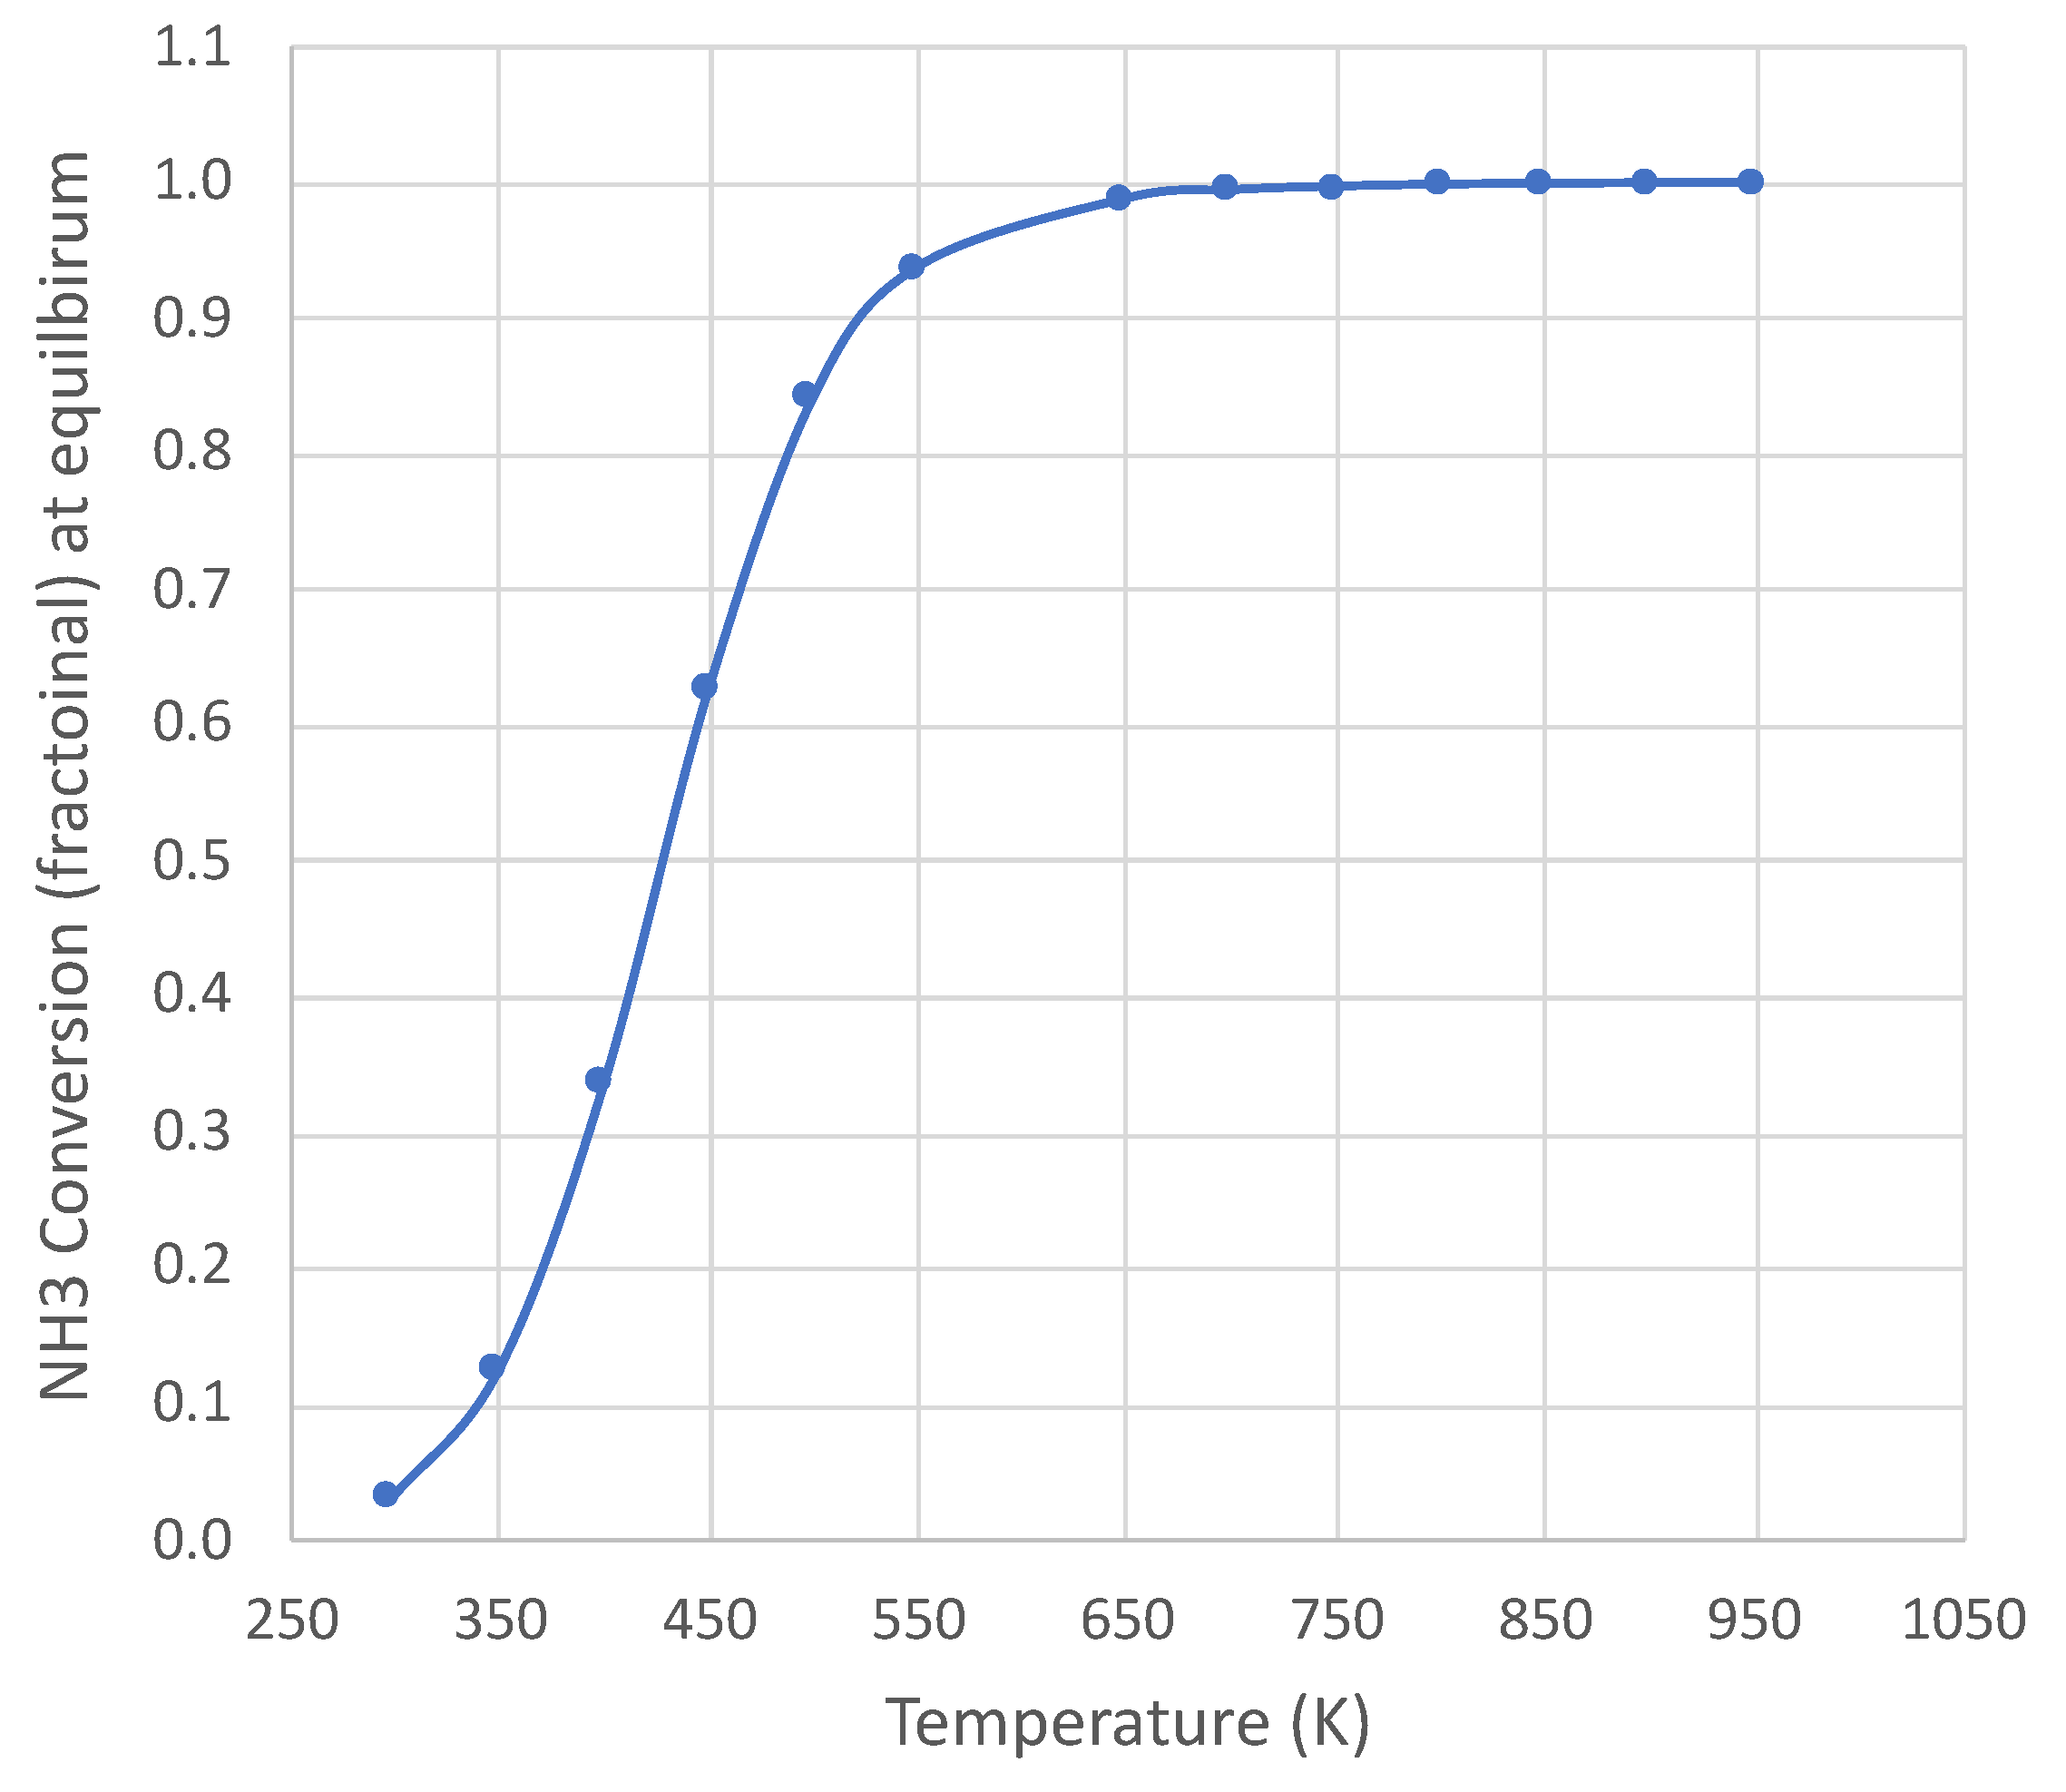
Figure 2.
Calculated (Detchem®, Equation (6) overall rate expression with 2 parameters) NH3 decomposition rates at 650 K for both pure NH3 and mixed (25 mole% H2 or N2, bal. NH3) feeds (see Table 1). N H3 conversion varies as a function of total feed rate.
Figure 2.
Calculated (Detchem®, Equation (6) overall rate expression with 2 parameters) NH3 decomposition rates at 650 K for both pure NH3 and mixed (25 mole% H2 or N2, bal. NH3) feeds (see Table 1). N H3 conversion varies as a function of total feed rate.

Figure 3.
Calculated (Detchem®, Equation (6) overall rate expression with 2 parameters) NH3 decomposition rates at 950 K for both pure NH3 and mixed (25 mole% H2 or N2, bal. NH3) feeds (see Table 1). NH3 conversion varies as a function of total feed rate.
Figure 3.
Calculated (Detchem®, Equation (6) overall rate expression with 2 parameters) NH3 decomposition rates at 950 K for both pure NH3 and mixed (25 mole% H2 or N2, bal. NH3) feeds (see Table 1). NH3 conversion varies as a function of total feed rate.

Figure 4.
Temperature dependencies (point values and regressions) of the two parameters of overall kinetic rate expression (Equation (6)). Units: k (mol-Pa/s-m2); khat = .
Figure 4.
Temperature dependencies (point values and regressions) of the two parameters of overall kinetic rate expression (Equation (6)). Units: k (mol-Pa/s-m2); khat = .
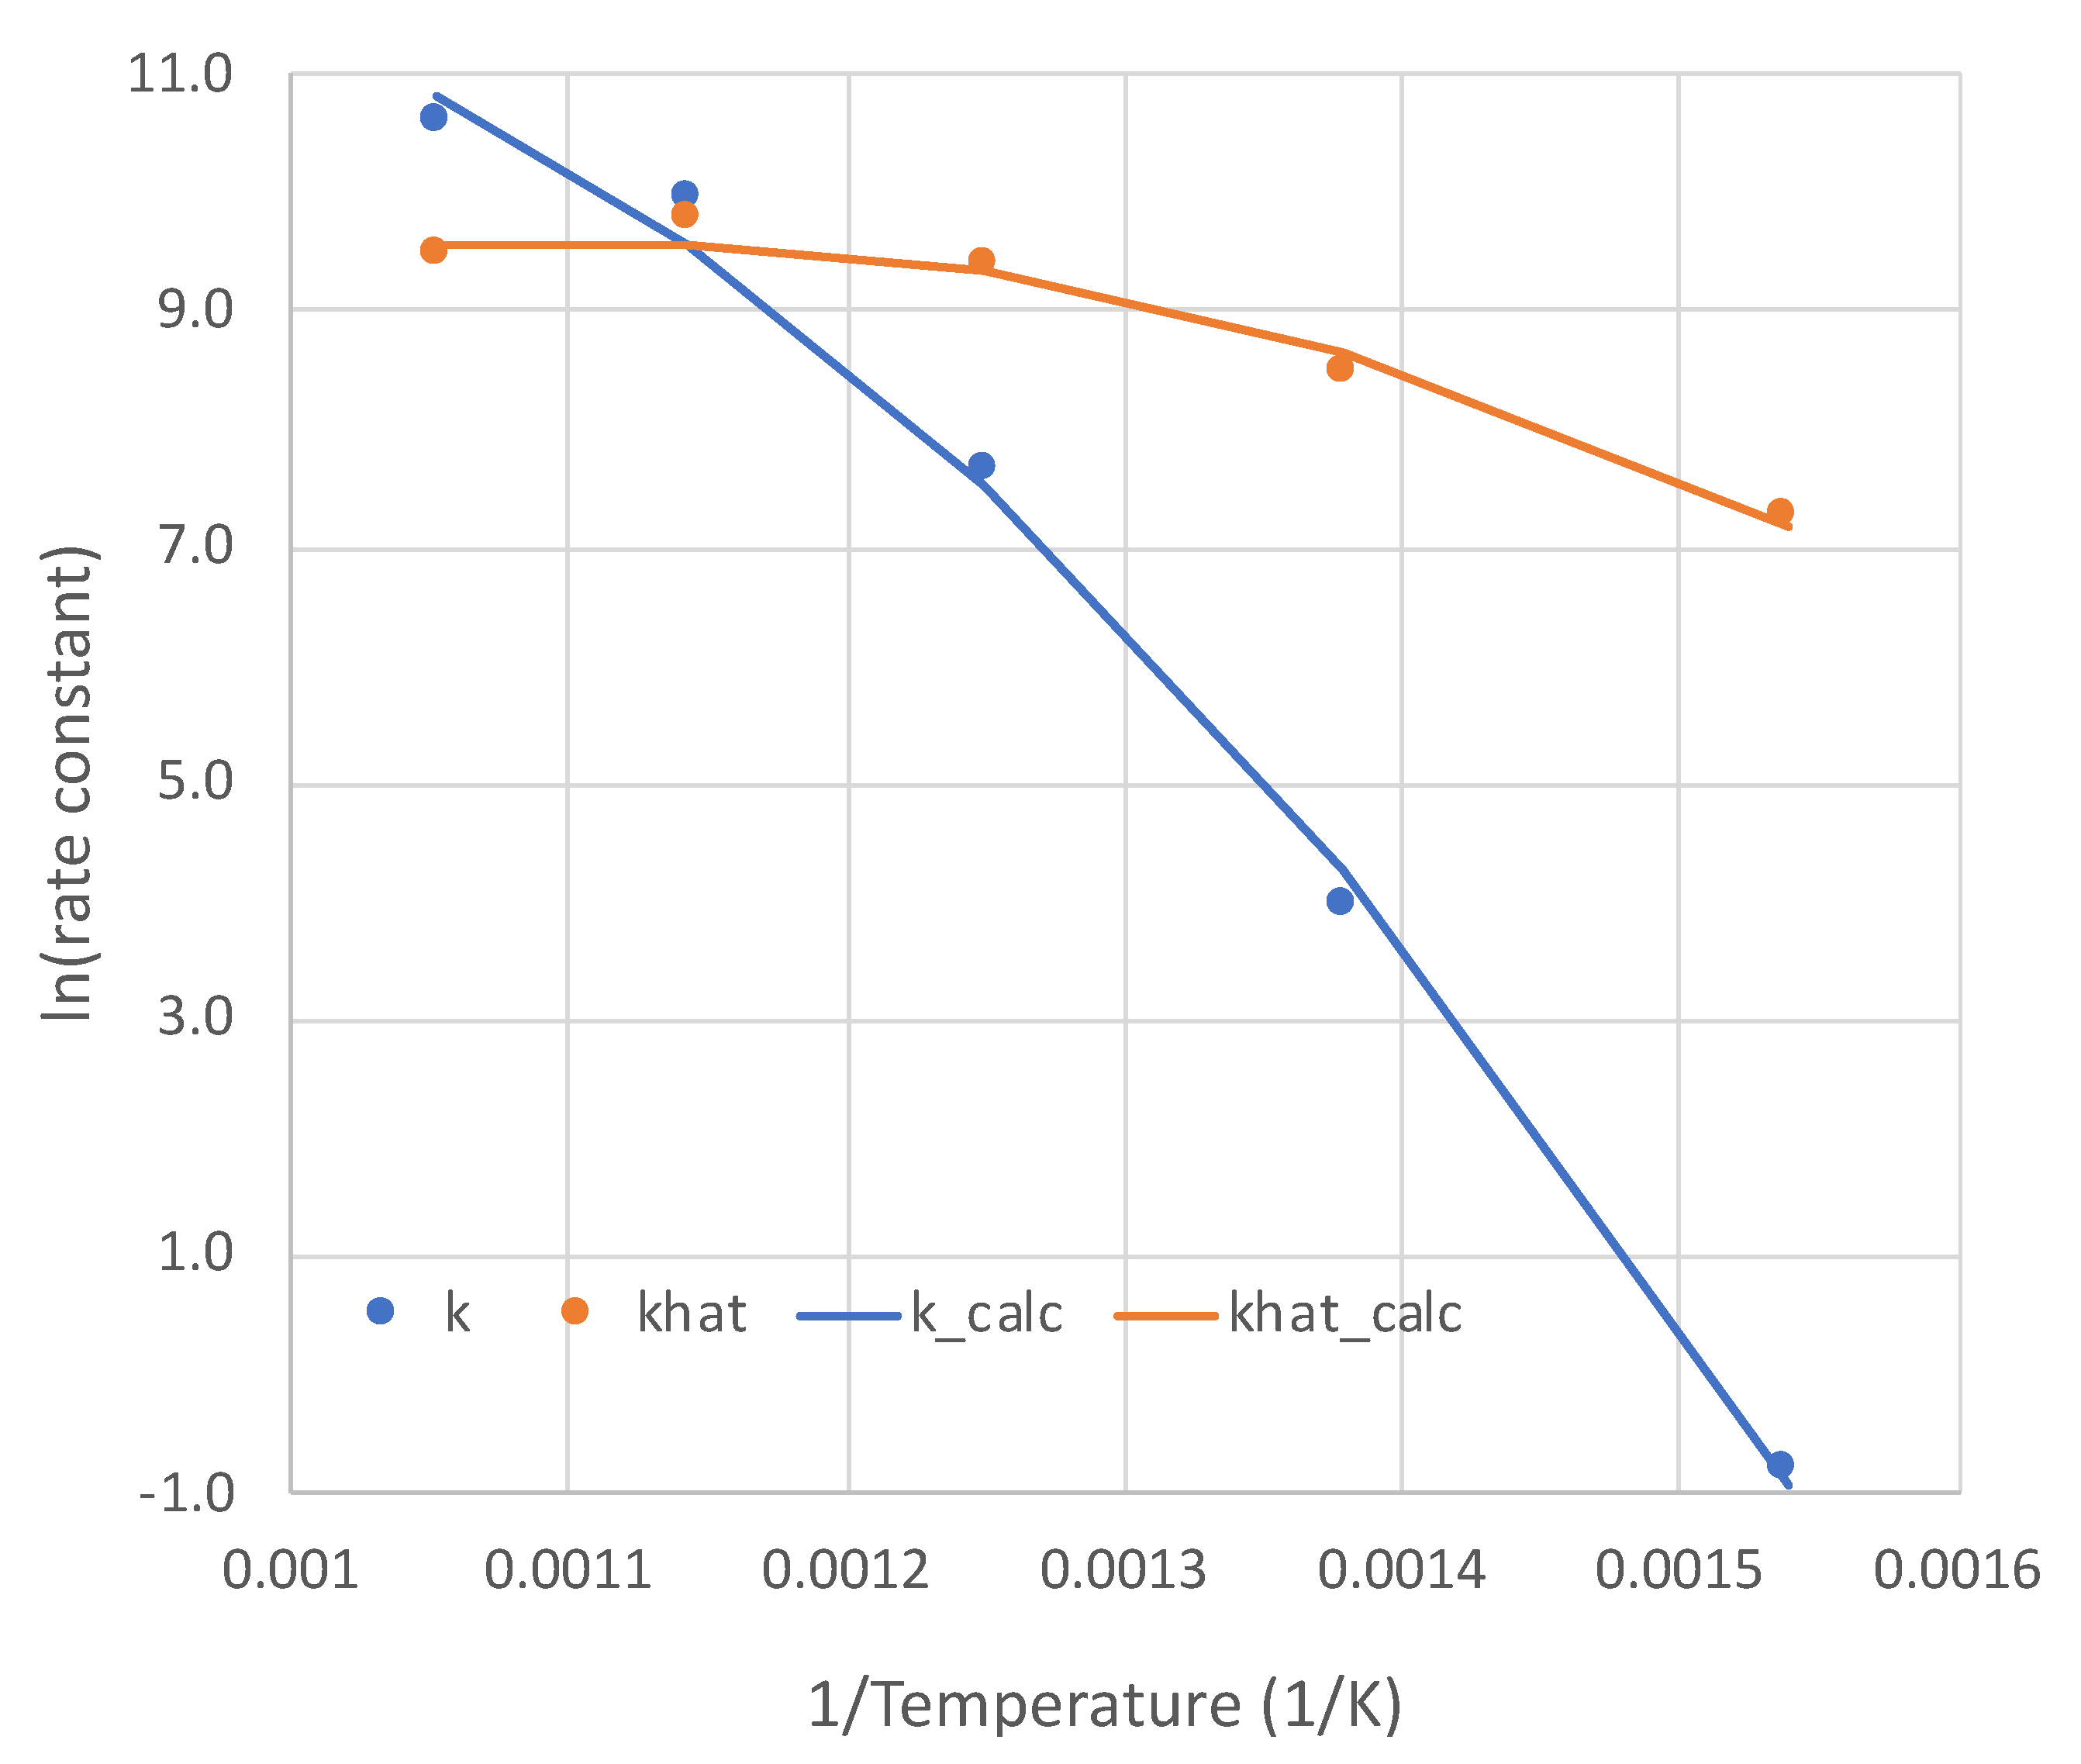
Figure 5.
Comparison of engineering model (EM) with overall kinetic rate expression (Equation (6)) vs. Detchem® with detailed mechanism for axial profiles in adiabatic packed bed reactor feeding pure NH3 at 1 × 10⁻⁵ mol/s and 800 K (see Table 3 for remaining conditions).
Figure 5.
Comparison of engineering model (EM) with overall kinetic rate expression (Equation (6)) vs. Detchem® with detailed mechanism for axial profiles in adiabatic packed bed reactor feeding pure NH3 at 1 × 10⁻⁵ mol/s and 800 K (see Table 3 for remaining conditions).
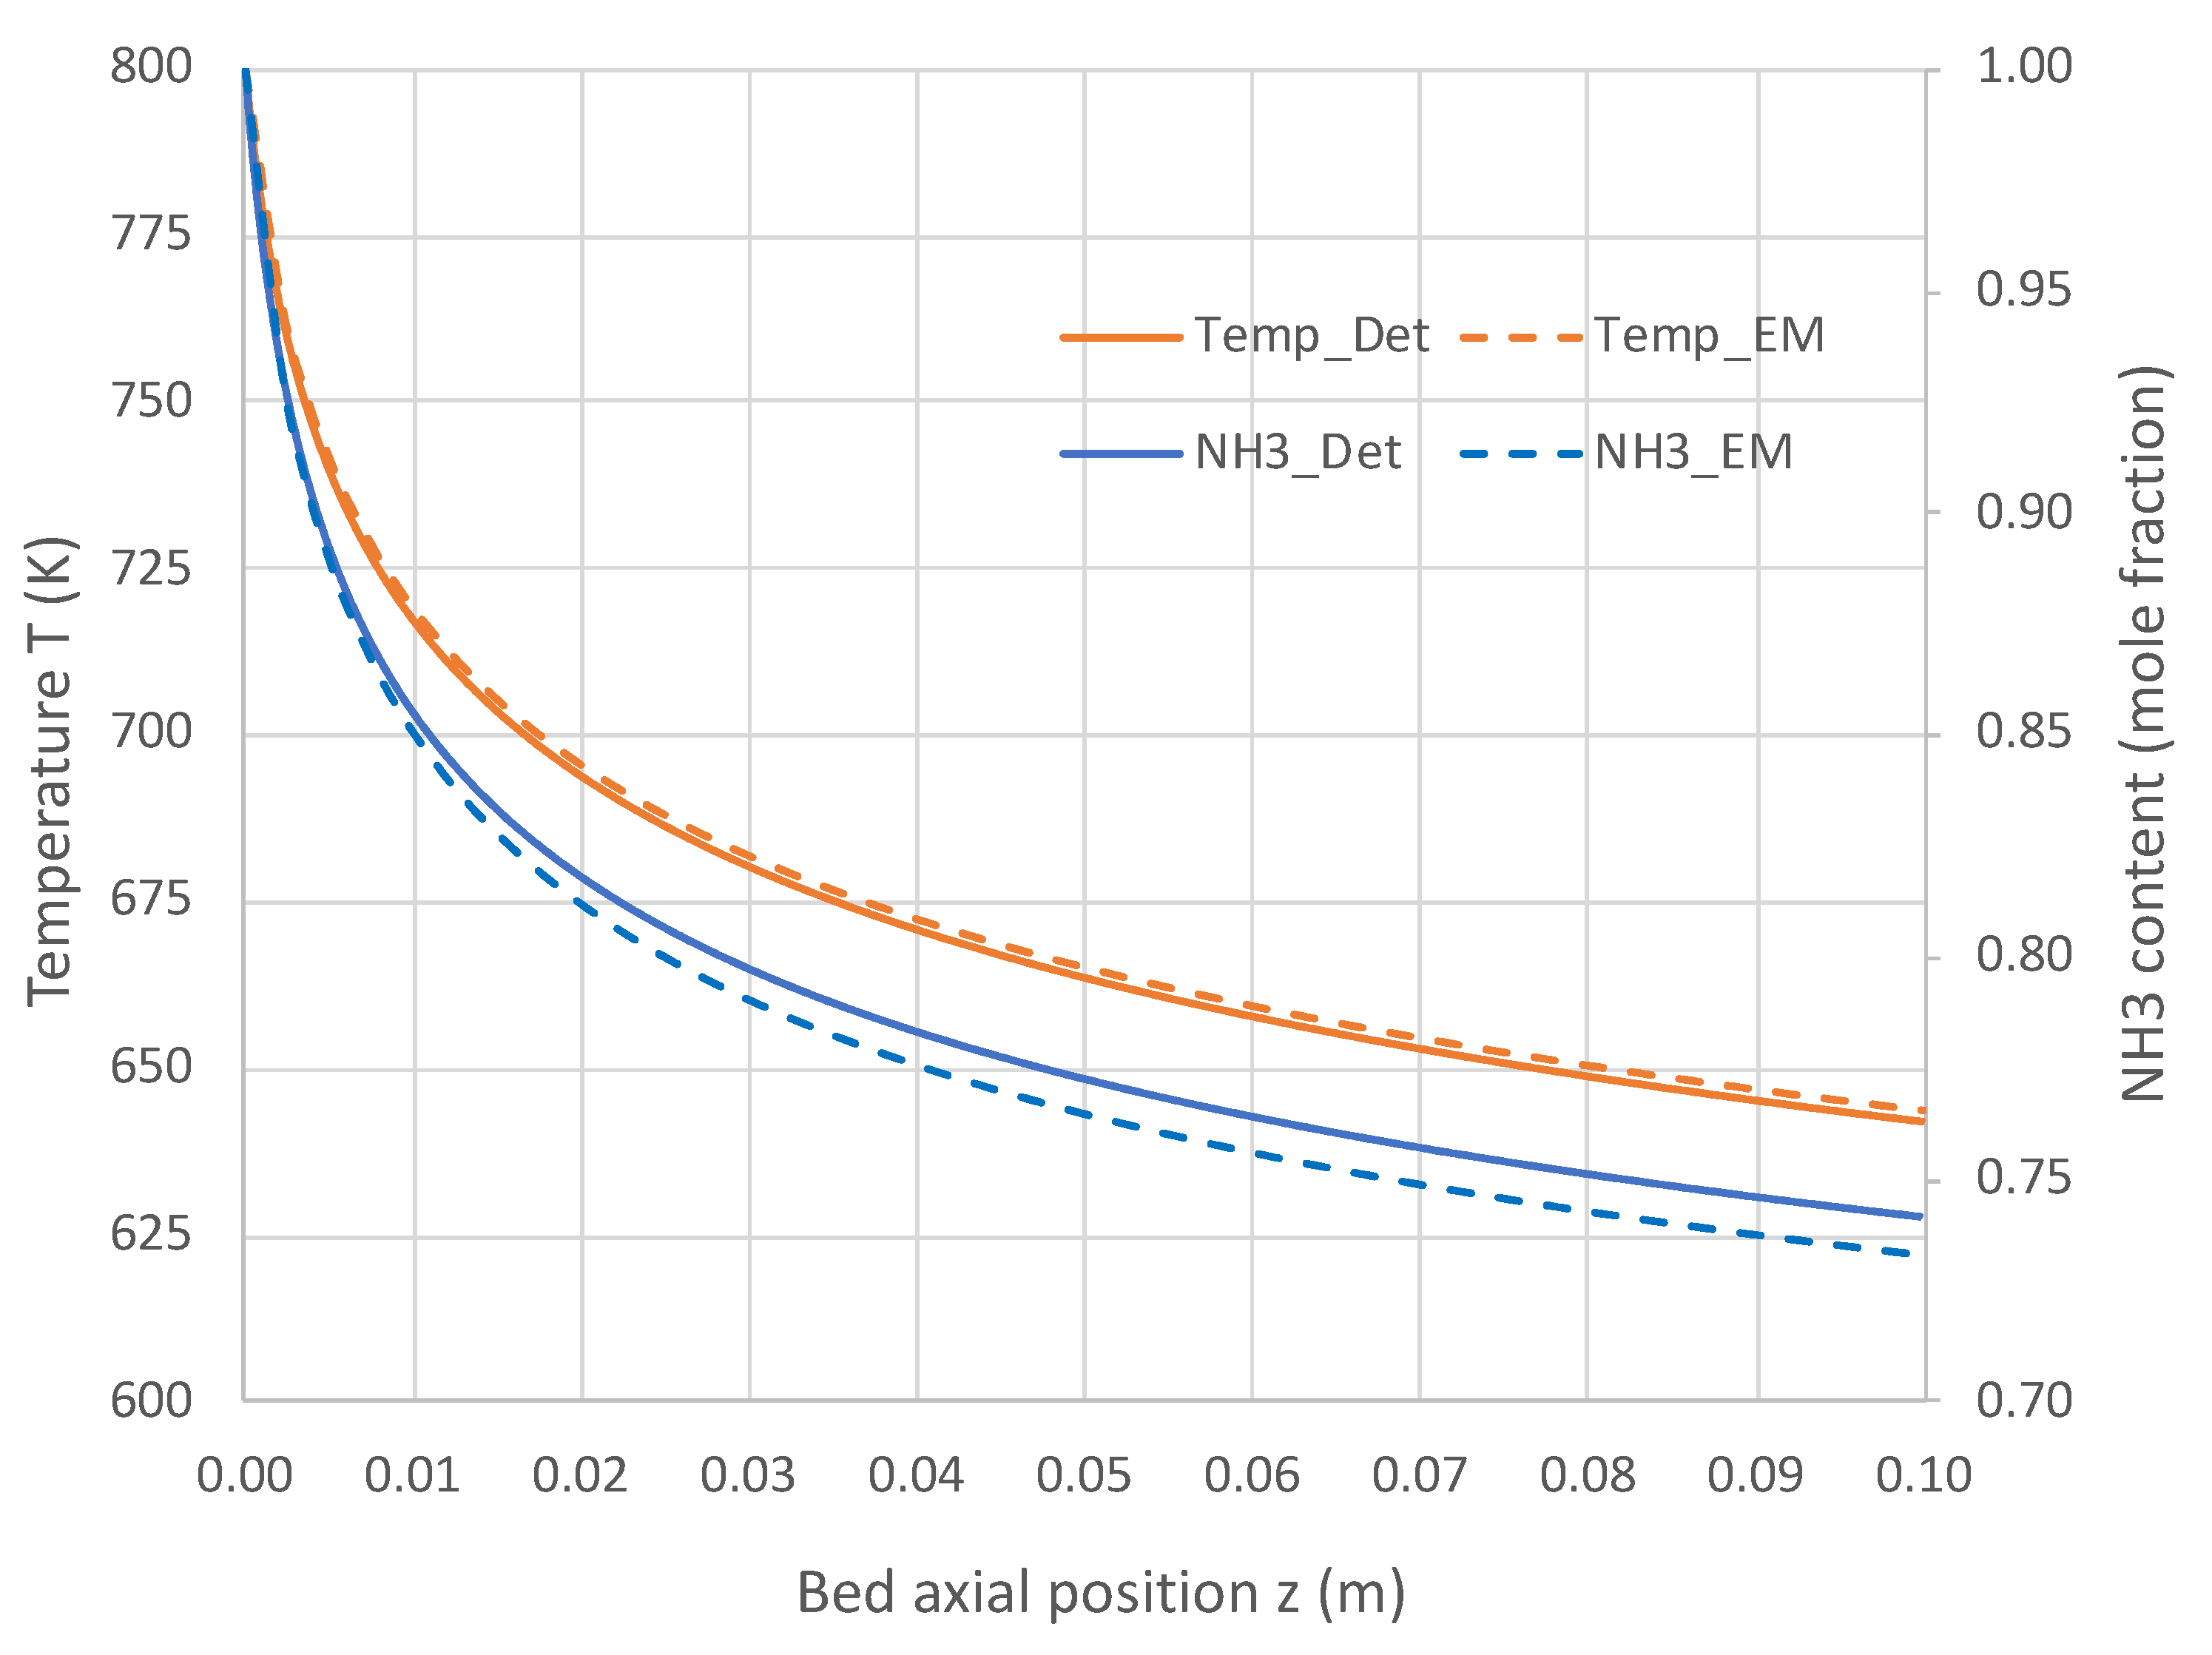
Figure 6.
Comparison of engineering model (EM) with overall kinetic rate expression (Equations (6) and (12)) vs. Detchem® with detailed mechanism for adiabatic PBR feeding pure NH3 at 1 × 10⁻⁴ mol/s (see Table 3 for remaining conditions).
Figure 6.
Comparison of engineering model (EM) with overall kinetic rate expression (Equations (6) and (12)) vs. Detchem® with detailed mechanism for adiabatic PBR feeding pure NH3 at 1 × 10⁻⁴ mol/s (see Table 3 for remaining conditions).
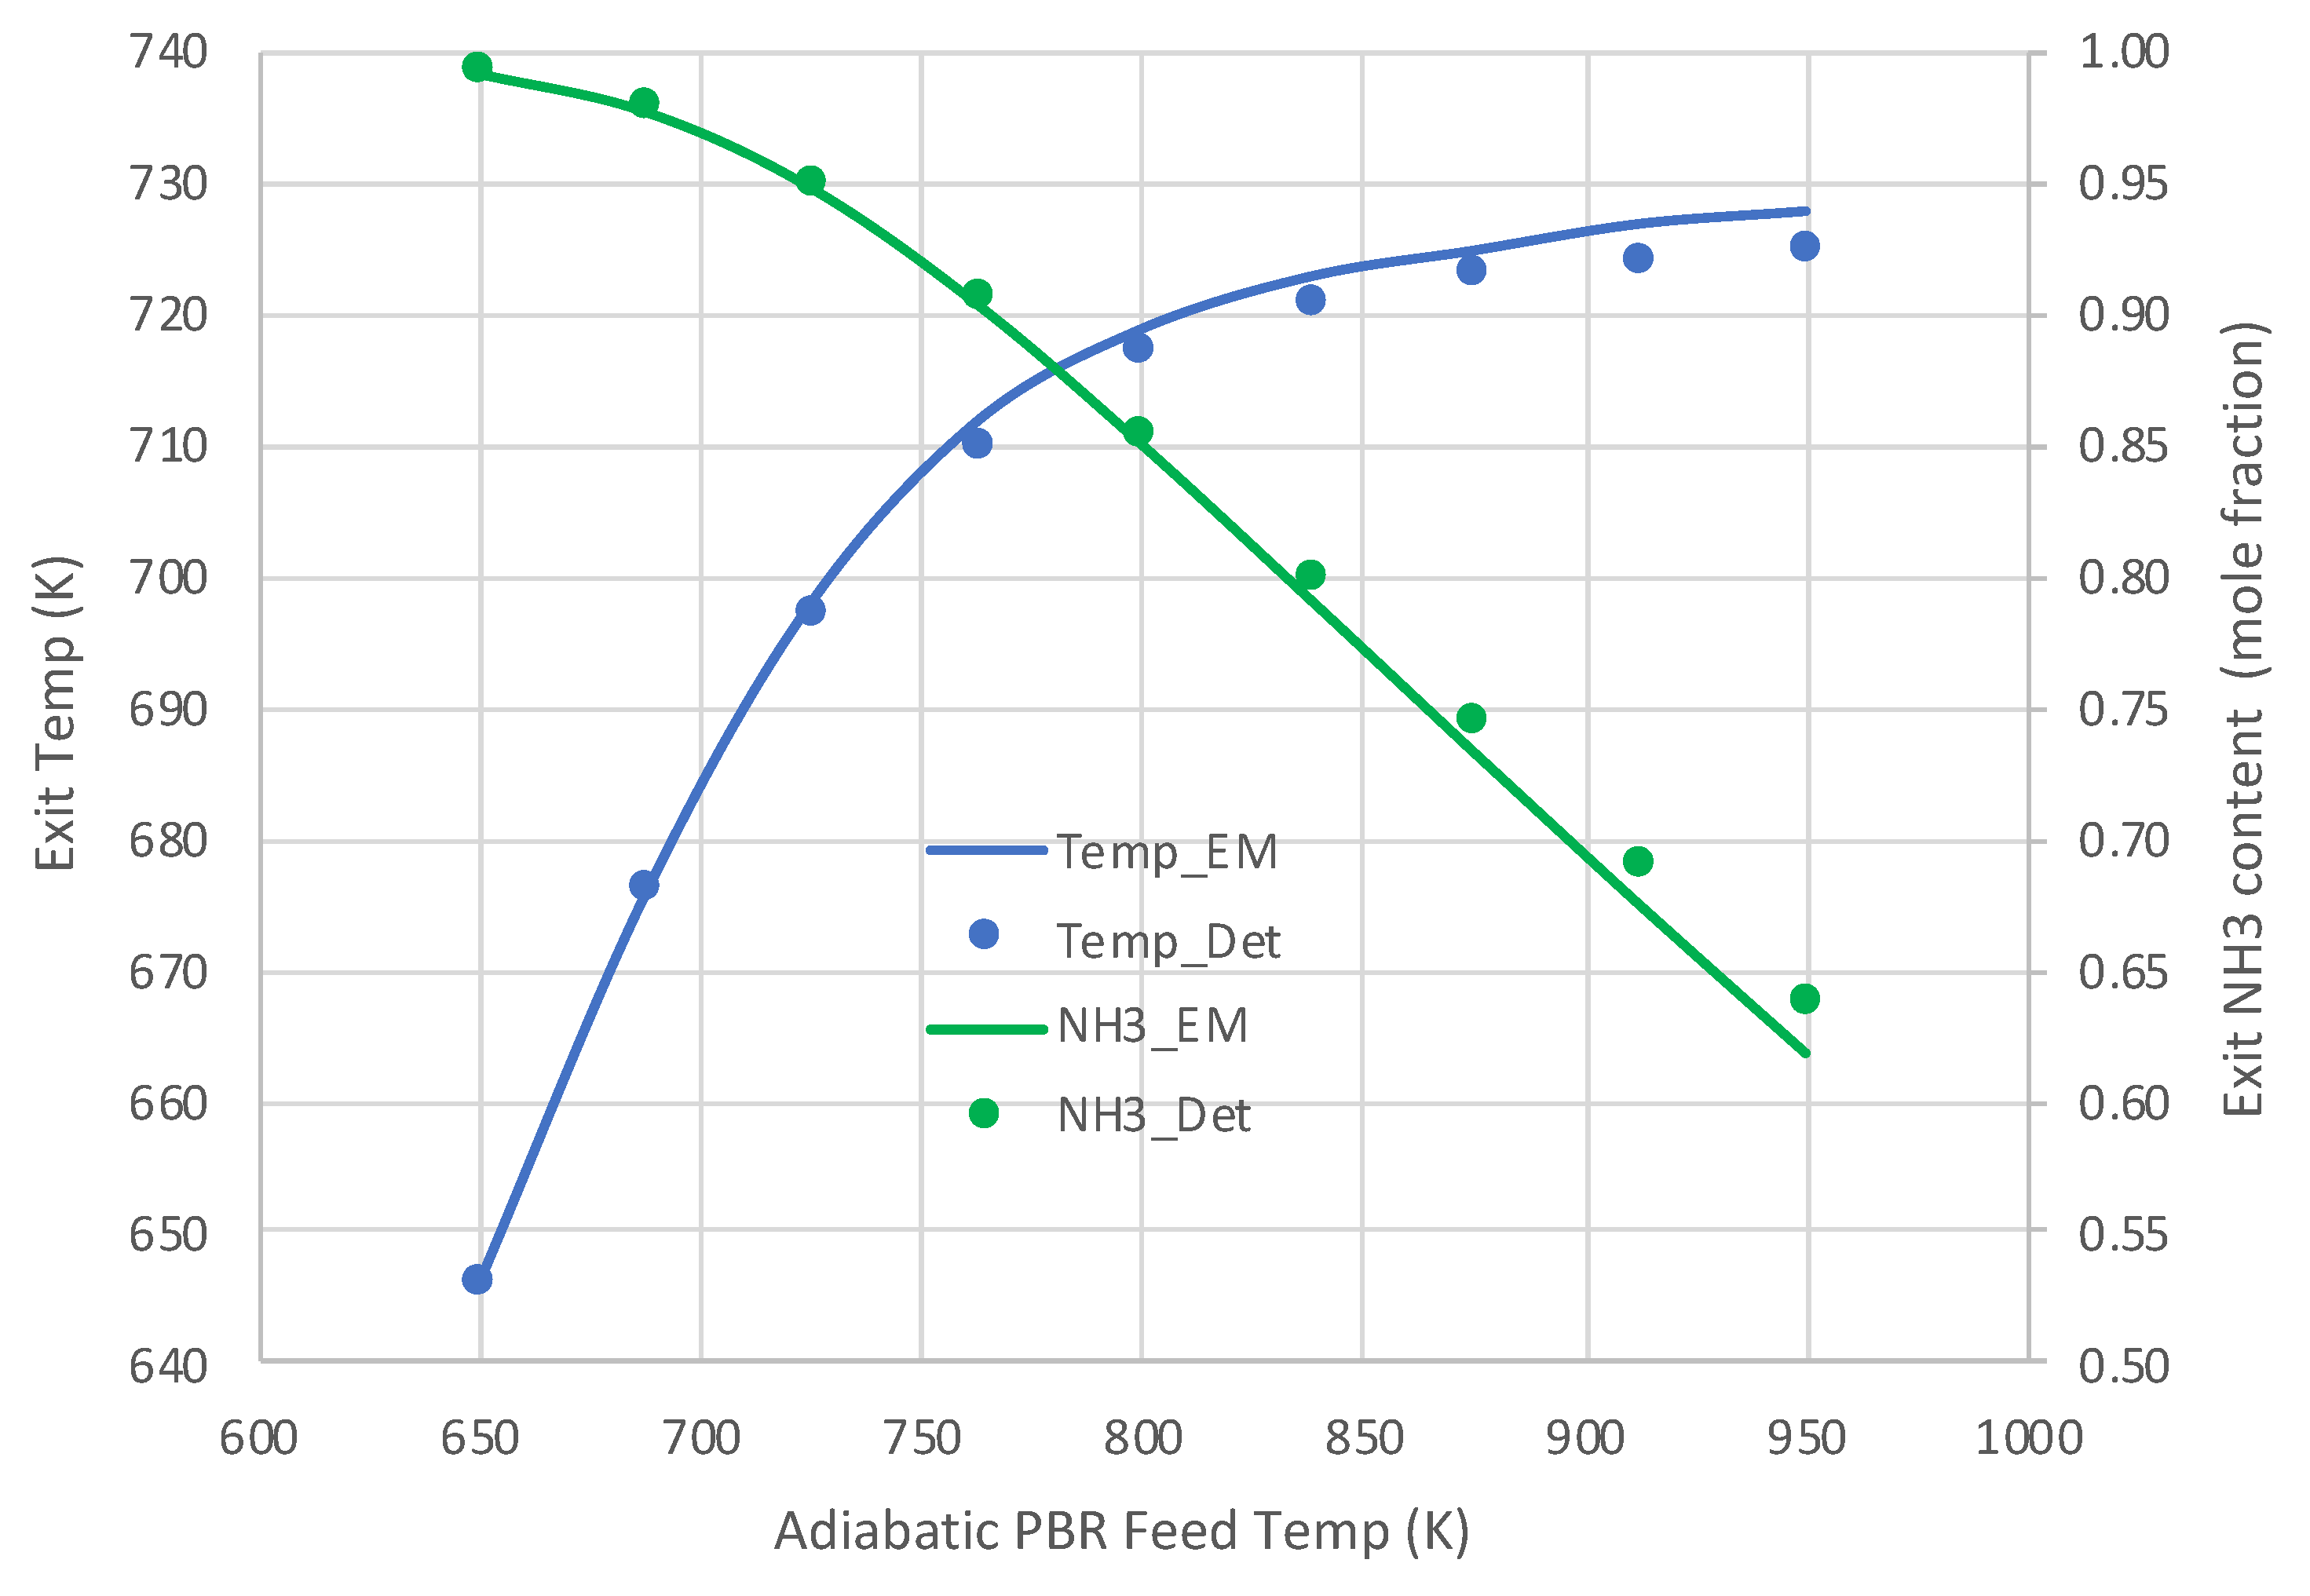
Table 1.
Data for Detchem® CSTR® Simulations.
| Feed Rate (mol/s) | ||
|---|---|---|
| Temperature (K) | Lowest | Highest |
| 650 | 1 × 10⁻¹¹ | 1 × 10⁻⁷ |
| 725 | 1 × 10⁻¹⁰ | 1 × 10⁻⁵ |
| 800 | 1 × 10⁻⁸ | 1 × 10⁻⁴ |
| 875 | 1 × 10⁻⁷ | 1 × 10⁻³ |
| 950 | 1 × 10⁻⁶ | 1 × 10⁻⁴ |
Pressure: 1 × 10⁵ Pa (constant); Catalyst area: 1.92 × 10⁻² m2; Reactor gas volume: 3.33 × 10⁻⁸ m3; Feed: pure NH3, or 25 mol% H2 or N2 (balance NH3) at same total molar rate for selected cases.
Table 2.
Rate constants for 2-parameter kinetic rate expression (Equation (6)). Form: where T (K).
| For k (mol-Pa/s-m2) | ||
|---|---|---|
| a | −5.996 | −6.181 |
| b | 4.344 × 10⁴ | 2.849 × 10⁴ |
| c | −2.610 × 10⁷ | −1.287 × 10⁷ |
Disclaimer/Publisher’s Note: The statements, opinions and data contained in all publications are solely those of the individual author(s) and contributor(s) and not of MDPI and/or the editor(s). MDPI and/or the editor(s) disclaim responsibility for any injury to people or property resulting from any ideas, methods, instructions or products referred to in the content. |
© 2023 by the author. Licensee MDPI, Basel, Switzerland. This article is an open access article distributed under the terms and conditions of the Creative Commons Attribution (CC BY) license (https://creativecommons.org/licenses/by/4.0/).
Share and Cite
MDPI and ACS Style
Barat, R.B. Simple Rate Expression for Catalyzed Ammonia Decomposition for Fuel Cells. Molecules 2023, 28, 6006. https://doi.org/10.3390/molecules28166006
AMA Style
Barat RB. Simple Rate Expression for Catalyzed Ammonia Decomposition for Fuel Cells. Molecules. 2023; 28(16):6006. https://doi.org/10.3390/molecules28166006
Chicago/Turabian StyleBarat, Robert B. 2023. "Simple Rate Expression for Catalyzed Ammonia Decomposition for Fuel Cells" Molecules 28, no. 16: 6006. https://doi.org/10.3390/molecules28166006