
Evaluation of Structural Stability, Mechanical Properties, and Corrosion Resistance of Magnesia Partially Stabilized Zirconia (Mg-PSZ)


Abstract
:1. Introduction
2. Results and Discussion
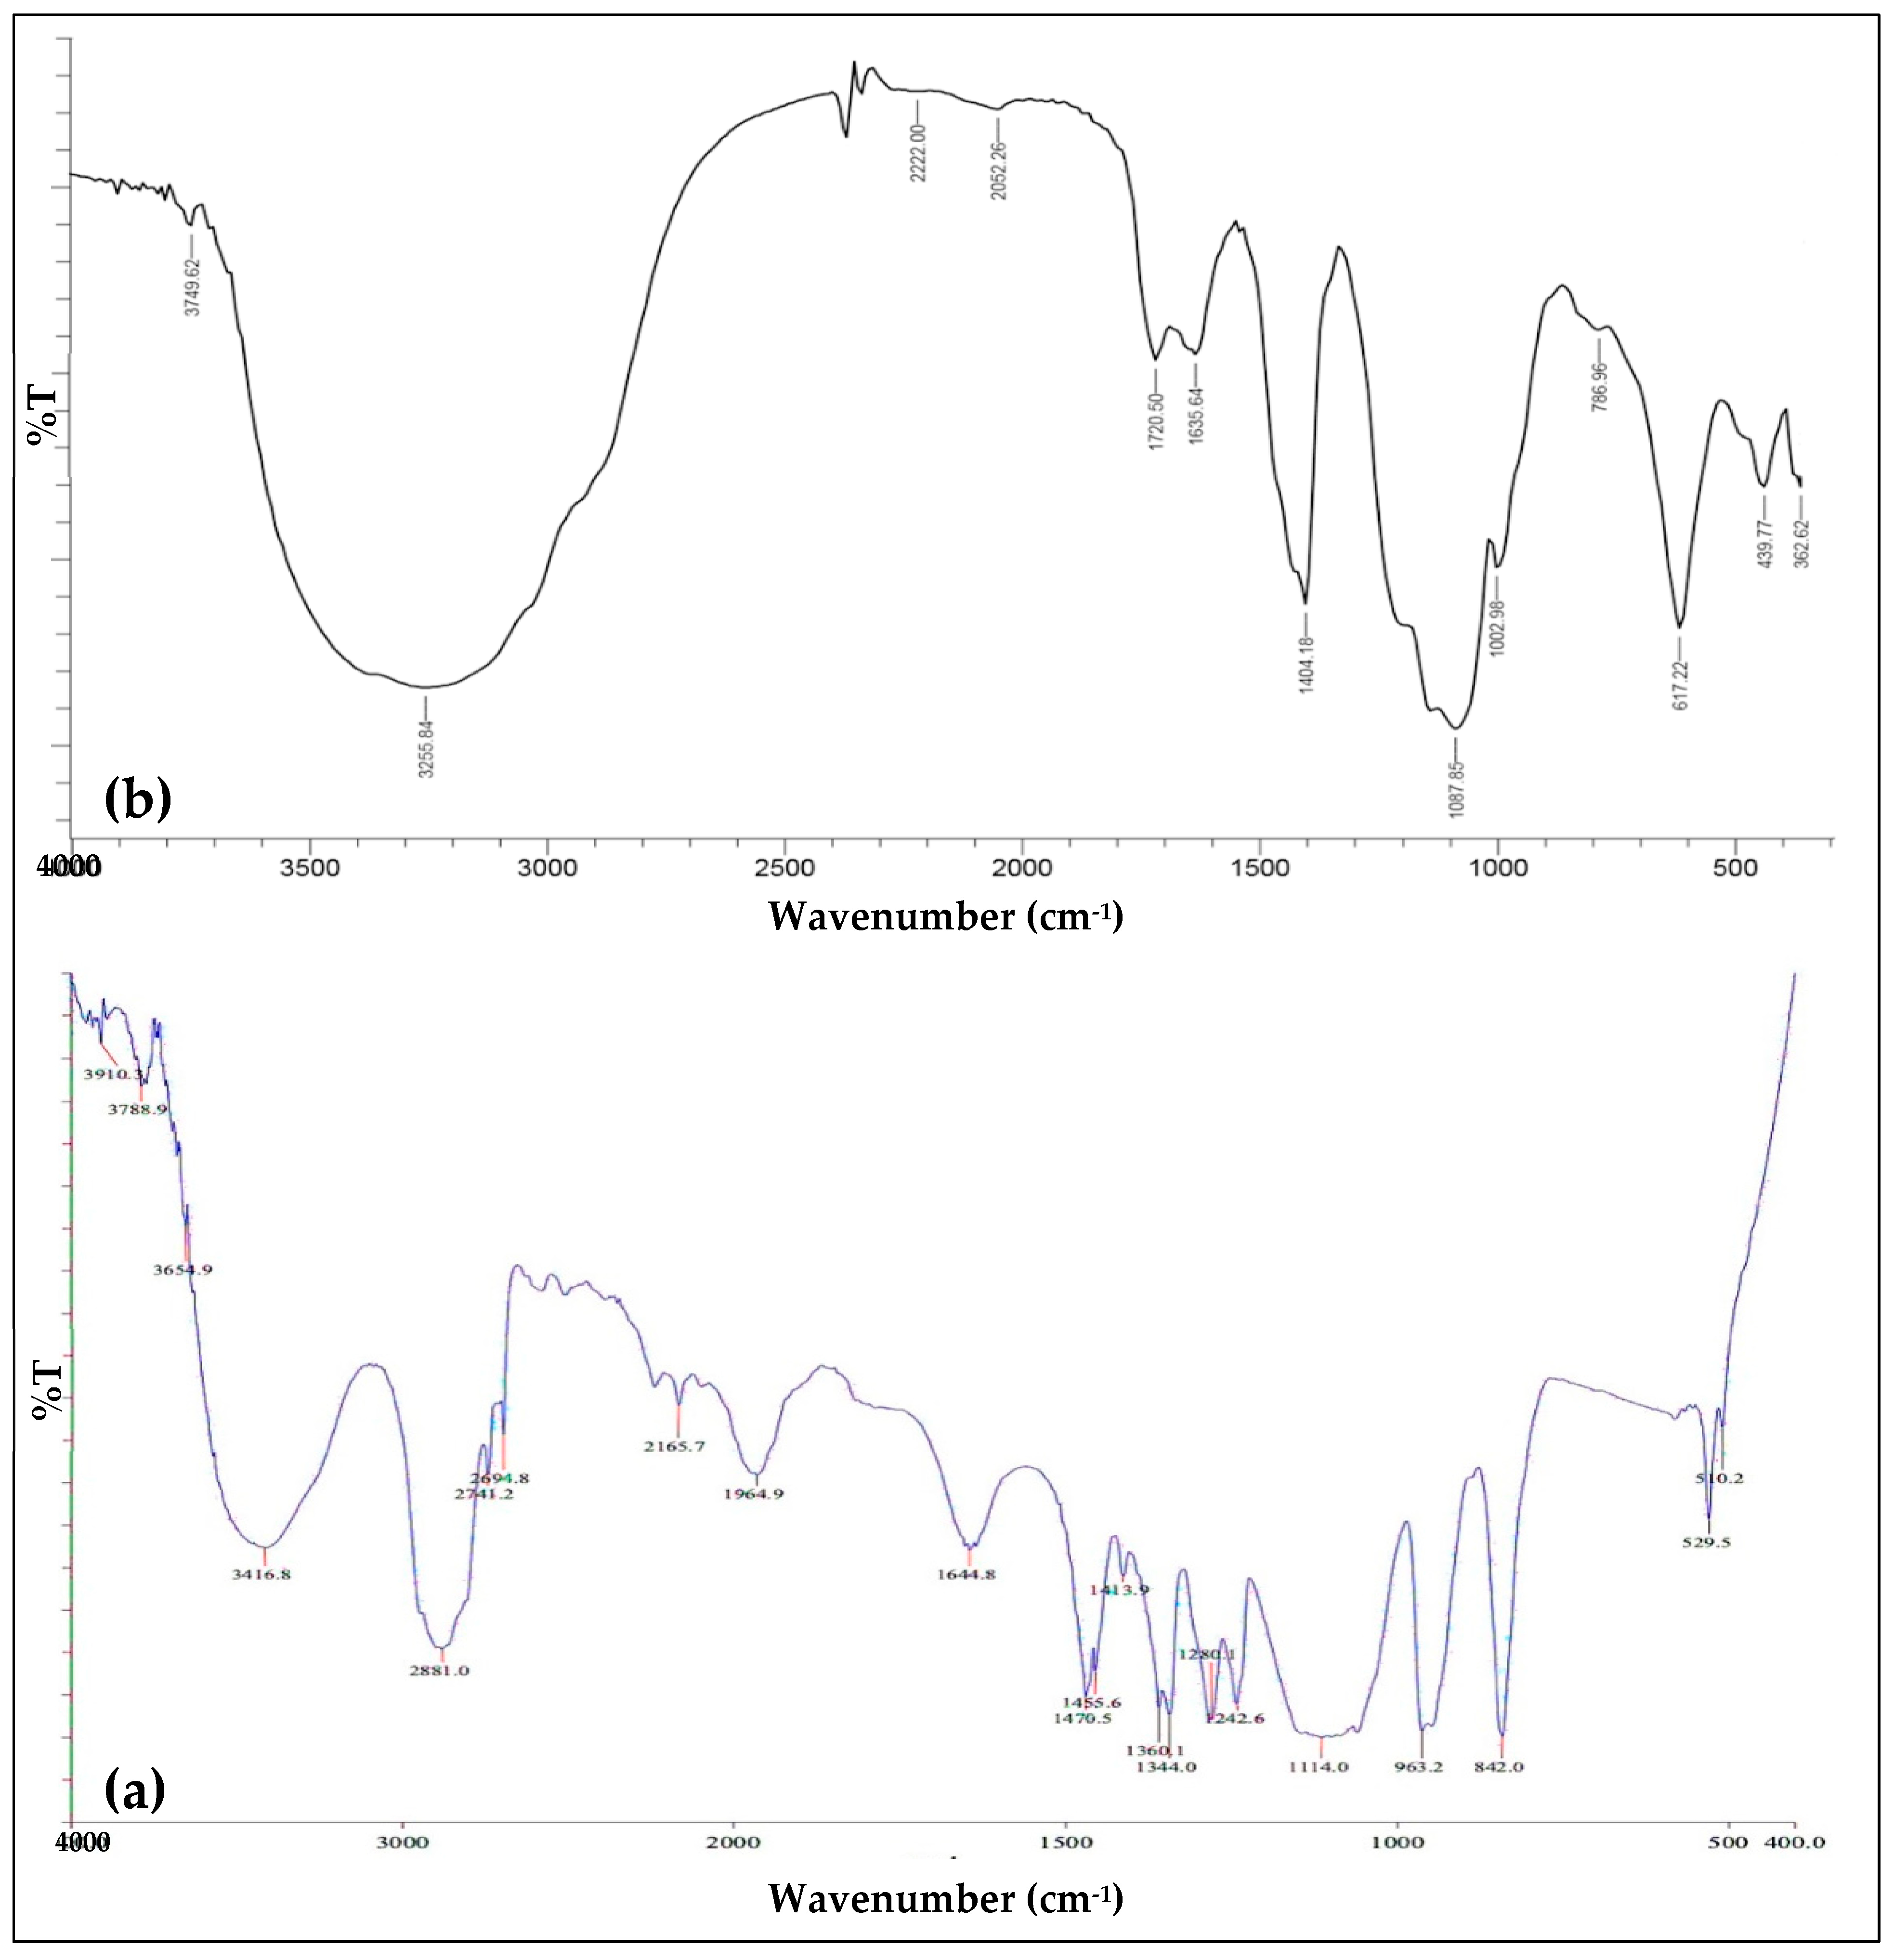
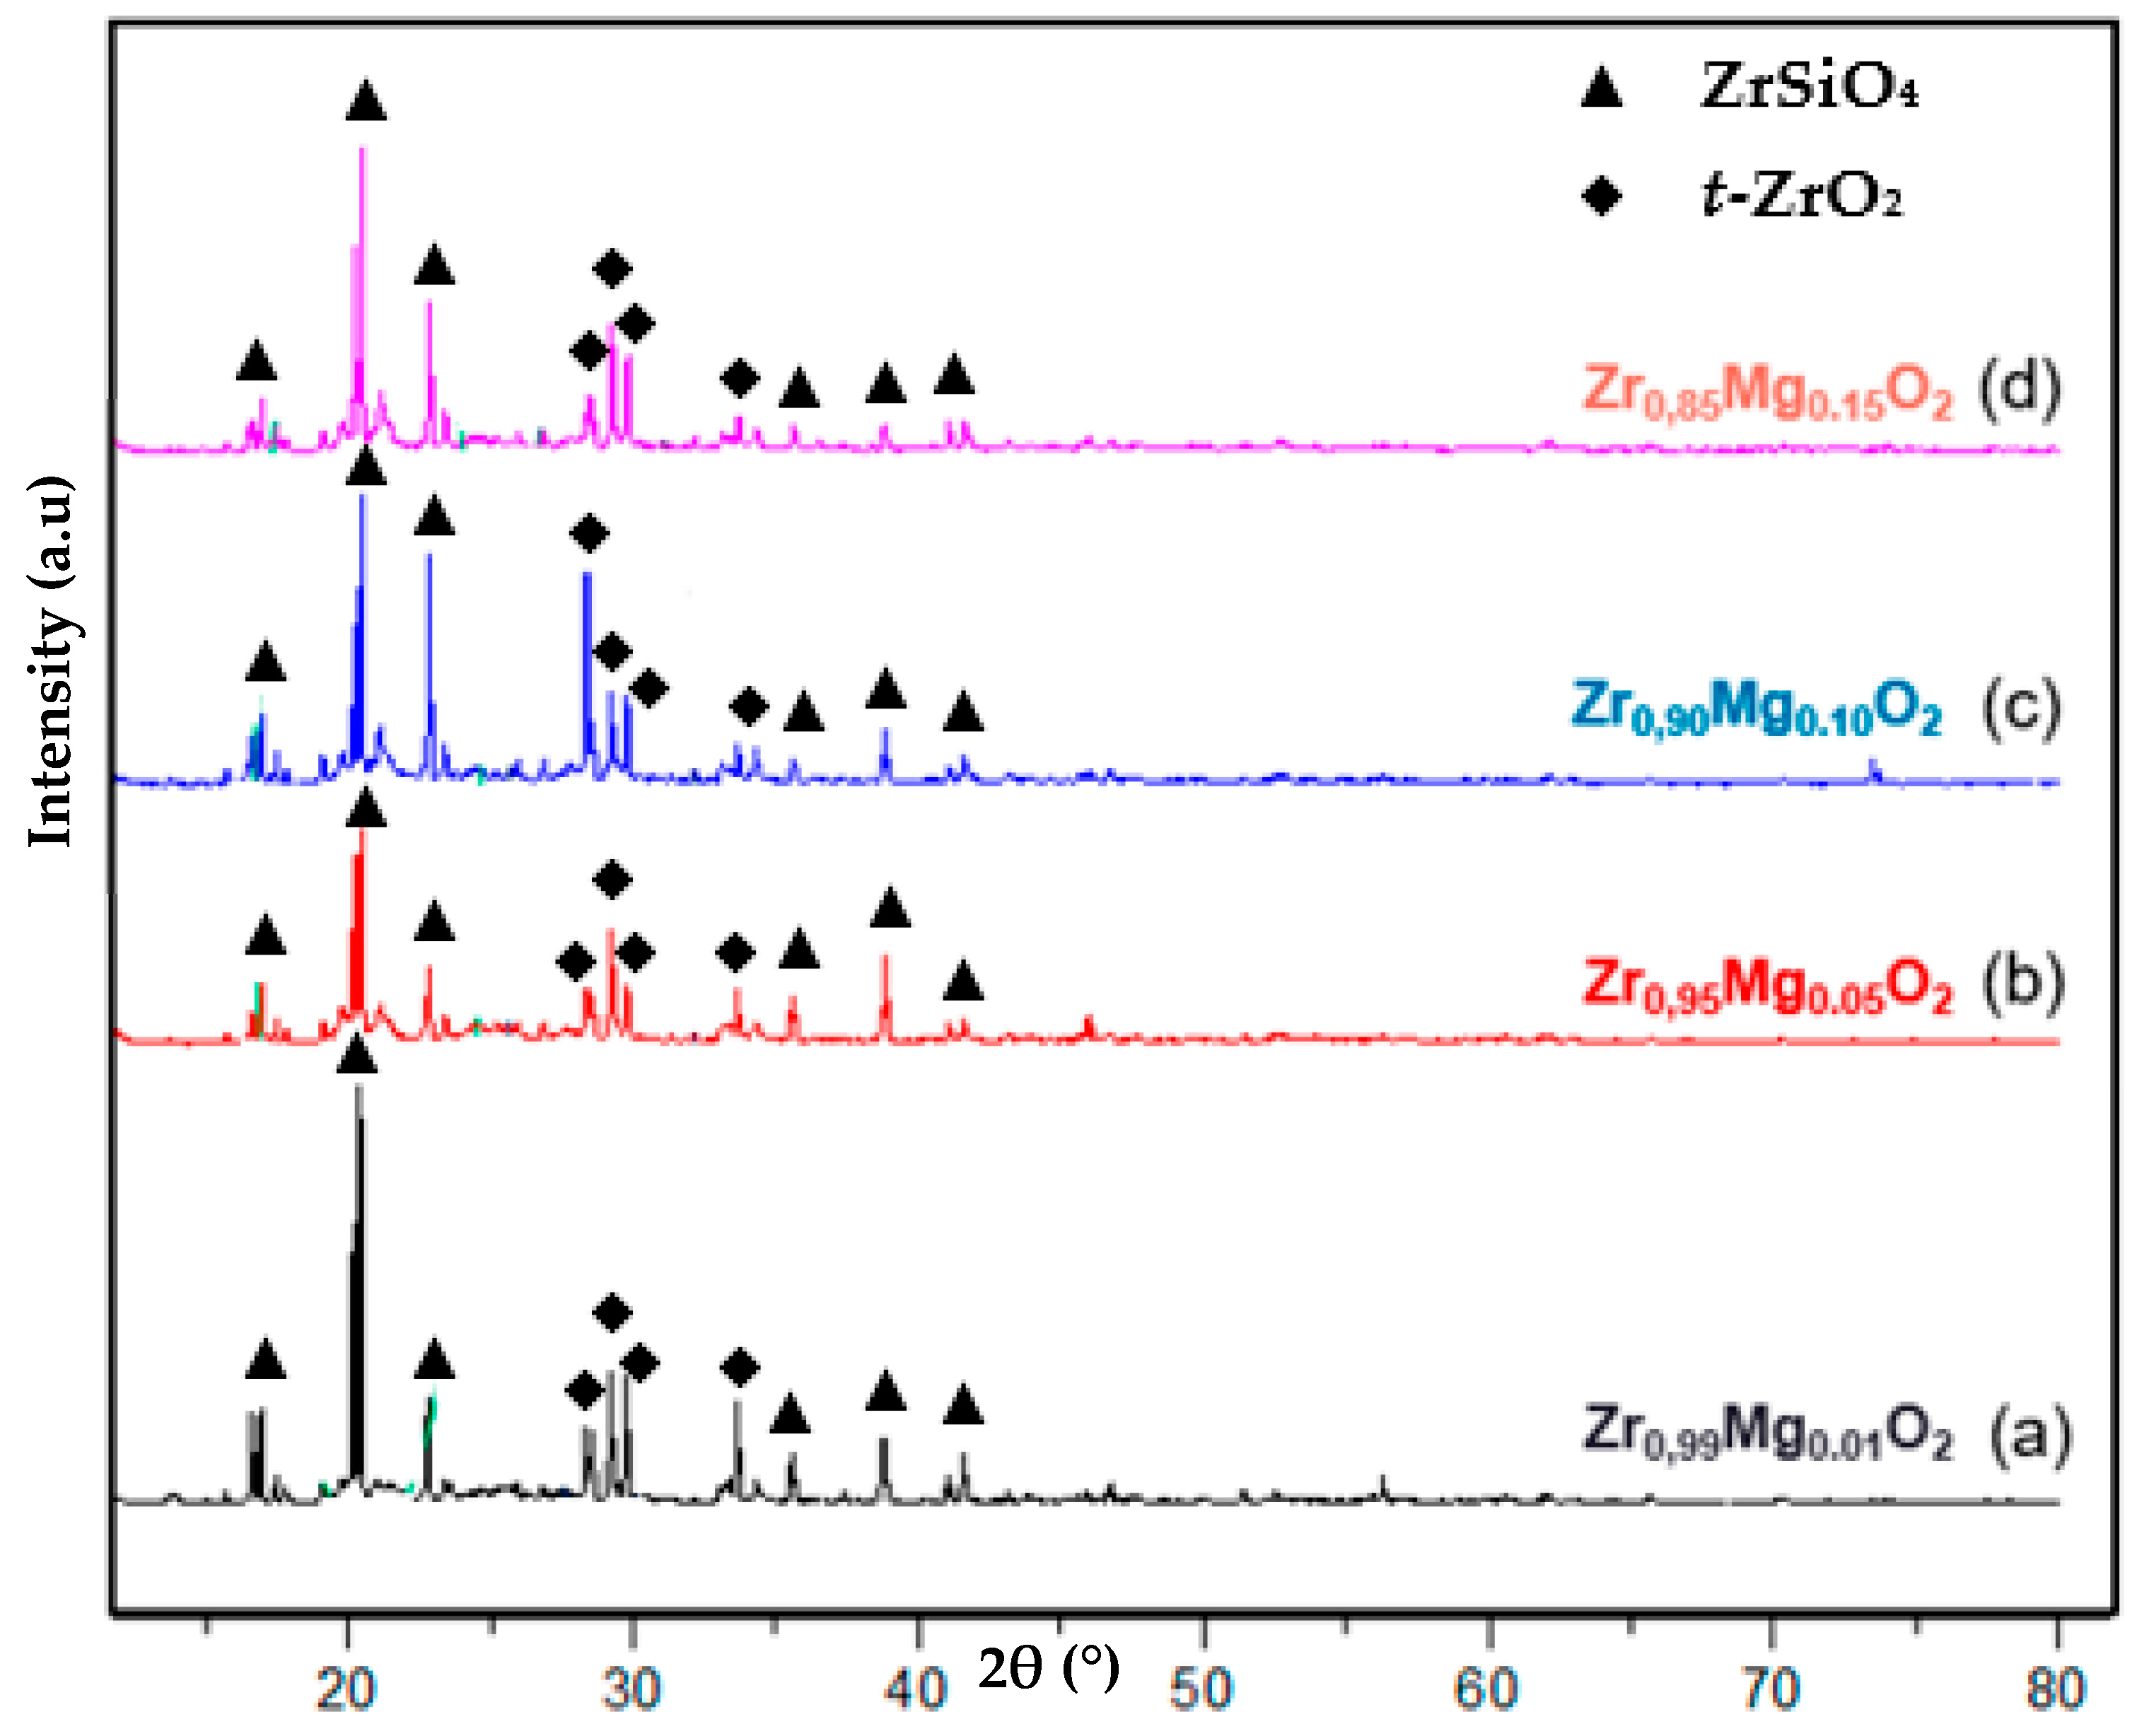
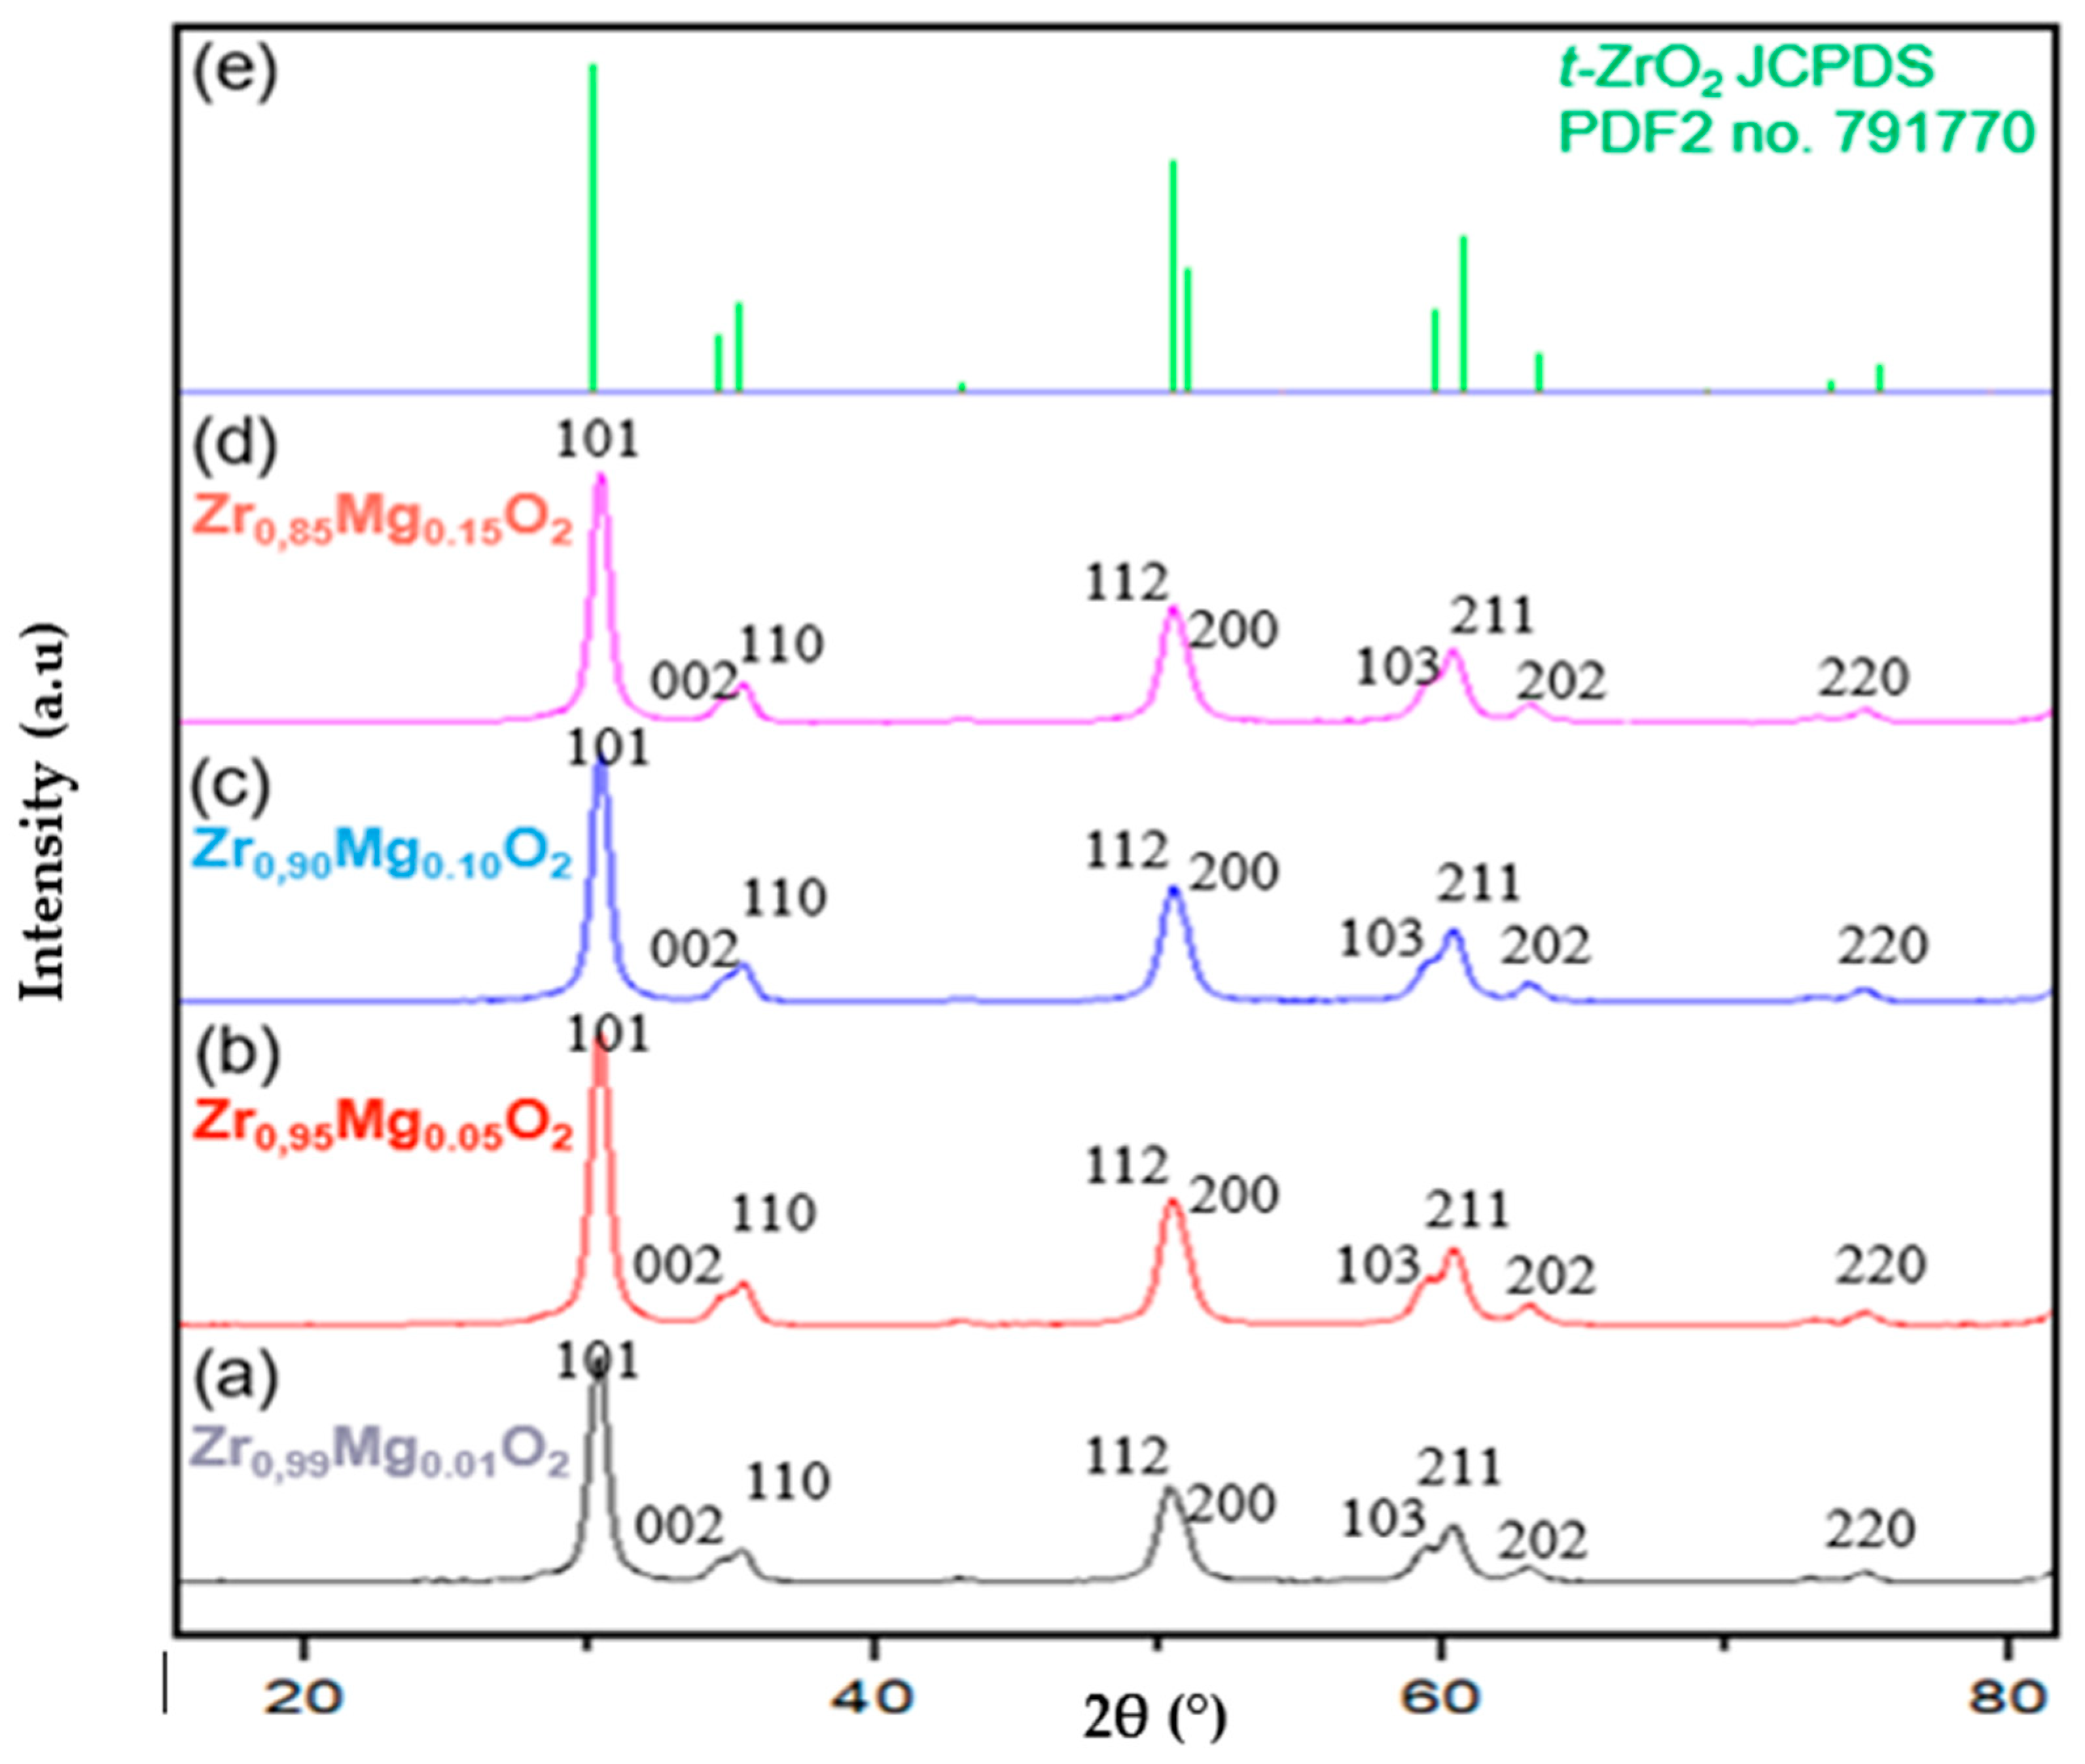
2.1. Crystal-Phase Structure Mg-PSZ
2.2. Mechanical Properties of Mg-PSZ
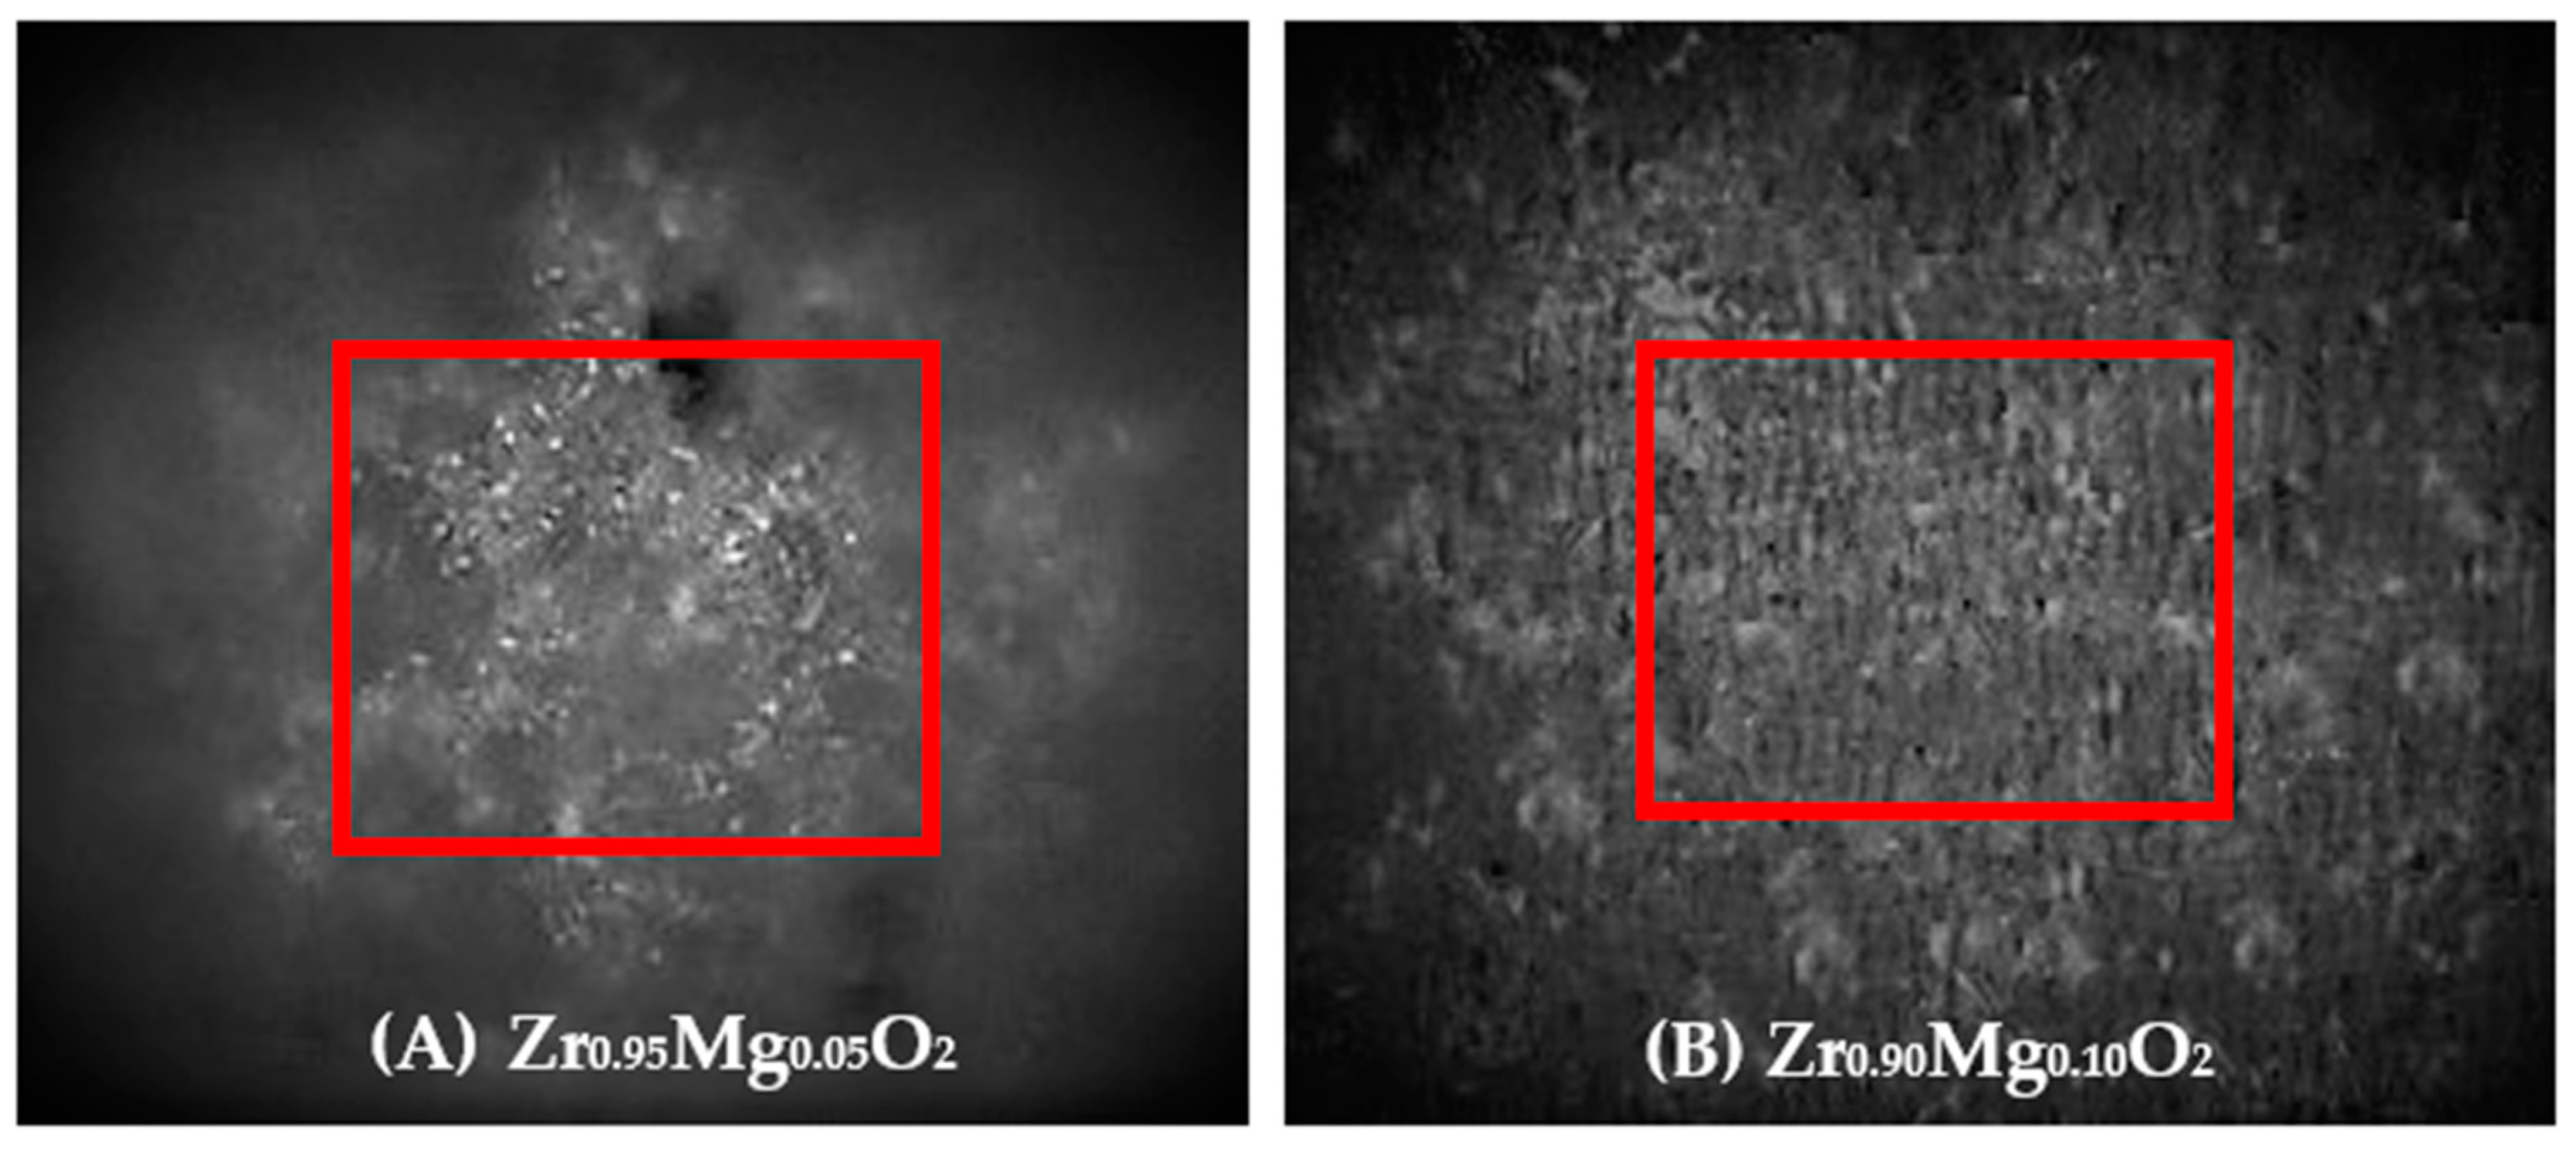
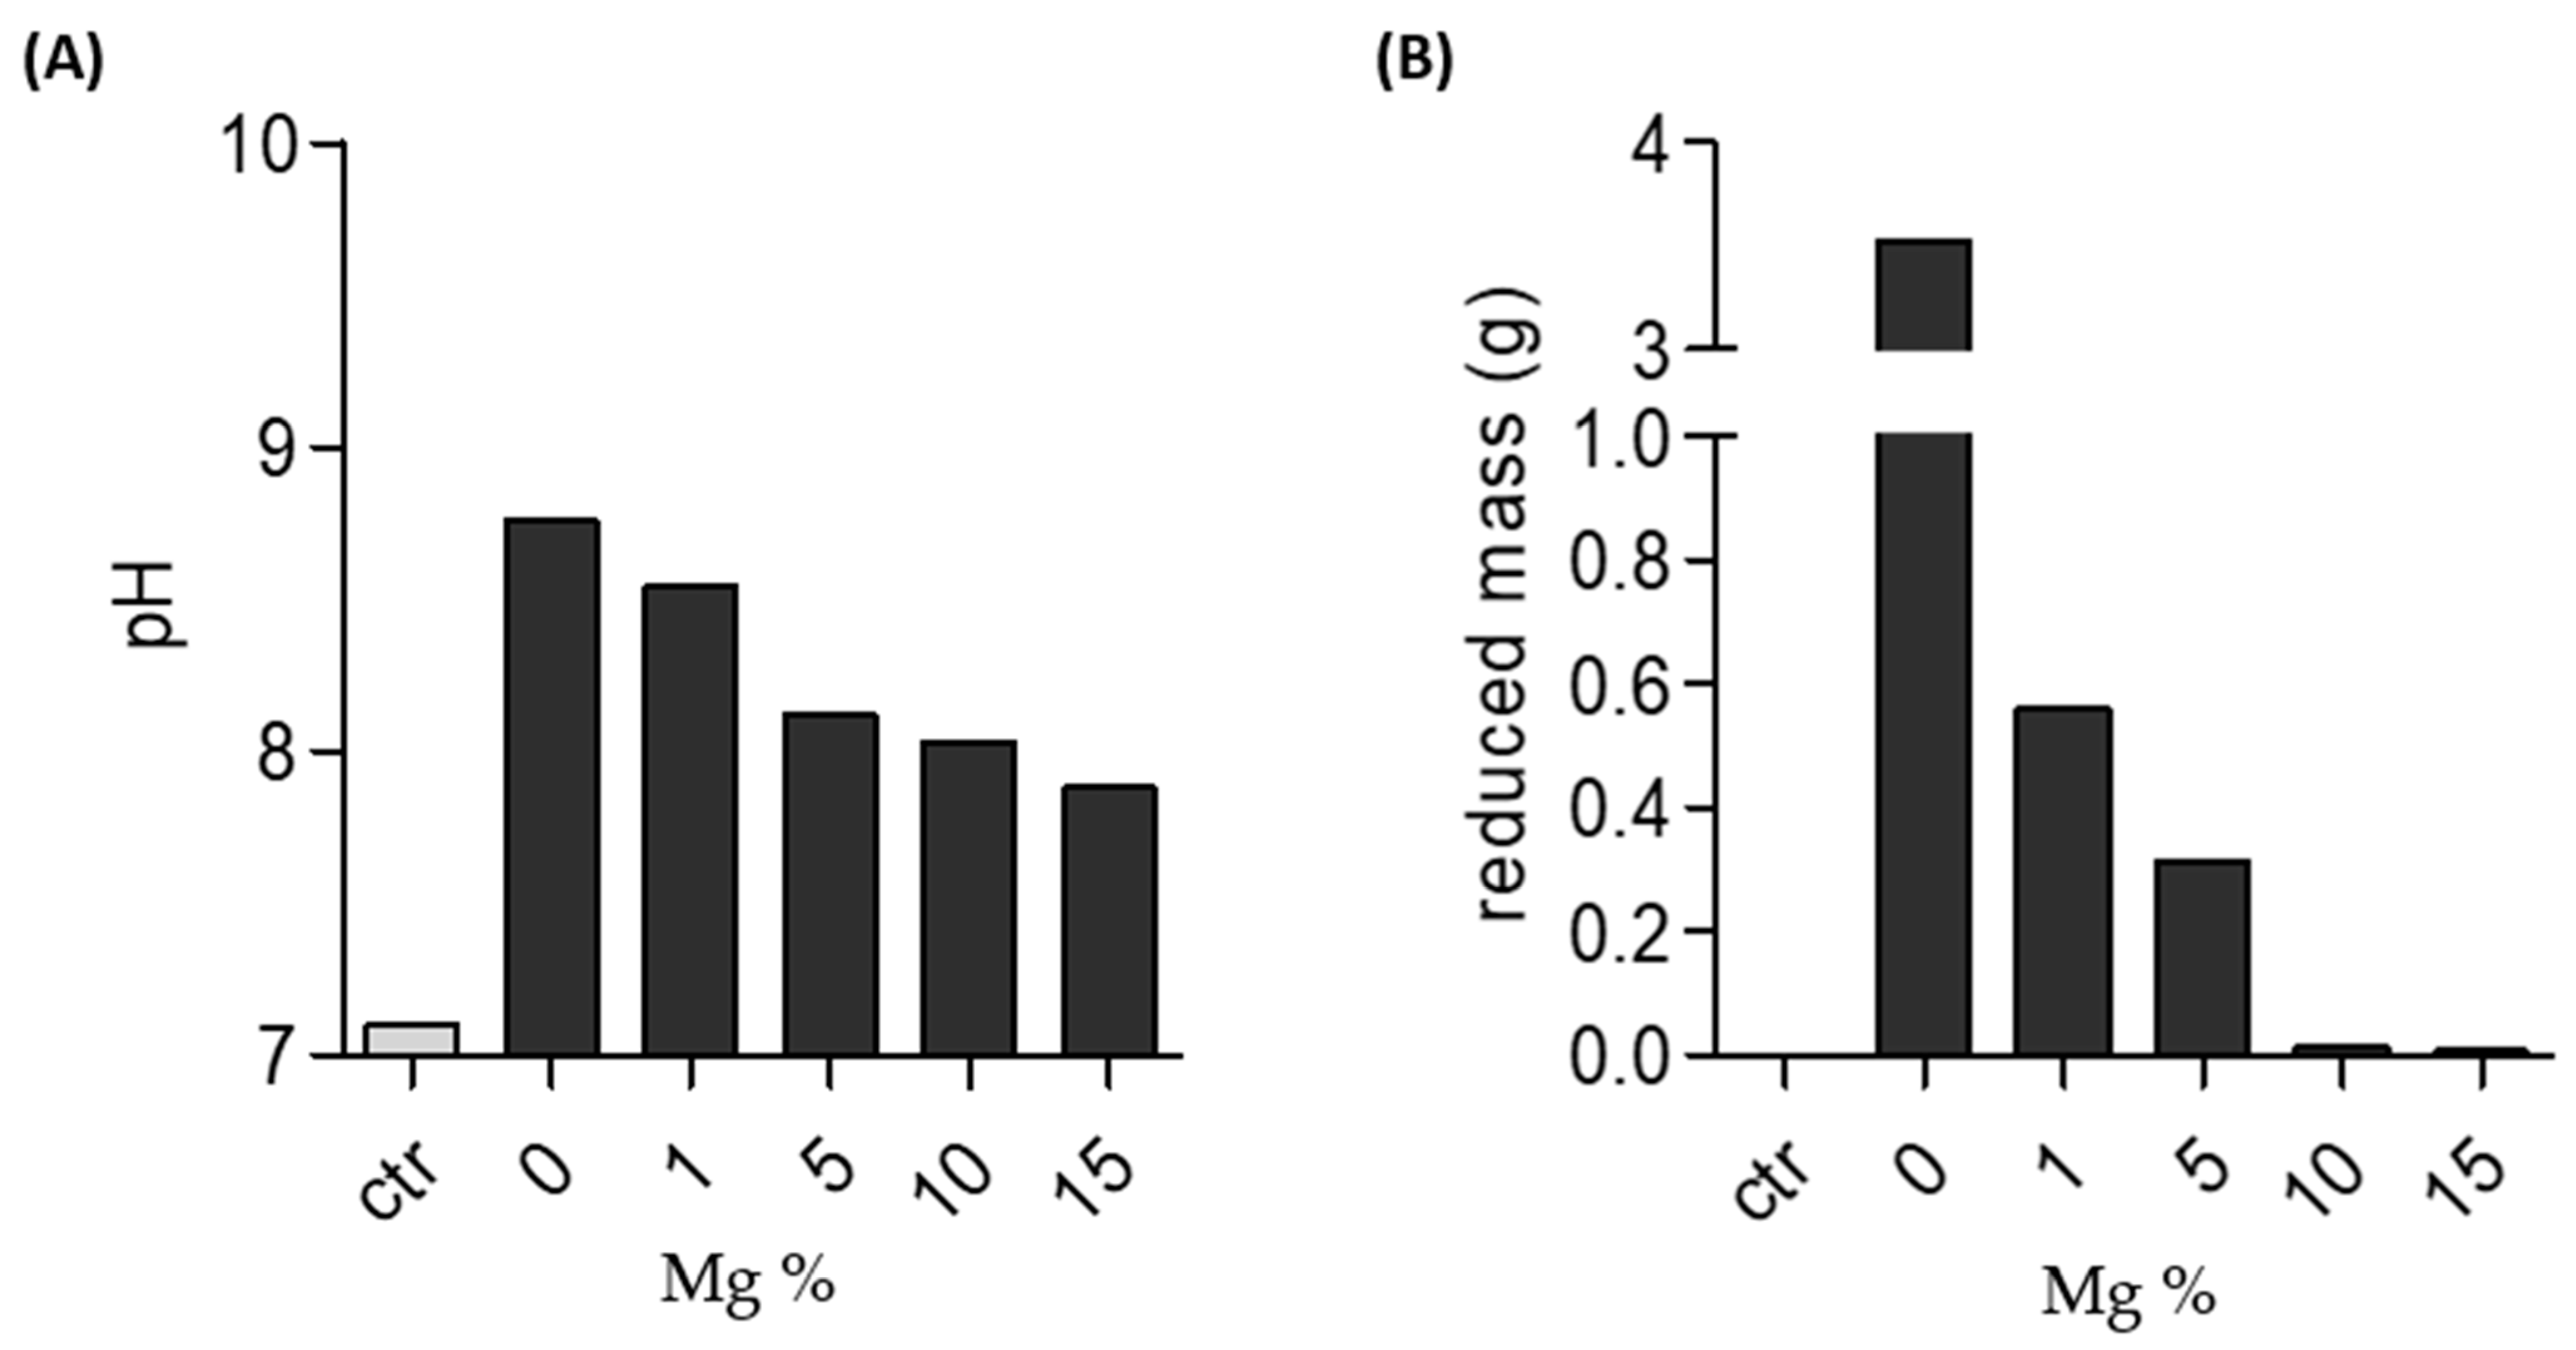
2.3. Stability of Mg-PSZ
3. Materials and Methods
3.1. Preparation of Crystals
3.2. Mechanical Properties
3.3. Stability
4. Conclusions
Author Contributions
Funding
Institutional Review Board Statement
Informed Consent Statement
Data Availability Statement
Conflicts of Interest
Sample Availability
References
- Wahyudi, K.; Maryani, E.; Arifiadi, F.; Rostika, A.; Yusuf, D.; Manullang, R.J.; Suyanti; Septawendar, R. Low-Calcination Temperatures of Magnesia Partially Stabilized Zirconia (Mg-PSZ) Nanoparticles Derived from Local Zirconium Silicates. Mater. Res. Express 2021, 8, 045022. [Google Scholar] [CrossRef]
- Yusuf, D.; Septawendar, R.; Noviyanti, A.R. Effect of Sintering on Phase Transformation Behavior and Morphology of Calcinated 5 Wt% Mg-PSZ. Res. J. Chem. Environ. 2022, 26, 1–5. [Google Scholar] [CrossRef]
- Baig, M.N.; Khalid, F.A.; Khan, F.N.; Rehman, K. Properties and Residual Stress Distribution of Plasma Sprayed Magnesia Stabilized Zirconia Thermal Barrier Coatings. Ceram. Int. 2014, 40, 4853–4868. [Google Scholar] [CrossRef]
- Kobayashi, E.; Matsumoto, S.; Doi, H.; Yoneyama, T.; Hamanaka, H. Mechanical Properties of the Binary Titanium-Zirconium Alloys and Their Potential for Biomedical Materials. J. Biomed. Mater. Res. 1995, 29, 943–950. [Google Scholar] [CrossRef]
- do Nascimento, R.O.; Chirani, N. Shape-Memory Polymers for Dental Applications. In Shape Memory Polymers for Biomedical Applications; Woodhead Publishing: Cambridge, UK, 2015; pp. 267–280. [Google Scholar] [CrossRef]
- Reti, A.; Mridha, S. Silver: Alloying, Properties, and Applications. In Reference Module in Materials Science and Materials Engineering; Elsevier: Amsterdam, The Netherlands, 2016. [Google Scholar] [CrossRef]
- Vaidya, A.; Pathak, K. Mechanical Stability of Dental Materials. In Applications of Nanocomposite Materials in Dentistry; Woodhead Publishing: Cambridge, UK, 2019; pp. 285–305. [Google Scholar] [CrossRef]
- Dunne, N.; Mitchell, C. Biomedical/Bioengineering Applications of Carbon Nanotube-Based Nanocomposites. In Polymer–Carbon Nanotube Composites: Preparation, Properties and Applications; Woodhead Publishing: Cambridge, UK, 2011; pp. 676–717. [Google Scholar] [CrossRef]
- Matei, M.; Voinea, E.A.; Rîcă, R.; Manolea, H.; Mogoantă, L.; Salan, A.; Rîcă, A.; Dinescu, V.C.; Cioateră, N. New Zirconia-Based Materials for Dental Applications. Structural, Morphological and Histological Evaluation. Ceram. Int. 2019, 45, 14859–14866. [Google Scholar] [CrossRef]
- Heuer, C.; Storti, E.; Graule, T.; Aneziris, C.G. Electrospinning of Y2O3- and MgO-Stabilized Zirconia Nanofibers and Characterization of the Evolving Phase Composition and Morphology during Thermal Treatment. Ceram. Int. 2020, 46, 12001–12008. [Google Scholar] [CrossRef]
- Koltsov, I.; Smalc-Koziorowska, J.; Prześniak-Welenc, M.; Małysa, M.; Kimmel, G.; McGlynn, J.; Ganin, A.; Stelmakh, S. Mechanism of Reduced Sintering Temperature of Al2O3–ZrO2 Nanocomposites Obtained by Microwave Hydrothermal Synthesis. Materials 2018, 11, 829. [Google Scholar] [CrossRef] [Green Version]
- Štefanić, G.; Musić, S. Factors Influencing the Stability of Low Temperature Tetragonal ZrO2. Croat. Chem. Acta 2002, 75, 727–767. [Google Scholar]
- Özkurt, Z.; Kazazoğlu, E. Clinical Success of Zirconia in Dental Applications. J. Prosthodont. 2010, 19, 64–68. [Google Scholar] [CrossRef]
- Deirmina, F.; Pellizzari, M. Mechanical Properties and Tempering Resistance of an Ultrafine Grained Tool Steel-PSZ Composite Fabricated by High Energy Mechanical Milling and Spark Plasma Sintering. Mater. Sci. Eng. A 2020, 786, 139428. [Google Scholar] [CrossRef]
- Wijayanti, R.; Rosmayanti, I.; Wahyudi, K.; Maryani, E.; Hernawan, H.; Septawendar, R. Preparation of Magnesia Partially Stabilized Zirconia Nanomaterials from Zirconium Hydroxide and Magnesium Carbonate Precursors Using PEG as a Template. Crystals 2021, 11, 635. [Google Scholar] [CrossRef]
- Yoon, S.; Van Tyne, C.J.; Lee, H. Effect of Alumina Addition on the Microstructure and Grain Boundary Resistance of Magnesia Partially-Stabilized Zirconia. Curr. Appl. Phys. 2014, 14, 922–927. [Google Scholar] [CrossRef]
- Soylemez, B.; Sener, E.; Yurdakul, A.; Yurdakul, H. Fracture Toughness Enhancement of Yttria-Stabilized Tetragonal Zirconia Polycrystalline Ceramics through Magnesia-Partially Stabilized Zirconia Addition. J. Sci. Adv. Mater. Devices 2020, 5, 527–534. [Google Scholar] [CrossRef]
- Doleker, K.M.; Ozgurluk, Y.; Ozkan, D.; Mesekiran, N.; Karaoglanli, A.C. Comparison of Microstructures and Oxidation Behaviors of Ytria and Magnesia Stabilized Zirconia Thermal Barrier Coatings (TBC). Mater. Tehnol. 2018, 52, 315–322. [Google Scholar] [CrossRef]
- Chevalier, J.; Gremillard, L.; Virkar, A.V.; Clarke, D.R. The Tetragonal-Monoclinic Transformation in Zirconia: Lessons Learned and Future Trends. J. Am. Ceram. Soc. 2009, 92, 1901–1920. [Google Scholar] [CrossRef]
- Savchenko, N.L.; Sablina, T.Y.; Sevostyanova, I.N. Influence of Porosity on the Structural-Phase State of ZrO2-Y2O3 Ceramics. AIP Conf. Proc. 2019, 2167, 020313. [Google Scholar] [CrossRef]
- Sallemi, I.; Bouaziz, J.; Ben Ayed, F. The Effect of Adding Magnesium Oxide on the Mechanical Properties of the Tricalcium Phosphate-Zirconia Composites. Mater. Chem. Phys. 2015, 151, 50–59. [Google Scholar] [CrossRef]
- Azhar, A.Z.A.; Mohamad, H.; Ratnam, M.M.; Ahmad, Z.A. The Effects of MgO Addition on Microstructure, Mechanical Properties and Wear Performance of Zirconia-Toughened Alumina Cutting Inserts. J. Alloys Compd. 2010, 497, 316–320. [Google Scholar] [CrossRef]
- Bramhe, S.N.; Lee, Y.P.; Nguyen, T.D.; Kim, T.N. Synthesis of Yttria Stabilized Zirconia by Sol-Gel Precipitation Using PEG and PVA as Stabilizing Agent. Korean J. Mater. Res. 2013, 23, 441–446. [Google Scholar] [CrossRef] [Green Version]
- George, S.M.; Haycock, P.W.; Ormerod, R.M. The Mechanism of Corrosion of Aluminium Zirconium Silicate (AZS) Material in the Float Glass Furnace Regenerator. J. Eur. Ceram. Soc. 2018, 38, 2202–2209. [Google Scholar] [CrossRef]
- Su, S.; Du, F.S.; Li, Z.C. Facile Synthesis of a Degradable Poly(ethylene glycol) Platform with Tunable Acid Sensitivity at Physiologically Relevant pH. Macromolecules 2018, 51, 6571–6579. [Google Scholar] [CrossRef]
- Ansari, A.; Ali, A.; Asif, M.; Shamsuzzaman, S. Microwave-Assisted MgO NP Catalyzed One-Pot Multicomponent Synthesis of Polysubstituted Steroidal Pyridines. New J. Chem. 2018, 42, 184–197. [Google Scholar] [CrossRef]
- Lin, Z.; Han, X.; Wang, T.; Li, S. Effects of Adding Nano Metal Powders on Thermooxidative Degradation of Poly(Ethylene Glycol). J. Therm. Anal. Calorim. 2008, 91, 709–714. [Google Scholar] [CrossRef]
- Boughen, L.; Liggat, J.; Ellis, G. Thermal degradation of polyethylene glycol 6000 and its effect on the assay of macroprolactin. Clin. Biochem. 2010, 43, 750–753. [Google Scholar] [CrossRef]
- Kodal, M.; Karakaya, N.; Alchekh Wis, A.; Ozkoc, G. Thermal Properties (DSC, TMA, TGA, DTA) of Rubber Nanocomposites Containing Carbon Nanofillers. In Carbon-Based Nanofiller and Their Rubber Nanocomposites; Yaragalla, S., Mishra, R.K., Thomas, S., Kalarikkal, N., Maria, H.J., Eds.; Elsevier: Amsterdam, The Netherlands, 2019; pp. 325–366. [Google Scholar] [CrossRef]
- Liu, J.; Song, J.; Qi, T.; Zhang, C.; Qu, J. Controlling the Formation of Na2ZrSiO5 in Alkali Fusion Process for Zirconium Oxychloride Production. Adv. Powder Technol. 2016, 27, 1–8. [Google Scholar] [CrossRef] [Green Version]
- National Center for Biotechnology Information. PubChem Compound Summary for CID 61775, Zirconium Silicate. Available online: https://pubchem.ncbi.nlm.nih.gov/compound/Zirconium-silicate (accessed on 8 August 2023).
- Daou, E.E. The zirconia ceramic: Strengths and weaknesses. Open Dent. J. 2014, 8, 33–42. [Google Scholar] [CrossRef]
- Zhao, L.; Yao, S.; Li, Y.Q.; Zhao, Z.L.; Xue, Q.H. Effects of Calcium Oxide and Magnesium Oxide Stabilizing Agents on the Critical Transformation Size of Tetragonal Zirconia. Mater. Sci. Forum 2020, 980, 15–24. [Google Scholar] [CrossRef]
- Taeh, A.; Othman, F.; Abdul-Hameed, A. Effect of Adding MgO on Microstructure of Zirconia Toughened Alumina (ZTA) Composite for Medical Applications. Eng. Technol. J. 2022, 40, 1–13. [Google Scholar] [CrossRef]
- Duwez, P.; Odell, F.; Brown, F.H. Stabilization of Zirconia with Calcia and Magnesia. J. Am. Ceram. Soc. 1952, 35, 107–113. [Google Scholar] [CrossRef]
- Jiang, L.; Guo, S.; Bian, Y.; Zhang, M.; Ding, W. Effect of Sintering Temperature on Mechanical Properties of Magnesia Partially Stabilized Zirconia Refractory. Ceram. Int. 2016, 42, 10593–10598. [Google Scholar] [CrossRef]
- Chen, G.; Li, Q.; Ling, Y.; Zheng, H.; Chen, J.; Jiang, Q.; Li, K.; Peng, J.; Omran, M.; Gao, L. Phase Stability and Microstructure Morphology of Microwave-Sintered Magnesia-Partially Stabilised Zirconia. Ceram. Int. 2021, 47, 4076–4082. [Google Scholar] [CrossRef]
- Bogicevic, A.; Wolverton, C.; Crosbie, G.M.; Stechel, E.B. Defect Ordering in Aliovalently Doped Cubic Zirconia from First Principles. Phys. Rev. B 2001, 64, 014106. [Google Scholar] [CrossRef]
- Garvie, R.C.; Nicholson, P.S. Structure and Thermomechanical Properties of Partially Stabilized Zirconia in the CaO-ZrO2 System. In Sintering Key Papers; Springer: Dordrecht, The Netherlands, 1990; pp. 259–273. [Google Scholar]
- La Kilo, A.; Umamah, T.S.; Laliyo, L.A.R. Study on the Stability of Trivalent Cations Doped Zirconia through Atomistic Modeling. J. Kim. Sains Apl. 2019, 22, 129–135. [Google Scholar] [CrossRef]
- Fabris, S.; Paxton, A.T.; Finnis, M.W. A Stabilization Mechanism of Zirconia Based on Oxygen Vacancies Only. Acta Mater. 2002, 50, 5171–5178. [Google Scholar] [CrossRef] [Green Version]
- Kokubo, T. Bioceramics and Their Clinical Applications, 1st ed.; Kokubo, T., Ed.; Elsevier: Amsterdam, The Netherlands, 2008; Volume 1. [Google Scholar]
- Lopes, M.A.; Silva, R.F.; Monteiro, F.J.; Santos, J.D. Microstructural Dependence of Young’s and Shear Moduli of P2O5 Glass Reinforced Hydroxyapatite for Biomedical Applications. Biomaterials 2000, 21, 749–754. [Google Scholar] [CrossRef]
- Guštin, A.; Sedlaček, M.; Žužek, B.; Podgornik, B.; Kevorkijan, V. Analysis of the Surface-Preparation Effect on the Hardness-Measurement Uncertainty of Aluminium Alloys. Mater. Tehnol. 2020, 54, 845–852. [Google Scholar] [CrossRef]
- Shikina, N.D.; Medvedkina, O.N.; Popova, E.S.; Tagirov, R.B.; Shazzo, Y.K.; Khodakovsky, I.L. Experimental Study of the ZrO2 Solubility in Water Solutions of Perchloric Acid at 150 °C. Vestn. Otd. Nauk. Zemle RAN 2011, 3, NZ6099. [Google Scholar] [CrossRef]
- Lee, Y.-I.; Kim, Y.-J. Effect of Different Compositions on Characteristics and Osteoblastic Activity of Microporous Biphasic Calcium Phosphate Bioceramics. Mater. Technol. 2017, 32, 496–504. [Google Scholar] [CrossRef]
- Davari, A.; Daneshkazemi, A.; Ataei, E.; Vatanpour, M.; Abdollahi, H. Effects of Bleaching and Remineralising Agents on the Surface Hardness of Enamel. J. Dent. Shiraz Univ. Med. Sci. 2012, 13, 156–163. [Google Scholar]
- Kaewsichan, L.; Riyapan, D.; Prommajan, P.; Kaewsrichan, J. Effects of Sintering Temperatures on Micro-Morphology, Mechanical Properties, and Bioactivity of Bone Scaffolds Containing Calcium Silicate. ScienceAsia 2011, 37, 240. [Google Scholar] [CrossRef]
- Kokubo, T.; Takadama, H. How Useful Is SBF in Predicting in Vivo Bone Bioactivity? Biomaterials 2006, 27, 2907–2915. [Google Scholar] [CrossRef] [PubMed]

| Compound | Weight % |
|---|---|
| ZrO2 | 79.2400 |
| MgO | 11.0600 |
| SiO2 | 7.7600 |
| HfO2 | 0.5780 |
| MoO3 | 0.5700 |
| Y2O3 | 0.4230 |
| Cs2O | 0.1660 |
| Fe2O3 | 0.0344 |
| CdO | 0.0339 |
| CuO | 0.0331 |
| K2O | 0.0290 |
| Ag2O | 0.0205 |
| SrO | 0.0201 |
| Samples | Crystallinity (%) | Crystal Size ZrSiO4 (nm) | Crystal Size t-ZrO2 (nm) |
|---|---|---|---|
| Zr0.99Mg0.01O2 | 53.56 | 4002 | 771 |
| Zr0.95Mg0.05O2 | 51.70 | 202 | 164 |
| Zr0.90Mg0.10O2 | 52.41 | 425 | 193 |
| Zr0.85Mg0.15O2 | 50.87 | 2434 | 225 |
| Sample | Crystallinity (%) | Crystal Size t-ZrO2 (nm) |
|---|---|---|
| Zr0.99Mg0.01O2 | 91.28 | 78 |
| Zr0.95Mg0.05O2 | 95.32 | 81 |
| Zr0.90Mg0.10O2 | 96.35 | 97 |
| Zr0.85Mg0.15O2 | 95.85 | 112 |
| Samples Mg-PSZ | Monoclinic (%) | Tetragonal (%) |
|---|---|---|
| Zr0.99Mg0.01O2 | 2.1 | 97.9 |
| Zr0.95Mg0.05O2 | 0.5 | 99.5 |
| Zr0.90Mg0.10O2 | 2.4 | 97.6 |
| Zr0.85Mg0.15O2 | 2.7 | 96.2 |
| Samples | Hardness (HV) | Hardness (MPa) |
|---|---|---|
| ZrO2 [21] | 59.5 | 554 |
| Zr0.99Mg0.01O2 | 407 | 3991 |
| Zr0.95Mg0.05O2 | 98.9 | 969.9 |
| Zr0.90Mg0.10O2 | 537 | 5266 |
| Zr0.85Mg0.15O2 | 125 | 1226 |
| Ion Concentration (mM) | |||||||
|---|---|---|---|---|---|---|---|
| Na+ | K+ | Mg2+ | Ca2+ | Cl− | HCO3− | HPO4− | |
| Plasma | 142.0 | 5.0 | 1.5 | 2.5 | 103.0 | 27.0 | 1.0 |
| SBF | 142.0 | 5.0 | 1.5 | 2.5 | 148.8 | 4.2 | 1.0 |
Disclaimer/Publisher’s Note: The statements, opinions and data contained in all publications are solely those of the individual author(s) and contributor(s) and not of MDPI and/or the editor(s). MDPI and/or the editor(s) disclaim responsibility for any injury to people or property resulting from any ideas, methods, instructions or products referred to in the content. |
© 2023 by the authors. Licensee MDPI, Basel, Switzerland. This article is an open access article distributed under the terms and conditions of the Creative Commons Attribution (CC BY) license (https://creativecommons.org/licenses/by/4.0/).
Share and Cite
Yusuf, D.; Maryani, E.; Mardhian, D.F.; Noviyanti, A.R. Evaluation of Structural Stability, Mechanical Properties, and Corrosion Resistance of Magnesia Partially Stabilized Zirconia (Mg-PSZ). Molecules 2023, 28, 6054. https://doi.org/10.3390/molecules28166054
Yusuf D, Maryani E, Mardhian DF, Noviyanti AR. Evaluation of Structural Stability, Mechanical Properties, and Corrosion Resistance of Magnesia Partially Stabilized Zirconia (Mg-PSZ). Molecules. 2023; 28(16):6054. https://doi.org/10.3390/molecules28166054
Chicago/Turabian StyleYusuf, Dedek, Eneng Maryani, Deby Fajar Mardhian, and Atiek Rostika Noviyanti. 2023. "Evaluation of Structural Stability, Mechanical Properties, and Corrosion Resistance of Magnesia Partially Stabilized Zirconia (Mg-PSZ)" Molecules 28, no. 16: 6054. https://doi.org/10.3390/molecules28166054
APA StyleYusuf, D., Maryani, E., Mardhian, D. F., & Noviyanti, A. R. (2023). Evaluation of Structural Stability, Mechanical Properties, and Corrosion Resistance of Magnesia Partially Stabilized Zirconia (Mg-PSZ). Molecules, 28(16), 6054. https://doi.org/10.3390/molecules28166054