Article

Few Layer Ti3C2 MXene-Based Label-Free Aptasensor for Ultrasensitive Determination of Chloramphenicol in Milk

Tianjin Key Laboratory of Food Biotechnology, College of Biotechnology and Food Science, Tianjin University of Commerce, Tianjin 300134, China
*
Author to whom correspondence should be addressed.
Molecules 2023, 28(16), 6074; https://doi.org/10.3390/molecules28166074
Submission received: 13 July 2023 / Revised: 9 August 2023 / Accepted: 11 August 2023 / Published: 15 August 2023

Abstract

:
Quantitative detection of veterinary drug residues in animal-derived food is of great significance. In this work, a simple and label-free electrochemical aptasensor for the highly sensitive detection of chloramphenicol (CAP) in milk was successfully developed based on a new biosensing method, where the single- or few-layer Ti3C2 MXene nanosheets functionalized via the specific aptamer by self-assembly were used as electrode modifiers for a glassy carbon electrode (aptamer/Ti3C2 MXene/GCE). Differential pulse voltammetry (DPV), electrochemical impedance spectroscopy (EIS), cyclic voltammetry (CV), scanning electron microscopy (SEM), atomic force microscope (AFM), and so on were utilized for electrochemical and morphological characterization. Under the optimized conditions, the constructed aptasensor exhibited excellent performance with a wider linearity to CAP in the range from 10 fM to 1 μM and a low detection limit of 1 fM. Aptamer/Ti3C2 MXene/GCE demonstrated remarkable selectivity over other potentially interfering antibiotics, as well as exceptional reproducibility and stability. In addition, the aptasensor was successfully applied to determine CAP in milk with acceptable recovery values of 96.13% to 108.15% and relative standard deviations below 9%. Therefore, the proposed electrochemical aptasensor is an excellent alternative for determining CAP in food samples.

Graphical Abstract

1. Introduction

Animal-derived foods such as milk and eggs are an important part of daily diets. With the widespread use of veterinary drugs for the treatment and prevention of diseases in animals and the promotion of animal growth, the possible presence of veterinary drug residues in animal-derived foods is one of the key issues for food safety. Chloramphenicol (CAP), produced by Streptomyces Venezuelan [1], is an effective broad-spectrum antibiotic normally used in animals for treating and preventing infectious diseases [2]. However, excessive use of CAP can result in inevitable residues in animal-derived food, which subsequently bring about serious toxic side effects on human health through the food chain, such as aplastic anemia, gray baby syndrome, leukemia, nausea, diarrhea, and allergic reactions [3]. To date, various analytical methods, including high-performance liquid chromatography [4], liquid chromatography–mass spectrometry [5], and gas chromatography–mass spectrometry [6], have been developed for quantitively determining CAP in food samples. Although these methods are accurate and reliable, they have some inevitable limitations, such as their time-consuming nature, high cost, tedious operation procedures, professional operation skills, and excessive dependence on expensive and sophisticated instruments, all of which impede their application in the real-time monitoring of CAP. In addition, normally used microbial assays and enzyme-linked immuno-sorbent assays also have disadvantages [7,8], including low sensitivity, false positives, and cross-reactions. Otherwise, because they are simple, fast, and highly sensitive, various biosensing strategies for CAP detection have been put forward, such as surface plasmon resonance [9], colorimetric methods [10], fluoroimmunoassays [11], chemiluminescence [12], and electrochemical biosensors [13]. Among them, easy-operation electrochemical biosensors composed of a modifying electrode with functional nucleic acids (FNAs) have gained considerable interest for their better specificity and sensitivity [14].
Among these FNAs, aptamers (short-chain DNA or RNA with a specific sequence) are emerging as a novel class of nucleic-acid-based bio-recognition elements in developing biosensors or bioassays to detect various food contaminants [15], and when those aptamers on the transducer surface bind to a target, electrical or optical signals can be generated for quantification for measuring targets. When aptamers specifically bind to CAP after undergoing adaptive conformational changes [16], the electrochemical response changes, which is related to the concentration of CAP [17]. The aptamer-based electrochemical biosensors (electrochemical aptasensors) relying on the signal molecules labeled in the DNA/RNA strands have relatively better sensitivity. By the way, the existing labeling process makes the fabrication of aptasensors complicated and increases the cost [18,19]. It is expected that label-free aptasensors will be developed to enable sensitive determination of CAP.
In order to further improve the sensitivity of label-free aptasensors, some effective signal amplification strategies have been proposed, including DNA nanostructure self-assembly [20], hybridization chain reaction [21], exonuclease III- and DNAzyme-assisted methods [22], and so on. Especially, nanomaterials are used to enhance the sensitivity of aptasensors. MXene is a new type of metal carbide and metal nitride nanomaterial with a 2D-layered structure, and it has higher metallic conductivity, better biocompatibility, higher electrochemical performance, and a larger hydrophilic and chemical active surface area than traditional 2D materials. So it has been used to construct more sensitive biosensor devices. Feedstocks that are used to synthesize MXene are called MAX phases, and their general formula is Mn+1AXn. The letter M represents an early transition metal, where A stands for an ⅢA or ⅣA element, X could be carbon or nitrogen, and n can be either 1, 2, or 3 [23]. MXenes are usually synthesized by liquid stripping techniques, such as ultrasonic stripping using hydrogen fluoride (HF), by which the A-layer (usually Al) in the MAX phase is selectively etched. Therefore, the chemical structure of MXene is finally expressed by the general formula Mn+1XnTx. Tx represents the terminal groups (-O, -F, and -OH) on the surface of MXene [24]. Ti3C2 is the most commonly utilized of MXene, which can be described as three layers of transition metal Ti covered with two layers of carbon, and a 2D-layered metal carbide with a similar structure to graphene. Since Ti3C2 MXene was successfully prepared in 2011, it has received a lot of attention focusing on electrochemical sensors [25], but there is limited research on aptasensors. The surface of Ti3C2 MXene is rich in oxygen or hydroxyl groups, which facilitate its interaction with other materials via hydrogen bonding, van der Waals interactions, electrostatic interactions, and coordination bonds. Thus, Ti3C2 MXene is considered a suitable matrix for constructing aptasensors. Hongyuan Cui et al. prepared an aptasensor based on Ti3C2 MXene for the detection of two diabetes biomarkers, with a low detection limit of 36 pM for insulin and 45 pM for vaspin [26]. Haiyan Wang et al. prepared cDNA-ferrocene/Ti3C2 MXene nanocomposites to construct an electrochemical aptasensor to detect the breast cancer marker Mucin1. The linear relationship was good in the range of 1 pM~10 μM, and the detection limit of Mucin1 was as low as 0.33 pM [27]. Fengling Yue et al. made an electrochemical aptasensor to detect aminoglycoside antibiotics in milk based on ordered mesoporous carbon @Ti3C2 MXene; the proposed aptasensor presented a wide linear range, and the detection limit was 3.51 nM [28]. Studies have shown that Ti3C2 MXene has a higher affinity for single-stranded DNA (ssDNA) than double-stranded DNA (dsDNA) due to the formation of Ti3C2 MXene-ion-ssDNA [29]. According to the molecular dynamic simulation results, Ti3C2 MXene has almost no hydrogen bond with DNA strands, and its interaction with DNA is probably realized through the ion bridge [30,31]. Moreover, there are also studies indicating that ssDNA may adsorb on the surface of Ti3C2 MXene nanosheets through π–π stacking between the aromatic nucleobases of DNA and graphite structure of MXene [32].
In this work, a simple Ti3C2 MXene-based electrochemical aptasensor with high sensitivity, selectivity, and stability for label-free detection of CAP in milk has been put forward, as shown in Figure 1. The stacking and aggregation of Ti3C2 MXene by van der Waals forces showed weaker electrochemical performance, and on the contrary, single- or fewer-layer Ti3C2 MXene nanosheets could provide more electron transport channels as well as more surface binding sites and a specific interface. When the aptamer specifically binds to CAP, electronic channels reduce, which results in a decrease in the response current related to the concentration of CAP. In addition, selectivity, reproducibility, and stability studies were carried out and obtained results that indicated that aptamer/Ti3C2 MXene/glassy carbon electrode (GCE) had shown an anti-interference property with long-term stability. The feasibility of the proposed aptasensor was verified by the analysis of real milk samples, which suggested that it was a new sensing platform for the detection of CAP in food samples.

2. Results and Discussion

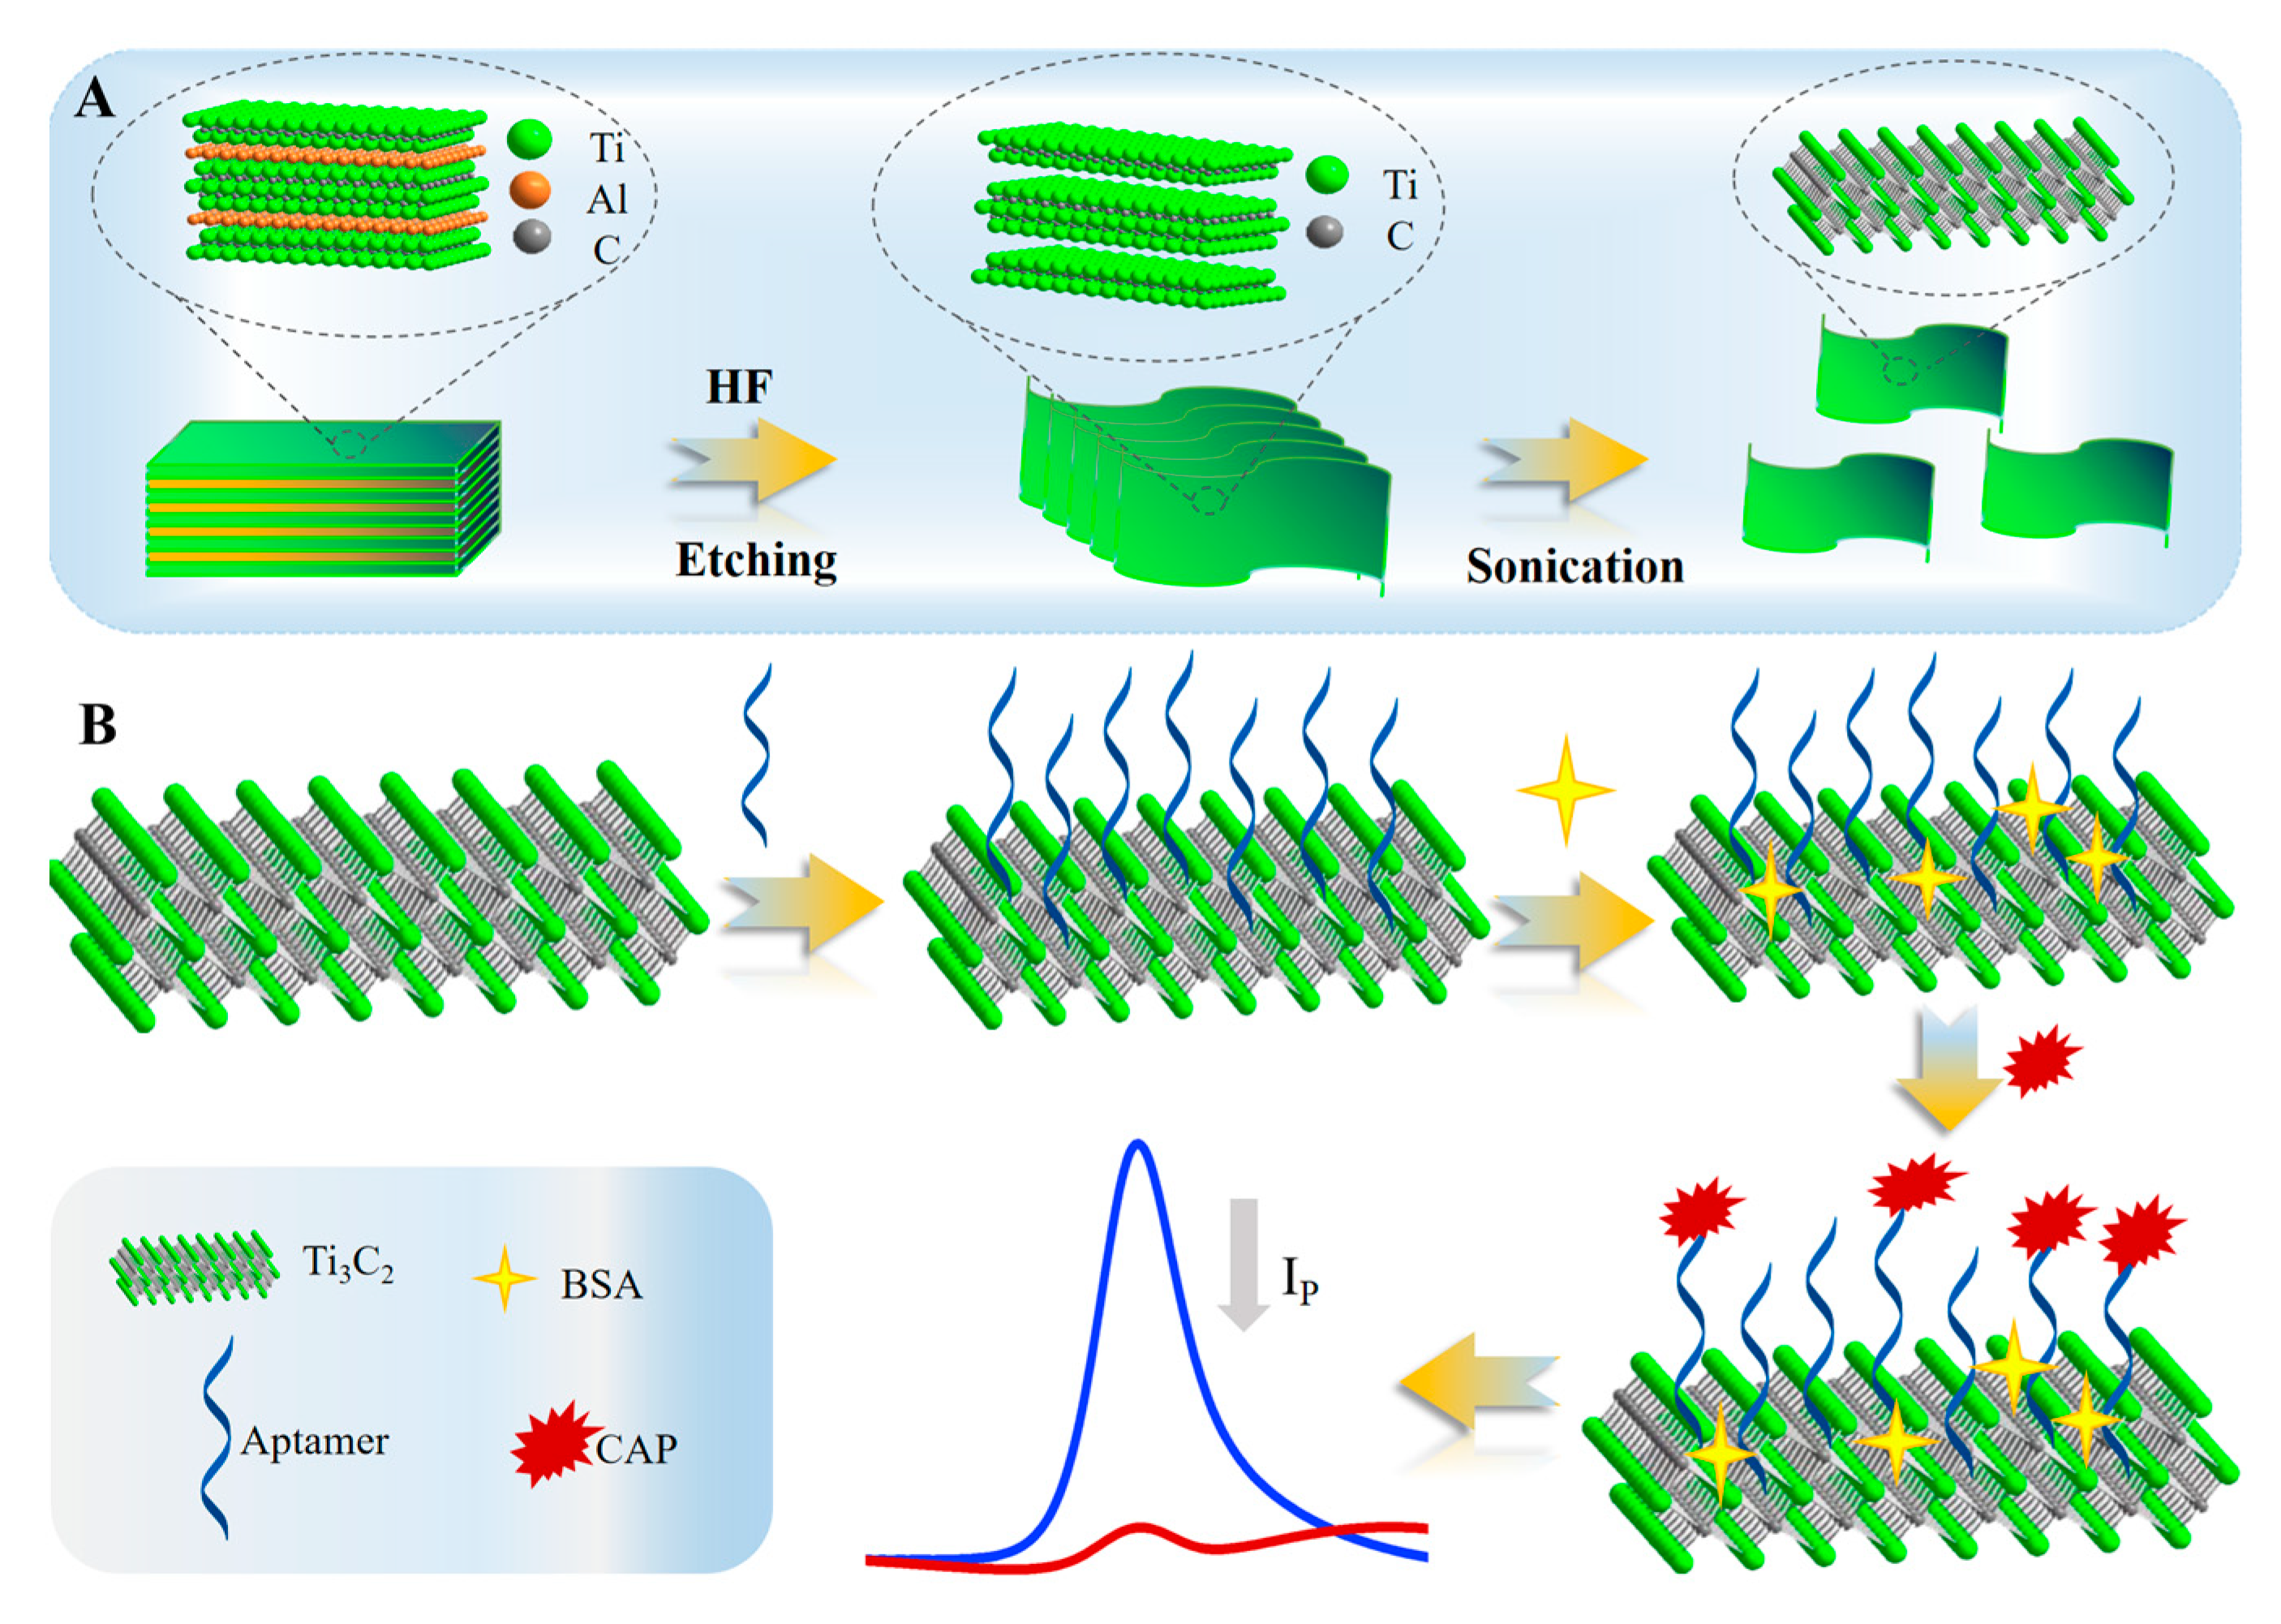
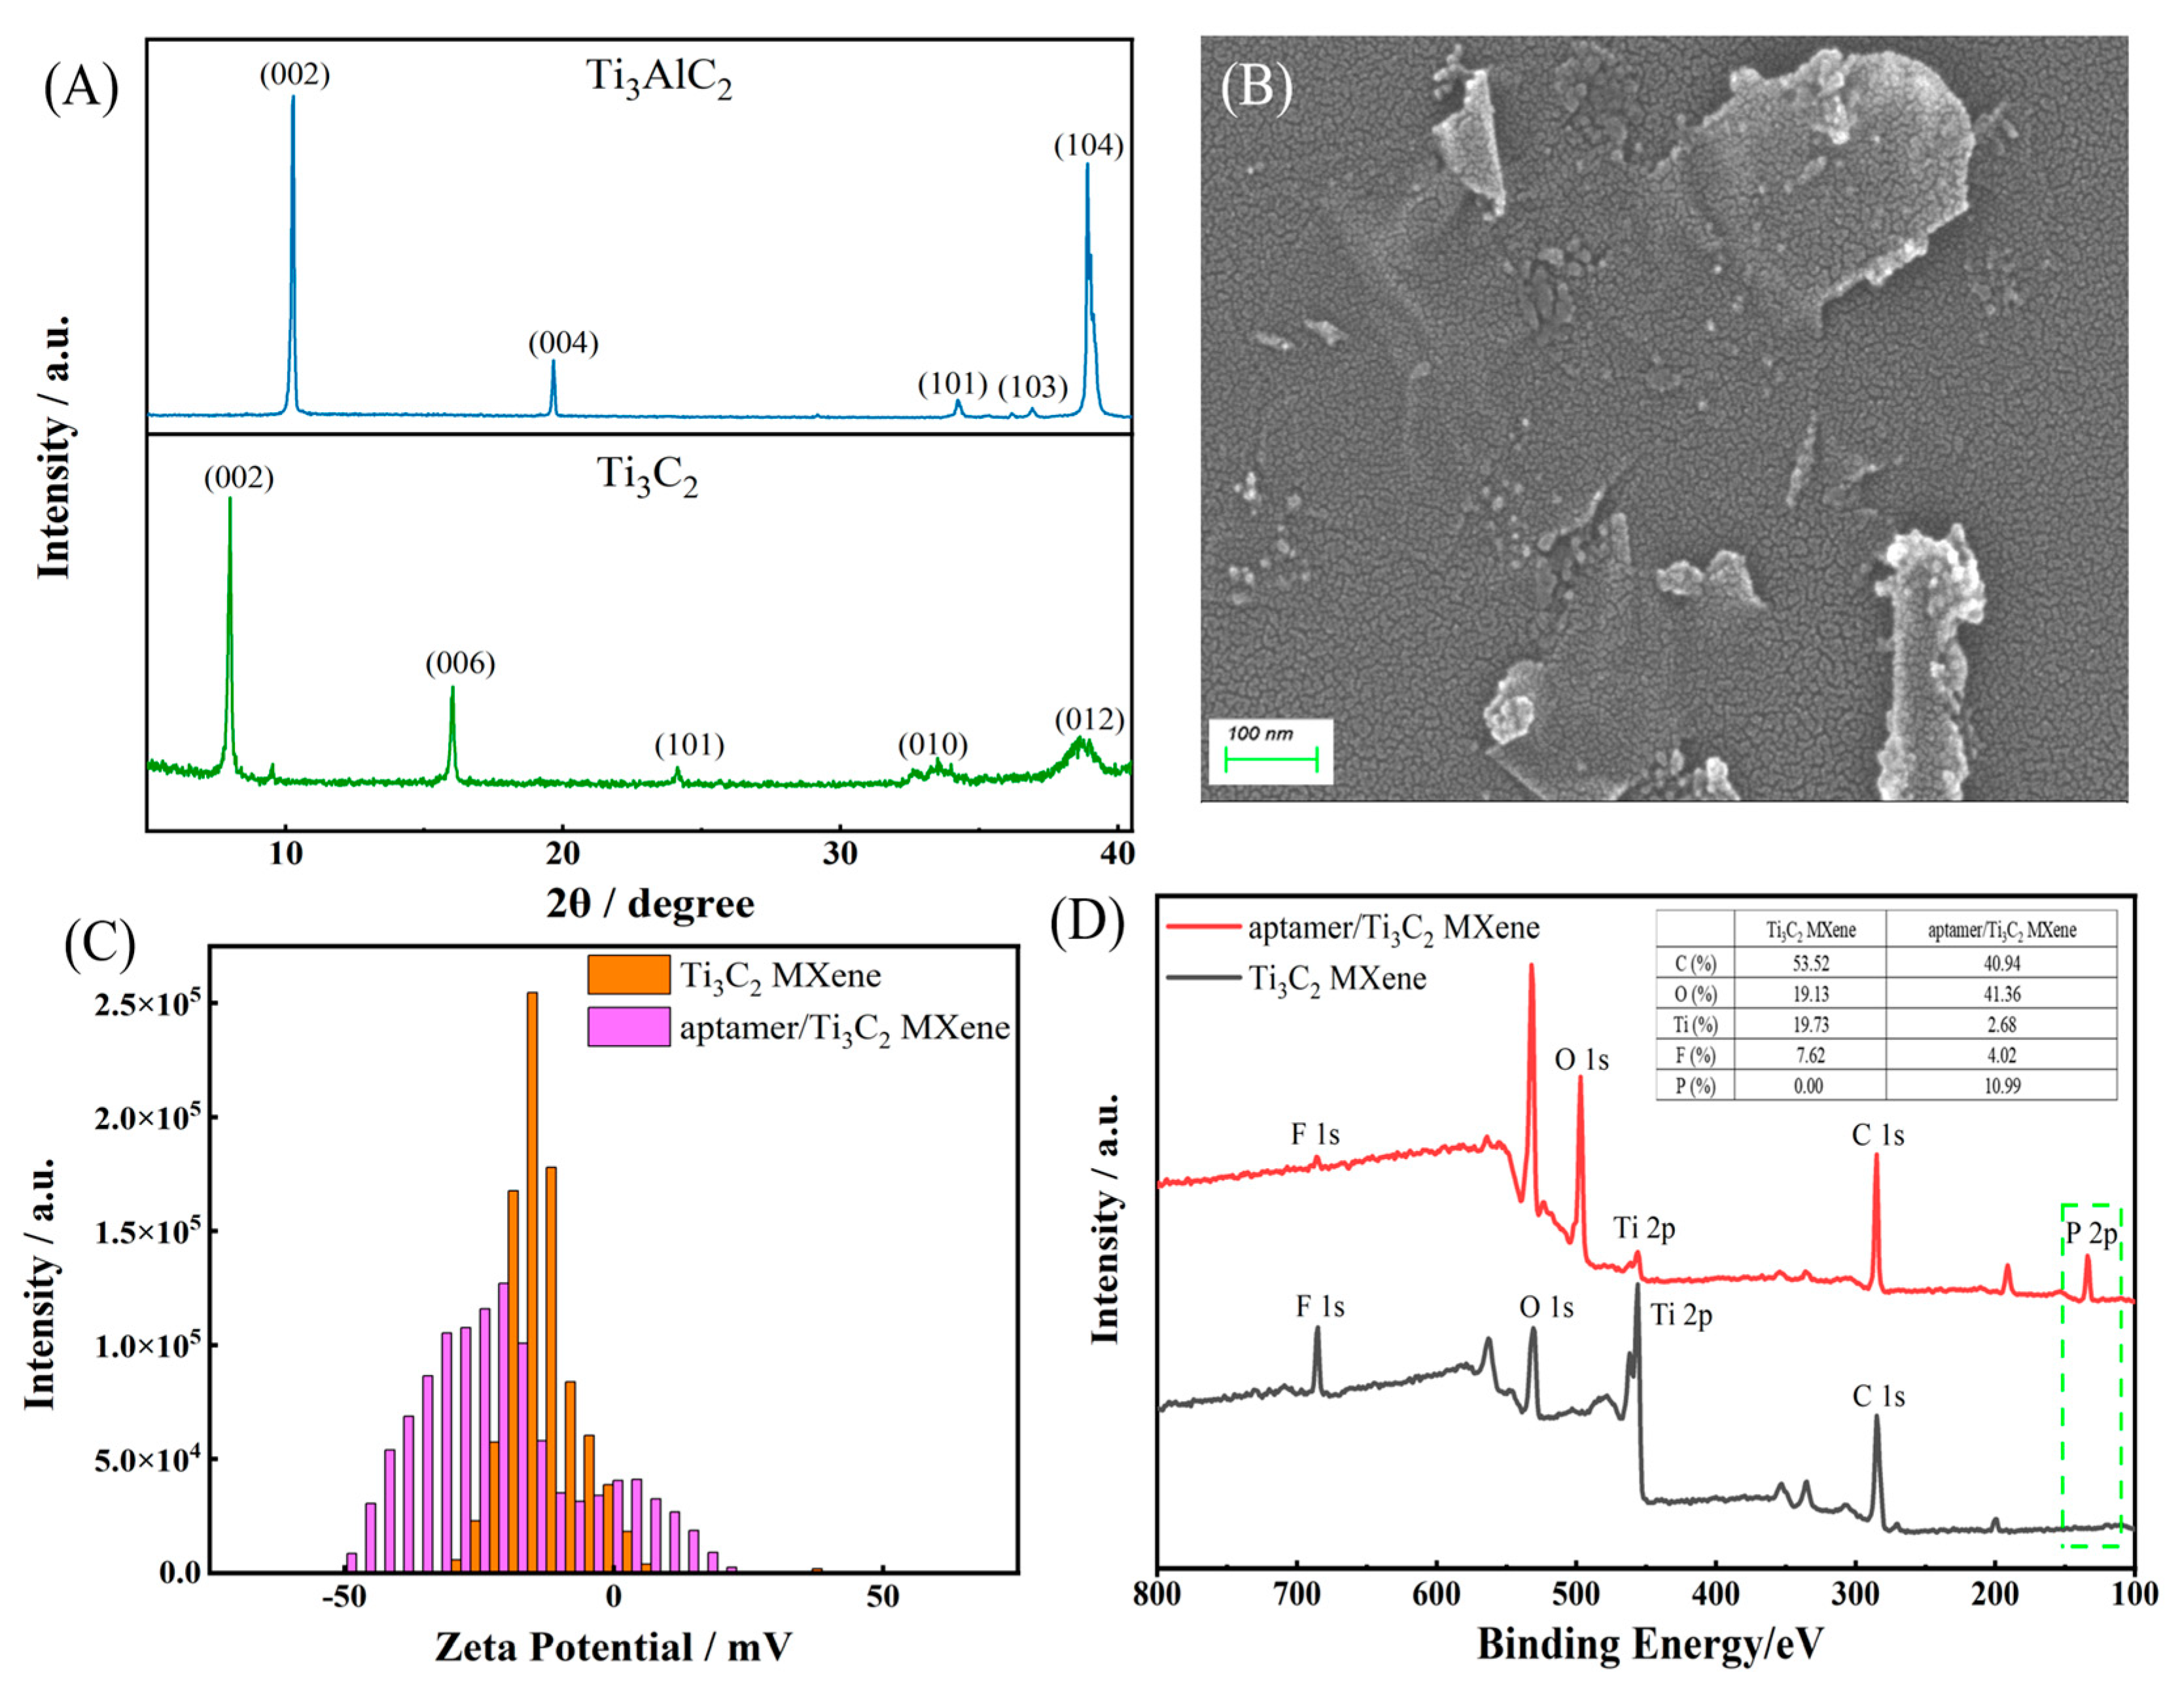
2.1. Characterization of Ti3C2 MXene

The X-ray diffraction (XRD) features of Ti3AlC2 and Ti3C2 MXene are shown in Figure 2A. The (002) peak of Ti3C2 MXene shifted to a lower angle as compared to the commercial Ti3AlC2 phase, suggesting a successful removal of Al layers after HF exfoliation [33]. The appearance of the Ti3C2 MXene peak at approximately 25° was attributed to the (104) diffraction of TiO2, which demonstrated a certain amount of oxides. The morphology and structure of Ti3C2 MXene film were characterized by atomic force microscope (AFM) (Figure S1A,B) and scanning electron microscopy (SEM) (Figure 2D). Figure 2B,C shows the continuous coverage of Ti3C2 MXene on the electrode surface, that the thickness of films was less than 10 nm, and that the root mean square surface roughness was about 1.29 nm, corresponding to a single or few Ti3C2 MXene layers [34]. SEM images in Figure S2 showed a Ti3C2 cluster with the typical multilayer structure after HF exfoliation. Figure 2D revealed the typical morphology of a few layers of Ti3C2 MXene with a wrinkled paper-like surface, which could provide potential sites for effective ion and electron transport [35]. In order to explore the interaction between Ti3C2 MXene and aptamers, zeta potential was applied to investigate the charged states of Ti3C2 MXene and aptamer/Ti3C2 MXene as shown in Figure 2C, which indicated that they were all negatively charged and their combination may not be caused by electrostatic reaction [36]. To further validate the binding method between the aptamer and Ti3C2 MXene, X-ray photoelectron spectroscopy (XPS) was employed to analyze the elemental components and chemical states of both Ti3C2 MXene and the aptamer/Ti3C2 MXene. As presented in Figure 2D, the characteristic peaks of Ti 2p (455.8 eV), C 1s (284.8 eV), O 1s (530.5 eV), and F 1s (685.3 eV) elements appeared in the wide spectra of the Ti3C2 MXene and aptamer/Ti3C2 MXene. The appearance of P 2p (133.5 eV) and the increase in the percentage content of oxygen (19.13% to 41.36%) indicated the effective combination of Ti3C2 MXene and aptamer. The peak splitting spectrum of Ti, C, O, F, and P shown in Figure S3 further proved the effective synthesis of Ti3C2 MXene and the successful combination of Ti3C2 MXene and aptamer. Specifically, the Ti 2p XPS spectrum of Ti3C2 MXene was separated into Ti 2p3/2 and Ti 2p1/2 spin–orbit doublets, which showed five valence states ascribed to Ti (455.3 eV), Ti2+ (456.1/463.2 eV), Ti3+ (457.4 eV), Ti−C (461.6 eV), and TiO2 (459.4 eV). For the C 1s spectrum, the peak at 282.2 eV corresponded to C−Ti, whereas the peaks at 284.8, 286.5, and 288.9 eV corresponded to C−C, C−O, and C=O, respectively. The large component of C−C indicated the graphene−like nanostructure of the proposed Ti3C2 MXene nanosheets, maybe providing a strong π–π* stacking interaction with aptamer strands. Moreover, the O 1s spectrum showed three different oxygen bonds corresponding to O−Ti/O−H, O−C/O−H, and O−Ti, which were assigned to 529.9, 530.8, and 531.9 eV, respectively [37]. After being modified with an aptamer, the peak of Ti 2p spectra corresponding to the Ti2+ at 463.2 eV disappeared. Furthermore, the P 2p spectrum exhibited two peaks; the typical peak was attributed to the phosphate group (PO4), and the other may be related to the chelation interaction between the PO4 and Ti2+ [38].

2.2. Electrochemical Characterization of the Aptasensor Assembly Process

The change in the redox peak current (IP) in cyclic voltammetry (CV) is related to the electron transfer rate constant and thus the electron transfer resistance at different modification steps. The electrochemical measurements were performed in 5 mM [Fe(CN)6]3−/4− at a scan rate of 0.1 V/s over a potential range of −0.4 V–0.8 V, respectively. CV for bare GCE, Ti3C2 MXene/GCE, aptamer/Ti3C2 MXene/GCE, Bovine serum albumin (BSA)/aptamer/Ti3C2 MXene/GCE, and CAP/BSA/aptamer/Ti3C2 MXene/GCE incubated electrodes are plotted in Figure 3. It can be seen from the black line and the red line that the current response of the electrode modified with Ti3C2 MXene was higher than that of the bare GCE. This was because of the high conductivity of Ti3C2 MXene, which could enhance the electron transfer rate. Subsequently, when Ti3C2 MXene/GCE was modified with an aptamer, it resulted in a decreased IP (blue line) due to the negatively charged phosphate backbone in the aptamer that has a strong electrostatic repulsion on [Fe(CN)6]3−/4− [39]. The excess active site was occupied with BSA to avoid nonspecific adsorption, and a continued decrease in the current was observed (green line), indicating that the modified BSA inhibited electron transfer to the electrode surface. The IP decreased after the aptasensor was incubated with CAP (purple line), which could be ascribed to the formation of a complex, thereby obstructing electron transfer to the electrode surface.
Nyquist plots of impedance spectra for different modification steps at GCE provide detailed information on the charge transfer mechanisms in the modification process, as shown in Figure 3B. The diameter of the semicircle in the Nyquist plot determines the charge transfer resistance of the electrode surface, and larger semicircles are obtained when there are slow electron transfer kinetics. The bare GCE exhibited a large semicircle domain (black line), implying a very large electron transfer resistance. After the electrode was assembled with Ti3C2 MXene, the resistance significantly decreased (red line) as a result of improved conductivity by facilitating more electron transfer to the electrode interface. The immobilization of the aptamer induced an increase in resistance (blue line) due to the negatively charged phosphate backbone in the aptamer. This acted as an electrostatic barrier and repelled [Fe(CN)6]3−/4− anions, which retarded the electron transfer to the electrode surface. Then, the resistance increased upon incubation with BSA (green line) and increased upon incubation with CAP (purple line) due to the reduced flow of electrons from the solution to the surface of the electrode. These electrochemical impedance measurement (EIS) results were complementary to CV, thereby indicating the successful fabrication of the aptasensor.

2.3. Optimization of Experimental Conditions

To improve the analytical performance of the constructed electrochemical aptasensor, the experimental conditions, including the concentration and volume of Ti3C2 MXene, the concentration of aptamer, the incubation time of aptamer, and the incubation time of CAP, were optimized, as shown in Figure 4. As seen in Figure 4A, with the increase in the Ti3C2 MXene concentration in the range of 0–0.25 mg/mL, the IP became higher, which was attributed to the fact that more electronic channels were provided to accelerate the transfer of electrons. However, when the concentration of Ti3C2 MXene was higher than 0.25 mg/mL, the excess Ti3C2 MXene would agglomerate on the electrode surface to form an electronic barrier layer, thus reducing the IP. Thus, 0.25 mg/mL Ti3C2 MXene was selected to fabricate the Ti3C2 MXene/GCE. The volume of Ti3C2 MXene was also investigated, shown in Figure 4B,C, in which the IP increased with the increasing volume at the beginning (0 to 8 μL). The maximum current was obtained with 8 μL of Ti3C2 MXene suspension modified electrode, and the IP decreased as the volume further increased. Similarly, this might be caused by the excess amount of Ti3C2 MXene possibly hindering the electron transfer. Hence, the aptasensor was prepared by 8 μL Ti3C2 MXene suspension modified on the GCE surface for further study.
As depicted in Figure 4D, the change in IP initially increased with the increasing concentration of the aptamer. When the aptamer concentration reached 0.5 μM, the change in IP reached its maximum value; subsequently, it gradually decreased. These observations suggest that the active sites on the surface of Ti3C2 MXene/GCE reach a state of complete saturation when the aptamer concentration reaches 0.5 μM. As the aptamer concentration continues to increase, over-saturation of the aptamer at the electrode surface will hinder electron transfer between the electrode surface and [Fe(CN)6]3−/4− [39]. Therefore, a suitable concentration of 0.5 μM was selected for subsequent experiments. Immediately after, the influence of the aptamer incubation time on the aptasensor was studied, as shown in Figure 4E. The CAP aptamer was immobilized on the electrode surface and allowed to incubate for 1 h, 2 h, 3 h, 4 h, and 5 h, respectively. It was observed that the change in IP reached its maximum at 2 h and subsequently stabilized, which indicated that the aptamer reached its saturation point at 2 h. Therefore, 2 h was considered the optimal incubation time for aptamer immobilization in subsequent experiments. The incubation time of CAP is also an important factor affecting aptasensor performance, which was optimized, shown in Figure 4F. The change in IP reached its maximum value when the CAP incubation time was 40 min, and it was subsequently stabilized. These results suggest that a prolonged incubation time can provide a more sufficient reaction, bigger deviations of charge and resistance can be induce on an aptasensor, and then the increased IP can be measured. Thus, the optimal incubation time for CAP in subsequent experiments was selected as 40 min.

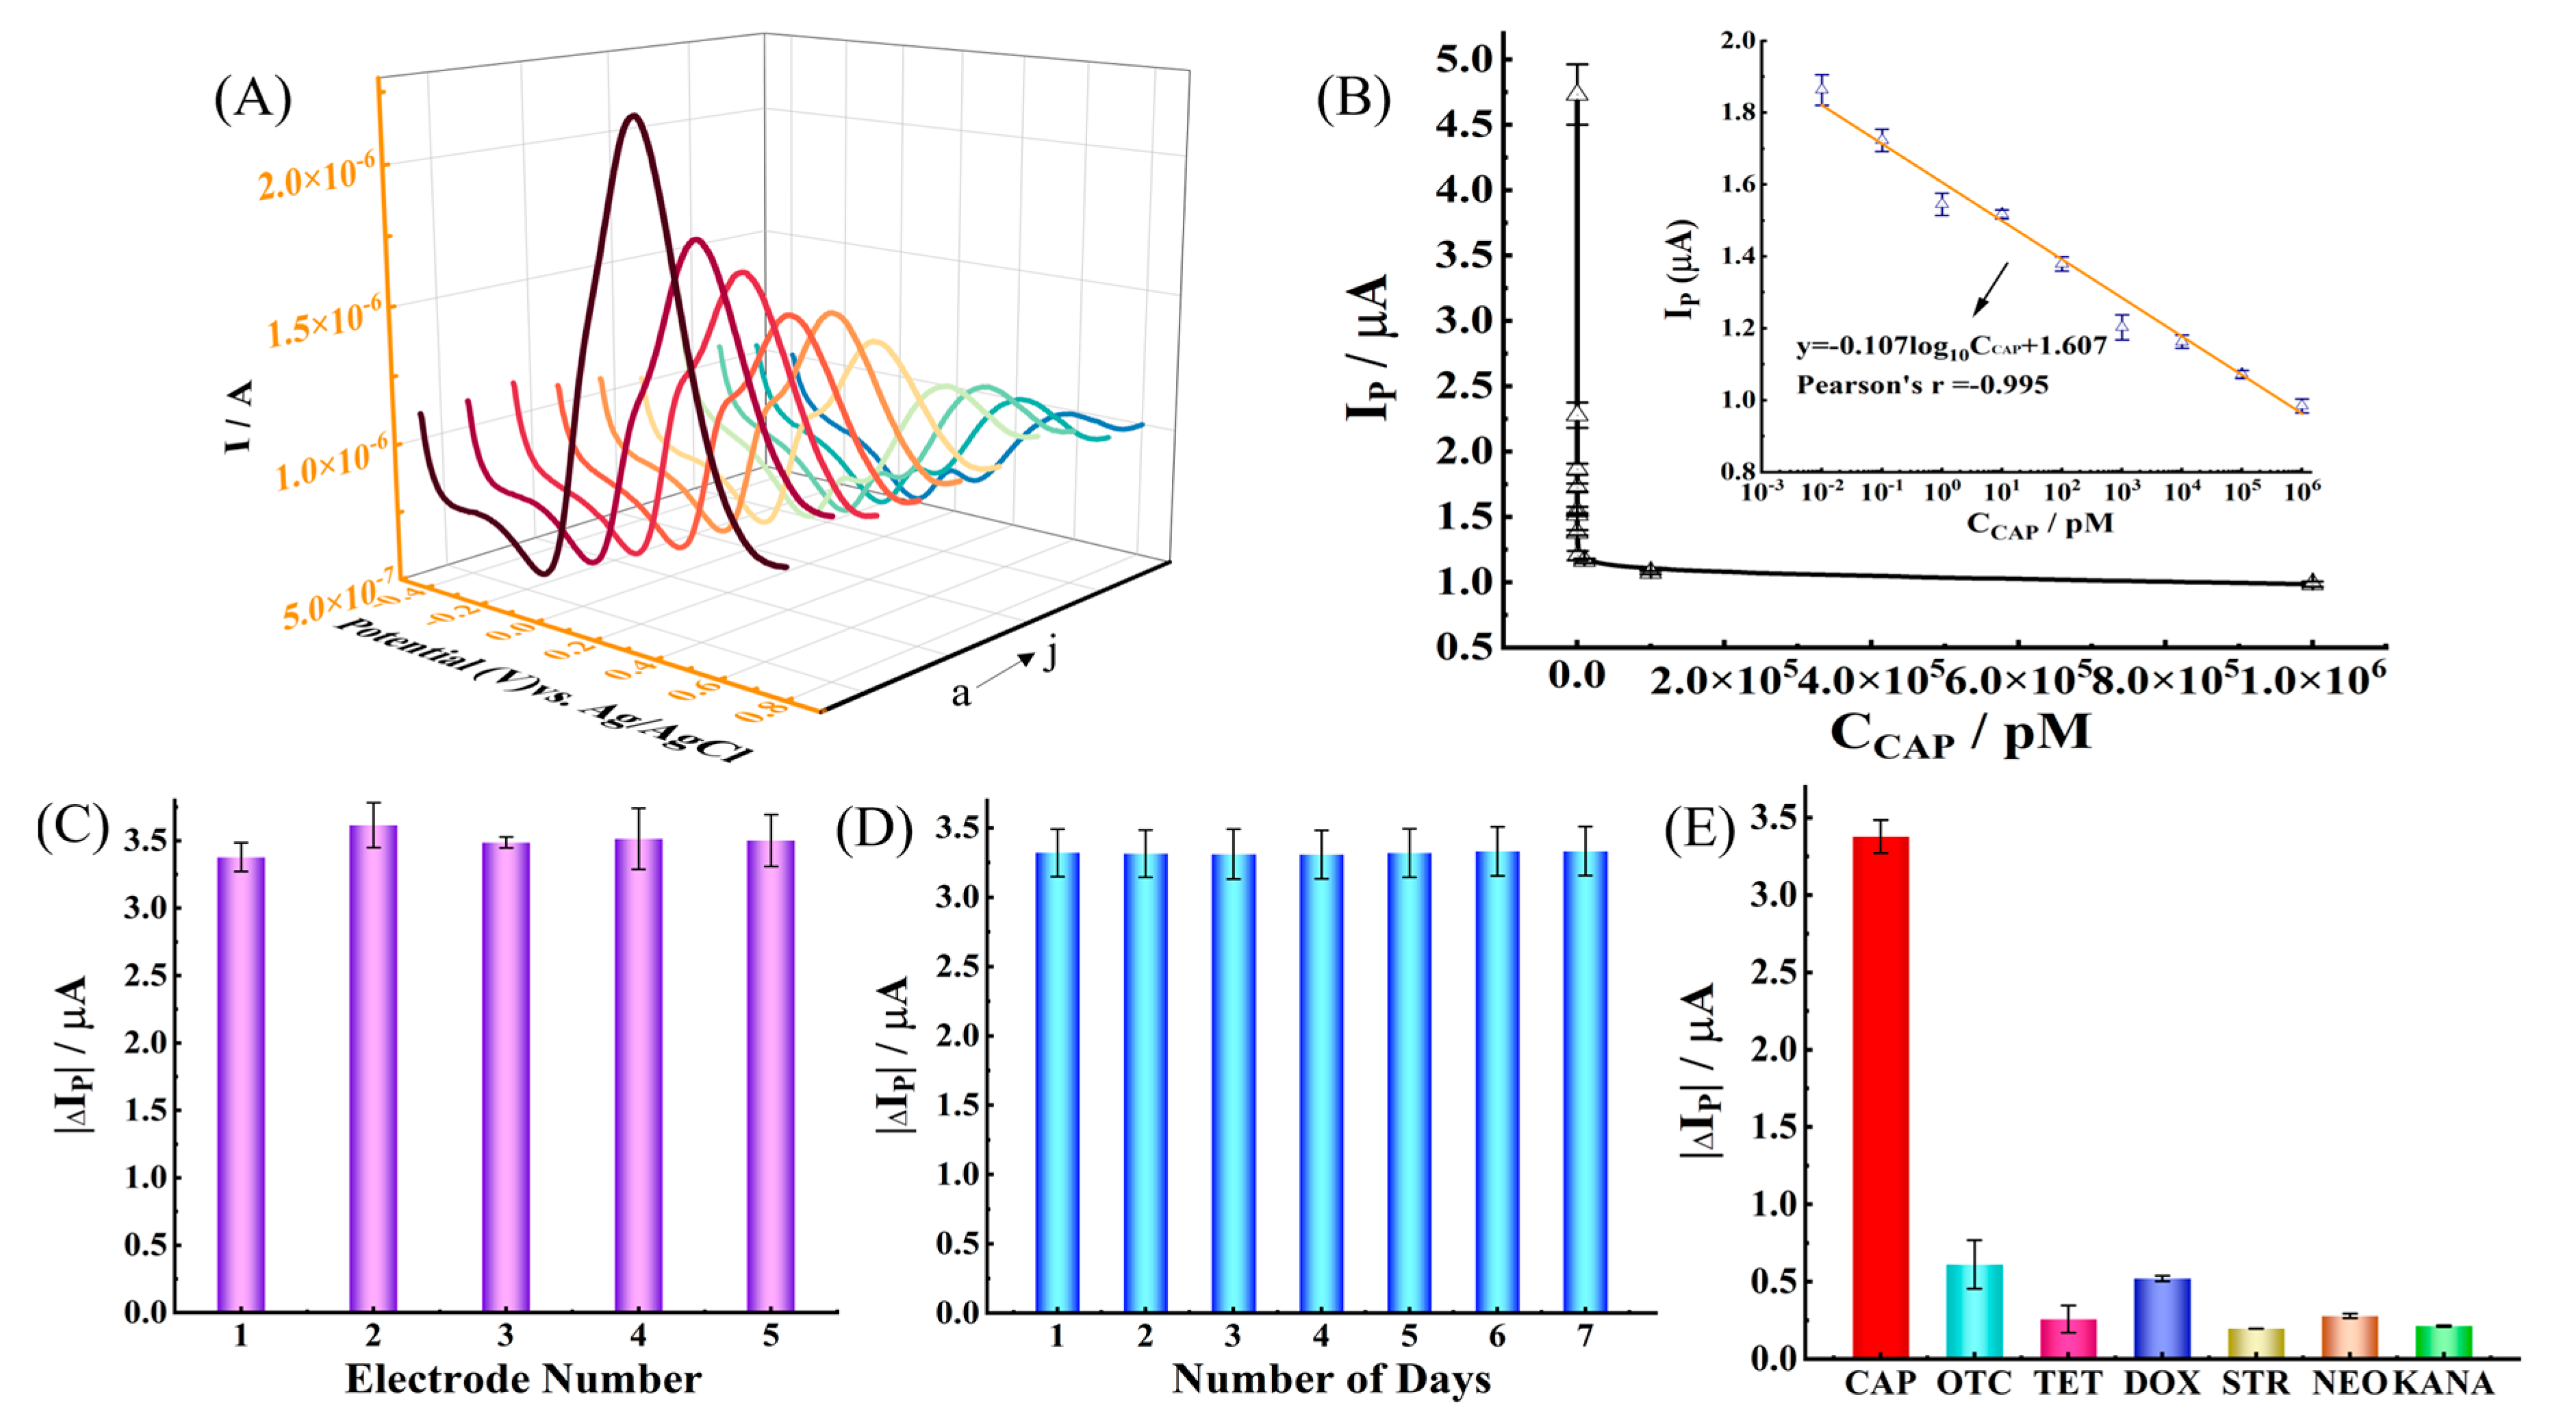
2.4. Analytical Performance of the Electrochemical Aptasensors

For the purpose of evaluating the performance of the prepared CAP aptasensor, the electrochemical responses of the sensors modified with different concentrations of CAP were measured by differential pulse voltammetry (DPV) under optimal conditions. In Figure 5A, it is noted that the IP decreased as the concentration of CAP increased. A linear relationship was found between IP and the concentration in the range of 10 fM–1 μM. The calibration curve is y = −0.107log10CCAP + 1.607 (Pearson’s r = 0.995), and the limit of detection is 1 fM. In addition, the prepared aptasensor in this work was compared with previous reports, and the results are shown in Table 1. Compared with previous reports, the aptasensor has the merits of being simple, low-cost, a wider linear range, and having a lower detection limit.
The reproducibility of aptamer/Ti3C2 MXene/GCE was evaluated by DPV analysis of five identically prepared electrodes (Figure 5C). The relative standard deviation (RSD, n = 3) was 4.19% for CAP, showing that the aptamer/Ti3C2 MXene/GCE had very good reproducibility. The stability of the sensor was also tested by measuring the current responses for a week (Figure 5D). For 100 nM CAP, the RSD was 5.26%, and the IP for CAP was reduced by 1.38% by the end of one week, depicting their acceptable stability. Generally, the aptasensor maintained its sensitivity for a week without significantly losing its current response. In order to evaluate the specificity of the developed electrochemical aptasensor, oxytetracycline (OTC), tetracycline (TET), doxycycline hydrochloride (DOX), streptomycin (STR), neomycin (NEO), and kanamycin (KANA) were used as interference substances. The effects of them on the current responses were assessed by DPV, as shown in Figure 5E. The response of the aptasensor to interference substances was significantly lower than CAP, indicating that the electrochemical responses were unaffected in the presence of potentially interfering antibiotics.

2.5. Detection of Chloramphenicol in Real Samples

In this experiment, the marked milk samples were taken as artificially contaminated milk and used for analysis of real samples so as to verify the feasibility of this method for detecting CAP in real food samples. The recovery rate of CAP was calculated based on the added value and the detected value in the same solution. Trace amounts of CAP standard solutions (10 pM, 103 pM, 104 pM, and 105 pM) were added to the milk samples for detection. The detection data for the four samples are collected, respectively, in Table 2, with recovery rates ranging from 96.13% to 108.15% (n = 3), and the RSD varying from 2.637% to 8.342%. These results showed that the prepared electrochemical aptasensor based on Ti3C2 MXene can reliably detect CAP in milk.

3. Materials and Methods

3.1. Materials

The oligonucleotides of specific aptamer were synthesized by Sangon Biotechnology Co. Ltd. (Shanghai, China), which is 5′-ACTTC AGTGA GTTGT CCCAC GGTCG GCGAG TCGGT GGTAG-3′. The titanium aluminum carbide (Ti3AlC2, 95%) was purchased from Forsman Scientific Co., Ltd. (Beijing, China). CAP, DOX, OTC, STR, and KANA were purchased from Aladdin Biochemical Technology Co., Ltd. (Shanghai, China). NEO was purchased from Chaojiuba Biotechnology Co., Ltd. (Chengdu, China). TET was purchased from Yuanye Biotechnology Co., Ltd. (Shanghai, China). The HF was procured from Macklin. Phosphate buffered solution (PBS) (0.1 M, PH 7.4) was purchased from Yida Technology Co., Ltd. (Quanzhou, China). KCl was purchased from North Tianyi Chemical reagent Factory (Tianjin, China). Potassium ferrocyanide (K4[Fe(CN)6]·3H2O) was purchased from Kaitong Chemical Reagent Co., Ltd. (Tianjin, China). Potassium hexacyanoferrate (K3[Fe(CN)6]) was purchased from Bo Hua Chemical Reagent Co., Ltd. (Tianjin, China). Acetic acid (HAc, 36%) was purchased from Guangfu Technology Development Co., Ltd. (Tianjin, China). BSA was purchased from Aladdin Chemical Reagent Co., Ltd. (Beijing, China). Deionized water, distilled water, and ultra-pure (UP) water were used throughout the experiment.

3.2. Apparatus

All electrochemical measurements were conducted using the conventional three-electrode system, in which a GCE was employed as the working electrode (WE), a platinum wire was utilized as the counter electrode (CE), and a saturated Ag/AgCl electrode was used as the reference electrode (RE). Electrochemical experiments on CV and DPV were carried out with a CHI 660E electrochemical workstation (Beijing Huakoptian Technology Co., Ltd., Beijing, China). CV was recorded in the potential range of −0.2–0.8 V (vs. Ag/AgCl) and −0.2–0.6 V (vs. Ag/AgCl) in a 0.1 M PBS (PH 7.4) for the volume of Ti3C2 MXene and concentration of Ti3C2 MXene, respectively. Meanwhile, CV was recorded in the potential range of −0.4–0.8 V (vs. Ag/AgCl) in a 5 mM Fe(CN)63−/4− electrolyte solution containing 0.1 M KCl for optimizing the other experimental conditions. DPV was measured in the potential range of −0.4–0.8 V (vs. Ag/AgCl) in a 5 mM Fe(CN)63−/4− electrolyte solution containing 0.1 M KCl to determine the concentration of CAP.
The morphology of the prepared materials was characterized using SEM (S-3500 N, Hitachi, Tokyo, Japan) and AFM (Dimension Icon Bruker, Billerica, MA, USA), respectively. XPS was used for the element analysis, which was performed on an Axis Ultra DLD instrument (Kratos Analytical Ltd., Manchester, UK). XRD (Rigaku Co., Tokyo, Japan) was employed to analyze the structure of Ti3C2 MXene. The Zeta potential values of Ti3C2 MXene and aptamer/Ti3C2 MXene were investigated utilizing a Zetasizer nano-particle potentiometer (Tianjin Xina Intelligent Technology Co., Ltd., Tianjin, China).

3.3. Synthesis of Ti3C2 MXene

Ti3C2 MXene was synthesized utilizing Ti3AlC2 as the precursor by means of etching Al in HF solution (Figure 1A) [47]. The synthesis steps were as follows: First, 10.0 g of Ti3AlC2 powder was weighed and slowly added to 40% HF solution (100 mL) in a Teflon container. The mixture was stirred continuously at room temperature for 3 h and then diluted with deionized water (300 mL). The resulting diluted solution was centrifuged at 1467 RCF (relative centrifugal force) for 15 min. The sediment was collected and washed with deionized water until the PH reached 7.0. Then, the cleaned precipitate was vacuum dried at 100 °C for 6 h to obtain Ti3C2 MXene multilayer film. Afterward, 2.5 g of dry powder was weighed and added into distilled water (400 mL). After ultrasonic treatment for 2 h, the supernatant was centrifuged (367 RCF) for 15 min, and the supernatant was filtered by 0.22 mm filter membrane. After drying at 100 °C for 24 h, Ti3C2 MXene powder with single or fewer layers was obtained.

3.4. Construction of the Aptasensor

The procedure for making the aptasensor is illustrated in Figure 1B. Briefly, the GCE was polished with 0.3 μm and 50 nm alumina slurry until the surface of the electrode was specular sequentially, followed by thorough washing with ethanol solution and distilled water, respectively. Then, the prepared Ti3C2 MXene suspension (0.25 mg/mL, 8 μL) was dropped on the polished GCE (Ti3C2 MXene/GCE) and dried directly at room temperature. After rinsing with the deionized water, the modified electrode was incubated with aptamer solution (0.5 μM) for 2 h in air (aptamer/Ti3C2 MXene/GCE). Subsequently, the electrode was washed with deionized water to remove unbound aptamers. Due to the high affinity of Ti3C2 MXene towards ssDNA, it can facilitate the attachment of aptamer onto the electrode surface. Subsequently, the aptamer/Ti3C2 MXene/GCE was treated with 1% BSA (10 μL) to block non-specific binding sites and incubated at 4 °C for 1 h. After being thoroughly washed by deionized water several times, the prepared modified electrode (BSA/aptamer/Ti3C2 MXene/GCE) was finally stored at 4 °C for subsequent experiments.

3.5. Milk Sample Measurement

Real samples were purchased from a local supermarket (Tianjin, China) and analyzed for CAP. Firstly, 10 mL of UP water was used to dilute 10 mL of milk sample. Then, 20% HAc was added to precipitate the protein, and the diluted milk sample was adjusted to pH 4.6. Centrifuging (9168 RCF) for 25 min to remove the precipitated protein and retain the supernatant. Then, adjust the pH to 7.0. Therewith, the sample was filtered by 0.22 μm filter membrane [48]. Finally, different concentrations of CAP (10 pM, 1 nM, 10 nM, and 100 nM) were added to the milk samples and detected by the proposed electrochemical aptasensor. According to the detection results, the recovery rate was calculated, and the practicability of the sensor was evaluated.

4. Conclusions

In conclusion, a simple, environmentally friendly, highly selective, and sensitive electrochemical aptasensor was developed for determining CAP in milk. The excellent performance of the sensor is attributed to the significantly increased electroactive surface area and conductivity resulting from the extraordinary properties of the Ti3C2 MXene modifier. The proposed sensor manifests prime reproducibility, stability, and high selectivity with a detection range from 10 fM to 1 μM. The aptamer/Ti3C2 MXene/GCE showed an acceptable recovery rate of 96.13–108.15% with an RSD of less than 9% for the electrochemical determination of CAP in milk. Therefore, the proposed electrochemical aptasensor has a high potential for real-time monitoring of CAP in food samples.

Supplementary Materials

The following supporting information can be downloaded at https://www.mdpi.com/article/10.3390/molecules28166074/s1, Figure S1: AFM 2D image and 3D image of Ti3C2 MXene; Figure S2: The SEM images of multilayered Ti3C2 MXene; Figure S3: XPS spectrum of Ti3C2 MXene and aptamer/Ti3C2 MXene: (A) The Ti 2p core spectra of Ti3C2 MXene; (B) The F 1s core spectra of Ti3C2 MXene; (C) The C 1s core spectra of Ti3C2 MXene; (D) The O 1s core spectra of Ti3C2 MXene; (E) The Ti 2p core spectra of aptamer/Ti3C2 MXene; (F) The P 2p core spectra of aptamer/Ti3C2 MXene.

Author Contributions

Conceptualization, F.L. and S.X.; methodology, F.L. and S.X.; software, S.X.; validation, F.L., P.Z. and Z.W.; formal analysis, F.L. and S.X.; investigation, F.L. and S.X.; resources, F.L. and S.X.; data curation, S.X. and P.D.; writing—original draft preparation, F.L. and S.X.; writing—review and editing, Z.W.; visualization, F.L.; supervision, P.Z. and Z.W.; project administration, Z.W. All authors have read and agreed to the published version of the manuscript.

Funding

This research was funded by the National Key Research and Development Program of China (2022YFF1100904) and Tianjin Science and Technology planning project (22YFFCYS00060).

Institutional Review Board Statement

Not applicable.

Informed Consent Statement

Not applicable.

Data Availability Statement

Not applicable.

Acknowledgments

This work was supported by the National Key Research and Development Program of China through Grant 2022YFF1100904 and Tianjin Science and Technology planning project through Grant 22YFFCYS00060.

Conflicts of Interest

The authors declare no conflict of interest.

Sample Availability

Samples of the compounds are available from the authors.

References

  1. Mosher, R.H.; Camp, D.J.; Yang, K.; Brown, M.P.; Shaw, W.V.; Vining, L.C. Inactivation of chloramphenicol by O-phosphorylation. A novel resistance mechanism in Streptomyces venezuelae ISP5230, a chloramphenicol producer. J. Biol. Chem. 1995, 270, 27000–27006. [Google Scholar] [CrossRef] [Green Version]
  2. Zhou, J.; Chen, Y.; Li, W.; Qu, J.; Chen, T.; Wang, Y.; Geng, N. Deciphering the microbial community tolerance mechanism and alteration of antibiotic resistance genes during chloramphenicol wastewater treatment. Int. Biodeter. Biodegr. 2023, 178, 105546. [Google Scholar] [CrossRef]
  3. Aran, G.C.; Bayraç, C. Simultaneous Dual-Sensing platform based on Aptamer-Functionalized DNA hydrogels for visual and fluorescence detection of chloramphenicol and aflatoxin m1. Bioconjugate Chem. 2023, 34, 922–933. [Google Scholar] [CrossRef]
  4. Mehrabi, F.; Ghaedi, M. Magnetic nanofluid based on green deep eutectic solvent for enrichment and determination of chloramphenicol in milk and chicken samples by high-performance liquid chromatography-ultraviolet: Optimization of microextraction. J. Chromatogr. A 2023, 1689, 463705. [Google Scholar] [CrossRef]
  5. Chen, D.; Delmas, J.; Hurtaud-Pessel, D.; Verdon, E. Development of a multi-class method to determine nitroimidazoles, nitrofurans, pharmacologically active dyes and chloramphenicol in aquaculture products by liquid chromatography-tandem mass spectrometry. Food Chem. 2020, 311, 125924. [Google Scholar] [CrossRef]
  6. Shen, J.; Xia, X.; Jiang, H.; Li, C.; Li, J.; Li, X.; Ding, S. Determination of chloramphenicol, thiamphenicol, florfenicol, and florfenicol amine in poultry and porcine muscle and liver by gas chromatography-negative chemical ionization mass spectrometry. J. Chromatogr. B 2009, 877, 1523–1529. [Google Scholar] [CrossRef] [PubMed]
  7. Wang, X.; Li, J.; Jian, D.; Zhang, Y.; Shan, Y.; Wang, S.; Liu, F. Paper-based antibiotic sensor (PAS) relying on colorimetric indirect competitive enzyme-linked immunosorbent assay for quantitative tetracycline and chloramphenicol detection. Sens. Actuators B Chem. 2021, 329, 129173. [Google Scholar] [CrossRef]
  8. Shakila, R.J.; Saravanakumar, R.; Vyla, S.A.P.; Jeyasekaran, G. An improved microbial assay for the detection of chloramphenicol residues in shrimp tissues. Innov. Food Sci. Emerg. 2007, 8, 515–518. [Google Scholar] [CrossRef]
  9. Xia, Y.; Su, R.; Huang, R.; Ding, L.; Wang, L.; Qi, W.; He, Z. Design of elution strategy for simultaneous detection of chloramphenicol and gentamicin in complex samples using surface plasmon resonance. Biosens. Bioelectron. 2017, 92, 266–272. [Google Scholar] [CrossRef] [PubMed]
  10. Kotelnikova, P.A.; Iureva, A.M.; Nikitin, M.P.; Zvyagin, A.V.; Deyev, S.M.; Shipunova, V.O. Peroxidase-like activity of silver nanowires and its application for colorimetric detection of the antibiotic chloramphenicol. Talanta Open 2022, 6, 100164. [Google Scholar] [CrossRef]
  11. Shen, J.; Zhang, Z.; Yao, Y.; Shi, W.; Liu, Y.; Zhang, S. A monoclonal antibody-based time-resolved fluoroimmunoassay for chloramphenicol in shrimp and chicken muscle. Anal. Chim. Acta 2006, 575, 262–266. [Google Scholar] [CrossRef] [PubMed]
  12. Jia, B.J.; He, X.; Cui, P.L.; Liu, J.X.; Wang, J.P. Detection of chloramphenicol in meat with a chemiluminescence resonance energy transfer platform based on molecularly imprinted graphene. Anal. Chim. Acta 2019, 1063, 136–143. [Google Scholar] [CrossRef] [PubMed]
  13. Yin, J.; Ouyang, H.; Li, W.; Long, Y. An effective electrochemical platform for chloramphenicol detection based on Carbon-Doped boron nitride nanosheets. Biosensors 2023, 13, 116. [Google Scholar] [CrossRef]
  14. Cao, X.; Chen, C.; Zhu, Q. Biosensors based on functional nucleic acids and isothermal amplification techniques. Talanta 2023, 253, 123977. [Google Scholar] [CrossRef]
  15. Mohamad, N.; Azizan, N.I.; Mokhtar, N.F.K.; Mustafa, S.; Mohd Desa, M.N.; Hashim, A.M. Future perspectives on aptamer for application in food authentication. Anal. Biochem. 2022, 656, 114861. [Google Scholar] [CrossRef] [PubMed]
  16. Xiao, X.; Li, H.; Zhao, L.; Zhang, Y.; Liu, Z. Oligonucleotide aptamers: Recent advances in their screening, molecular conformation and therapeutic applications. Biomed. Pharmacother. 2021, 143, 112232. [Google Scholar] [CrossRef] [PubMed]
  17. Zhang, L.; Yin, M.; Wei, X.; Sun, Y.; Chen, Y.; Qi, S.; Tian, X.; Qiu, J.; Xu, D. Synthesis of rGO@PDA@AuNPs for an effective electrochemical chloramphenicol sensor. Diam. Relat. Mater. 2022, 128, 109311. [Google Scholar] [CrossRef]
  18. Macchia, E.; Torricelli, F.; Bollella, P.; Sarcina, L.; Tricase, A.; Di Franco, C.; Österbacka, R.; Kovács-Vajna, Z.M.; Scamarcio, G.; Torsi, L. Large-Area interfaces for Single-Molecule label-free bioelectronic detection. Chem. Rev. 2022, 122, 4636–4699. [Google Scholar] [CrossRef]
  19. Krečmarová, M.; Gulka, M.; Vandenryt, T.; Hrubý, J.; Fekete, L.; Hubík, P.; Taylor, A.; Mortet, V.; Thoelen, R.; Bourgeois, E.; et al. A Label-Free diamond microfluidic DNA sensor based on active Nitrogen-Vacancy center charge state control. ACS Appl. Mater. Inter. 2021, 13, 18500–18510. [Google Scholar] [CrossRef]
  20. Chen, Q.; Du, M.; Xu, X. A label-free and selective electrochemical aptasensor for ultrasensitive detection of Di(2-ethylhexyl) phthalate based on self-assembled DNA nanostructure amplification. J. Electroanal. Chem. 2022, 914, 116300. [Google Scholar] [CrossRef]
  21. Zhu, C.; Liu, D.; Li, Y.; Chen, T.; You, T. Label-free ratiometric homogeneous electrochemical aptasensor based on hybridization chain reaction for facile and rapid detection of aflatoxin B1 in cereal crops. Food Chem. 2022, 373, 131443. [Google Scholar] [CrossRef] [PubMed]
  22. Du, M.; Chen, Q.; Xu, X. A novel and label-free electrochemical aptasensor based on exonuclease III and G-quadruplex DNAzyme for sensitive and selective detection of metronidazole. Microchem. J. 2022, 179, 107577. [Google Scholar] [CrossRef]
  23. Mahar, I.; Memon, F.H.; Lee, J.; Kim, K.H.; Ahmed, R.; Soomro, F.; Rehman, F.; Memon, A.A.; Thebo, K.H.; Choi, K.H. Two-Dimensional transition metal carbides and nitrides (MXenes) for water purification and antibacterial applications. Membranes 2021, 11, 869. [Google Scholar] [CrossRef] [PubMed]
  24. Giménez, R.; Serrano, B.; San-Miguel, V.; Cabanelas, J.C. Recent advances in MXene/Epoxy composites: Trends and prospects. Polymers 2022, 14, 1170. [Google Scholar] [CrossRef] [PubMed]
  25. Naguib, M.; Kurtoglu, M.; Presser, V.; Lu, J.; Niu, J.; Heon, M.; Hultman, L.; Gogotsi, Y.; Barsoum, M.W. Two-Dimensional nanocrystals produced by exfoliation of Ti3AlC2. Adv. Mater. 2011, 23, 4248–4253. [Google Scholar] [CrossRef] [PubMed] [Green Version]
  26. Cui, H.; Yang, L.; Fu, X.; Li, G.; Xing, S.; Wang, X. Ti3C2 MXene-based aptasensor for sensitive and simultaneous detection of two diabetes biomarkers. Surf. Interfaces 2023, 41, 103196. [Google Scholar] [CrossRef]
  27. Wang, H.; Sun, J.; Lu, L.; Yang, X.; Xia, J.; Zhang, F.; Wang, Z. Competitive electrochemical aptasensor based on a cDNA-ferrocene/MXene probe for detection of breast cancer marker Mucin1. Anal. Chim. Acta 2020, 1094, 18–25. [Google Scholar] [CrossRef]
  28. Yue, F.; Liu, M.; Bai, M.; Hu, M.; Li, F.; Guo, Y.; Vrublevsky, I.; Sun, X. Novel electrochemical aptasensor based on ordered mesoporous Carbon/2D Ti3C2 MXene as nanocarrier for simultaneous detection of aminoglycoside antibiotics in milk. Biosensors 2022, 12, 626. [Google Scholar] [CrossRef]
  29. Manzanares-Palenzuela, C.L.; Pourrahimi, A.M.; Gonzalez-Julian, J.; Sofer, Z.; Pykal, M.; Otyepka, M.; Pumera, M. Interaction of single- and double-stranded DNA with multilayer MXene by fluorescence spectroscopy and molecular dynamics simulations. Chem. Sci. 2019, 10, 10010–10017. [Google Scholar] [CrossRef] [Green Version]
  30. Chen, W.Y.; Lin, H.; Barui, A.K.; Gomez, A.M.U.; Wendt, M.K.; Stanciu, L.A. DNA-Functionalized ti3c2tx MXenes for selective and rapid detection of SARS-CoV-2 nucleocapsid gene. ACS Appl. Nano Mater. 2022, 5, 1902–1910. [Google Scholar] [CrossRef]
  31. Yadav, P.; Cao, Z.; Barati Farimani, A. DNA detection with Single-Layer TI3C2 MXene nanopore. ACS Nano 2021, 15, 4861–4869. [Google Scholar] [CrossRef]
  32. Du, X.; Sun, J.; Li, Y.; Du, W.; Jiang, D. Self-accelerated electrochemiluminescence luminophor of Ag3PO4-Ti3C2 for trace lincomycin aptasensing. Microchem. J. 2022, 179, 107578. [Google Scholar] [CrossRef]
  33. Lukatskaya, M.R.; Mashtalir, O.; Ren, C.E.; Dall’Agnese, Y.; Rozier, P.; Taberna, P.L.; Naguib, M.; Simon, P.; Barsoum, M.W.; Gogotsi, Y. Cation intercalation and high volumetric capacitance of two-dimensional titanium carbide. Science 2013, 341, 1502–1505. [Google Scholar] [CrossRef] [PubMed] [Green Version]
  34. Guo, X.; Zhang, Y.; Ge, H.; Zhang, J.; Yang, P.; Wu, Z. Facile fabrication of 2D MXene loading Co-doped Prussian blue nanoparticles for ultrasensitive electrochemical assay of trace lead ions. J. Electroanal. Chem. 2023, 935, 117320. [Google Scholar] [CrossRef]
  35. Zhang, Z.; Karimi-Maleh, H. In situ synthesis of label-free electrochemical aptasensor-based sandwich-like AuNPs/PPy/Ti3C2Tx for ultrasensitive detection of lead ions as hazardous pollutants in environmental fluids. Chemosphere 2023, 324, 138302. [Google Scholar] [CrossRef]
  36. Zhang, Q.; Wang, F.; Zhang, H.; Zhang, Y.; Liu, M.; Liu, Y. Universal ti3c2 MXenes based Self-Standard ratiometric fluorescence resonance energy transfer platform for highly sensitive detection of exosomes. Anal. Chem. 2018, 90, 12737–12744. [Google Scholar] [CrossRef]
  37. Kashefi-Kheyrabadi, L.; Koyappayil, A.; Kim, T.; Cheon, Y.; Lee, M. A MoS2@Ti3C2Tx MXene hybrid-based electrochemical aptasensor (MEA) for sensitive and rapid detection of Thyroxine. Bioelectrochemistry 2021, 137, 107674. [Google Scholar] [CrossRef]
  38. Lee, E.; Lee, C.E.; Han, J.H. Effects of proton irradiation on single-stranded DNA studied by using X-ray photoelectron spectroscopy. J. Korean Phys. Soc. 2016, 69, 578–583. [Google Scholar] [CrossRef]
  39. Fan, L.; Zhang, C.; Yan, W.; Guo, Y.; Shuang, S.; Dong, C.; Bi, Y. Design of a facile and label-free electrochemical aptasensor for detection of atrazine. Talanta 2019, 201, 156–164. [Google Scholar] [CrossRef]
  40. Lu, M.; Cao, C.; Wang, F.; Liu, G. A polyethyleneimine reduced graphene oxide/gold nanocubes based electrochemical aptasensor for chloramphenicol detection using single-stranded DNA-binding protein. Mater. Des. 2021, 199, 109409. [Google Scholar] [CrossRef]
  41. Roushani, M.; Rahmati, Z.; Farokhi, S.; Hoseini, S.J.; Fath, R.H. The development of an electrochemical nanoaptasensor to sensing chloramphenicol using a nanocomposite consisting of graphene oxide functionalized with (3-Aminopropyl) triethoxysilane and silver nanoparticles. Mater. Sci. Eng. C 2020, 108, 110388. [Google Scholar] [CrossRef] [PubMed]
  42. Kesavan, G.; Chen, S.M. Manganese oxide anchored on carbon modified halloysite nanotubes: An electrochemical platform for the determination of chloramphenicol. Colloids Surf. A Physicochem. Eng. Asp. 2021, 615, 126243. [Google Scholar] [CrossRef]
  43. Qi, X.; Teng, Z.; Yu, J.; Jia, D.; Zhang, Y.; Pan, H. A simple one-step synthesis of Fe3O4/N-rGO nanocomposite for sensitive electrochemical detection of chloramphenicol. Mater. Lett. 2023, 330, 133350. [Google Scholar] [CrossRef]
  44. Gao, S.; Yang, Z.; Zhang, Y.; Zhao, L.; Xing, Y.; Fei, T.; Liu, S.; Zhang, T. The synergistic effects of MoS2 and reduced graphene oxide on sensing performances for electrochemical chloramphenicol sensor. FlatChem 2022, 33, 100364. [Google Scholar] [CrossRef]
  45. Manjula, N.; Chen, S. Synthesis of highly electroactive nanoflowers like manganesetin oxide and electroanalytical application for chloramphenicol determination in milk and honey samples. J. Electroanal. Chem. 2021, 880, 114914. [Google Scholar] [CrossRef]
  46. Yang, J.; Zhong, W.; Yu, Q.; Zou, J.; Gao, Y.; Liu, S.; Zhang, S.; Wang, X.; Lu, L. MXene–AuNP-Based electrochemical aptasensor for Ultra-Sensitive detection of chloramphenicol in honey. Molecules 2022, 27, 1871. [Google Scholar] [CrossRef]
  47. Kang, R.; Zhang, Z.; Guo, L.; Cui, J.; Chen, Y.; Hou, X.; Wang, B.; Lin, C.; Jiang, N.; Yu, J. Enhanced thermal conductivity of epoxy composites filled with 2D transition metal carbides (MXenes) with ultralow loading. Sci. Rep. 2019, 9, 9135. [Google Scholar] [CrossRef] [Green Version]
  48. Cui, W.; Hu, G.; Lv, E.; Li, C.; Wang, Z.; Li, Q.; Qian, Z.; Wang, J.; Xu, S.; Wang, R. A label-free and enzyme-free fluorescent aptasensor for amplified detection of kanamycin in milk sample based on target-triggered catalytic hairpin assembly. Food Control. 2022, 133, 108654. [Google Scholar] [CrossRef]
Figure 1. (A) The preparation of Ti3C2 MXene; (B) Schematic diagram of the fabrication of electrochemical aptasensor for CAP detection.
Molecules 28 06074 g001
Figure 2. (A) XRD spectra of Ti3AlC2 and Ti3C2 MXene; (B) SEM image of Ti3C2 MXene; (C) zeta potential of Ti3C2 MXene and aptamer/Ti3C2 MXene; (D) wide XPS of Ti3C2 MXene and aptamer/Ti3C2 MXene.
Molecules 28 06074 g002
Figure 3. (A) CVs of bare GCE (black line), Ti3C2 MXene/GCE (red line), aptamer/Ti3C2 MXene/GCE (blue line), BSA/aptamer/Ti3C2 MXene/GCE (green line), and CAP/BSA/aptamer/Ti3C2 MXene/GCE (purple line); (B) EIS of bare GCE (black line), Ti3C2 MXene/GCE (red line), aptamer/Ti3C2 MXene/GCE (blue line), BSA/aptamer/Ti3C2 MXene/GCE (green line) and CAP/BSA/aptamer/Ti3C2 MXene/GCE (purple line). All the measurements were recorded in a solution containing 5 mM [Fe(CN)6]3−/4− and 0.1 M KCl.
Molecules 28 06074 g003
Figure 4. (A) the CVs for Ti3C2 MXene concentrations (0 mg/mL, 0.1 mg/mL, 0.25 mg/mL, 0.5 mg/mL, 0.8 mg/mL, and 1 mg/mL); (B,C) the CVs for volume of Ti3C2 MXene (0 μL, 4 μL, 6 μL, 8 μL, 10 μL, and 12 μL); (D) the effect of the concentration of aptamer on peak current of aptasensor, ΔIP = IP, aptamer/Ti3C2 MXene/GCE−IP, Ti3C2 MXene/GCE; (E) the effect of the incubation time of aptamer on peak current of aptasensor, ΔIP = IP, aptamer/Ti3C2 MXene/GCE−IP, Ti3C2 MXene/GCE; (F) the effect of the incubation time of CAP on peak current of aptasensor, ΔIP = IP, CAP/BSA/aptamer/Ti3C2 MXene/GCE−IP, BSA/aptamer/Ti3C2 MXene/GCE.
Molecules 28 06074 g004
Figure 5. (A) DPV response of the aptasensor to different CAP concentrations (a to j respectively represents different concentrations of CAP: 1 fM, 10 fM, 100 fM, 1 pM, 10 pM, 100 pM, 1 nM, 10 nM, 100 nM, and 1 μM); (B) relationship between CAP concentration and DPV response. Inset: the alignment curve of the logarithm of CAP concentration and DPV response; (C) reproducibility of the aptamer/Ti3C2 MXene/GCE aptasensor for detection of 100 nM CAP, ΔIP = IP, CAP/BSA/aptamer/Ti3C2 MXene/GCE−IP, BSA/aptamer/Ti3C2 MXene/GCE; (D) stability of the aptamer/Ti3C2 MXene/GCE aptasensor for detection of 100 nM CAP, ΔIP = IP, CAP/BSA/aptamer/Ti3C2 MXene/GCE−IP, BSA/aptamer/Ti3C2 MXene/GCE; (E) selectivity of the constructed aptasensor. (the concentration of CAP, DOX, OTC, STR, NEO, KANA, and TET was 100 nM).
Molecules 28 06074 g005
Table 1. Comparison with the other electrochemical methods for CAP detection.
MethodsLinear RangeLODReference
PEI-rGO/AuNCs5 pM~1 μM2.08 pM[40]
AgNPs/[NH2–Si]−f−GO10 pM~0.2 μM3.3 pM[41]
Mn2O3@CCH0.005~91.94 μM0.03 μM[42]
Fe3O4/N-rGO1~200 μM0.03 μM[43]
MoS2-rGO1~55 μM0.6 μM[44]
MSO NFs0.003 μM~92.21 μM1 nM[45]
MXene-AuNP0.0001~10 nM0.03 pM[46]
Ti3C2 MXene10 fM~1 μM1 fMThis work
Abbreviation: PEI-rGO/AuNCs: polyethyleneimine-functionalized reduced graphene oxide and gold nanocubes; AgNPs/[NH2–Si]−f−GO: graphene oxide and functionalized with (3−Aminopropyl) triethoxysilane/silver nanoparticles; Mn2O3@CCH: manganese oxide supported on carbon−modified halloysite nanotube; Fe3O4/N-rGO: Fe3O4/Nitrogen−doped reduced graphene oxide; MoS2-rGO: MoS2 modified reduced graphene oxide; MSO NFs: MnSnO3 NFs; MXene-AuNP: 2D transition of metal carbides loaded with gold nanoparticles.
Table 2. Detection results of CAP in milk.
Sample No.Added (pM)Found (pM)Recovery (%)RSD (%, n = 3)
11010.314103.14 2.637
210001058.791105.88 8.342
310,00010,815.439108.15 6.953
4100,00096,126.45796.13 7.736
Disclaimer/Publisher’s Note: The statements, opinions and data contained in all publications are solely those of the individual author(s) and contributor(s) and not of MDPI and/or the editor(s). MDPI and/or the editor(s) disclaim responsibility for any injury to people or property resulting from any ideas, methods, instructions or products referred to in the content.

