

Evaluation of the Quality of Selected White and Red Wines Produced from Moravia Region of Czech Republic Using Physicochemical Analysis, FTIR Infrared Spectroscopy and Chemometric Techniques

 ,
,  , , ,
, , ,  , , , and
Abstract
:1. Introduction
- Legend:
- Andre wine (AW)—red grape variety
- Cabernet Moravia wine (CMW)—red grape variety
- Hibernal wine (HW)—white grape variety
- Sauvignon blanc wine (SW)—white grape variety
- FTIR spectroscopic measurement dates:
- I—22.08.22
- II—21.10.22
- III—25.11.22
2. Results and Discussion
2.1. The Determination of Basic Analytical Values in Wine
2.2. FTIR Spectroscopy
2.2.1. Hierarchical Clustering Analysis for FTIR Spectra
2.2.2. Principal Component Analysis (PCA) and Linear Discriminant Analysis (LDA) for FTIR Spectra
2.2.3. Principal Component Analysis (PCA) for Basic Analytical Values of Evaluated Wine Samples
3. Materials and Methods
3.1. Grape Varieties and Their Origins
3.2. Wine Processing
3.3. Determination of Basic Analytical Values in Wine
3.4. ATR-FTIR Measurement
3.5. Chemometrics Analysis
3.5.1. Hierarchical Clustering Analysis (HCA)
3.5.2. Principal Component Analysis (PCA)
3.5.3. Linear Discriminant Analysis (LDA)
3.6. Methods of Statistical Analysis
4. Conclusions
Author Contributions
Funding
Institutional Review Board Statement
Informed Consent Statement
Data Availability Statement
Conflicts of Interest
Sample Availability
References
- Manzocco, L.; Maltini, E.; Lerici, C.R. Changes of some thermal and physical properties in model systems simulating an alcoholic fermentation. J. Food Process Pres. 1998, 22, 1–12. [Google Scholar] [CrossRef]
- Michlovský, M. Lexicon of Chemical Composition of Wine, 1st ed.; Garamon s.r.o.: Hradec Králové, Czech Republic, 2014; p. 262. [Google Scholar]
- Ronsheim, J.R. Vintage: The Story of Wine—Johnson, H. Antioch. Rev. 1990, 48, 111–112. [Google Scholar] [CrossRef]
- Boulet, J.C.; Trarieux, C.; Souquet, J.M.; Ducasse, M.A.; Caille, S.; Samson, A.; Williams, P.; Doco, T.; Cheynier, V. Models based on ultraviolet spectroscopy, polyphenols, oligosaccharides and polysaccharides for prediction of wine astringency. Food Chem. 2016, 190, 357–363. [Google Scholar] [CrossRef] [PubMed]
- Jones-Moore, H.R.; Jelley, R.E.; Marangon, M.; Fedrizzi, B. The polysaccharides of winemaking: From grape to wine. Trends Food Sci. Technol. 2021, 111, 731–740. [Google Scholar] [CrossRef]
- Johnson, C. The Wine Wheel Goes Round and Round. Available online: http://cookingwithsin.com/2010/07/26/the-wine-wheel-goes-round-round/ (accessed on 14 December 2014).
- Baca-Bocanegra, B.; Nogales-Bueno, J.; Gorey, B.; Heredia, F.J.; Byrne, H.J.; Hernandez-Hierro, J.M. On the use of vibrational spectroscopy and scanning electron microscopy to study phenolic extractability of cooperage byproducts in wine. Eur. Food Res. Technol. 2019, 245, 2209–2220. [Google Scholar] [CrossRef]
- Baca-Bocanegra, B.; Martinez-Lapuente, L.; Nogales-Bueno, J.; Hernandez-Hierro, J.M.; Ferrer-Gallego, R. Feasibility study on the use of ATR-FTIR spectroscopy as a tool for the estimation of wine polysaccharides. Carbohyd. Polym. 2022, 287, 119365. [Google Scholar] [CrossRef] [PubMed]
- Banc, R.; Loghin, F.; Miere, D.; Fetea, F.; Socaciu, C. Romanian Wines Quality and Authenticity Using FT-MIR Spectroscopy Coupled with Multivariate Data Analysis. Not. Bot. Horti. Agrobo. 2014, 42, 556–564. [Google Scholar] [CrossRef]
- Lucarini, M.; Durazzo, A.; del Pulgar, J.S.; Gabrielli, P.; Lombardi-Boccia, G. Determination of fatty acid content in meat and meat products: The FTIR-ATR approach. Food Chem. 2018, 267, 223–230. [Google Scholar] [CrossRef]
- Han, Y.H.; Wang, X.L.; Liu, Y.; Han, L.J.; Yang, Z.L.; Liu, X. A novel FTIR discrimination based on genomic DNA for species-specific analysis of meat and bone meal. Food Chem. 2019, 294, 526–532. [Google Scholar] [CrossRef]
- Cozzolino, D.; Cynkar, W.; Shah, N.; Smith, P. Feasibility study on the use of attenuated total reflectance mid-infrared for analysis of compositional parameters in wine. Food Res. Int. 2011, 44, 181–186. [Google Scholar] [CrossRef]
- Mato, I.; Suarez-Luque, S.; Huidobro, J.F. A review of the analytical methods to determine organic acids in grape juices and wines. Food Res. Int. 2005, 38, 1175–1188. [Google Scholar] [CrossRef]
- Schneider, R.; Charrier, F.; Moutounet, M.; Baumes, R. Rapid analysis of grape aroma glycoconjugates using Fourier-transform infrared spectrometry and chemometric techniques. Anal. Chim. Acta 2004, 513, 91–96. [Google Scholar] [CrossRef]
- Silva, S.D.; Feliciano, R.P.; Boas, L.V.; Bronze, M.R. Application of FTIR-ATR to Moscatel dessert wines for prediction of total phenolic and flavonoid contents and antioxidant capacity. Food Chem. 2014, 150, 489–493. [Google Scholar] [CrossRef] [PubMed]
- Gouvinhas, I.; de Almeida, J.M.M.M.; Carvalho, T.; Machado, N.; Barros, A.I.R.N.A. Discrimination and characterisation of extra virgin olive oils from three cultivars in different maturation stages using Fourier transform infrared spectroscopy in tandem with chemometrics. Food Chem. 2015, 174, 226–232. [Google Scholar] [CrossRef]
- Dong, D.; Zheng, W.; Jiao, L.; Lang, Y.; Zhao, X. Chinese vinegar classification via volatiles using long-optical-path infrared spectroscopy and chemometrics. Food Chem. 2016, 194, 95–100. [Google Scholar] [CrossRef] [PubMed]
- Bendini, A.; Cerretani, L.; Di Virgilio, F.; Belloni, P.; Bonoli-Carbognin, M.; Lercker, G. Preliminary evaluation of the application of the ftir spectroscopy to control the geographic origin and quality of virgin olive oils. J. Food Qual. 2007, 30, 424–437. [Google Scholar] [CrossRef]
- Matwijczuk, A.; Budziak-Wieczorek, I.; Czernel, G.; Karcz, D.; Baranska, A.; Jedlinska, A.; Samborska, K. Classification of Honey Powder Composition by FTIR Spectroscopy Coupled with Chemometric Analysis. Molecules 2022, 27, 3800. [Google Scholar] [CrossRef]
- Kachel, M.; Stryjecka, M.; Slusarczyk, L.; Matwijczuk, A.; Budziak-Wieczorek, I.; Gladyszewski, G. Impact of Metal Nanoparticles on the Phytochemical and Antioxidative Properties of Rapeseed Oil. Materials 2023, 16, 694. [Google Scholar] [CrossRef]
- Jones, G.V.; White, M.A.; Cooper, O.R.; Storchmann, K. Climate change and global wine quality. Clim. Chang. 2005, 73, 319–343. [Google Scholar] [CrossRef]
- Jackson, R.S. Wine Science: Principles and Applications, 3rd ed.; Academic Press: London, UK, 2008; p. 776. [Google Scholar]
- Carrau, F.; Boido, E.; Dellacassa, E. Yeast Diversity and Flavor Compounds. In Fungal Metabolites; Reference Series in Phytochemistry; Mérillon, J.M., Ramawat, K., Eds.; Springer: Cham, Switzerland, 2017. [Google Scholar]
- Bartowsky, E.J.; Xia, D.; Gibson, R.L.; Fleet, G.H.; Henschke, P.A. Spoilage of bottled red wine by acetic acid bacteria. Lett. Appl. Microbiol. 2003, 36, 307–314. [Google Scholar] [CrossRef]
- European Commission. Commission Regulation (EEC) No 2676/90 of 17 September 1990 determining Community methods for the analysis of wines. Offic. J. EU 1990, L 272, 192. [Google Scholar]
- Volschenk, H.; van Vuuren, H.J.; Viljoen-Bloom, M. Malic Acid in Wine: Origin, Function and Metabolism during Vinification. S. Afr. J. Enol. Vitic. 2006, 27, 123–136. [Google Scholar] [CrossRef]
- Sumby, K.M.; Grbin, P.R.; Jiranek, V. Implications of new research and technologies for malolactic fermentation in wine. Appl. Microbiol. Biot. 2014, 98, 8111–8132. [Google Scholar] [CrossRef] [PubMed]
- Vicente, J.; Navascues, E.; Calderon, F.; Santos, A.; Marquina, D.; Benito, S. An Integrative View of the Role of Lachancea thermotolerans in Wine Technology. Foods 2021, 10, 2878. [Google Scholar] [CrossRef]
- Henick-Kling, T.; Edinger, W.; Daniel, P.; Monk, P. Selective effects of sulfur dioxide and yeast starter culture addition on indigenous yeast populations and sensory characteristics of wine. J. Appl. Microbiol. 1998, 84, 865–876. [Google Scholar] [CrossRef]
- Redzepovic, S.; Orlic, S.; Majdak, A.; Kozina, B.; Volschenk, H.; Viljoen-Bloom, M. Differential malic acid degradation by selected strains of Saccharomyces during alcoholic fermentation. Int. J. Food Microbiol. 2003, 83, 49–61. [Google Scholar] [CrossRef]
- Robinson, J. (Ed.) The Oxford Companion to Wine, 2nd ed.; Oxford University Press: Oxford, UK, 1999. [Google Scholar]
- Hu, X.Z.; Liu, S.Q.; Li, X.H.; Wang, C.X.; Ni, X.L.; Liu, X.; Wang, Y.; Liu, Y.; Xu, C.H. Geographical origin traceability of Cabernet Sauvignon wines based on Infrared fingerprint technology combined with chemometrics. Sci. Rep. 2019, 9, 8256. [Google Scholar] [CrossRef]
- Basalekou, M.; Pappas, C.; Tarantilis, P.A.; Kallithraka, S. Wine Authenticity and Traceability with the Use of FT-IR. Beverages 2020, 6, 30. [Google Scholar] [CrossRef]
- Moreira, J.L.; Santos, L. Analysis of organic acids in wines by Fourier-transform infrared spectroscopy. Anal. Bioanal. Chem. 2005, 382, 421–425. [Google Scholar] [CrossRef]
- OIV. Compendium of International Methods of Wine and Must Analysis; International Organisation of Vine and Wine: Paris, France, 2011. [Google Scholar]
- Rebelein, H. Vereinfachtes Verfahren zur Bestimmung des Glycerins und Butylenglykols in Wein. Z. Lebensm. Unters. Forsch. 1957, 105, 296–311. [Google Scholar] [CrossRef]
- Eroglu, A.; Dogan, M.; Toker, O.S.; Yilmaz, M.T. Classification of Kashar Cheeses Based on Their Chemical, Color and Instrumental Textural Characteristics Using Principal Component and Hierarchical Cluster Analysis. Int. J. Food Prop. 2015, 18, 909–921. [Google Scholar] [CrossRef]
- Granato, D.; Santos, J.S.; Escher, G.B.; Ferreira, B.L.; Maggio, R.M. Use of principal component analysis (PCA) and hierarchical cluster analysis (HCA) for multivariate association between bioactive compounds and functional properties in foods: A critical perspective. Trends Food Sci. Technol. 2018, 72, 83–90. [Google Scholar] [CrossRef]
- Zhao, Y.Q.; Zeng, Y.Y.; Li, X.S.; Yuan, K.L.; Li, Y.; Tian, L.M.; Sun, J.X.; Bai, W.B. Modeling and application of sensory evaluation of blueberry wine based on principal component analysis. Curr. Res. Food Sci. 2023, 6, 100403. [Google Scholar] [CrossRef]
- Budziak, I.; Arczewska, M.; Kaminski, D.M. Formation of Prenylated Chalcone Xanthohumol Cocrystals: Single Crystal X-ray Diffraction, Vibrational Spectroscopic Study Coupled with Multivariate Analysis. Molecules 2019, 24, 4245. [Google Scholar] [CrossRef] [PubMed]
- Ami, D.; Natalello, A.; Mereghetti, P.; Neri, T.; Zanoni, M.; Monti, M.; Doglia, S.M.; Redi, C.A. FT-IR spectroscopy supported by PCA-LDA analysis for the study of embryonic stem cell differentiation. Spectrosc. Int. J. 2010, 24, 89–97. [Google Scholar] [CrossRef]
- Ma, L.L.; Varveri, A.; Jing, R.X.; Erkens, S. Chemical characterisation of bitumen type and ageing state based on FTIR spectroscopy and discriminant analysis integrated with variable selection methods. Road Mater. Pavement. 2023, 24, 506–520. [Google Scholar] [CrossRef]


| Wine by Variety | |||||
|---|---|---|---|---|---|
| Unit | Sauvignon Blanc | Hibernal | Cabernet Moravia | André | |
| Alcohol | % | 12.19 ± 0.04 a | 12.58 ± 0.06 b | 12.83 ± 0.07 c | 13.58 ± 0.05 d |
| Titratable acid | g·L−1 | 6.00 ± 0.02 a | 6.57 ± 0.29 b | 4.74 ± 0.22 c | 5.58 ± 0.41 d |
| Residual sugar | g·L−1 | 1.24 ± 1.12 a | 0.00 ± 0.00 b | 0.64 ± 0.99 c | 0.50 ± 0.44 d |
| pH | - | 3.13 ± 0.04 a | 3.15 ± 0.04 a | 3.48 ± 0.04 c | 3.33 ± 0.06 b |
| Malic acid | g·L−1 | 3.65 ± 0.17 a | 4.01 ± 0.77 a | 0.35 ± 0.28 b | 1.76 ± 0.41 c |
| Lactic acid | g·L−1 | 0.56 ± 0.04 a | 1.02 ± 0.35 ab | 2.04 ± 0.28 c | 1.32 ± 0.36b c |
| Acetic acid | g·L−1 | 0.04 ± 0.09 a | 0.17 ± 0.04 a | 0.49 ± 0.05 b | 0.40 ± 0.07 c |
| Tartaric acid | g·L−1 | 2.31 ± 0.14 a | 2.15 ± 0.12 a | 1.83 ± 0.26 a | 2.06 ± 0.28 a |
| Glycerol | g·L−1 | 7.66 ± 0.17 b | 8.73 ± 0.73 ab | 9.62 ± 0.41 a | 9.81 ± 0.31 a |
| Density | Kg·m−³ | 0.99 ± 0.00 a | 0.99 ± 0.00 ab | 0.99 ± 0.00 b | 0.99 ± 0.00 ab |
| Sugar-free extract | g·L−1 | 18.77 ± 0.88 a | 22.19 ± 0.25 ab | 24.59 ± 0.86 b | 25.29 ± 2.08 ab |
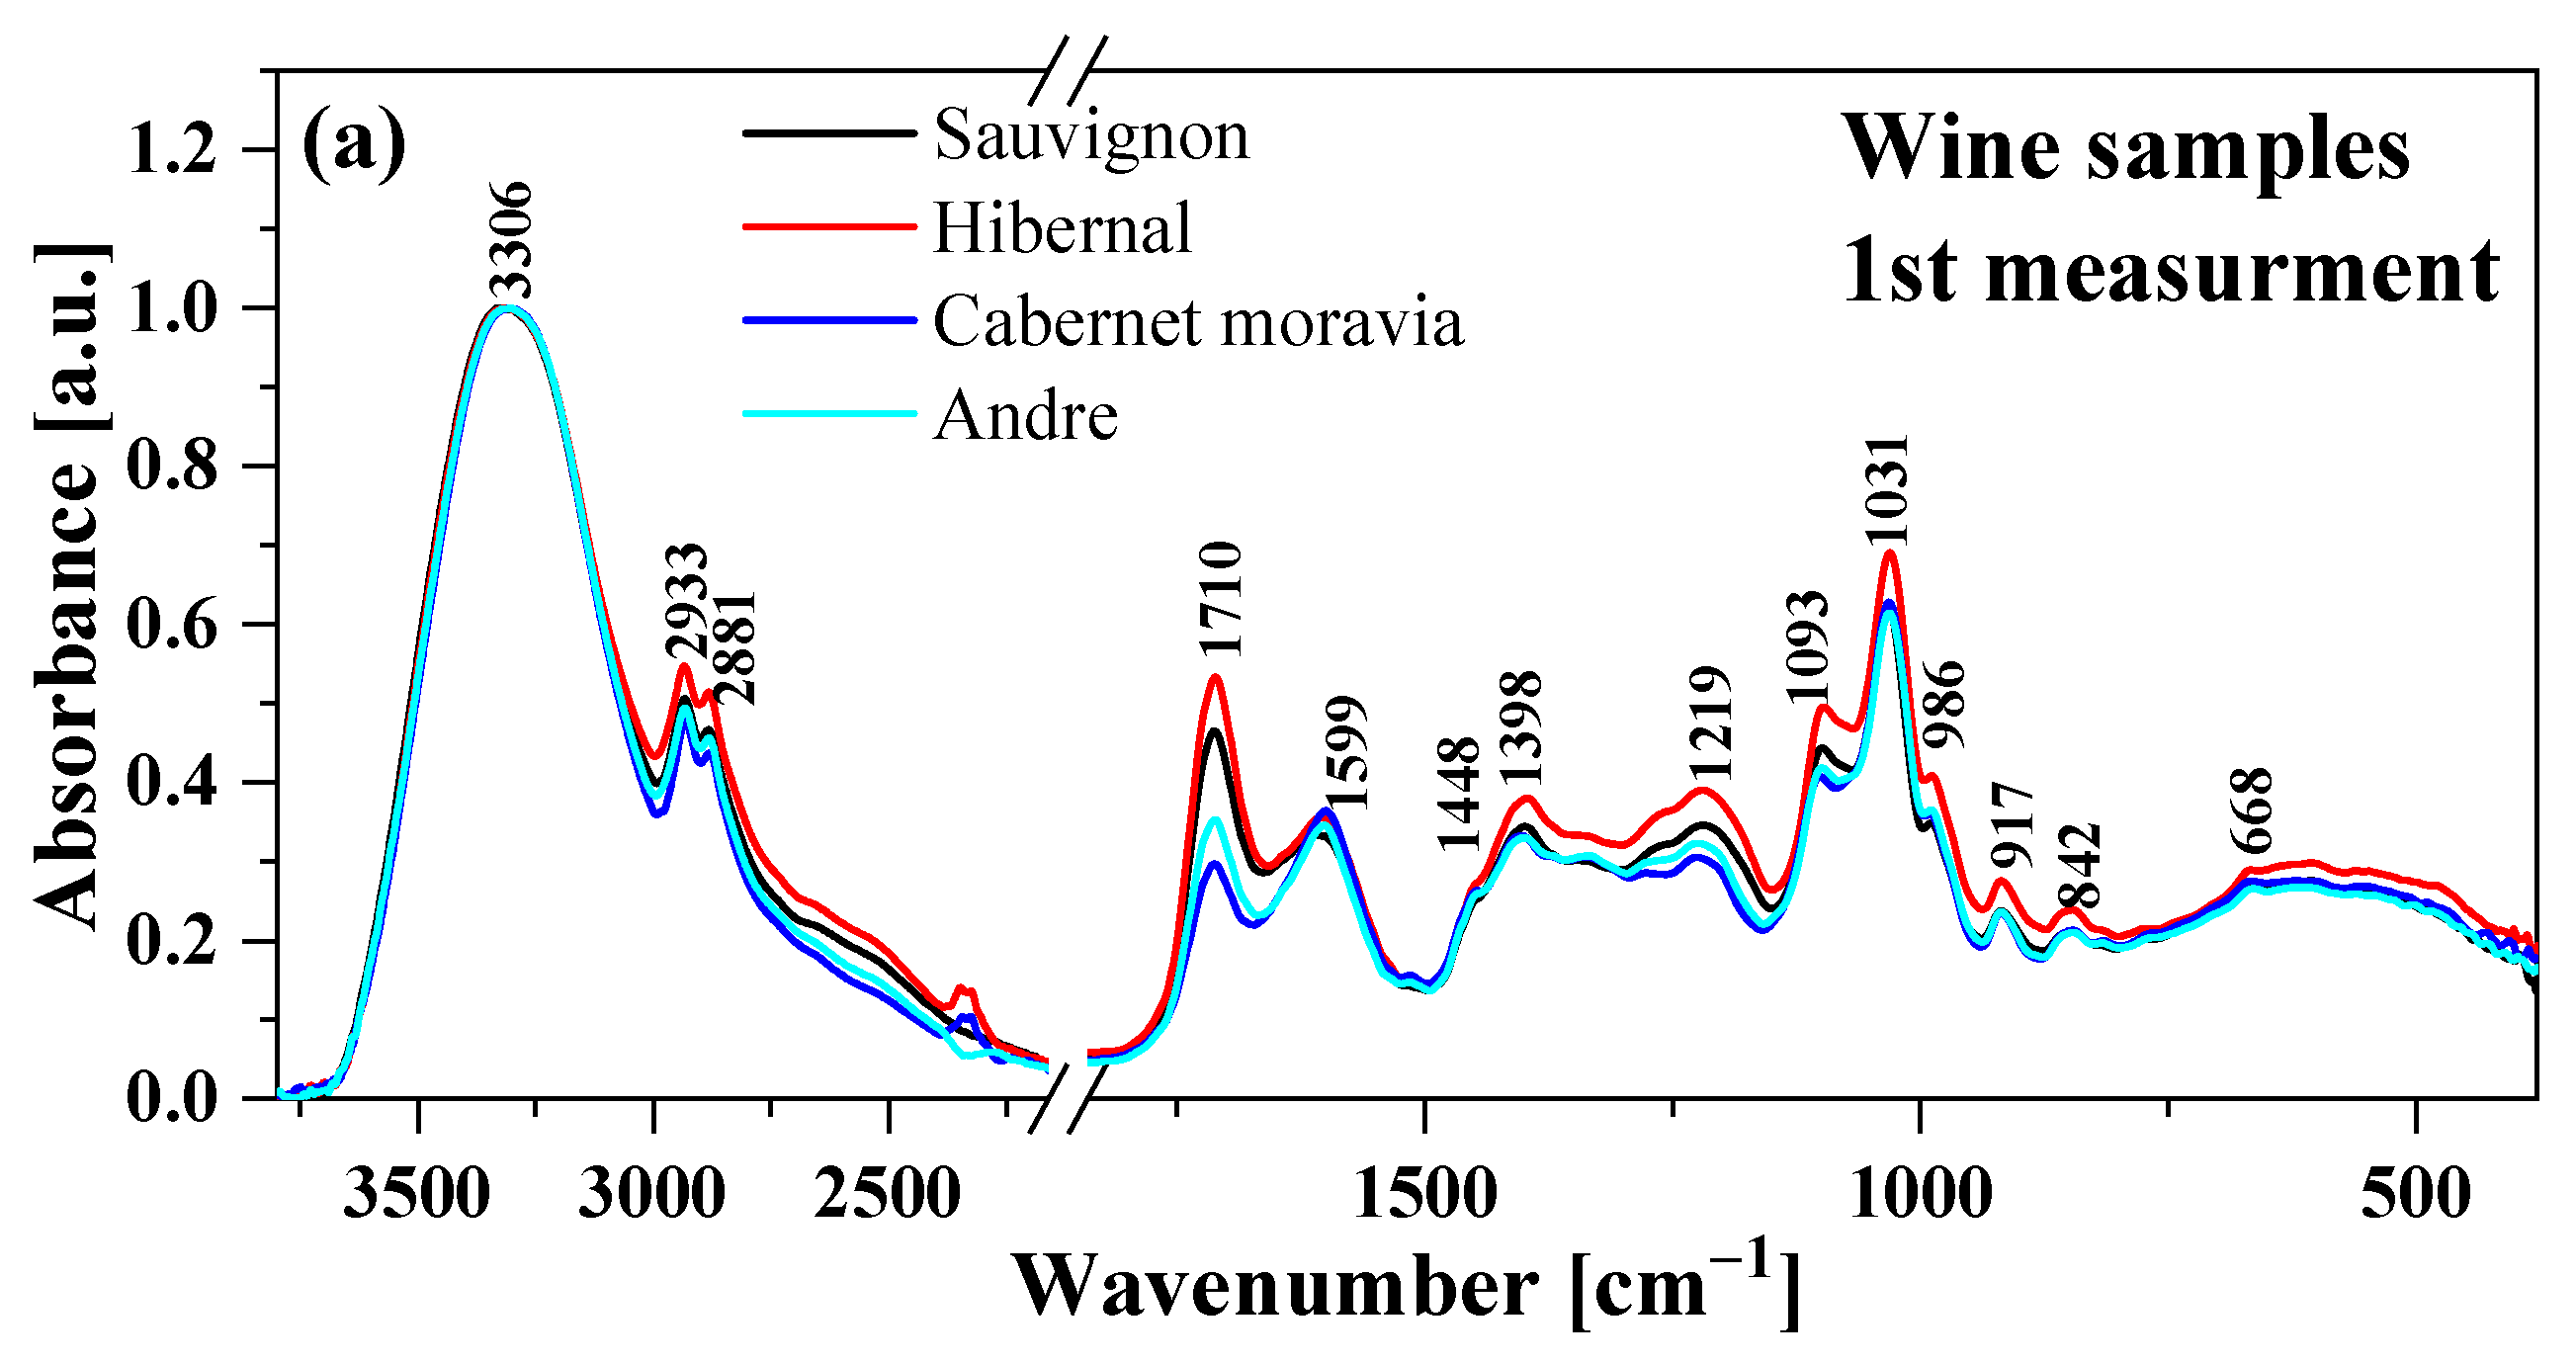
| Type and Origin of Vibrations | André Wine | Cabernet Moravia Wine | Hibernal Wine | Sauvignon Wine |
|---|---|---|---|---|
| ν(O-H) in water and hydroxylated molecules (alcohols and phenols) | 3304 | 3302 | 3303 | 3303 |
| νw(-CH) of hydrocarbons | 2932 | 2934 | 2933 | 2934 |
| νm(-CH3) of hydrocarbons | 2879 | 2879 | 2882 | 2882 |
| νm(-C=O) | 1715 | 1715 | 1714 | 1714 |
| δ(-OH) and ν(C=C) | 1602 | 1600 | 1603 | 1605 |
| ν(C=C) and ν(C-N) | 1516 | 1516 | 1514 | 1514 |
| ν(C=C) δ(-CH3) | 1448 | 1449 | 1451 | 1451 |
| δm(-CH2) and δ (-CH) | 1404 | 1405 | 1397 | 1399 |
| ν(C=C), δ (-CH2) | 1335 | 1330 | 1332 | 1332 |
| δ (-CH2) | 1265 | 1265 | 1270 | 1267 |
| νm(-C-O) and δm(-CH2) | 1220 | 1224 | 1217 | 1215 |
| νst(-C-O) and νw (-OH) second overtones | 1101 | 1102 | 1097 | 1100 |
| νm(-C-O) | 1033 989 | 1034 992 | 1033 989 | 1033 991 |
| δw(-HC=CH-, trans-) out-of-plane) | 923 | 917 | 917 | 921 |
| δ(-CH2-) and -HC=CH-(cis-) scissor | 851 | 849 | 847 | 852 |
| Principal Component Number | Eigenvalue | Percentage of Variance (%) | Cumulative (%) |
|---|---|---|---|
| 1 | 11.67722 | 66.89095 | 66.8910 |
| 2 | 3.77114 | 21.60233 | 88.4933 |
| 3 | 1.07020 | 6.13044 | 94.6237 |
| 4 | 0.52446 | 3.00428 | 97.6280 |
| 5 | 0.24714 | 1.41569 | 99.0437 |
| True Class | Assigned to Class | % Correct Classification | ||
|---|---|---|---|---|
| I | II | III | ||
| I | 3 | 1 | 0 | 75% |
| II | 0 | 4 | 0 | 100% |
| III | 0 | 0 | 4 | 100% |
| Total | 3 | 5 | 4 | 91.7% |
Disclaimer/Publisher’s Note: The statements, opinions and data contained in all publications are solely those of the individual author(s) and contributor(s) and not of MDPI and/or the editor(s). MDPI and/or the editor(s) disclaim responsibility for any injury to people or property resulting from any ideas, methods, instructions or products referred to in the content. |
© 2023 by the authors. Licensee MDPI, Basel, Switzerland. This article is an open access article distributed under the terms and conditions of the Creative Commons Attribution (CC BY) license (https://creativecommons.org/licenses/by/4.0/).
Share and Cite
Budziak-Wieczorek, I.; Mašán, V.; Rząd, K.; Gładyszewska, B.; Karcz, D.; Burg, P.; Čížková, A.; Gagoś, M.; Matwijczuk, A. Evaluation of the Quality of Selected White and Red Wines Produced from Moravia Region of Czech Republic Using Physicochemical Analysis, FTIR Infrared Spectroscopy and Chemometric Techniques. Molecules 2023, 28, 6326. https://doi.org/10.3390/molecules28176326
Budziak-Wieczorek I, Mašán V, Rząd K, Gładyszewska B, Karcz D, Burg P, Čížková A, Gagoś M, Matwijczuk A. Evaluation of the Quality of Selected White and Red Wines Produced from Moravia Region of Czech Republic Using Physicochemical Analysis, FTIR Infrared Spectroscopy and Chemometric Techniques. Molecules. 2023; 28(17):6326. https://doi.org/10.3390/molecules28176326
Chicago/Turabian StyleBudziak-Wieczorek, Iwona, Vladimír Mašán, Klaudia Rząd, Bożena Gładyszewska, Dariusz Karcz, Patrik Burg, Alice Čížková, Mariusz Gagoś, and Arkadiusz Matwijczuk. 2023. "Evaluation of the Quality of Selected White and Red Wines Produced from Moravia Region of Czech Republic Using Physicochemical Analysis, FTIR Infrared Spectroscopy and Chemometric Techniques" Molecules 28, no. 17: 6326. https://doi.org/10.3390/molecules28176326
APA StyleBudziak-Wieczorek, I., Mašán, V., Rząd, K., Gładyszewska, B., Karcz, D., Burg, P., Čížková, A., Gagoś, M., & Matwijczuk, A. (2023). Evaluation of the Quality of Selected White and Red Wines Produced from Moravia Region of Czech Republic Using Physicochemical Analysis, FTIR Infrared Spectroscopy and Chemometric Techniques. Molecules, 28(17), 6326. https://doi.org/10.3390/molecules28176326