Article

Insights into the Relationship between the Microstructure and the Catalytic Behavior of Fe2(MoO4)3 during the Ethanolysis of Naomaohu Coal

State Key Laboratory of Chemistry and Utilization of Carbon Based Energy Resources, College of Chemistry, Xinjiang University, Urumqi 830017, China
*
Authors to whom correspondence should be addressed.
These authors contributed equally to this work.
Molecules 2023, 28(18), 6595; https://doi.org/10.3390/molecules28186595
Submission received: 16 June 2023 / Revised: 4 September 2023 / Accepted: 11 September 2023 / Published: 13 September 2023

Abstract

:
Ethanolysis is an effective method to depolymerize weak bonds in lignite under mild conditions, which can result in the production of high-value-added chemicals. However, improving ethanolysis yield and regulating its resulting product distribution is a big challenge. Hence, exploiting highly active catalysts is vital. In this work, Fe2(MoO4)3 catalysts with zero-dimensional nanoparticles, one-dimensional (1D) nanorods, two-dimensional (2D) nanosheets, and three-dimensional (3D) nanoflower structures were successfully prepared and applied in the ethanolysis of Naomaohu coal. The results showed that for all samples, the yield of ethanol-soluble portions (ESP) was significantly improved. The highest yield was obtained for the Fe2(MoO4)3 nanorods, with an increase from 28.84% to 47.68%, and could be attributed to the fact that the Fe2(MoO4)3 nanorods had a higher number of exposed active (100) facets. In addition, the amounts of oxygen-containing compounds, such as ethers, esters, and phenols, increased significantly. The mechanism of ethanolysis catalyzed by the Fe2(MoO4)3 nanorods was also studied using phenylbenzyl ether (BOB) as a model compound. BOB was completely converted at 260 °C after 2 h. It is suggested that Fe2(MoO4)3 nanorods can effectively break the C-O bonds of coal macromolecules, thus promoting the conversion of coal.

1. Introduction

Lignite is abundant, accounting for about half of the world’s coal resources, but its application is limited due to its low calorific value, high water content, and poor thermal stability [1,2]. Therefore, exploring ways to achieve the clean and efficient utilization of lignite is of great significance [3]. With respect its structure [4,5,6,7,8], the organic structural units in lignite are connected by weak covalent bonds such as C-O and C-C bonds. Ethanolysis is an efficient coal conversion technology that can break weak covalent bonds in coal at a low temperature. Ethanol can act as a nucleophilic reagent to attack oxygen-containing bridge bonds in coal under supercritical conditions [9,10]. In turn, this promotes the depolymerization of macromolecular structures into small, soluble, organic oxygen-containing molecules, which have high application value and can be used as raw materials for the synthesis of fine chemicals and organic intermediates [11,12,13,14]. Therefore, ethanolysis is an efficient way of converting lignite into chemicals under mild conditions [15,16,17,18,19]. Naomaohu coal (NMHC) is a typical lignite with a high volatile matter and oxygen content. Many studies were carried out on the ethanolysis of Naomaohu Coal. Liang et al. conducted ethanolysis experiments on Naomaohu coal at different temperatures and analyzed the alcoholysis products [20]. Hu et al. conducted ethanolysis experiments on NaoMaoHu coal, analyzed and characterized the alcoholysis products and residues, and deduced the reaction mechanism of ethanolysis [21]. However, the yield of ethanol-soluble portions (ESP) from lignite ethanolysis is limited, and the product distribution is not well regulated. Therefore, it is crucial to explore highly active catalysts for improving the ethanolysis yield and regulating the product distribution.
Strong base catalysts have been widely studied due to their highly catalytic activity in lignite ethanolysis; however, their strong corrosiveness and the cumbersome product handling reduce their practical application prospects [22,23]. In recent years, metal-based catalysts have increasingly gained attention due to their advantageous features of being non-corrosive, low-cost, and easily synthesized [24,25,26,27,28,29]. For example, Li et al. prepared a series of catalysts (MMgAlOx, M = Cu, Zn, Co, and Ni) via the coprecipitation method for the ethanolysis of Xilinguole lignite. The results showed that CuMgAlOx and ZnMgAlOx were very efficient in catalyzing the ethanolysis of XL, allowing for ESP yields of more than 97.0% and the regulation of the distribution of the platform chemicals by altering the catalysts [30]. Ni/HZSM-5 was prepared by Du et al. through a modified deposition precipitation method with a Ni mass ratio ranging from 5% to 20%. The catalytic properties of this catalyst were evaluated by analyzing the catalytic cracking of benzyloxy (BOB) and benzyl ether (BE), and the results showed a high conversion rate and a low amount of rearrangement products. Ni/HZSM-5 was applied in the catalytic ethanolysis of residues from ethanolyzed Xilinguole lignite with a soluble portion yield of 15.1%, indicating that it could successfully cleave C-O bridged bonds without H2, producing coal-derived organic chemicals [31].
From the above examples, it can be seen that catalysts play an important role in the depolymerization of coal, and some show an excellent performance, as they can not only increase the yield but also decrease the reaction temperature and change the product distribution. The common key factors thought to affect catalyst activity are particle size and specific surface area. In addition, some studies showed that the microstructure of a catalyst is also important for its catalytic activity. For example, Xie et al. studied the relationship between catalyst microstructure and catalytic behavior during the catalytic conversion of coal. in particular, the effects of different crystal shapes and morphologies on the catalytic activity [32]. Wang et al. reported that lamellar MoS2 was more easily inserted into macromolecules, thus improving the catalytic hydrogenation performance [33]. However, the comparison of the effects of microstructures with different dimensions on the a substance has rarely been reported. Thus, the current study investigated the effects of Fe2(MoO4)3 catalysts with different morphologies, achieved by four methods, on the ethanolysis of Naomaohu coal.
In this work, four kinds of Fe2(MoO4)3 catalysts, i.e., with zero-dimensional nanoparticles, one-dimensional (1D) nanorods, two-dimensional (2D) nanosheets, and three-dimensional (3D) nanoflower structures, were prepared by different methods. The morphology and size of the samples were characterized by scanning electron microscope (SEM), and their crystal structure was determined by X-ray diffraction (XRD). The catalysts were applied to the ethanolysis of NMHC, and their mechanism of action was investigated using model compounds. The product distribution of the catalytic ethanolysis was characterized and analyzed using a gas chromatographer–mass spectrometer (GC-MS), and possible reaction pathways of catalytic ethanolysis are proposed. The relationship between morphology and catalytic performance was investigated systematically.

2. Results and Discussion

2.1. Catalyst Characterizations

Figure 1 shows the XRD patterns of Fe2(MoO4)3 prepared by different methods. As can be seen, all the observed diffraction peaks of FMO-1, FMO-2, FMO-3, and FMO-4 could be indexed to the monoclinic phase of iron molybdate, with lattice constants a = 9.3300 Å, b = 12.8680 Å, and c = 9.2420 Å, along with α = γ = β = 90°, which matched well with the standard XRD pattern (JCPDS card No. 33-0661), indicating that Fe2(MoO4)3 was successfully prepared. The diffractions peaks at 18.5° observed for FMO-1 and FMO-4 were indexed to FeMoO4 (JCPDS card No. 22-0629).
The morphologies of the prepared Fe2(MoO4)3 samples were investigated by SEM, and the results are shown in Figure 2. It was found that FMO-1 consisted of nanoparticles (Figure 2a). FMO-2 was characterized by nanorods consisting of nanoparticles, whose average diameter was 150 nm (Figure 2b). FMO-3 consisted of nanosheets with a regular shape and a large size, as shown in Figure 2c. In addition, Figure 2d shows the morphology of FMO-4, in which a stratified structure made of stacked nanosheets can be clearly observed. Compared with FMO-3, FMO-4 had more stacked layers and showed a 3D flower shape.
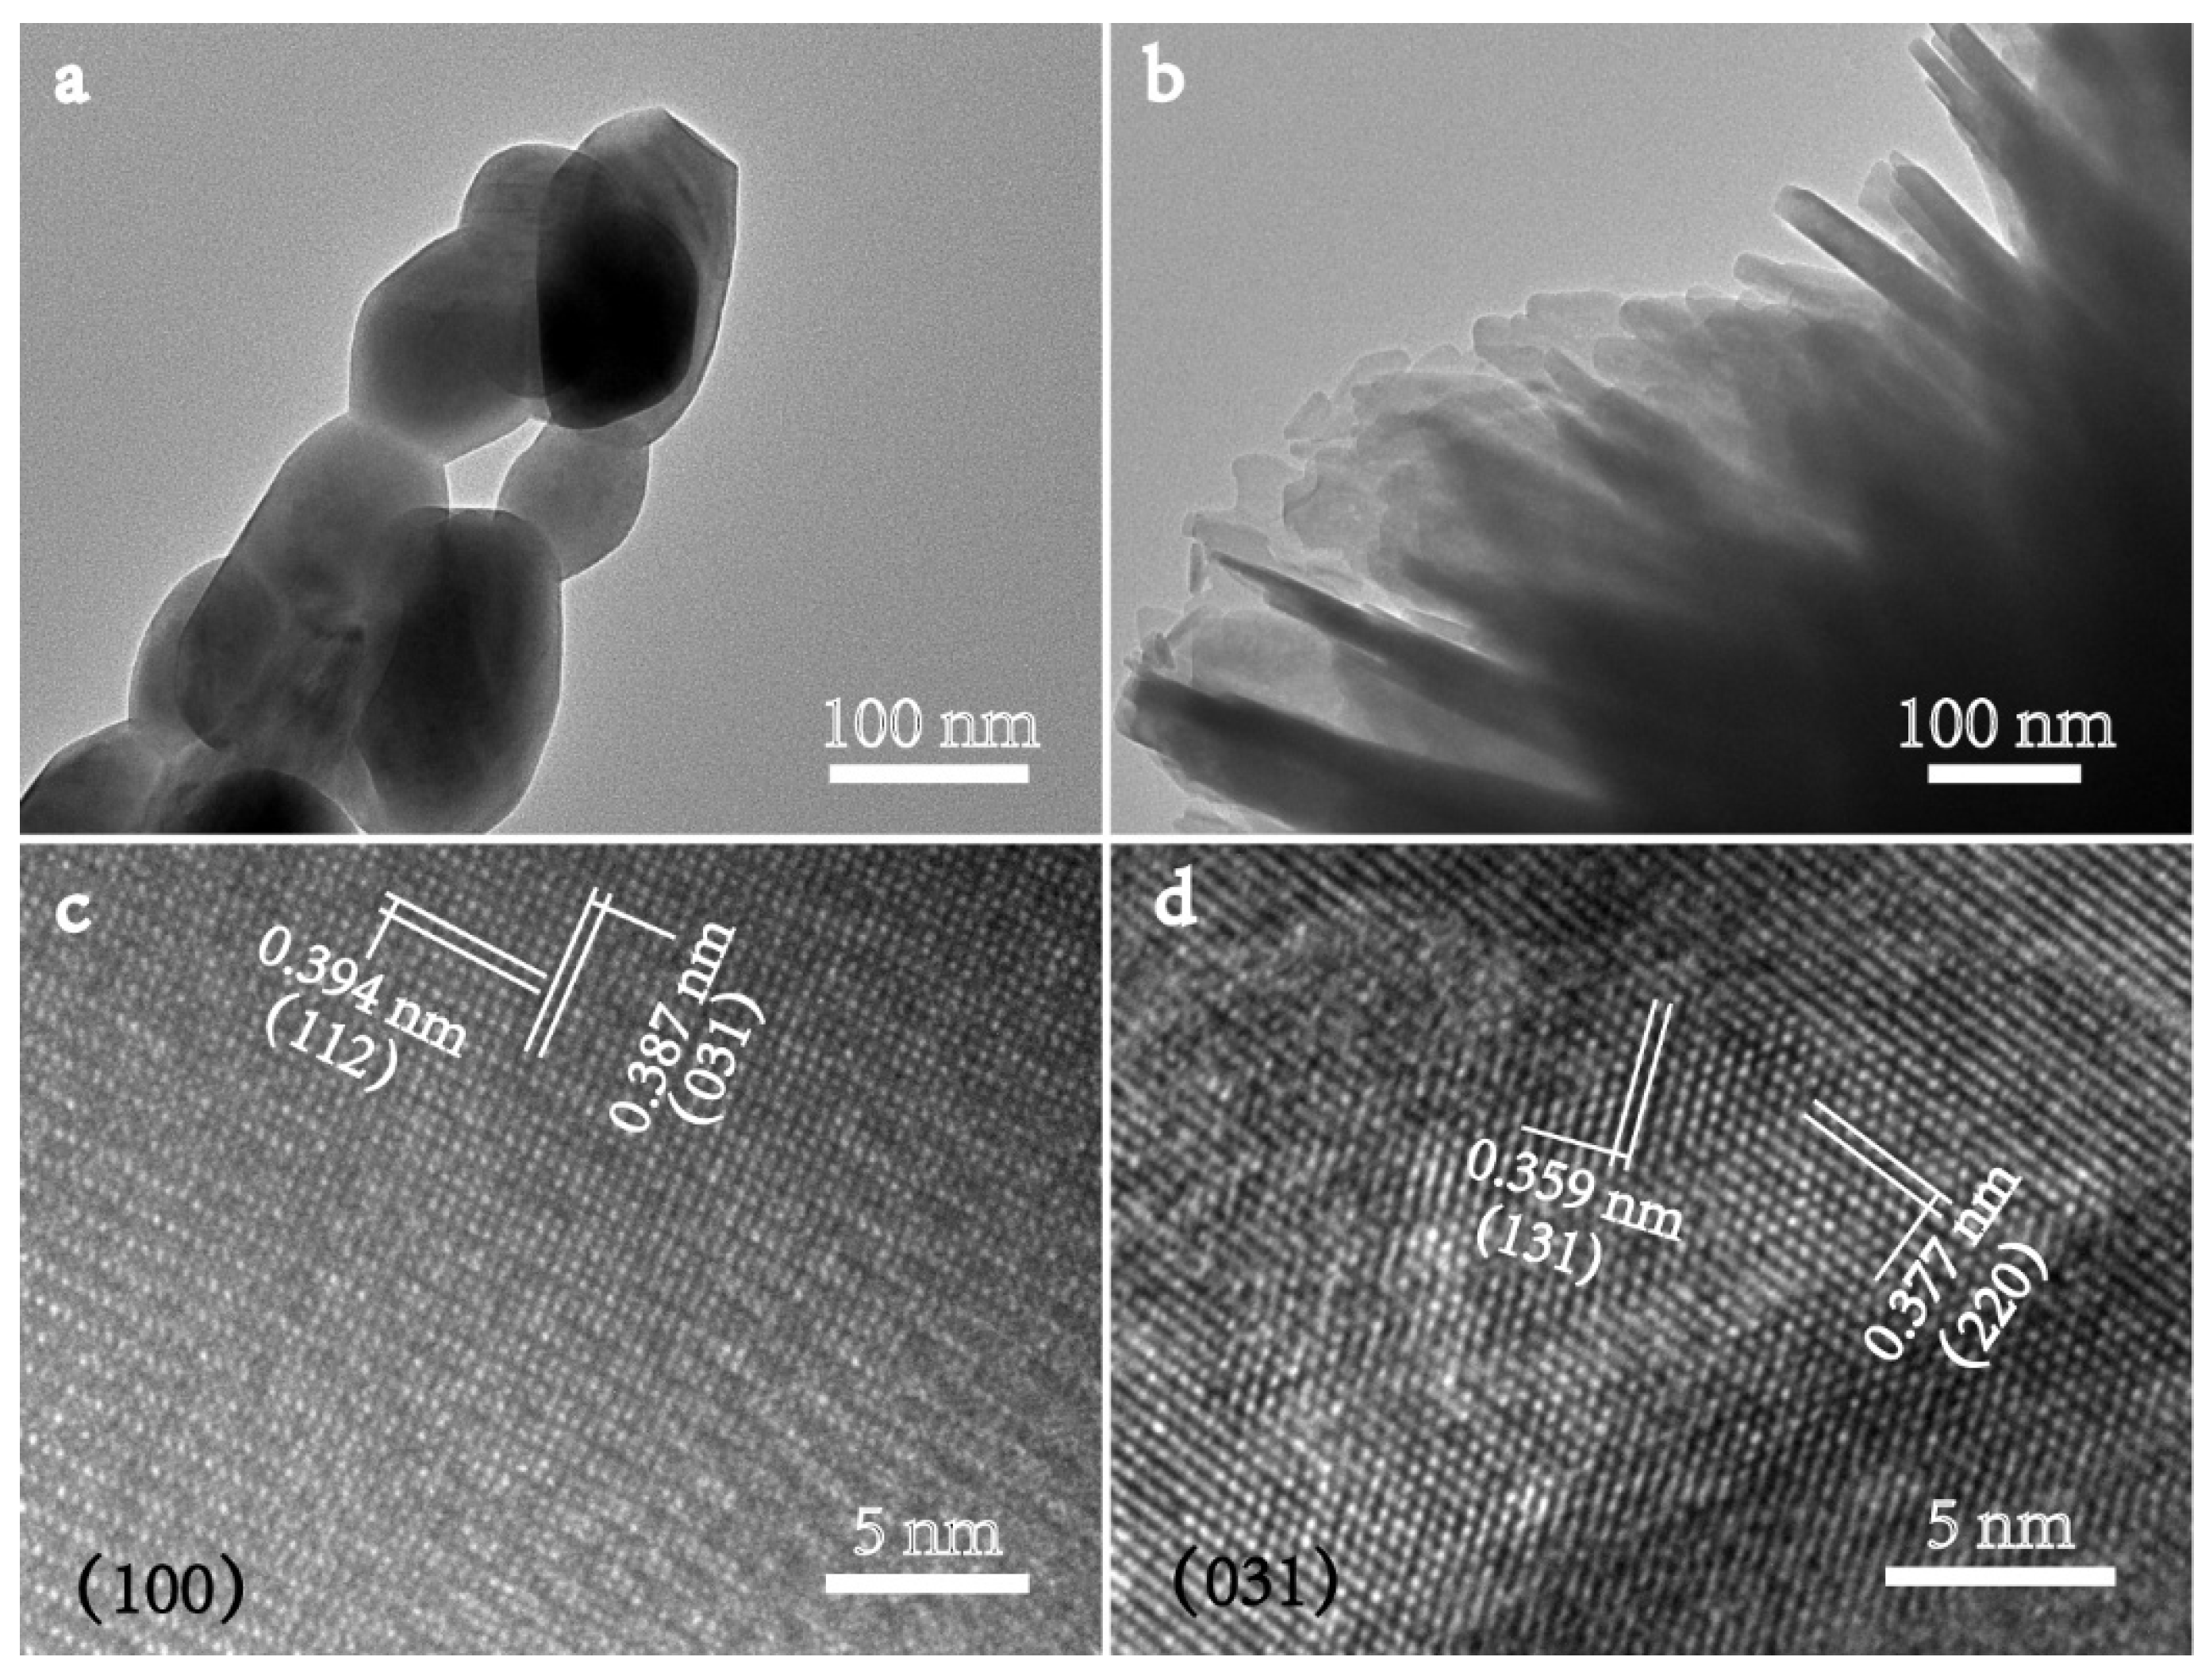
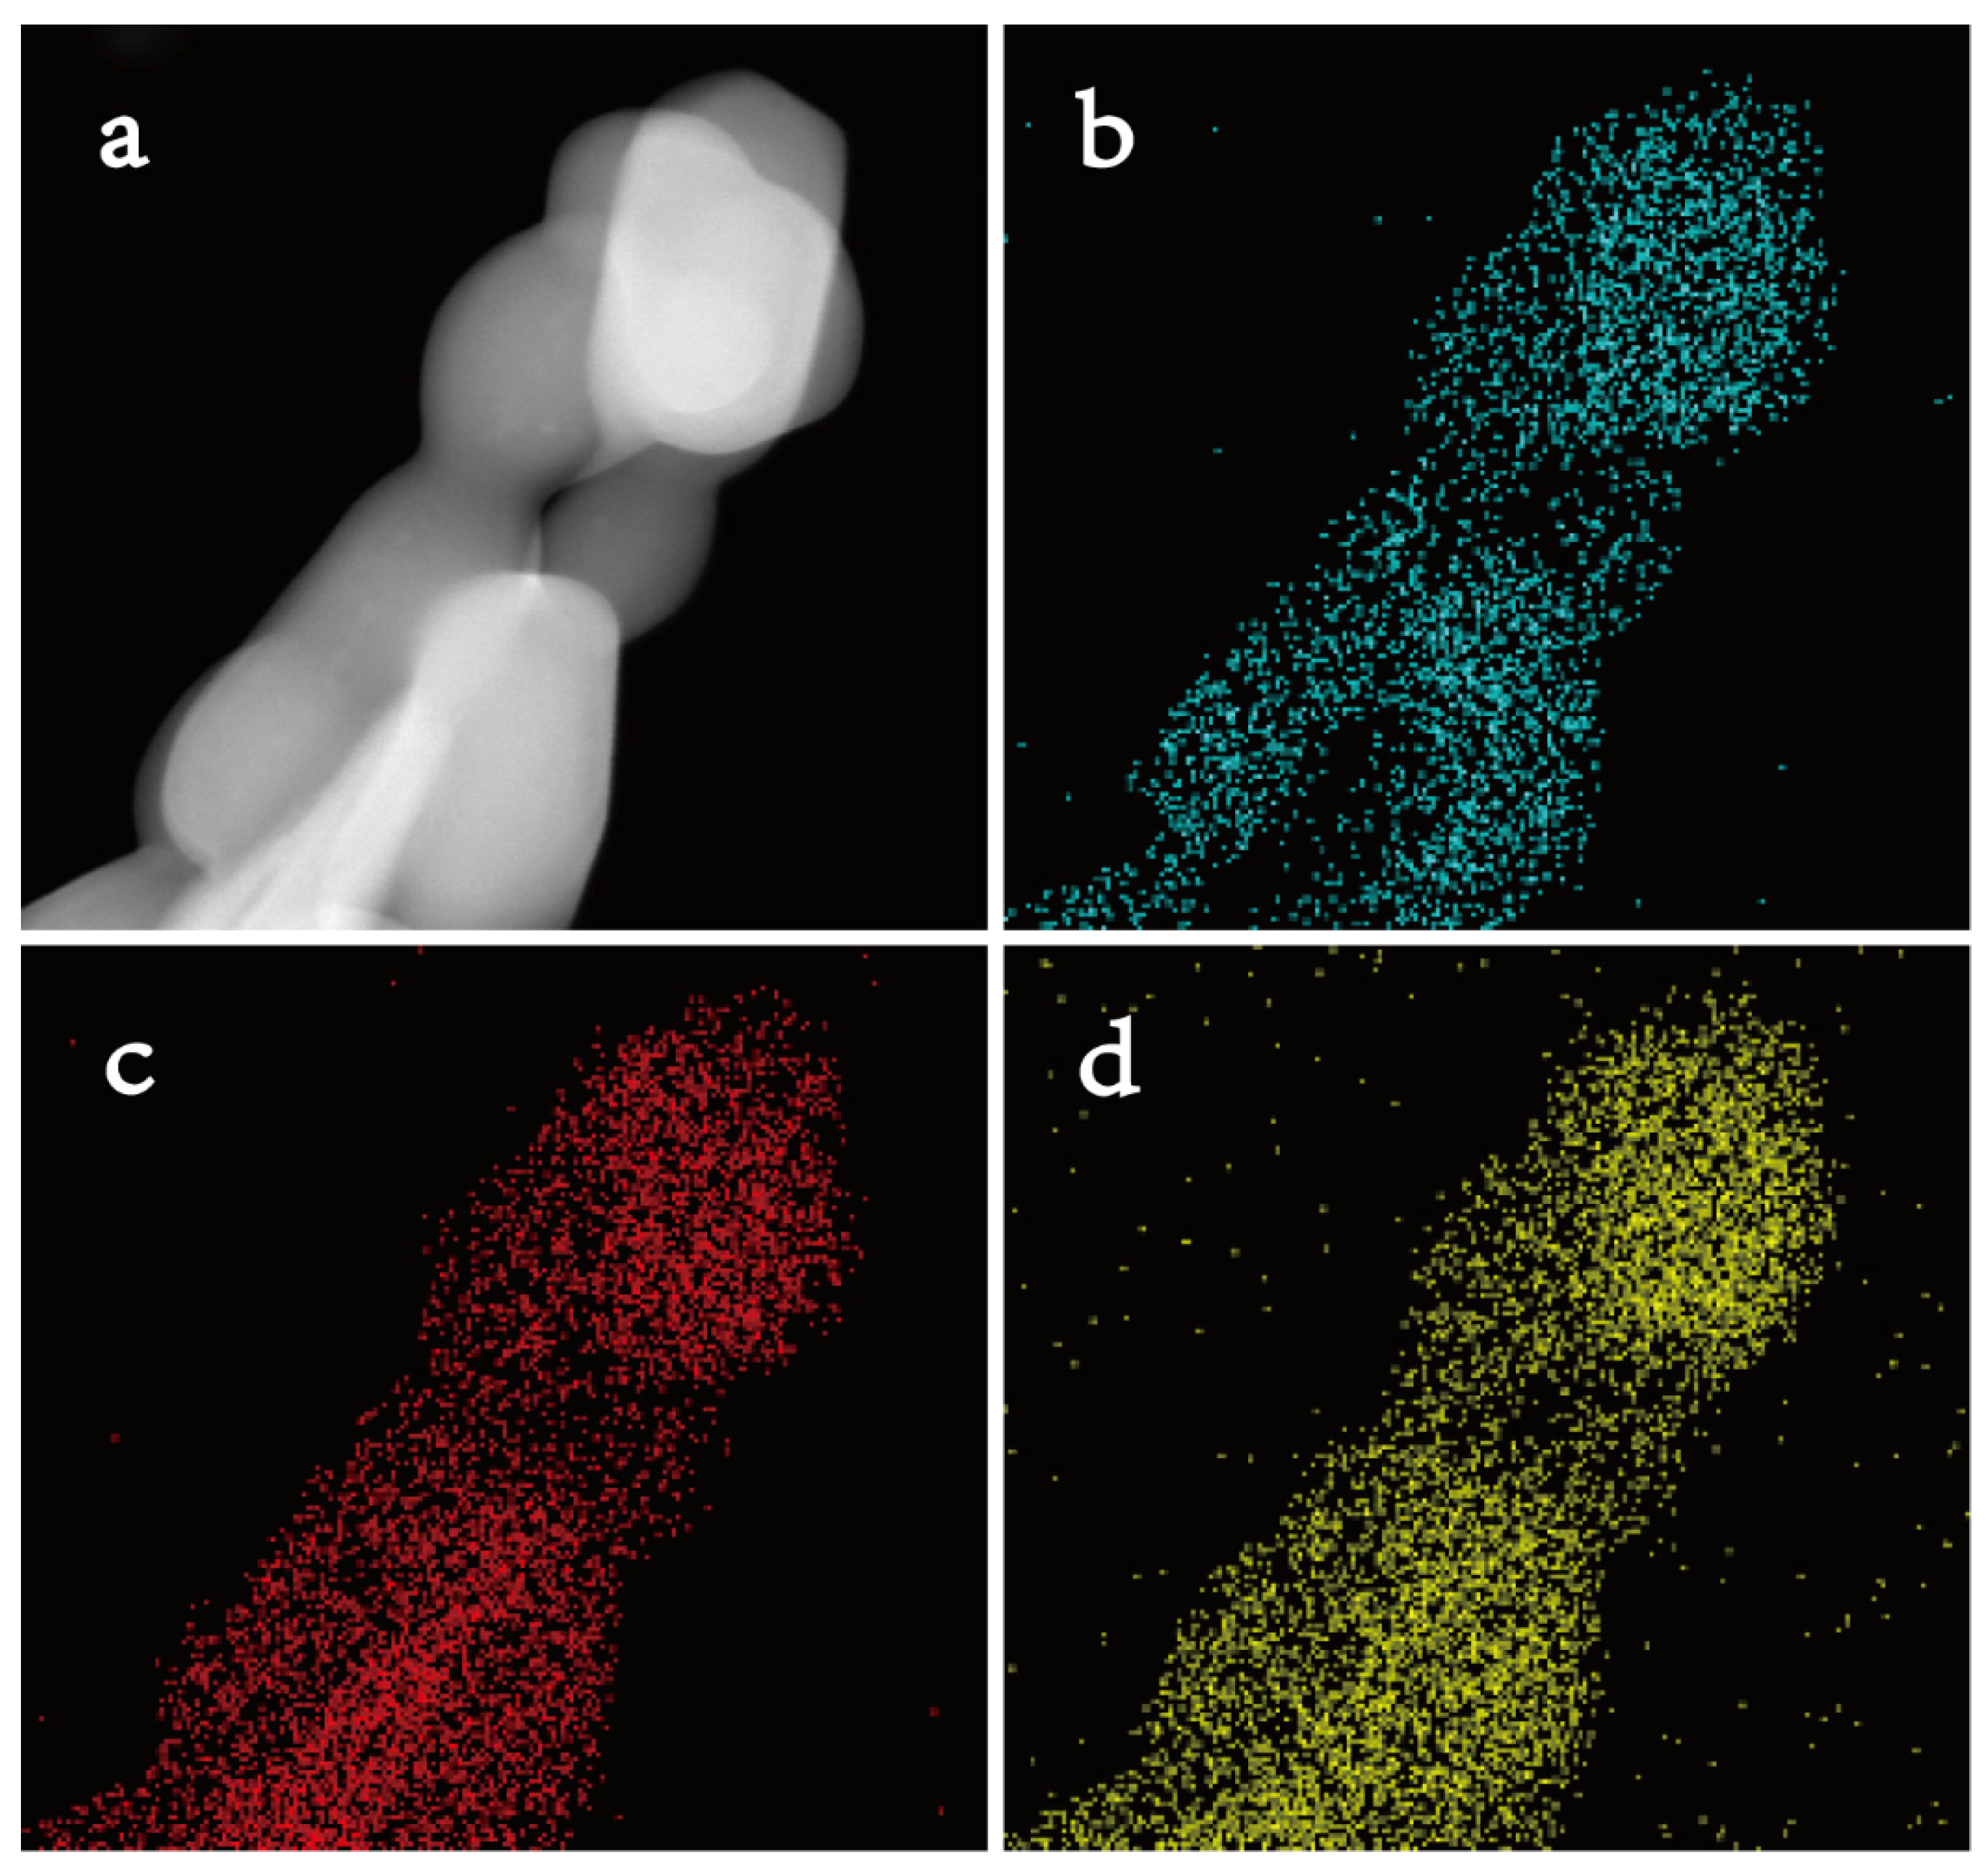
The crystal structures of the FMO-2 and FMO-4 samples were characterized by TEM. In Figure 3a, it can be seen that FMO-2 consisted of nanoparticles, and the diameter of the nanorods was around 150 nm. Figure 3b shows that FMO-4 consisted of stacked nanosheets. In addition, Figure 3c,d shows the HRTEM images of FMO-2 and FMO-4, respectively, along with the lattice fringes of nanorods and nanoflowers. The lattice spacings indicated in Figure 3c are about 0.387 and 0.394 nm, corresponding to the (031) and (112) crystal planes. The lattice spacings indicated in Figure 3d are about 0.359 and 0.377 nm, corresponding to the (131) and (220) crystal planes of the monoclinic Fe2(MoO4)3 phase. In Figure 3c,d, it can be seen that the (100) plane of FMO-2 is exposed to the maximum extent, and the maximum exposed surface of FMO-4 is the (031) plane. To investigate the elemental distribution, we performed the EDS mapping of individual Fe2(MoO4)3 nanorods. In Figure 4, it can be seen that the Fe, Mo, and O elements were uniformly distributed throughout the nanorod region, thereby demonstrating that FMO-2 was produced by the growth of Fe2(MoO4)3 nanoparticles.
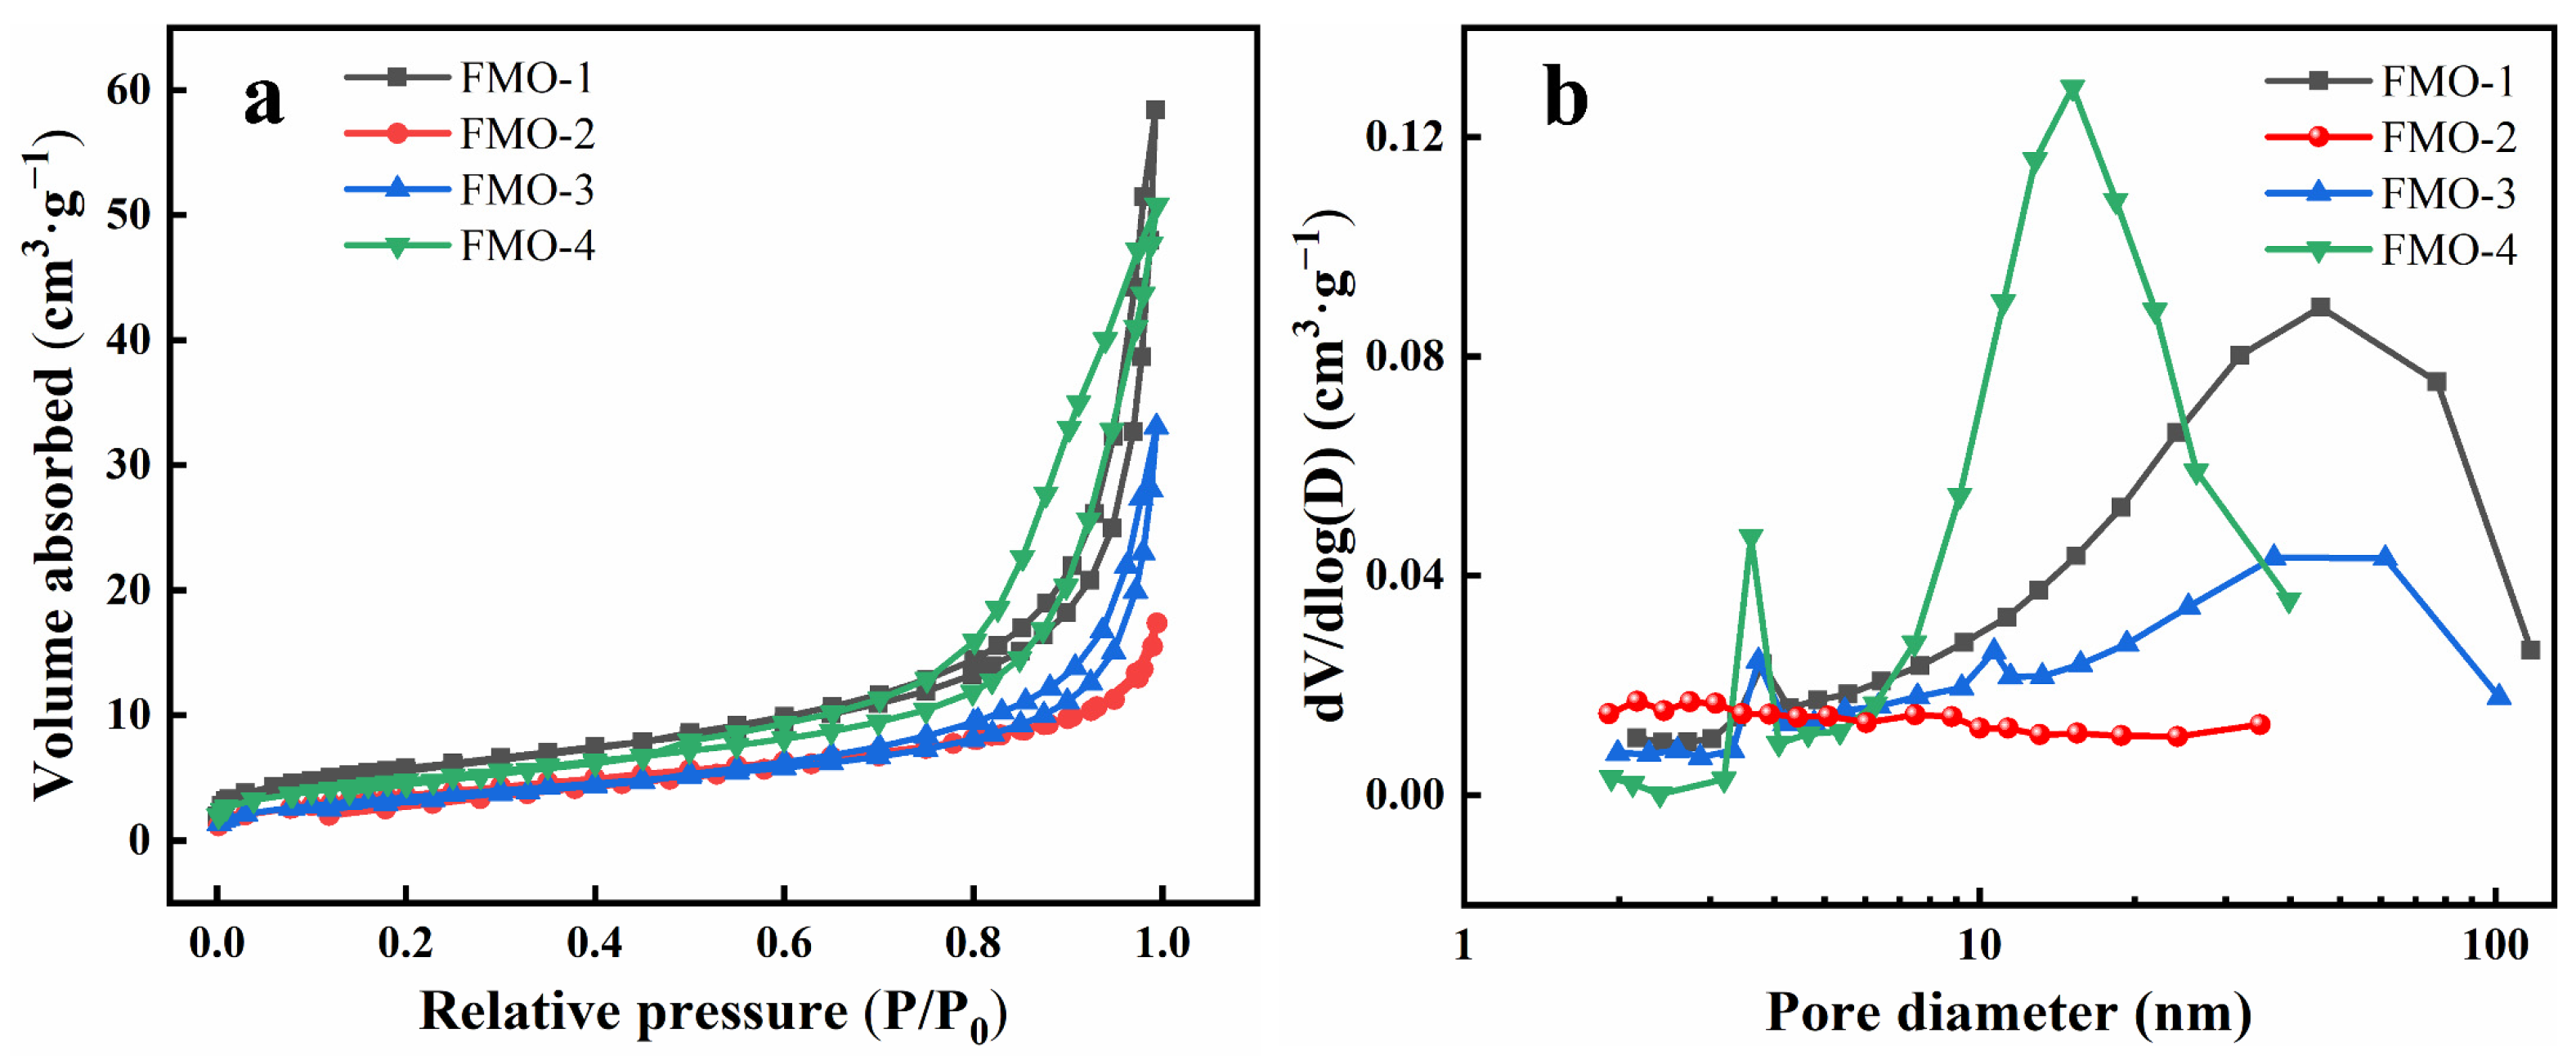
The four samples were characterized for N2 adsorption. The results are shown in Figure 5. In the Figure 5, it can be seen that FMO-1, FMO-3, and FMO-4 presented classical type IV isotherms, indicating that they had mesoporous structures. Among them, FMO-4 presented a larger hysteresis loop, indicating a more mesoporous structure. This was also evidenced by the pore size distribution curve of FMO-4. FMO-2 presented a typical III type isotherm, and its pore structure was dominated by mesopores, with a few micropores. The FMO-2 sample was characterized by NH3 temperature-programmed desorption (NH3-TPD), and the result are shown in Figure S1. In Figure S1, the desorption peaks appear at 100 °C and 250 °C in the FMO-2 curve and were assigned to NH3 desorption from weak and moderately strong acid sites, respectively. The intensity of the desorption peaks of moderately strong acid sites was relatively weak, indicating a weak acidity for FMO-2.
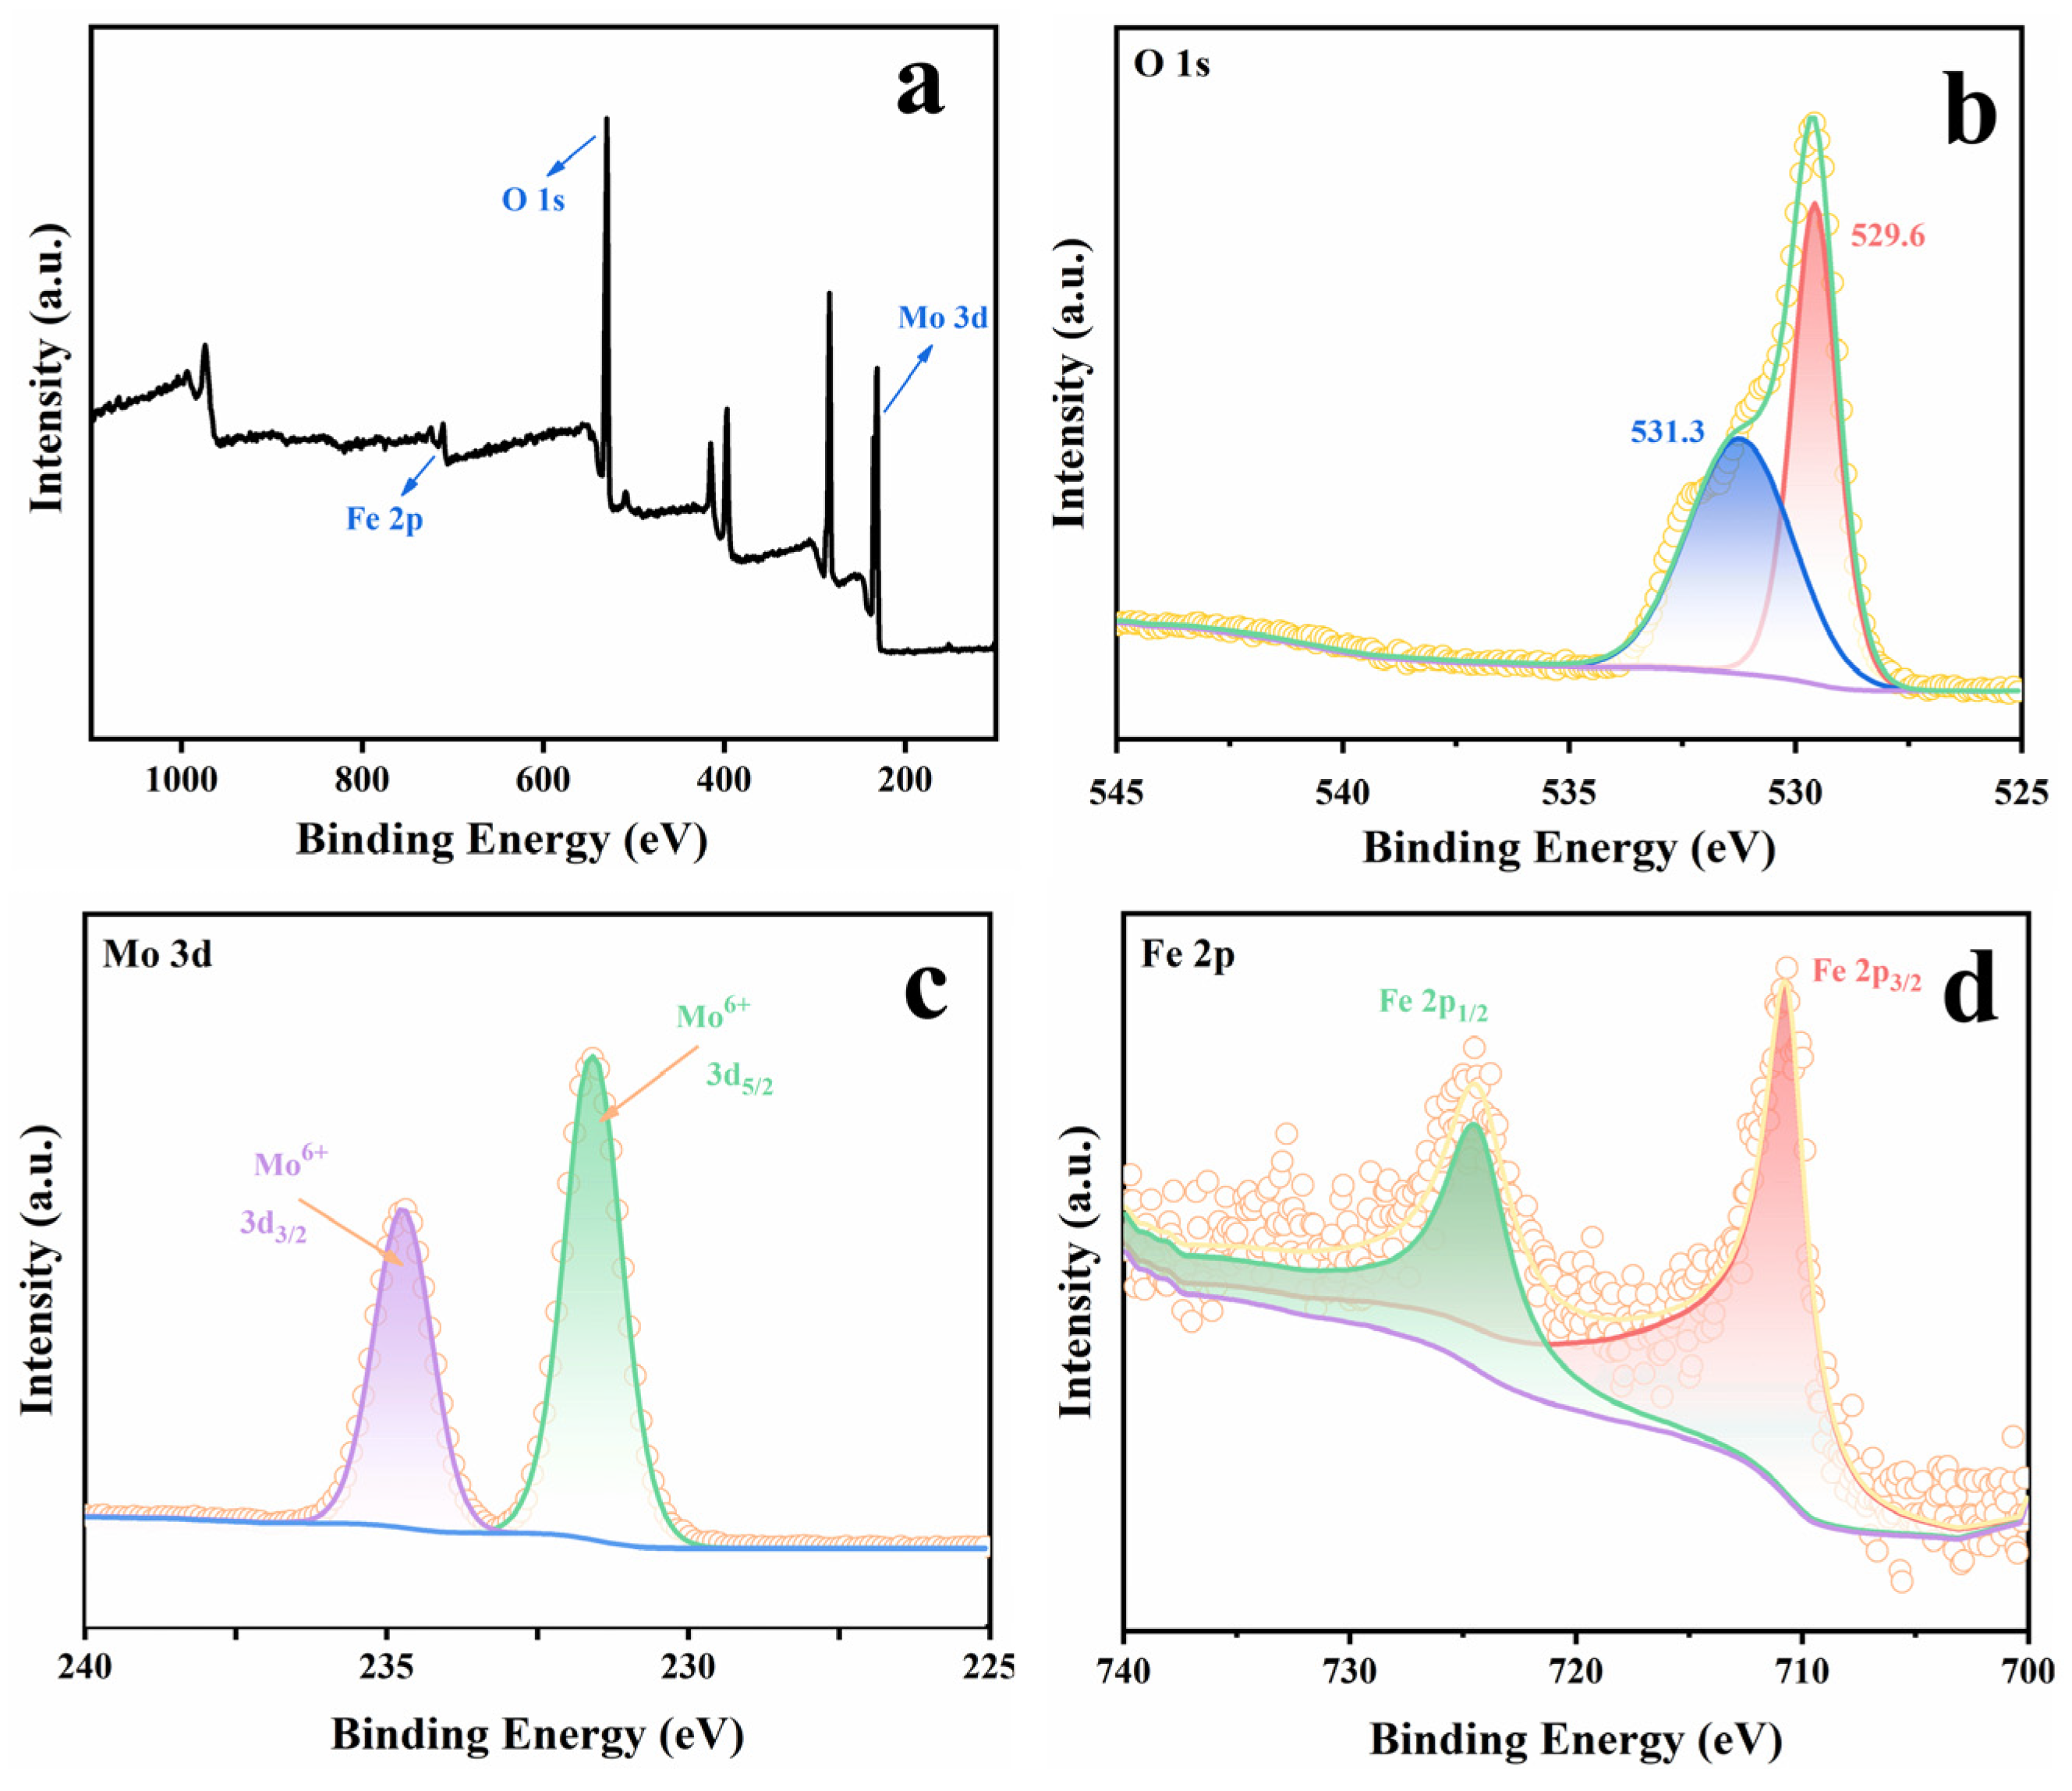
XPS characterization of Fe2(MoO4)3 nanorods was performed to identify its chemical valence and chemical elements. The XPS survey spectra showed that the Fe, Mo, and O elements existed in FMO-2, and the signals of Fe 2p, Mo 3d, and O 1s were clearly observed (Figure 6a). The two peaks of O located near 531.1 and 529.6 eV could be identified from the curve of the O 1s region (Figure 6b). The binding energy peaks of Mo 3d at 234.8 and 231.6 eV belonged to the orbital electrons of 3d5/2 and 3d3/2 of Mo6+, respectively [34,35] (Figure 6c). The curves of Fe 2p were fitted into two peaks of Fe 2p3/2 and Fe 2p1/2 at 724.6 and 710.8 eV, respectively, revealing the presence of Fe3+ [36,37] (Figure 6d).

2.2. ESP Yields of Ethanolysis

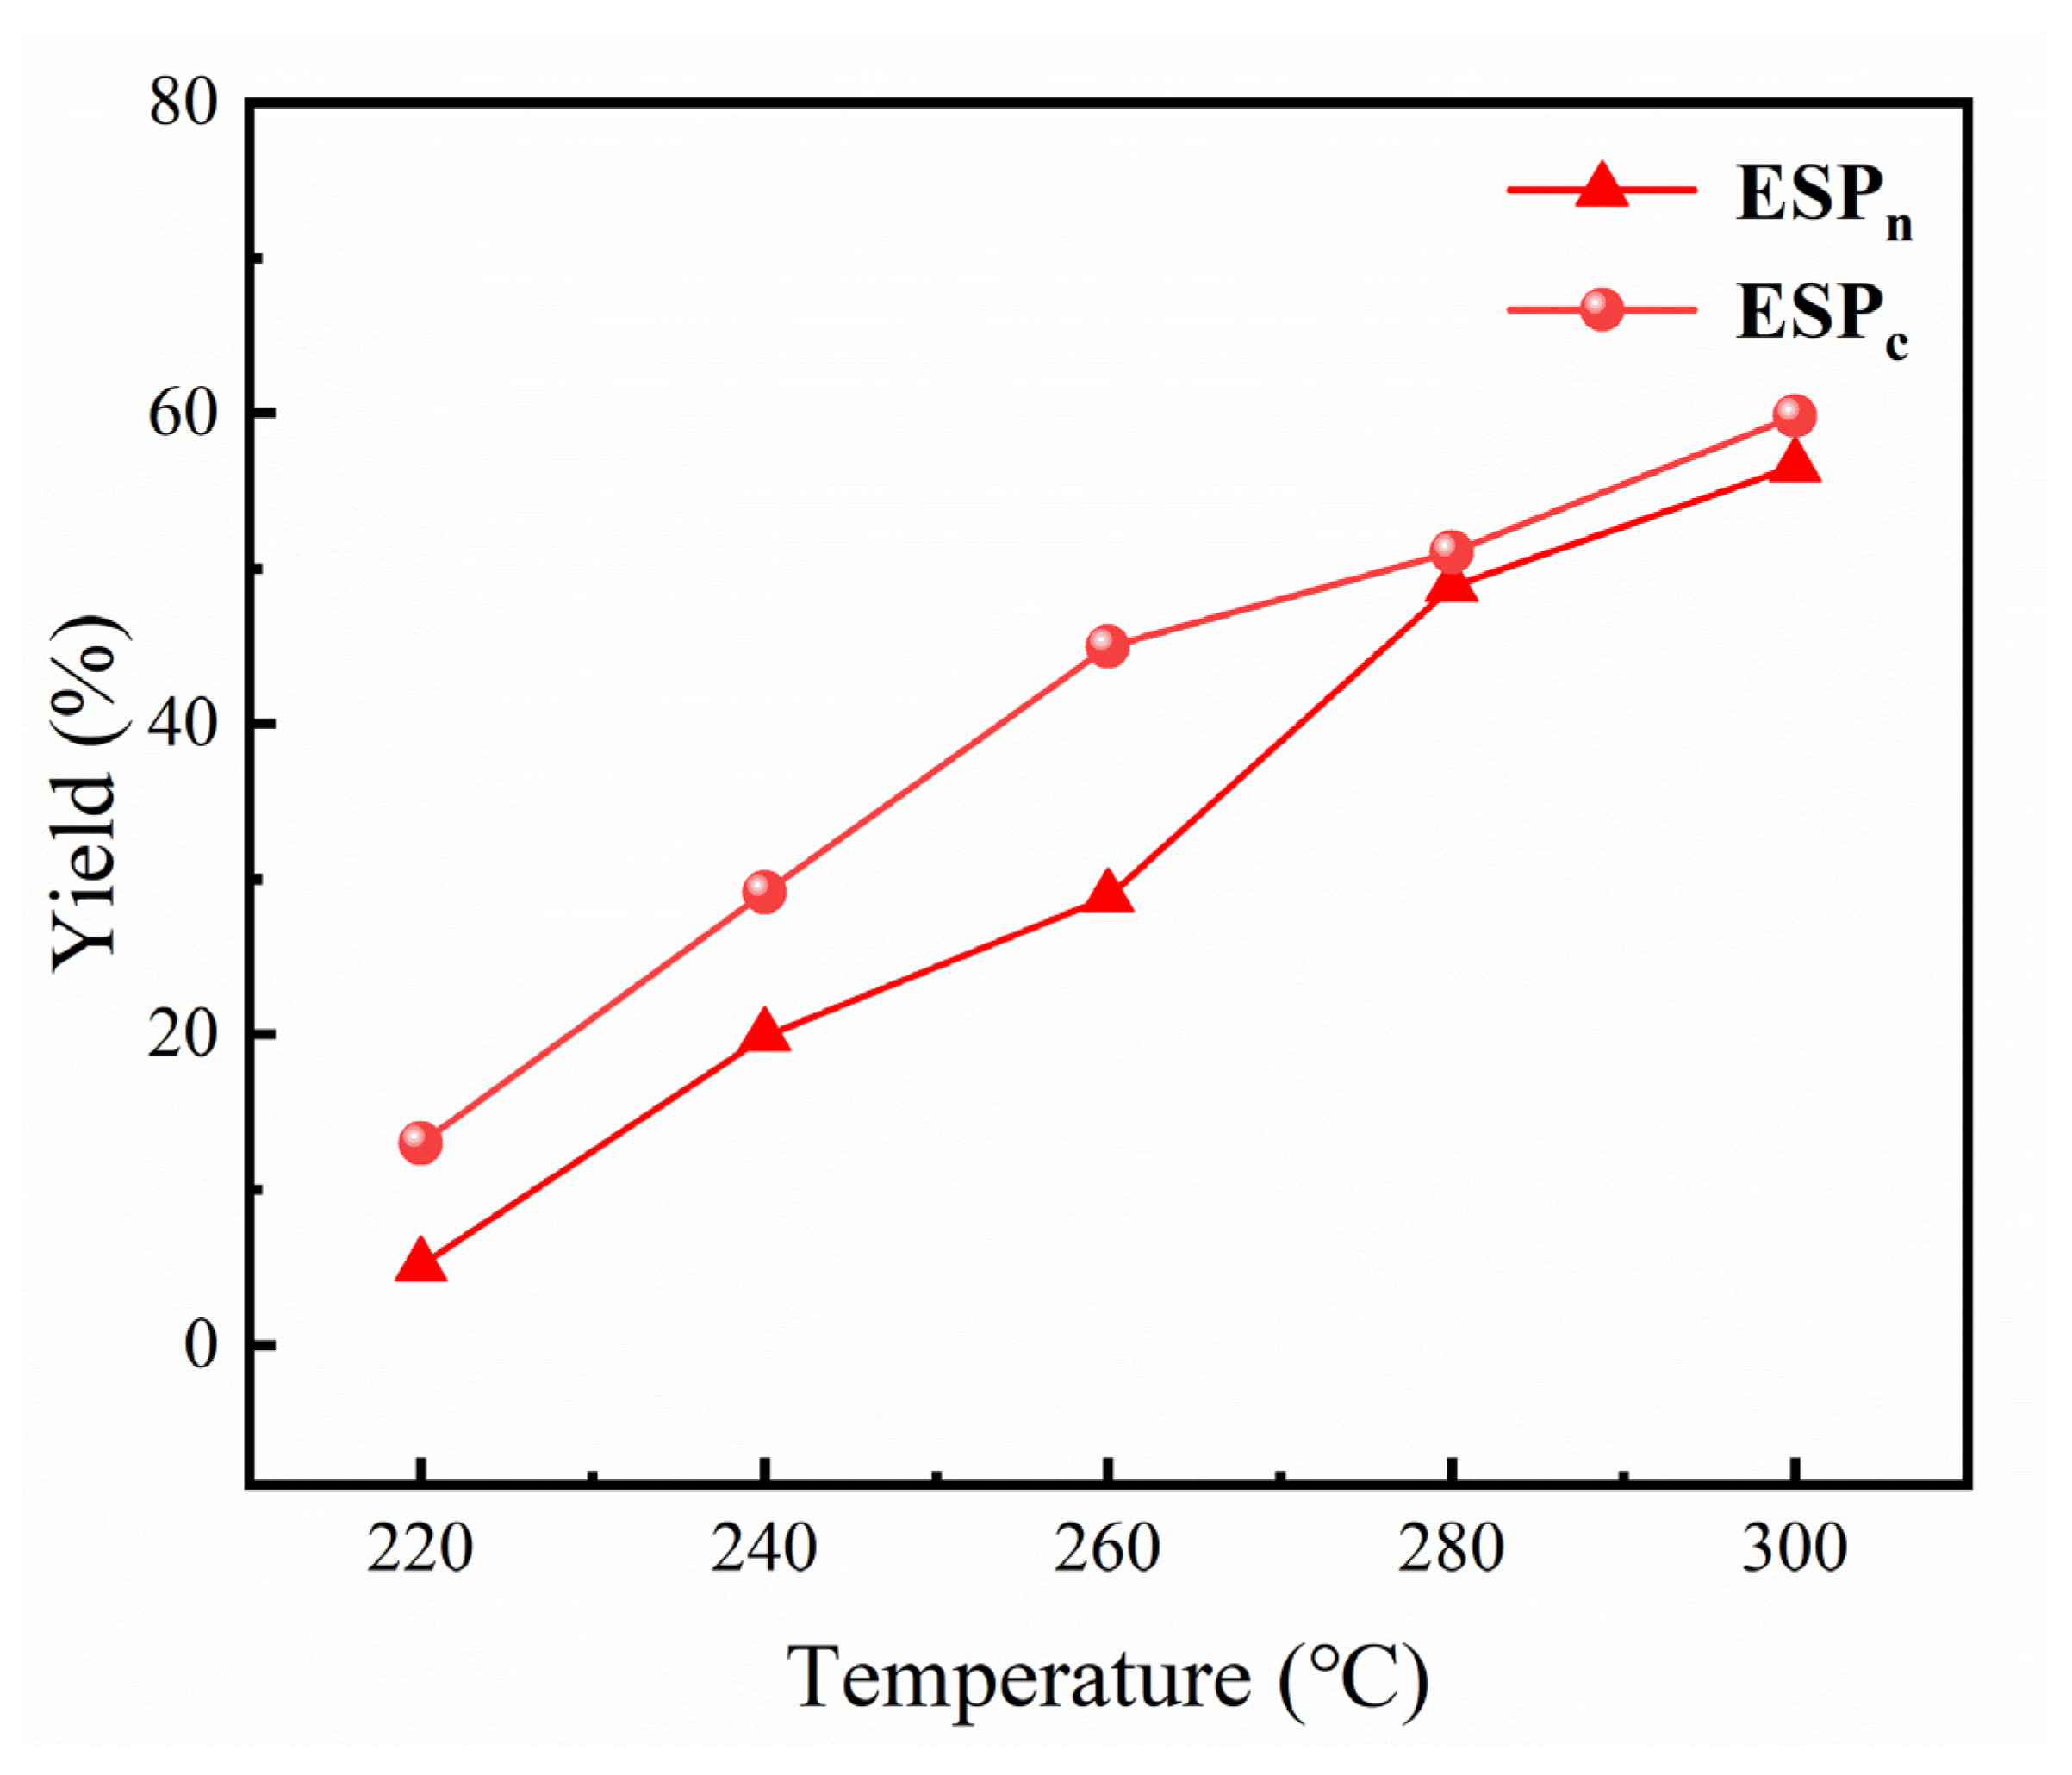
The effect of the Fe2(MoO4)3 catalyst on the ethanolysis of NMHC at different temperature was investigated. As Figure 7 shows, with the addition of FMO-1, the ESP yield increased significantly from 220 °C to 260 °C. However, at temperatures of 280 and 300 °C, the yield of ESP stopped increasing due to a large amount of gas produced by the catalytic cracking effect of FMO-1 above 280 °C. The largest increase in ESP yield, from 28.84% to 44.98%, was at 260 °C after adding the catalyst. Therefore, 260 °C was chosen as the temperature for catalytic ethanolysis.
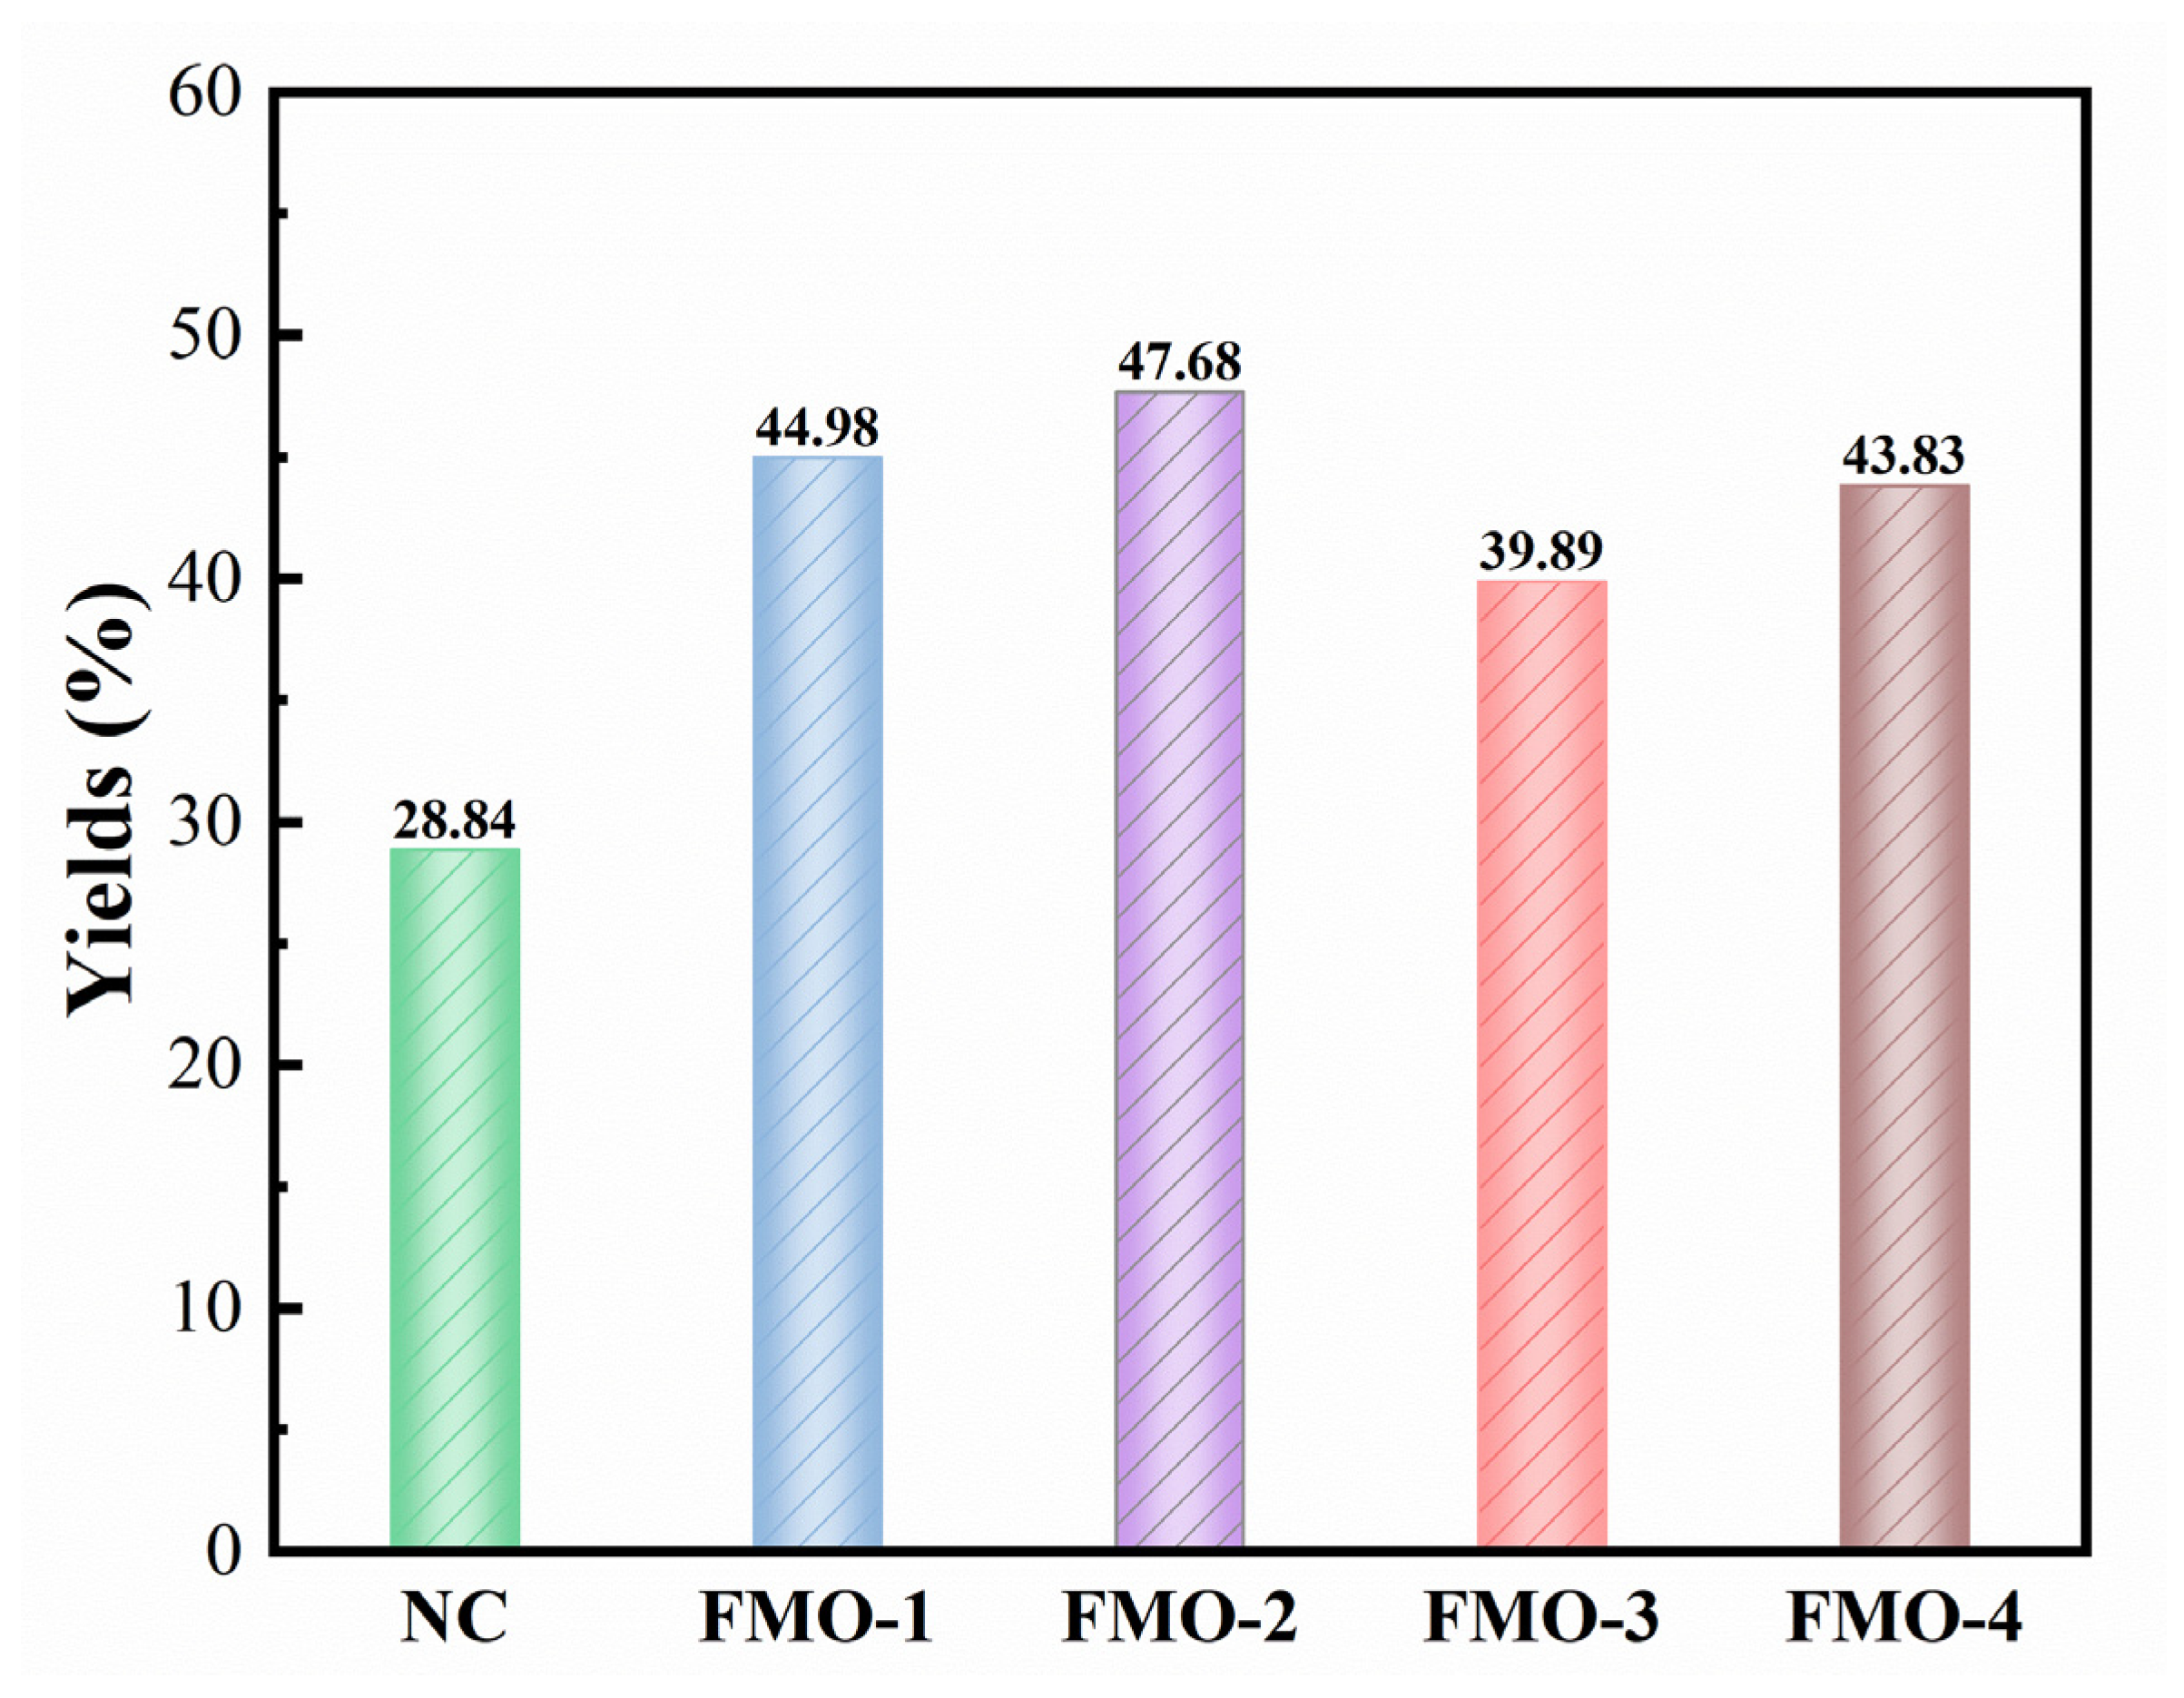
Next, the catalytic activities of Fe2(MoO4)3 catalysts with different morphologies during ethanolysis were investigated at 260 °C. The results indicated an obvious improvement in ESP yield after adding the catalysts (Figure 8). Among the four catalysts, FMO-2 showed the best catalytic activity, with the yield of ESP increasing from 28.84% to 47.68%. To investigate the mechanism underlying the different catalyst activity of the Fe2(MoO4)3 catalysts, BET was conducted on the four samples. The results are shown in Table S1. According to Table S1, the specific surface areas of FMO-1, FMO-2, FMO-3, and FMO-4 were 21.0127, 14.0543, 12.9181, and 17.6475 m2/g, respectively. It is worth noting that the FMO-2 sample had the best catalytic activity, but its specific surface areas was not satisfying. According to the literature, the active surface of Fe2(MoO4)3 consists of (100) facets [38,39,40]. The HRTEM results showed that the (100) facets of FMO-2 were maximally exposed, and the maximum exposed surface of FMO-4 consisted of (031) facets. This is maybe why even though the specific surface area of FMO-2 was small, its catalytic activity was better than that of FMO-4. Therefore, the exposed surface plays an important role in the catalytic ethanolysis reaction.

2.3. Characterizations of ESP and Ethanolysis Residues (ER)

As shown in Figure 9, the FTIR spectra of ESP with different catalysts were basically the same. The absorbance peak around 3380 cm−1 was attributed to the OH bond. Compared with the condition without catalysts, the content of OH bonds in the ESP increased, which indicated that the C-O bonds were broken when the catalysts were added to the ethanolysis reaction. The absorbance peaks around 2854, 2925, 2960, 1458, and 1376 cm−1 were assigned to aliphatic moieties, such as alcohols and esters. The absorbance peak around 1714 cm−1 was caused by the stretching vibration of C=O in esters, aldehydes, and ketones, while the absorption peak of 1618 cm−1 was attributed to the C=C stretching vibration of the aromatic ring. From the FTIR, we could also see that the ESP were rich in oxygen-containing compounds, which was analyzed further by GC-MS.
To investigate the effect of the catalysts on product distribution, the ESP were analyzed by GC-MS. A total of 96 compounds were detected among the ESP of ethanolysis at 260 °C (ESPNC), and 138 compounds were detected among the ESP of ethanolysis catalyzed by FMO-2 at 260 °C (ESPFMO-2). They were classified as aliphatic hydrocarbons, aromatic hydrocarbons, esters, ethers, alcohols, acids, ketones, phenols, and heteroatomic compounds.
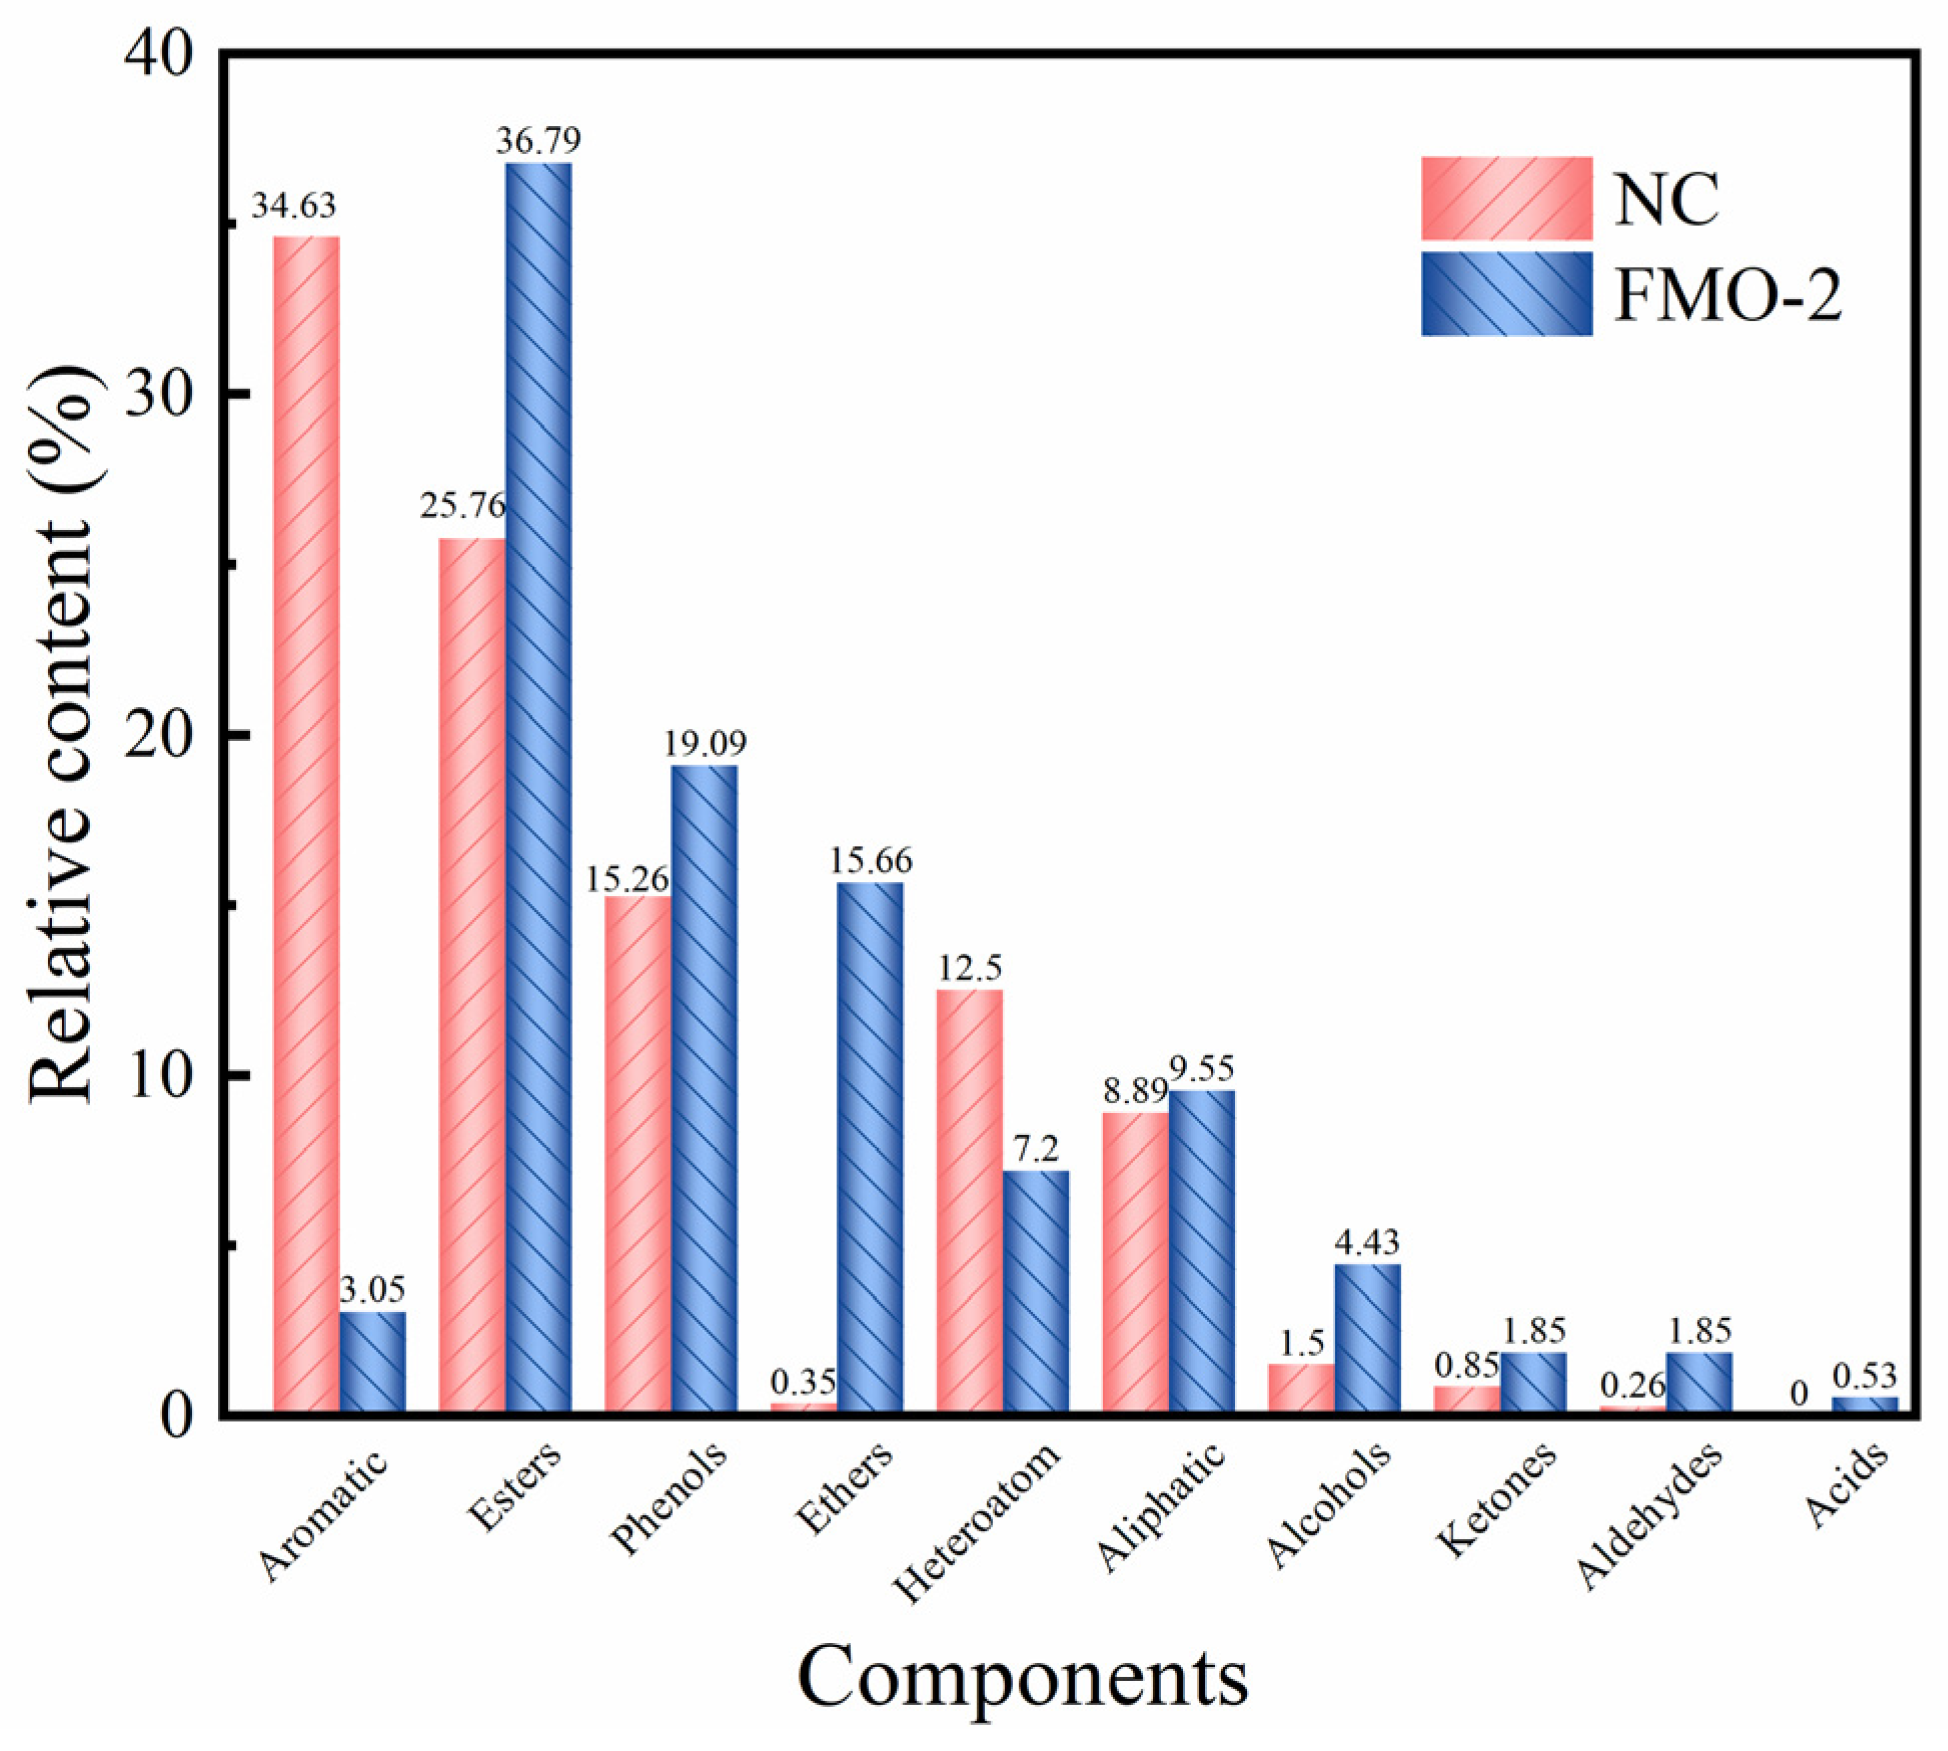
Figure 10 shows the compound distribution of ESPNC and ESPFMO-2. After the addition of FMO-2, the content of aromatic hydrocarbon was significantly reduced, from 34.63% to 3.05%, while the contents of esters, phenols, ethers, ketones, and other organic oxygen-containing compounds, which are considered important platform chemicals, increased significantly. The content of esters, mainly, fatty acid ethyl esters, increased from 25.76% to 35.79% (Table 1). These fatty acid ethyl ester compounds formed in two ways: by the esterification of ethanol with carboxylic acid in NMHC and the transesterification of ethanol with esters originally existing in NMHC. However, according to the FTIR (Figure S2) of NMHC, the content of carboxylic acid was low, which means that the ethyl compounds in the ESPs were mainly generated by the transesterification of ethanol with esters [10,21]. Therefore, FMO-2 as a catalyst can promote transesterification in ethanolysis. According to Table 2, most of the esters among the catalytic ethanolysis products have high molecular weights and are typically used in the preparation of fragrances and flavors.
The phenolic compounds in the ESP are shown in Table 2. The content of phenolic compounds increased from 15.26% to 19.09% after the addition of FMO-2. The phenolic compounds in the ESP were generated in two ways: either by dissolving the original phenolic compounds of NMHC in ethanol or by cleaving the Ar-CH2-O-Ar bond in NMHC [41]. The addition of the catalyst resulted in an increase in the content and type of phenolic compounds; so, the second rote should be their main way of production. The phenol compound content was 13.32% after the addition of FMO-2. Phenol is a raw material that has a high economic value and is used in the synthesis of phenolic resins [42]. Therefore, ethanolysis from lignite can be further developed for future phenol production.
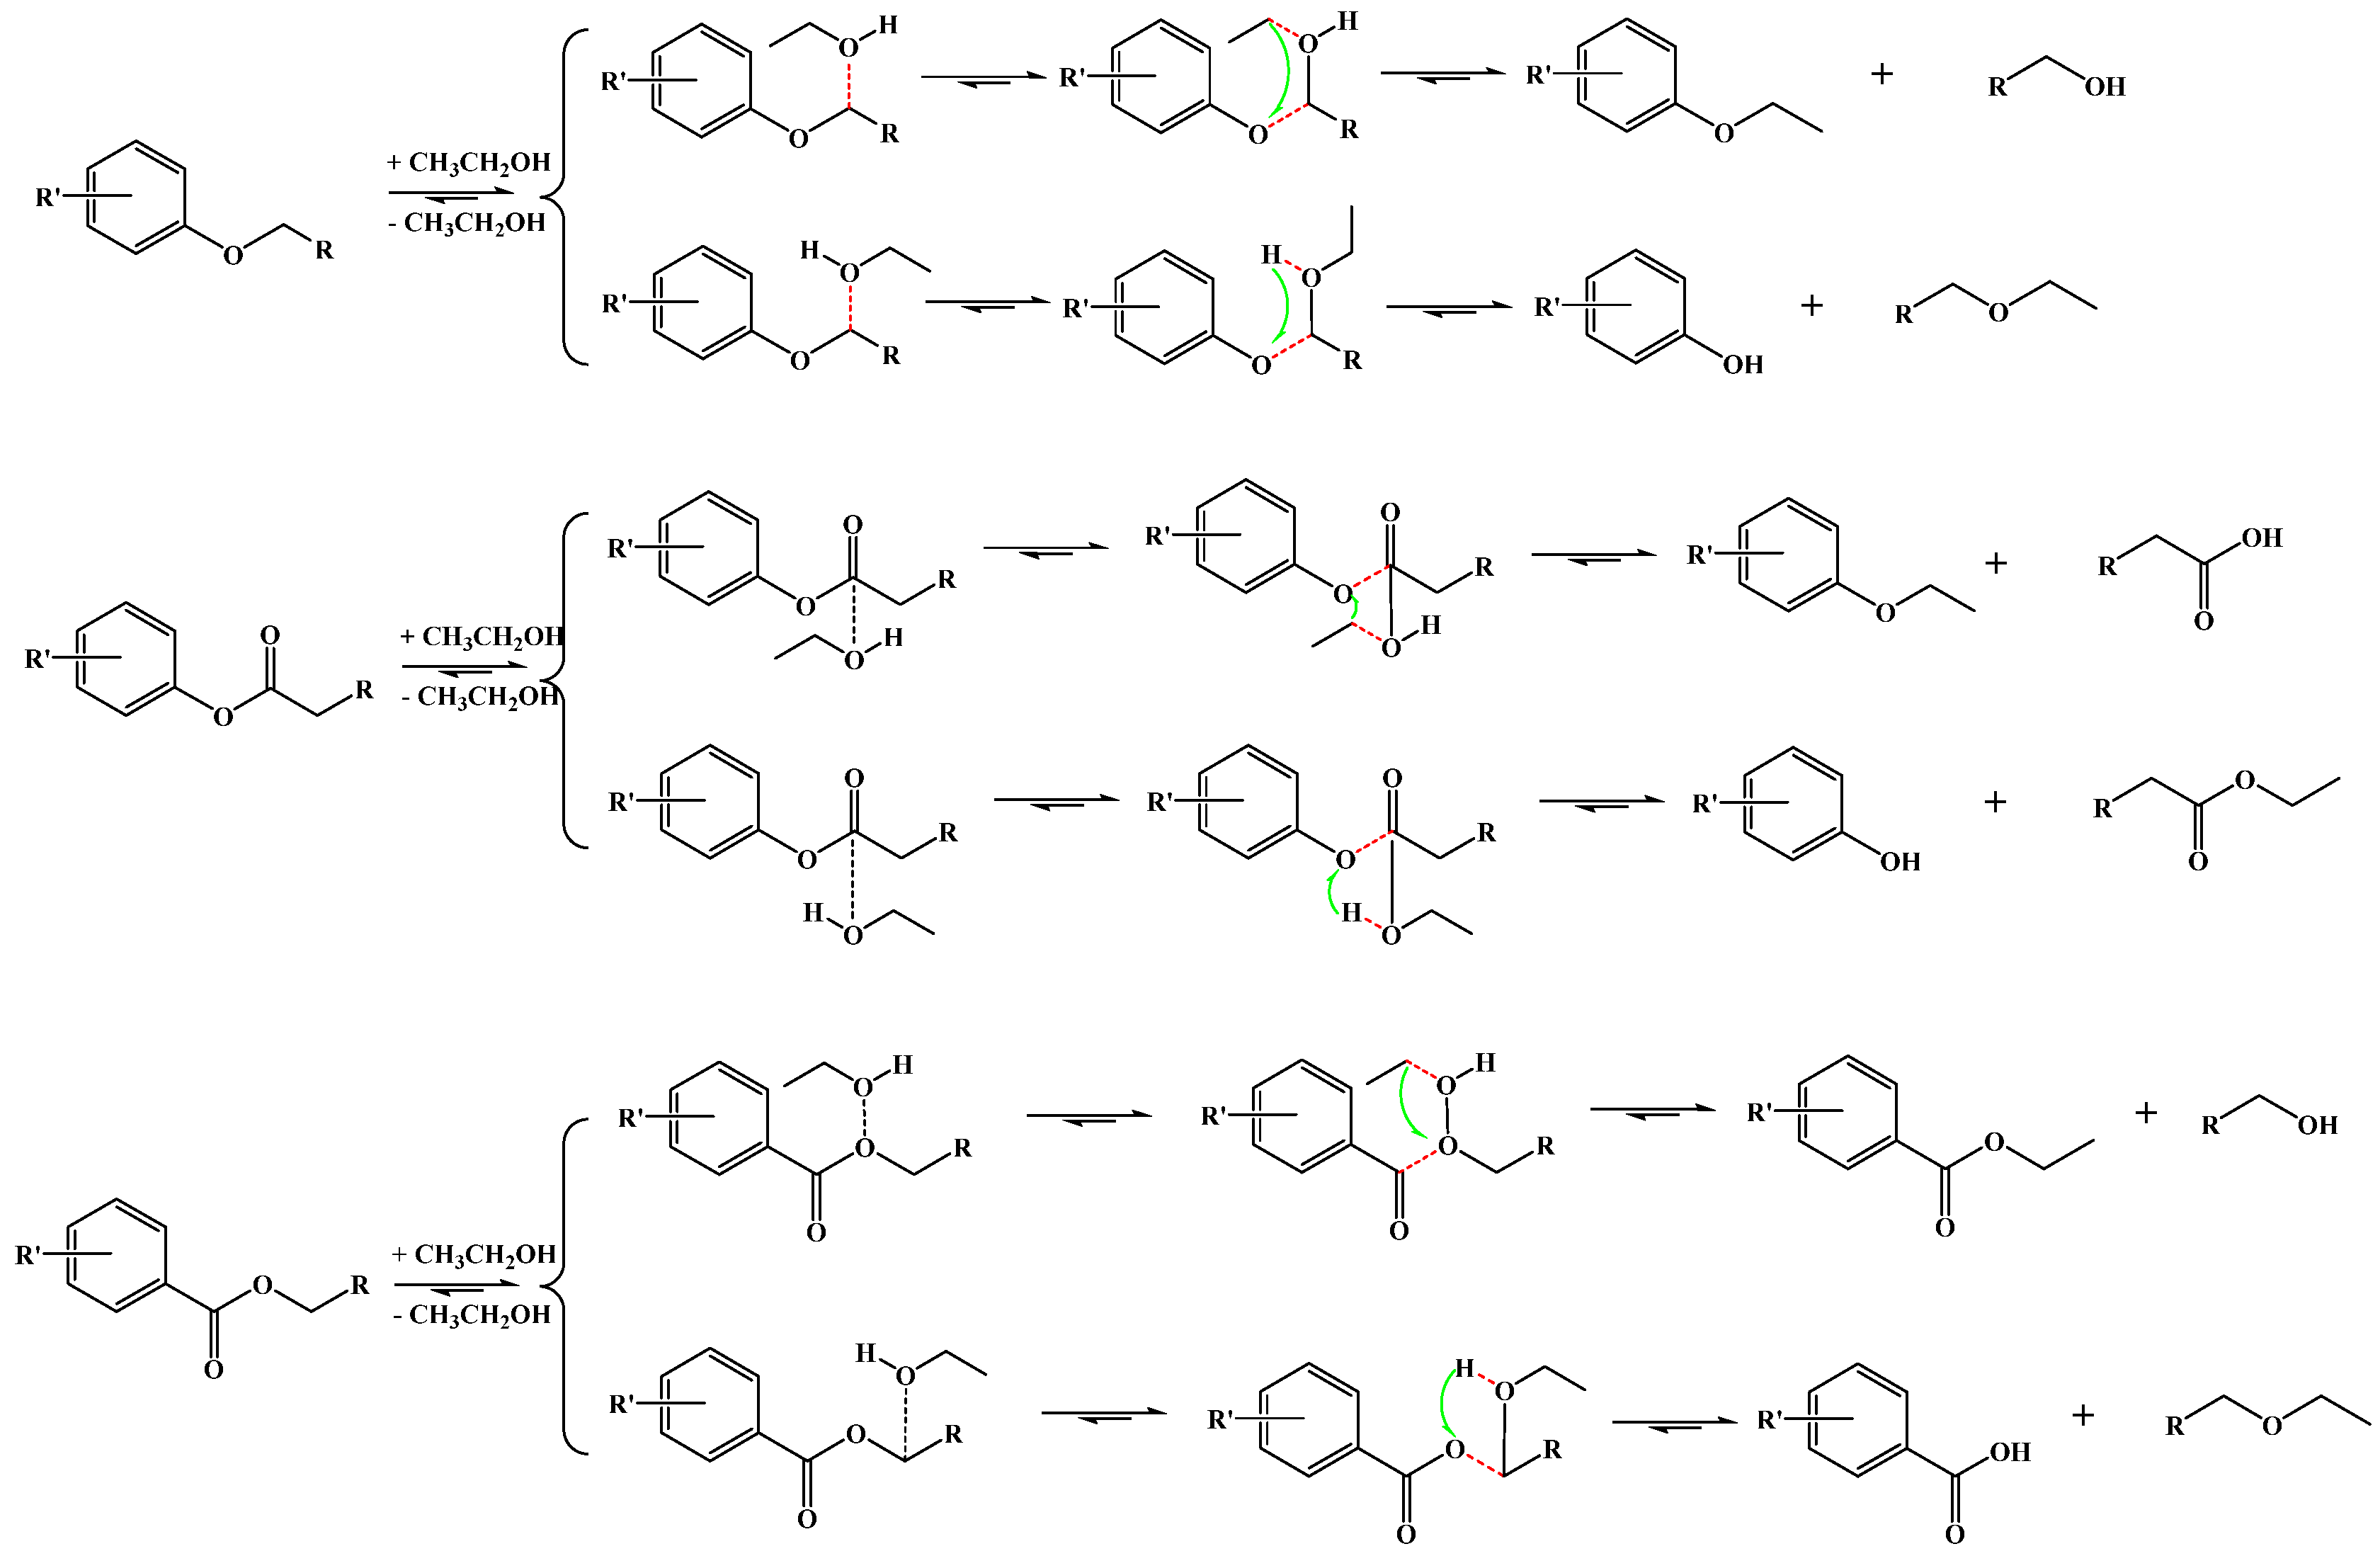
The ethers in the ESP increased from 0.35% to 15.66% after adding FMO-2. All identified ethers in the ESP are shown in Table S7. As can be seen, the ether compounds in the ESP mainly consisted of acetals with two ether bonds. Particularly, the content of 1,1-diethoxy-2-methylpropane (special ether), which was the most abundant compound in the ESP, was as high as 9.68%. There are two possible ways of ethers formation. One is the self-reaction of ethanol, and the other is the destruction of the C=O bonds in the coal by ethanol. The second possible formation mechanism is shown in Scheme 1; here, the ethanol, as a nucleophilic reagent, attacks the carbon atom attached to the oxygen to form a hemiacetal. The hemiacetal is unstable and continues to react with ethanol to form acetals. In the classification of the products detected by GC-MS, acetal was considered as a special ether. The FTIR analysis results also supported this conclusion. Above all, FMO-2 could change the product distribution of NMHC ethanolysis.
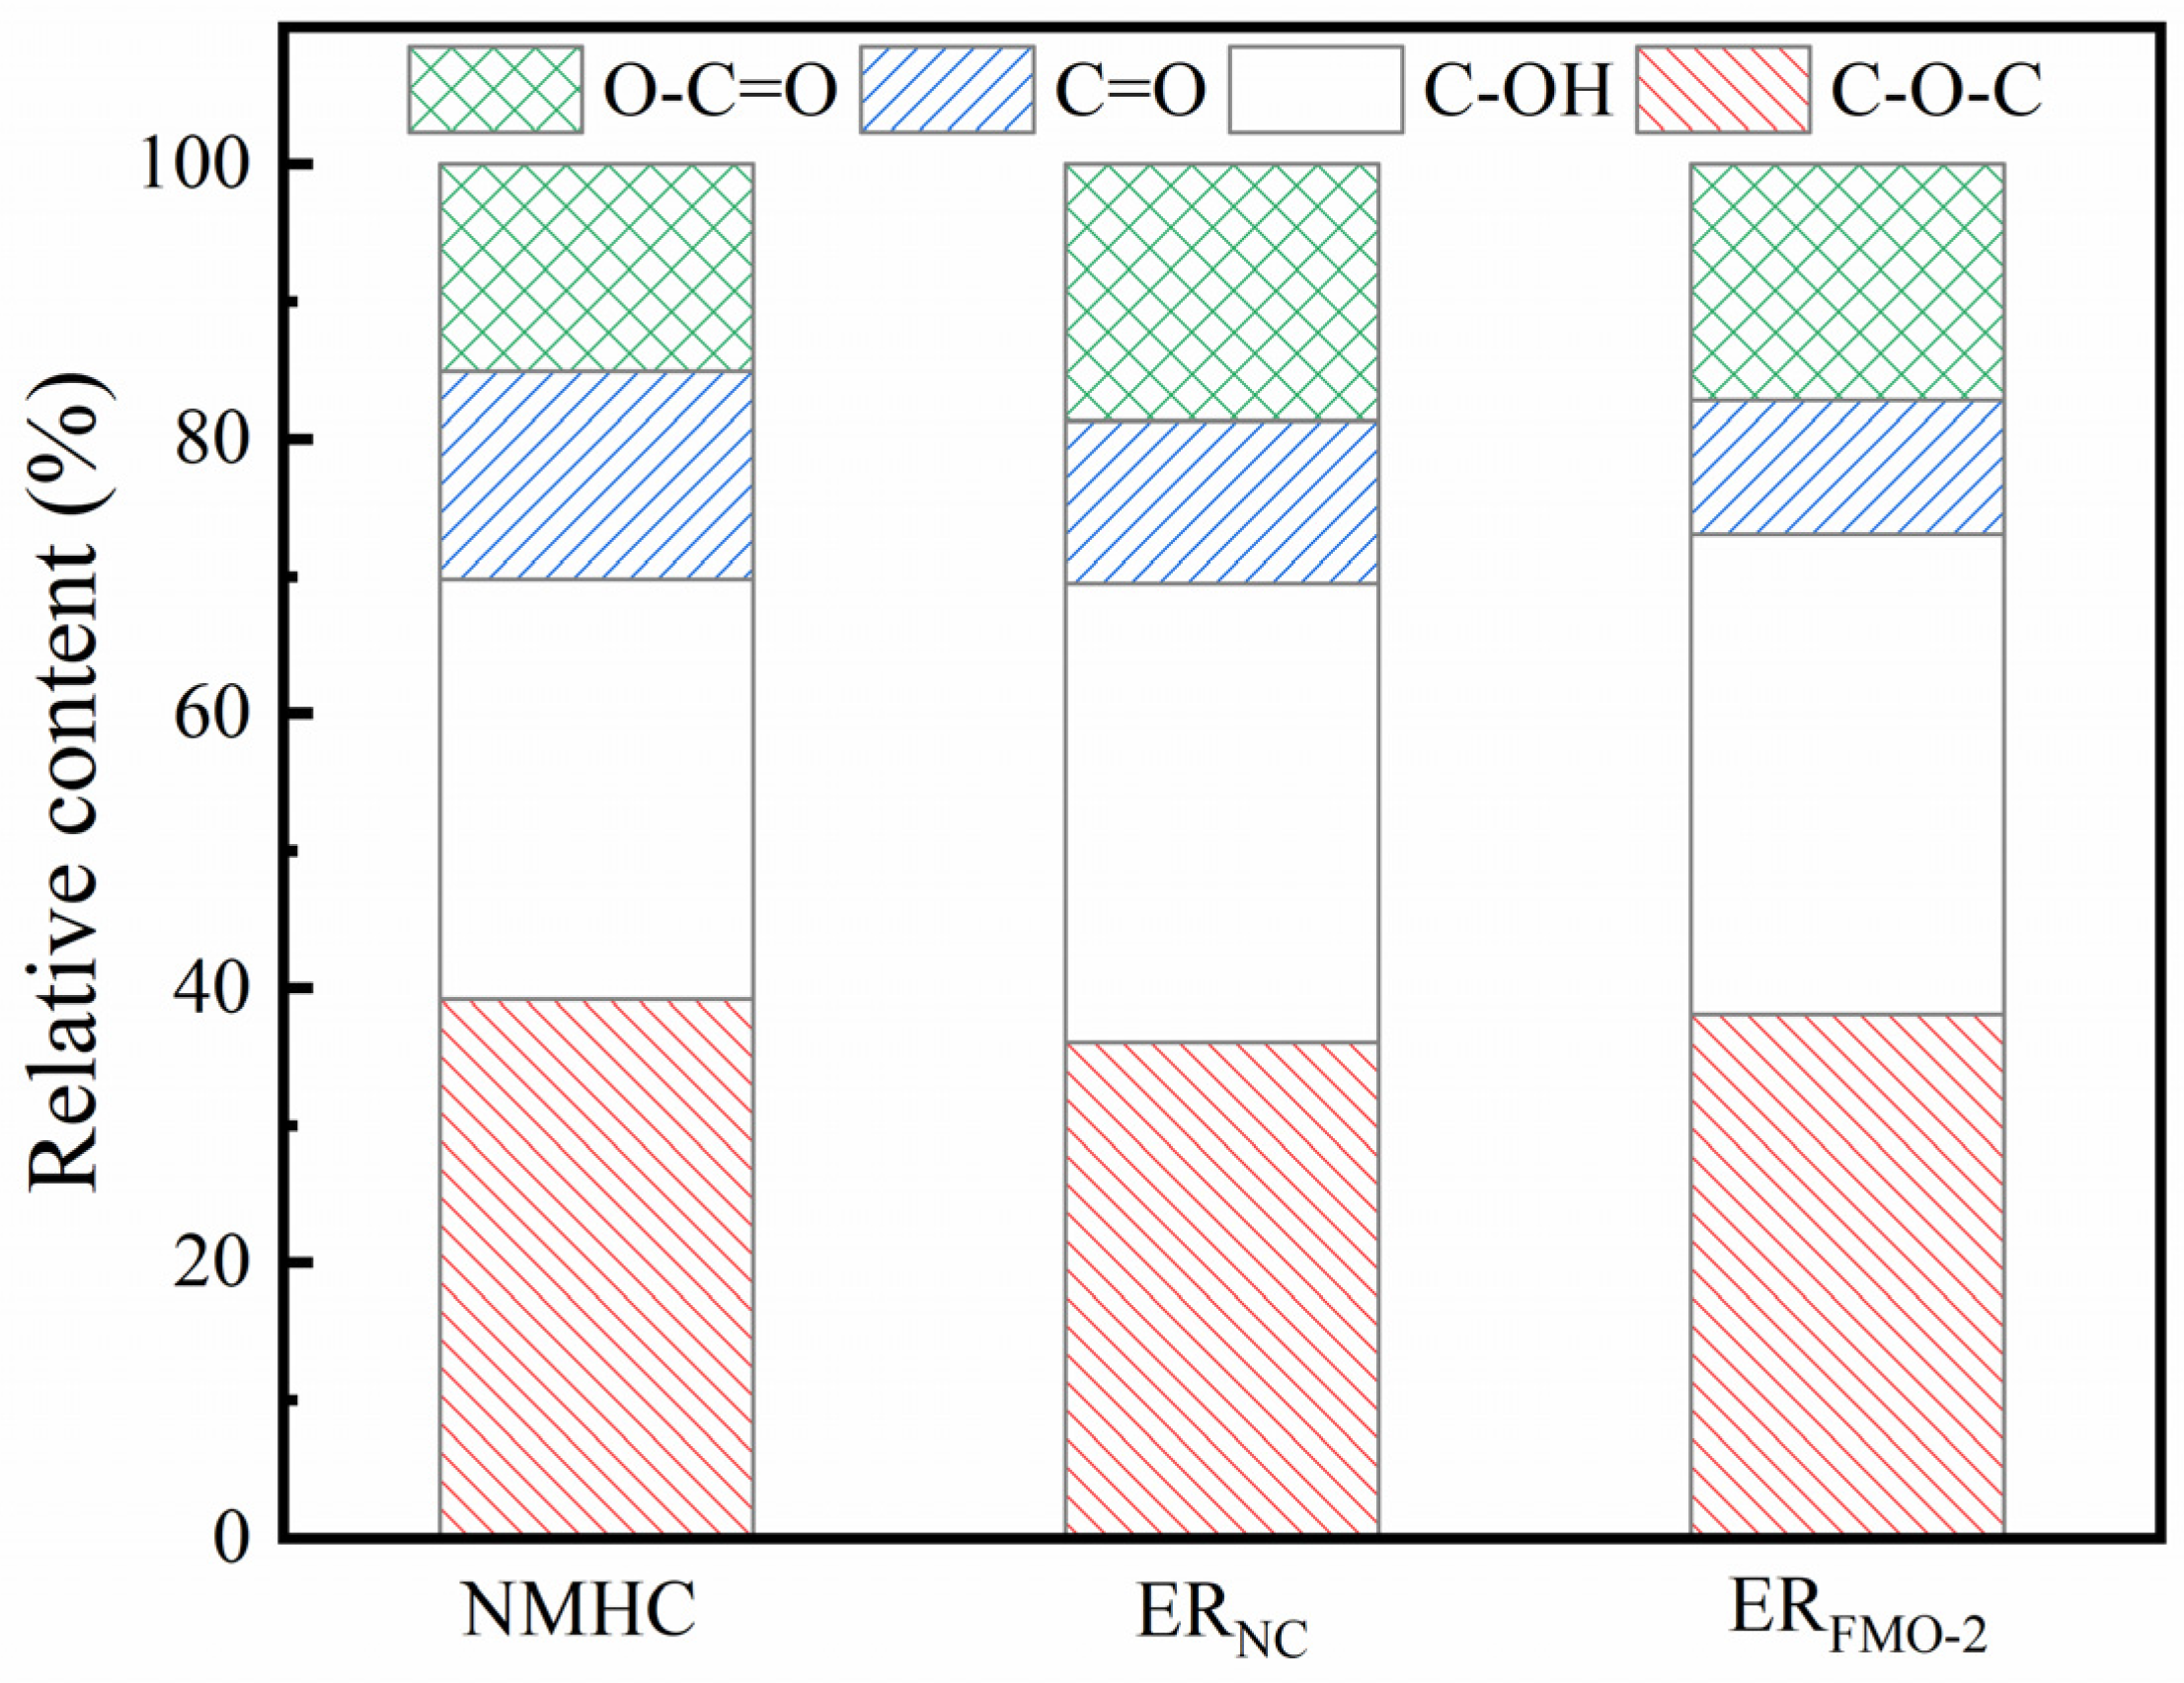
The FTIR of NMHC and ER is shown in Figure S2. In the FTIR spectra, the wavenumber range of 1000–1800 cm−1 is mainly the absorption vibration region of oxygen-containing functional groups [20]. There are four types of oxygen-containing functional groups in coal: O-C=O, C=O, C-OH, and C-O-C. To investigate the changes of oxygen-containing functional groups after the addition of the catalysts in the process of ethanol hydrolysis, 18 subcurves were fitted in the FTIR spectral region of 1000–1800 cm−1 (Figures S3–S5). The variation of oxygen-containing functional groups was calculated according to the fitted peak area, and the results are presented in Tables S10–S12. The total relative content of four oxygen-containing functional groups was set as 100%. The relative content change of these functional groups in NMHC and ER is displayed in Figure 11. As shown in Figure 10, C=O was broken after ethanolysis, and its relative content decreased from 15.1% in NMHC to 9.8% in ERFMO-2. The results indicated that the addition of ferric molybdate in the process of ethanolysis promoted the break of C=O bonds in coal.

2.4. Catalytic Activity in the Cleaving of BOB

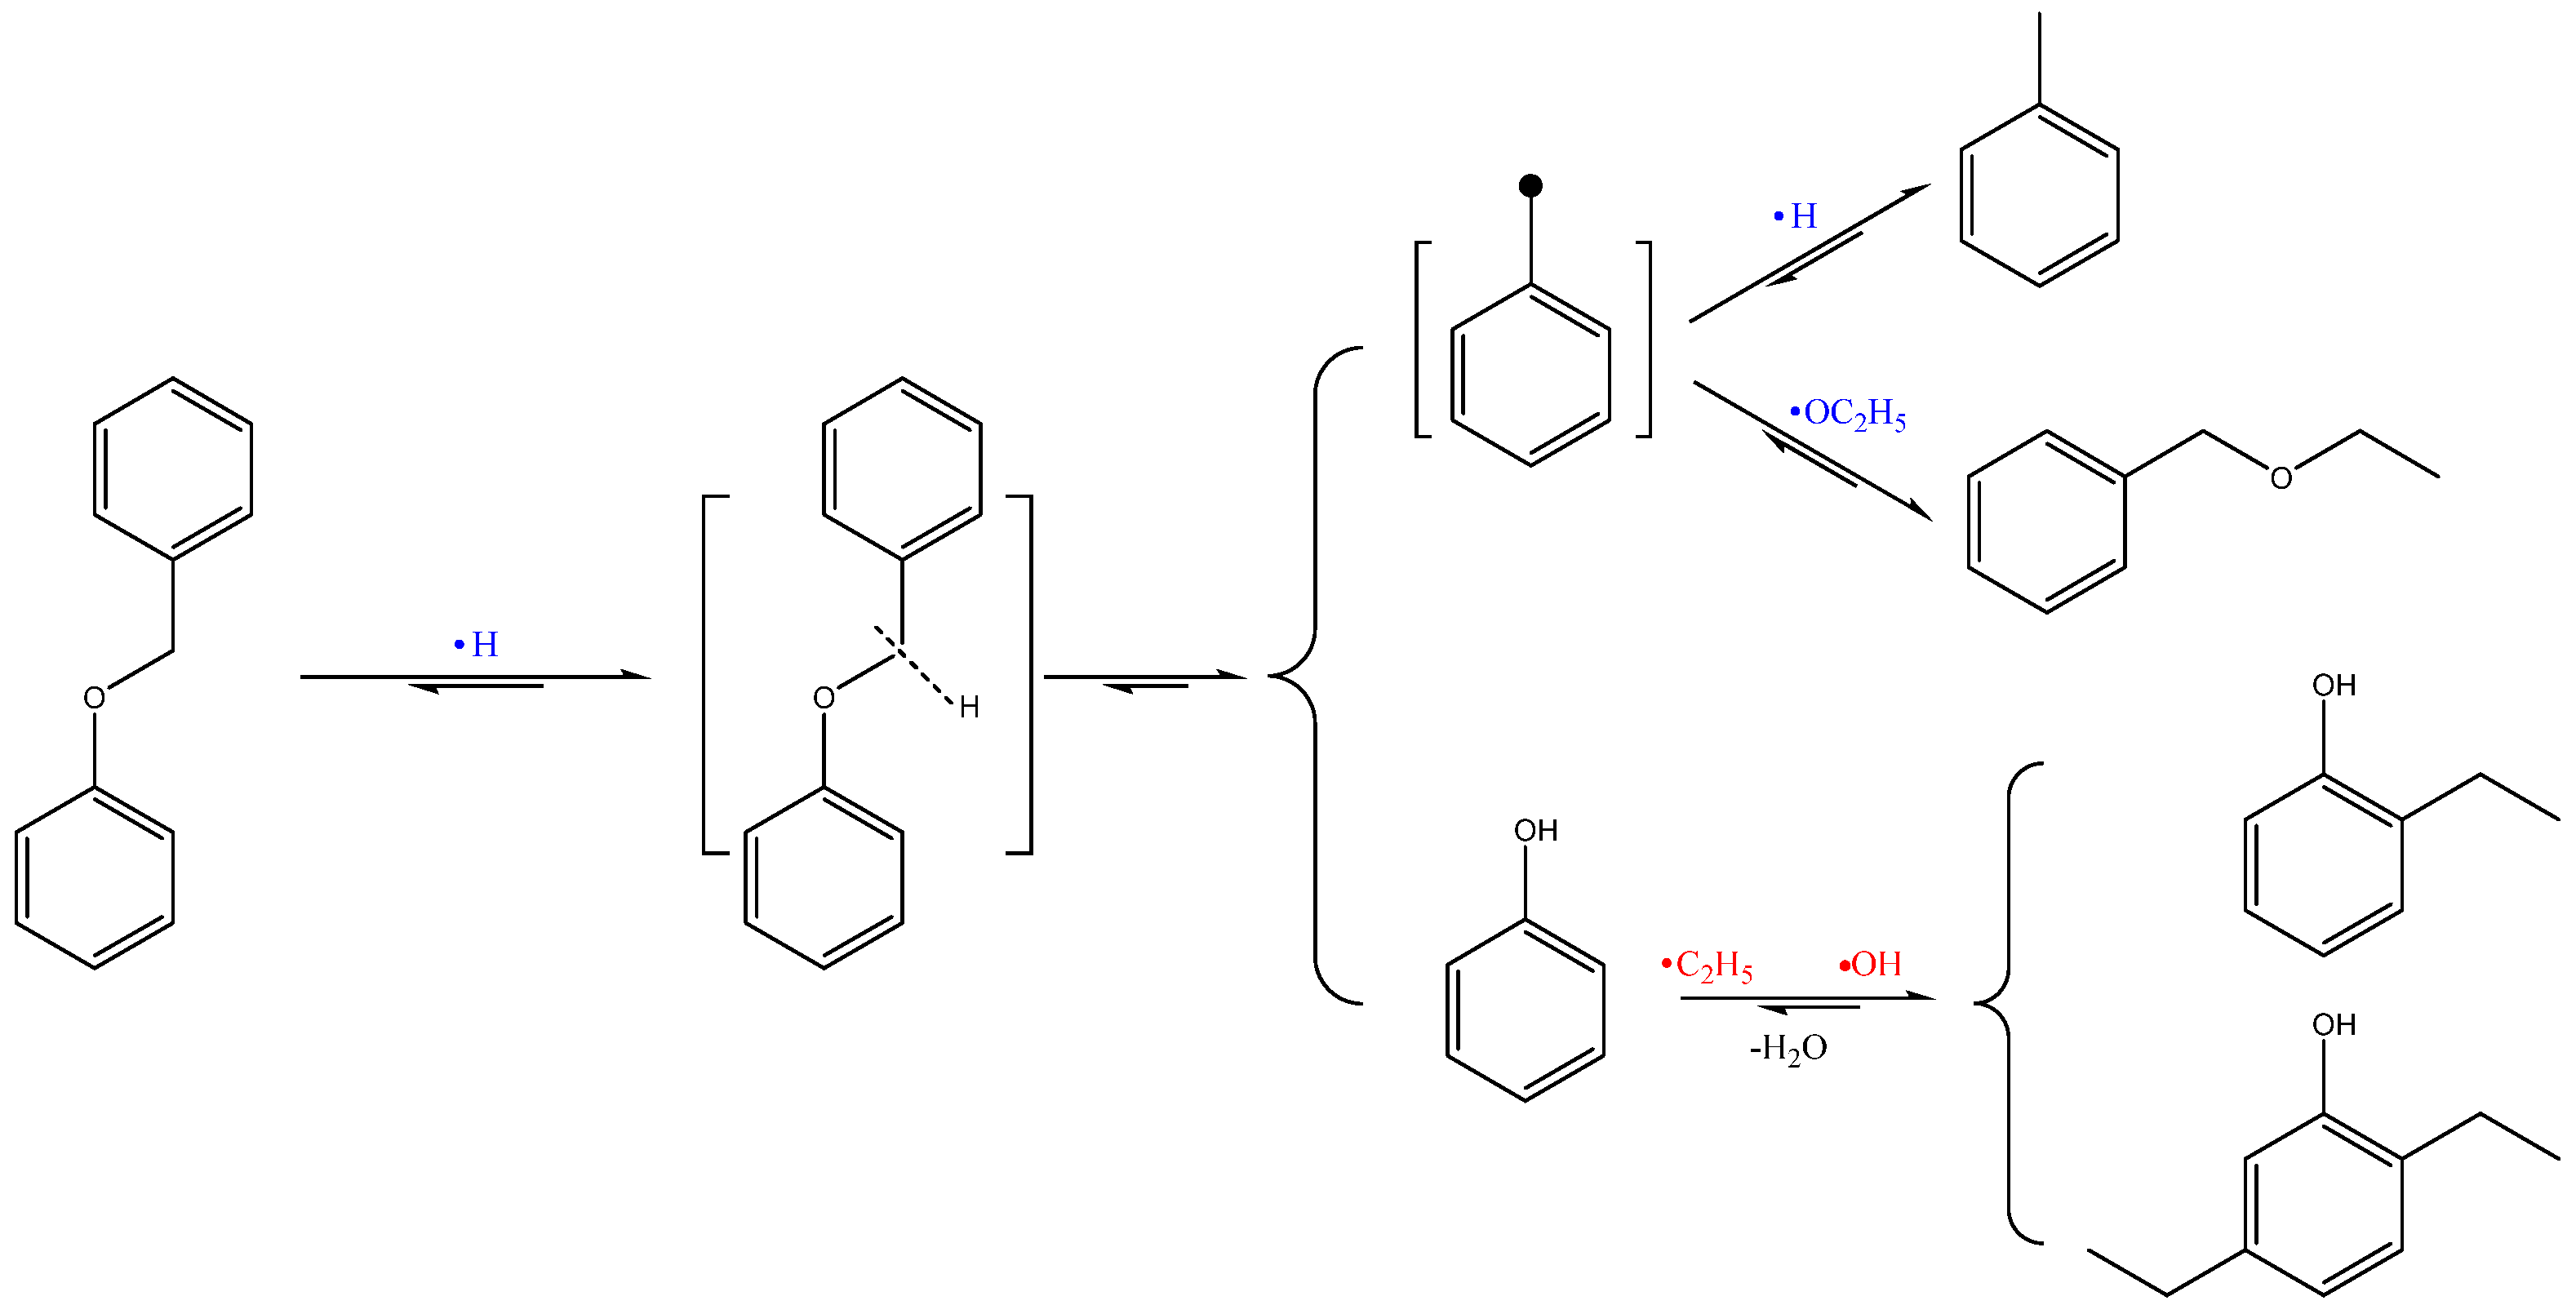
BOB was used as a model compound to explore the reaction mechanism during catalytic ethanolysis. The effects of different temperatures on the catalytic cracking of BOB by FMO-2 were investigated. As shown in Table 3, the conversion of BOB was only 46.77% at 220 °C and reached 92.39% at 240 °C. The conversion of BOB at 260 °C and 280 °C was 100%. Toluene, phenol, (ethoxymrethyl) benzene, 2-ethylphenol, and 2,5-diethylphenol were detected among the products. With the increase in the temperature, the amount of toluene among the products was basically unchanged, while the amount of phenol gradually decreased, and those of 2-ethylphenol and 2,5-diethylphenol gradually increased. The conversion rate was 100% at 260 °C, and there was a lower quantity of rearrangement products. Thus, we chose 260 °C as the temperature at which to study the catalytic ethanolysis of NMHC.
The possible reaction pathways of FMO-2-catalyzed BOB ethanolysis are shown in Scheme 2. As can be seen, ethanol activated on Fe2(MoO4)3 nanorods could release H· and CH3CH2O·, and the breaking of the C-O bond in BOB produced phenol and benzyl. Benzyl reacted with H· and CH3CH2O· to form toluene and (ethoxymrethyl) benzene, respectively. As the temperature increased, ethanol was activated to OH· and CH3CH2·, and phenol reacted with CH3CH2· to form 2-ethylphenol and 2,5-diethylphenol. Meanwhile, 2-ethylphenol and 2,5-diethylphenol were detected among the products of FMO-2-catalyzed ethanolysis. Therefore, during catalytic ethanolysis, ethanol may also be activated to form OH· and CH3CH2·.

2.5. Possible Mechanisms of NMHC Catalytic Ethanolysis

A possible reaction pathway for catalytic ethanolysis in the presence of FMO-2 was inferred from the mechanism of the reaction with the model compound. The possible reaction pathway for NMHC catalytic ethanolysis is shown in Scheme 3. R denotes an alkyl or aryl group, and R’ denotes an alkyl group. Based on the experimental results obtained with the model compounds, ethanol activated on FMO-2 could release H· and CH3CH2O·, ethanol could also be activated to form OH· and CH3CH2·. In addition, FMO-2 could reduce the activation energy of the C-O bond breakage, thus promoting C-O bond breakage in coal [43]. As we can see in the Scheme 3, ethanol acted as nucleophilic reagents to attack the C-O bonds in NMHC. Oxygen in OH· and CH3CH2O·, as a nucleophile atom, attacked the C-O bond in NMHC to produce oxygen-containing organic compounds such as alkanols, phenols, esters, and ethers. FMO-2 weakened the C-O and O-H bonds in ethanol, making the oxygen in ethanol more reactive and thus promoting the formation of oxygen-containing compounds.

3. Materials and Methods

3.1. Materials

Lignite was collected in Naomaohu, Xinjiang, China, and denoted as NMHC. The coal was pulverized and passed through a 200-mesh sieve; its proximate and ultimate analyses are shown in Table 4. The pulverized coal samples were dried in an oven at 60 °C for 48 h. Fe(NO3)3·9H2O, (NH4)6Mo7O24·7H2O, Na2MoO4·2H2O, H2O2, HNO3, and phenylbenzyl ether (BOB) were used as analytical reagents and were purchased from Sinopharm Chemical Reagent.

3.2. Synthesis of the Fe2(MoO4)3 Samples

Fe2(MoO4)3 nanoparticles: ammonium molybdate (1.05 g), ferric nitrate (0.60 g), zinc chloride (5.45 g), and potassium chloride (2.98 g) were ground for 1 h in a ball milling tank. Then, the mixture was calcined at 320 °C with 2 h. A green product was obtained after washing with DI water and drying (denoted as FMO-1).
Fe2(MoO4)3 nanorods: we mixed 7.20 g of molybdenum trioxide powder with 50 mL of 30% hydrogen peroxide by stirring. Next, 27 mL concentrated nitric acid and 170 mL deionized water were added to the above solution and left for 4 days. Afterwards, 60 mL of the mixture was transferred to 100 mL of the lining of PTEE and reacted at 170 °C for 12 h. At the end of the reaction, the precipitate was separated by centrifugation to obtain molybdenum trioxide nanorods. The prepared molybdenum trioxide nanorods were stirred vigorously and dispersed in 100 mL of deionized water, Next, 0.90 g of ferric nitrate was added to the suspension, after which it was stirred at 50 °C for 2 h. After calcination at 500 °C for 4 h, the product was obtained (denoted as FMO-2).
Fe2(MoO4)3 nanosheet: sodium molybdate (1.84 g) and ferric nitrate (2.05 g) were dissolved in 60 mL of DI water. The solution was transferred into the lining of PTEE and heated at 140 °C for 8 h. Then, it was washed and dried to obtain a green product (denoted as FMO-3).
Fe2(MoO4)3 nanoflower: ammonium molybdate (0.37 g) and ferric nitrate (0.56 g) were dissolved in a solvent consisting of 30 mL of DI water and 30 mL of absolute ethanol, within a round-bottom flask. Then, the round-bottom flask was transferred to a microwave reactor and reacted at 90 °C for 30 min. A product was obtained after cleaning and drying the material and was denoted as FMO-4.

3.3. Ethanolysis

The ethanolysis experiment was conducted in a 100 cm3 high-pressure mechanical agitation batch reactor, in which 3.00 g of dried pulverized coal sample and 60 mL of ethanol, accurately weighed were placed. The reactor was sealed, and the air in the autoclave was replaced three times with nitrogen, with 2 Mpa nitrogen as the initial pressure. Then, the reactor was heated to the desired temperature (220 °C, 240 °C, 260 °C, 280 °C, and 300 °C) for 1 h. Once the reaction was completed, the reactor was cooled to room temperature rapidly. The residue and filtrate were separated by a sand core funnel. The filtrate was evaporated by a rotary evaporator to obtain the ESP, and the residue (ER) was dried using a vacuum drying oven. All experiments were conducted in parallel for three times. The ESP yield (YESP) was calculated as the ratio of the mass of ESP (mESP) to the mass of dried ash-free base coal (mNMHC, daf), i.e., YESP = mESP/mNMHC, daf.

3.4. Catalytic Ethanolysis of BOB

About 20 mL of ethanol, 50 mg of catalyst, and 1 mmol of BOB were added to a 50 mL autoclave, after which the air was replaced with N2 for three times and charged with 1 MPa of N2. Then, the temperature was increased to 220 °C, 240 °C, 260 °C, and 280 °C and kept for 2 h. After the reaction, the products were separated. Then, the filtrate was analyzed by GC-MS.

3.5. Characterization

The physical phase analysis of the synthesized samples was carried out with X-ray diffraction (XRD, Bruker D8 power diffractometer). The scanning was performed between 2θ of 10° and 80° at a scanning rate of 8°/min. The morphology and microstructure of the samples were characterized with scanning electron microscopy (FESEM, Hitachi S-4800). Transmission electron microscopy (TEM) and high-resolution transmission electron microscopy (HRTEM) were performed by using a FEI-TALOS-F200X microscope. Specific surface areas were calculated with Brunauer–Emmtt–Teller (BET) method. Fourier transform infrared spectrometry (FTIR) of the ESP was carried out with a VERTEX-70 infrared (IR) spectrometer using the KBr pellet technique, recorded from 4000 to 400 cm−1, and then analyzed using 16 scans. The composition of the ESP was analyzed using a Pegasus 4D®/7890B GC-MS. The GC-MS was equipped with a Petro column (50 m × 0.2 mm × 0.5 μm), with an initial column temperature of 60 °C held for 1 min.

4. Conclusions

In this work, Fe2(MoO4)3 catalysts with varying dimensions and morphologies were successfully synthesized by different methods, and a series of characterizations were carried out. Four catalysts were applied to the ethanolysis of NMHC, showing good activity; among them, Fe2(MoO4)3 nanorods exhibited the highest catalytic activity. The yield of Fe2(MoO4)3 nanorod-catalyzed ethanolysis reached 47.68% at 260 °C, due to the fact that this catalyst maximized the exposure of the active (100) facets. The GC-MS results of the ESP from the catalytic ethanolysis showed that the amounts of esters, ethers, phenols, and ketones increased, while those of aliphatic hydrocarbons, aromatic hydrocarbons, and heteroatomic compounds decreased compared the corresponding quantities without a catalyst. This indicated that the Fe2(MoO4)3 nanorods catalysts not only significantly increased the ethanolysis yield, but also improved the product distribution. Moreover, the FTIR data were processed by split-peak fitting, and the results indicated that the carbon-oxygen bonds in the coal were broken during catalytic ethanolysis. It was also further verified using BOB as a model compound that the Fe2(MoO4)3 nanorods effectively broke the C-O bond of BOB at 260 °C. The results showed that the high-activity catalyst significantly increased the ESP yield and improved the content of oxygen-containing compounds. Possible reaction pathways for the ethanolysis of Naomaohu coal were deduced from the analysis of the products and model compounds. In summary, catalytic ethanolysis may be an alternative way for the efficient utilization of lignite, and a high-activity catalyst with a good microstructure will help to drive this process.

Supplementary Materials

The following supporting information can be downloaded at: https://www.mdpi.com/article/10.3390/molecules28186595/s1, Table S1: The specific surface area and average pore size and pore volume of the Fe2(MoO4)3 samples. Table S2: Ketones detected in the ESPNC and ESPFMO-2. Table S3: Alcohols detected in the ESPNC and ESPFMO-2. Table S4: Aromatic hydrocarbons detected in the ESPNC and ESPFMO-2. Table S5: Aliphatic hydrocarbons detected in the ESPNC and ESPFMO-2. Table S6: Acids detected in the ESPNC and ESPFMO-2. Table S7: Ethers detected in the ESPNC and ESPFMO-2. Table S8: Aldehydes detected in the ESPNC and ESPFMO-2. Table S9: Heteroatom compounds detected in the ESPNC and ESPFMO-2. Table S10: Oxygenated functional group region fitting peak information for NMHC. Table S11: Oxygenated functional group region fitting peak information for ERNC. Table S12: Oxygenated functional group region fitting peak information for ERFMO-2. Figure S1. NH3-TPD profile of FMO-2. Figure S2: FTIR spectrum of NMHC and ER. Figure S3: FTIR spectrum and related curves of oxygen-containing functional groups in NMHC. Figure S4: FTIR spectrum and related curves of oxygen-containing functional groups in ERNC. Figure S5: FTIR spectrum and related curves of oxygen-containing functional groups in ERFMO-2.

Author Contributions

T.L.: validation, investigation, writing—review and editing. X.S.: investigation, data curation, writing-original draft. Y.T., Y.Z. and J.L.: writing—review. X.Z. and X.L.: software. L.L.: funding acquisition, conceptualization, supervision. All authors have read and agreed to the published version of the manuscript.

Funding

This work was supported by the Natural Science Foundation of Xinjiang Uygur Autonomous Region (Grant 2022D01C71) and the Doctoral Research Foundation Project of Xinjiang University (Grant BS210219).

Institutional Review Board Statement

Not applicable.

Informed Consent Statement

Not applicable.

Data Availability Statement

The data are contained within the article.

Acknowledgments

We also thank the researchers who facilitated the completion of this study.

Conflicts of Interest

The authors declare no conflict of interest.

Sample Availability

Samples of the compounds are available from the authors.

References

  1. Liu, G.H.; Li, Y.J.; Bai, J.J.; Gao, Y.; Kang, Y.H.; Wang, A.M.; Lu, C.Y.; Bai, H.C.; Zong, Z.M.; Wei, X.Y. Advances in mild degradation and directional upgrading of lignites: From feature identification to value-added utilization. J. Anal. Appl. Pyrolysis 2022, 163, 105477. [Google Scholar] [CrossRef]
  2. Liu, F.J.; Wei, X.Y.; Fan, M.; Zong, Z.M. Separation and structural characterization of the value-added chemicals from mild degradation of lignites: A review. Appl. Energy 2016, 170, 415–436. [Google Scholar] [CrossRef]
  3. Shui, H.; Yao, J.; Wu, H.; Li, Z.; Yan, J.; Wang, Z.; Ren, S.; Lei, Z.; Chunbao Xu, C. Study on catalytic thermal dissolution of lignite and hydro-liquefaction of its soluble fraction for potential jet fuel. Fuel 2022, 315, 123237. [Google Scholar] [CrossRef]
  4. Wang, Q.; Ye, J.-b.; Yang, H.-y.; Liu, Q. Chemical Composition and Structural Characteristics of Oil Shales and Their Kerogens Using Fourier Transform Infrared (FTIR) Spectroscopy and Solid-State 13C Nuclear Magnetic Resonance (NMR). Energy Fuels 2016, 30, 6271–6280. [Google Scholar] [CrossRef]
  5. Li, S.; Du, F.F.; Ma, Z.H.; Zhang, L.H.; Liu, Z.Q.; Zhao, T.S.; Wei, X.Y.; Xu, M.L.; Cong, X.S. Insight into the Compositional Features of Organic Matter in Xilinguole Lignite through Two Mass Spectrometers. ACS Omega 2022, 7, 46384–46390. [Google Scholar] [CrossRef] [PubMed]
  6. Wang, Y.G.; Wei, X.Y.; Yan, H.L.; Shi, D.L.; Liu, F.J.; Li, P.; Fan, X.; Zhao, Y.P.; Zong, Z.M. Structural Features of Extraction Residues from Supercritical Methanolysis of Two Chinese Lignites. Energy Fuels 2013, 27, 4632–4638. [Google Scholar] [CrossRef]
  7. Wu, F.P.; Qin, S.; Zhao, Y.P.; Qiu, L.L.; Xiao, J.; Bai, Y.H.; Liu, F.J.; Cao, J.P.; Wei, X.Y. Correlations of composition and structural characteristics between pyrolysis tar and soluble organic species of Baoqing lignite. J. Anal. Appl. Pyrolysis 2023, 171, 105954. [Google Scholar] [CrossRef]
  8. Liu, M.; Lei, Z.; Cao, X.; Yan, J.; Shui, H.; Wang, Z.; Hu, J.; Hong, M. Construction of Macromolecules of depolymerized Lignite. ACS Omega 2023, 8, 22820–22826. [Google Scholar] [CrossRef]
  9. Yu, X.Y.; Wei, X.Y.; Li, Z.K.; Zhang, D.D.; Zong, Z.M. Two-step depolymerization of Zhaotong lignite in ethanol. Fuel 2017, 196, 391–397. [Google Scholar] [CrossRef]
  10. Lu, H.Y.; Wei, X.Y.; Yu, R.; Peng, Y.L.; Qi, X.Z.; Qie, L.M.; Wei, Q.; Lv, J.; Zong, Z.M.; Zhao, W.; et al. Sequential Thermal Dissolution of Huolinguole Lignite in Methanol and Ethanol. Energy Fuels 2011, 25, 2741–2745. [Google Scholar] [CrossRef]
  11. Schobert, H.H.; Song, C. Chemicals and materials from coal in the 21st century. Fuel 2002, 81, 15–32. [Google Scholar] [CrossRef]
  12. Chen, B.; Wei, X.Y.; Zong, Z.M.; Yang, Z.S.; Qing, Y.; Liu, C. Difference in chemical composition of supercritical methanolysis products between two lignites. App. Energy 2011, 88, 4570–4576. [Google Scholar] [CrossRef]
  13. Li, Z.K.; Wei, X.Y.; Yan, H.L.; Yu, X.Y.; Zong, Z.M. Characterization of soluble portions from thermal dissolution of Zhaotong lignite in cyclohexane and methanol. Fuel Process. Technol. 2016, 151, 131–138. [Google Scholar] [CrossRef]
  14. Fan, X.; Zhang, X.Y.; Dong, X.; Liao, J.J.; Zhao, Y.P.; Wei, X.Y.; Ma, F.Y.; Nulahong, A. Structural insights of four thermal dissolution products of Dongming lignite by using in-source collision-activated dissociation mass spectrometry. Fuel 2018, 230, 78–82. [Google Scholar] [CrossRef]
  15. Liu, Q.; Hou, Y.; Wu, W.; Wang, Q.; Ren, S.; Liu, Q. New insight into the chemical structures of Huadian kerogen with supercritical ethanolysis: Cleavage of weak bonds to small molecular compounds. Fuel Process. Technol. 2018, 176, 138–145. [Google Scholar] [CrossRef]
  16. Li, Z.K.; Cheng, J.Y.; Yan, H.L.; Lei, Z.P.; Yan, J.C.; Ren, S.B.; Wang, Z.C.; Kang, S.G.; Shui, H.F. Ethanol and formic acid as synergistic solvents for converting lignite to platform chemicals. Fuel 2021, 293, 120491. [Google Scholar] [CrossRef]
  17. Kang, Y.H.; Chen, T.; Gao, J.; Li, F.; Hu, L.; Liu, G.H.; Lu, C.Y.; Li, Y.J.; Wei, X.Y.; Ma, Y.J.; et al. Comprehensive investigation of the mechanisms for pyrolyzing macromolecular networks in Hecaogou subbituminous coal by comparing the ethanolysis and flash pyrolysis. Fuel 2022, 324, 124619. [Google Scholar] [CrossRef]
  18. Zheng, J.J.; Liu, F.J.; Sun, B.K.; Li, Y.H.; Meng, B.; Yu, Y.M.; Zhao, Y.P.; Cao, J.P.; Wei, X.Y.; Lu, Y.; et al. Efficient Two-Step Utilization of Organic Matter in Shengli Lignite for Producing Chemicals and Supercapacitor Electrode Materials. Energy Fuels 2023, 37, 3166–3177. [Google Scholar] [CrossRef]
  19. Li, Z.K.; Wei, X.Y.; Yan, H.L.; Yu, X.Y.; Zong, Z.M. Insight into the chemical complexity of ethanolysis products from extraction residue of Zhaotong lignite. Fuel 2016, 174, 287–295. [Google Scholar] [CrossRef]
  20. Liang, S.; Hou, Y.; Wu, W.; Li, L.; Ren, S. New Insights into the Primary Reaction Products of Naomaohu Coal via Breaking Weak Bonds with Supercritical Ethanolysis. Energy Fuels 2019, 33, 6294–6301. [Google Scholar] [CrossRef]
  21. Hu, X.B.; Xu, H.; Mo, W.L.; Fan, X.; Guo, W.C.; Guo, J.; Niu, J.M.; Mi, H.Y.; Ma, Y.Y.; Wei, X.Y. Effect of sequential thermal dissolution on the structure and pyrolysis characteristics of Naomaohu lignite. Fuel 2023, 331, 125930. [Google Scholar] [CrossRef]
  22. Yang, W.Q.; Mao, K.M.; Mo, W.L.; Ma, F.Y.; Wei, X.Y.; Fan, X.; Ren, T.Z. Mechanism analysis of methanol alcoholysis of Naomaohu lignite extraction residue based on model compound reaction path. J. Fuel Chem. Technol. 2022, 50, 396–407. [Google Scholar] [CrossRef]
  23. Liu, F.J.; Wei, X.Y.; Li, W.T.; Gui, J.; Li, P.; Wang, Y.G.; Xie, R.L.; Zong, Z.M. Methanolysis of extraction residue from Xianfeng lignite with NaOH and product characterizations with different spectrometries. Fuel Process. Technol. 2015, 136, 8–16. [Google Scholar] [CrossRef]
  24. Li, X.K.; Zong, Z.M.; Chen, Y.F.; Yang, Z.; Liu, G.H.; Liu, F.J.; Wei, X.Y.; Wang, B.J.; Ma, F.Y.; Liu, J.M. Catalytic hydroconversion of Yinggemajianfeng lignite over difunctional Ni-Mg2Si/γ-Al2O3. Fuel 2019, 249, 496–502. [Google Scholar] [CrossRef]
  25. Liu, G.H.; Zong, Z.M.; Liu, F.J.; Meng, X.L.; Zhang, Y.Y.; Wang, S.K.; Li, S.; Zhu, C.; Wei, X.Y.; Ma, F.Y.; et al. Deep hydroconversion of ethanol-soluble portion from the ethanolysis of Dahuangshan lignite to clean liquid fuel over a mordenite supported nickel catalyst. J. Anal. Appl. Pyrolysis 2019, 139, 13–21. [Google Scholar] [CrossRef]
  26. Liu, G.H.; Zhang, Z.W.; Li, X.L.; Kang, Y.H.; Lu, C.Y.; Chen, J.Z.; Liu, F.J.; Bai, H.C.; Wei, X.Y. Catalytic Degradation and Directional Upgrading of Zhunnan Lignite: Double Constraint of Active Hydrogen and Effective Acquisition of Derived Arenes over Nickel Ferrite. Energy Fuels 2021, 35, 19943–19952. [Google Scholar] [CrossRef]
  27. Liu, J.; Zhang, Q.; Liang, L.; Guan, G.; Huang, W. Catalytic depolymerization of coal char over iron-based catalyst: Potential method for producing high value-added chemicals. Fuel 2017, 210, 329–333. [Google Scholar] [CrossRef]
  28. Li, Y.H.; Liu, F.J.; Guo, J.P.; Yin, F.; Gao, S.S.; Lu, Y.; Song, R.; Yu, Y.M.; Zheng, J.J.; Zhao, Y.P.; et al. Green and highly selective hydrogenation of lignin-derived aromatics at low temperature over Ru-Fe bimetallic nanoparticles supported on porous nitrogen-doped carbon. Fuel Process. Technol. 2023, 247, 107754. [Google Scholar] [CrossRef]
  29. Kong, Q.Q.; Bai, X.; Wei, X.Y.; Dilixiati, Y.; Yin, F.; Zhao, J.; Fan, Z.C.; Li, Z.; An, M.; Li, L.; et al. Specific cleavage of >CH-O-bonds in benzyloxybenzene and poplar lignin over nickel supported on a nitrogen-doped carbon material. Fuel Process. Technol. 2023, 248, 107813. [Google Scholar] [CrossRef]
  30. Li, Z.K.; Wang, H.T.; Yan, H.L.; Yan, J.C.; Lei, Z.P.; Ren, S.B.; Wang, Z.C.; Kang, S.G.; Shui, H.F. Catalytic ethanolysis of Xilinguole lignite over layered and mesoporous metal oxide composites to platform chemicals. Fuel 2021, 287, 119560. [Google Scholar] [CrossRef]
  31. Du, F.; Zhang, Z.; Liu, Z.; Cong, X.; Ma, Z.; Zhao, T.; Li, S. Selective catalytic ethanolysis of C-O bonds in lignite-related model compounds and Xilinguole lignite over difunctional Ni/HZSM-5 in H2-free system. Fuel Process. Technol. 2023, 241, 107590. [Google Scholar] [CrossRef]
  32. Xie, J.; Lu, H.; Shu, G.; Li, K.; Zhang, X.; Wang, H.; Yue, W.; Gao, S.; Chen, Y. The relationship between the microstructures and catalytic behaviors of iron–oxygen precursors during direct coal liquefaction. Chin. J. Catal. 2018, 39, 857–866. [Google Scholar] [CrossRef]
  33. Wang, D.; Li, J.; Ma, H.; Yang, C.; Pan, Z.; Qu, W.; Tian, Z. Layer-structure adjustable MoS2 catalysts for the slurry-phase hydrogenation of polycyclic aromatic hydrocarbons. J. Energy Chem. 2021, 63, 294–304. [Google Scholar] [CrossRef]
  34. Wu, Y.Y.; Teng, Y.; Zhang, M.; Deng, Z.P.; Xu, Y.M.; Huo, L.H.; Gao, S. Cooperative modulation of Fe2(MoO4)3 microstructure derived from absorbent cotton for enhanced gas-sensing performance. Sens. Actuators B Chem. 2021, 329, 129126. [Google Scholar] [CrossRef]
  35. Zhao, X.; Wang, J.; Yu, R.; Wang, D. Construction of Multishelled Binary Metal Oxides via Coabsorption of Positive and Negative Ions as a Superior Cathode for Sodium-Ion Batteries. J. Am. Chem. Soc. 2018, 140, 17114–17119. [Google Scholar] [CrossRef] [PubMed]
  36. Liu, X.; Wang, C.A.; Zhu, T.; Lu, Q.; Li, Y.; Che, D. Simultaneous removal of NOx and SO2 from coal-fired flue gas based on the catalytic decomposition of H2O2 over Fe2(MoO4)3. Chem. Eng. J. 2019, 371, 486–499. [Google Scholar] [CrossRef]
  37. Zhou, Y.; Sadia Traore, A.; Peron, D.V.; Barrios, A.J.; Chernyak, S.A.; Corda, M.; Safonova, O.V.; Iulian Dugulan, A.; Ersen, O.; Virginie, M.; et al. Promotion effects of alkali metals on iron molybdate catalysts for CO2 catalytic hydrogenation. J. Energy Chem. 2023, 85, 291–300. [Google Scholar] [CrossRef]
  38. Hidalgo, G.; Tonelli, M.; Burel, L.; Aouine, M.; Millet, J.M.M. Microwave-assisted hydrothermal synthesis, characterization and catalytic performance of Fe2(MoO4)3 in the selective oxidation of propene. Catal. Today 2021, 363, 36–44. [Google Scholar] [CrossRef]
  39. Malik, M.I.; Abatzoglou, N.; Achouri, I.E. Methanol to Formaldehyde: An Overview of Surface Studies and Performance of an Iron Molybdate Catalyst. Catalysts 2021, 11, 893. [Google Scholar] [CrossRef]
  40. Lin, Z.; Xu, M.; Fu, P.; Deng, Q. Crystal plane control of 3D iron molybdate and the facet effect on gas sensing performances. Sens. Actuators B Chem. 2018, 254, 755–762. [Google Scholar] [CrossRef]
  41. Kong, J.; Zhao, R.; Bai, Y.; Li, G.; Zhang, C.; Li, F. Study on the formation of phenols during coal flash pyrolysis using pyrolysis-GC/MS. Fuel Process. Technol. 2014, 127, 41–46. [Google Scholar] [CrossRef]
  42. Li, B.; Yuan, Z.; Schmidt, J.; Xu, C. New foaming formulations for production of bio-phenol formaldehyde foams using raw kraft lignin. Eur. Polym. J. 2019, 111, 1–10. [Google Scholar] [CrossRef]
  43. Wu, F.P.; Zhao, Y.P.; Fu, Z.P.; Qiu, L.L.; Xiao, J.; Li, J.; Liu, F.J.; Cao, J.P. Catalytic transfer hydrogenolysis mechanism of benzyl phenyl ether over NiCu/Al2O3 using isopropanol as hydrogen source. Fuel Process. Technol. 2023, 250, 107874. [Google Scholar] [CrossRef]
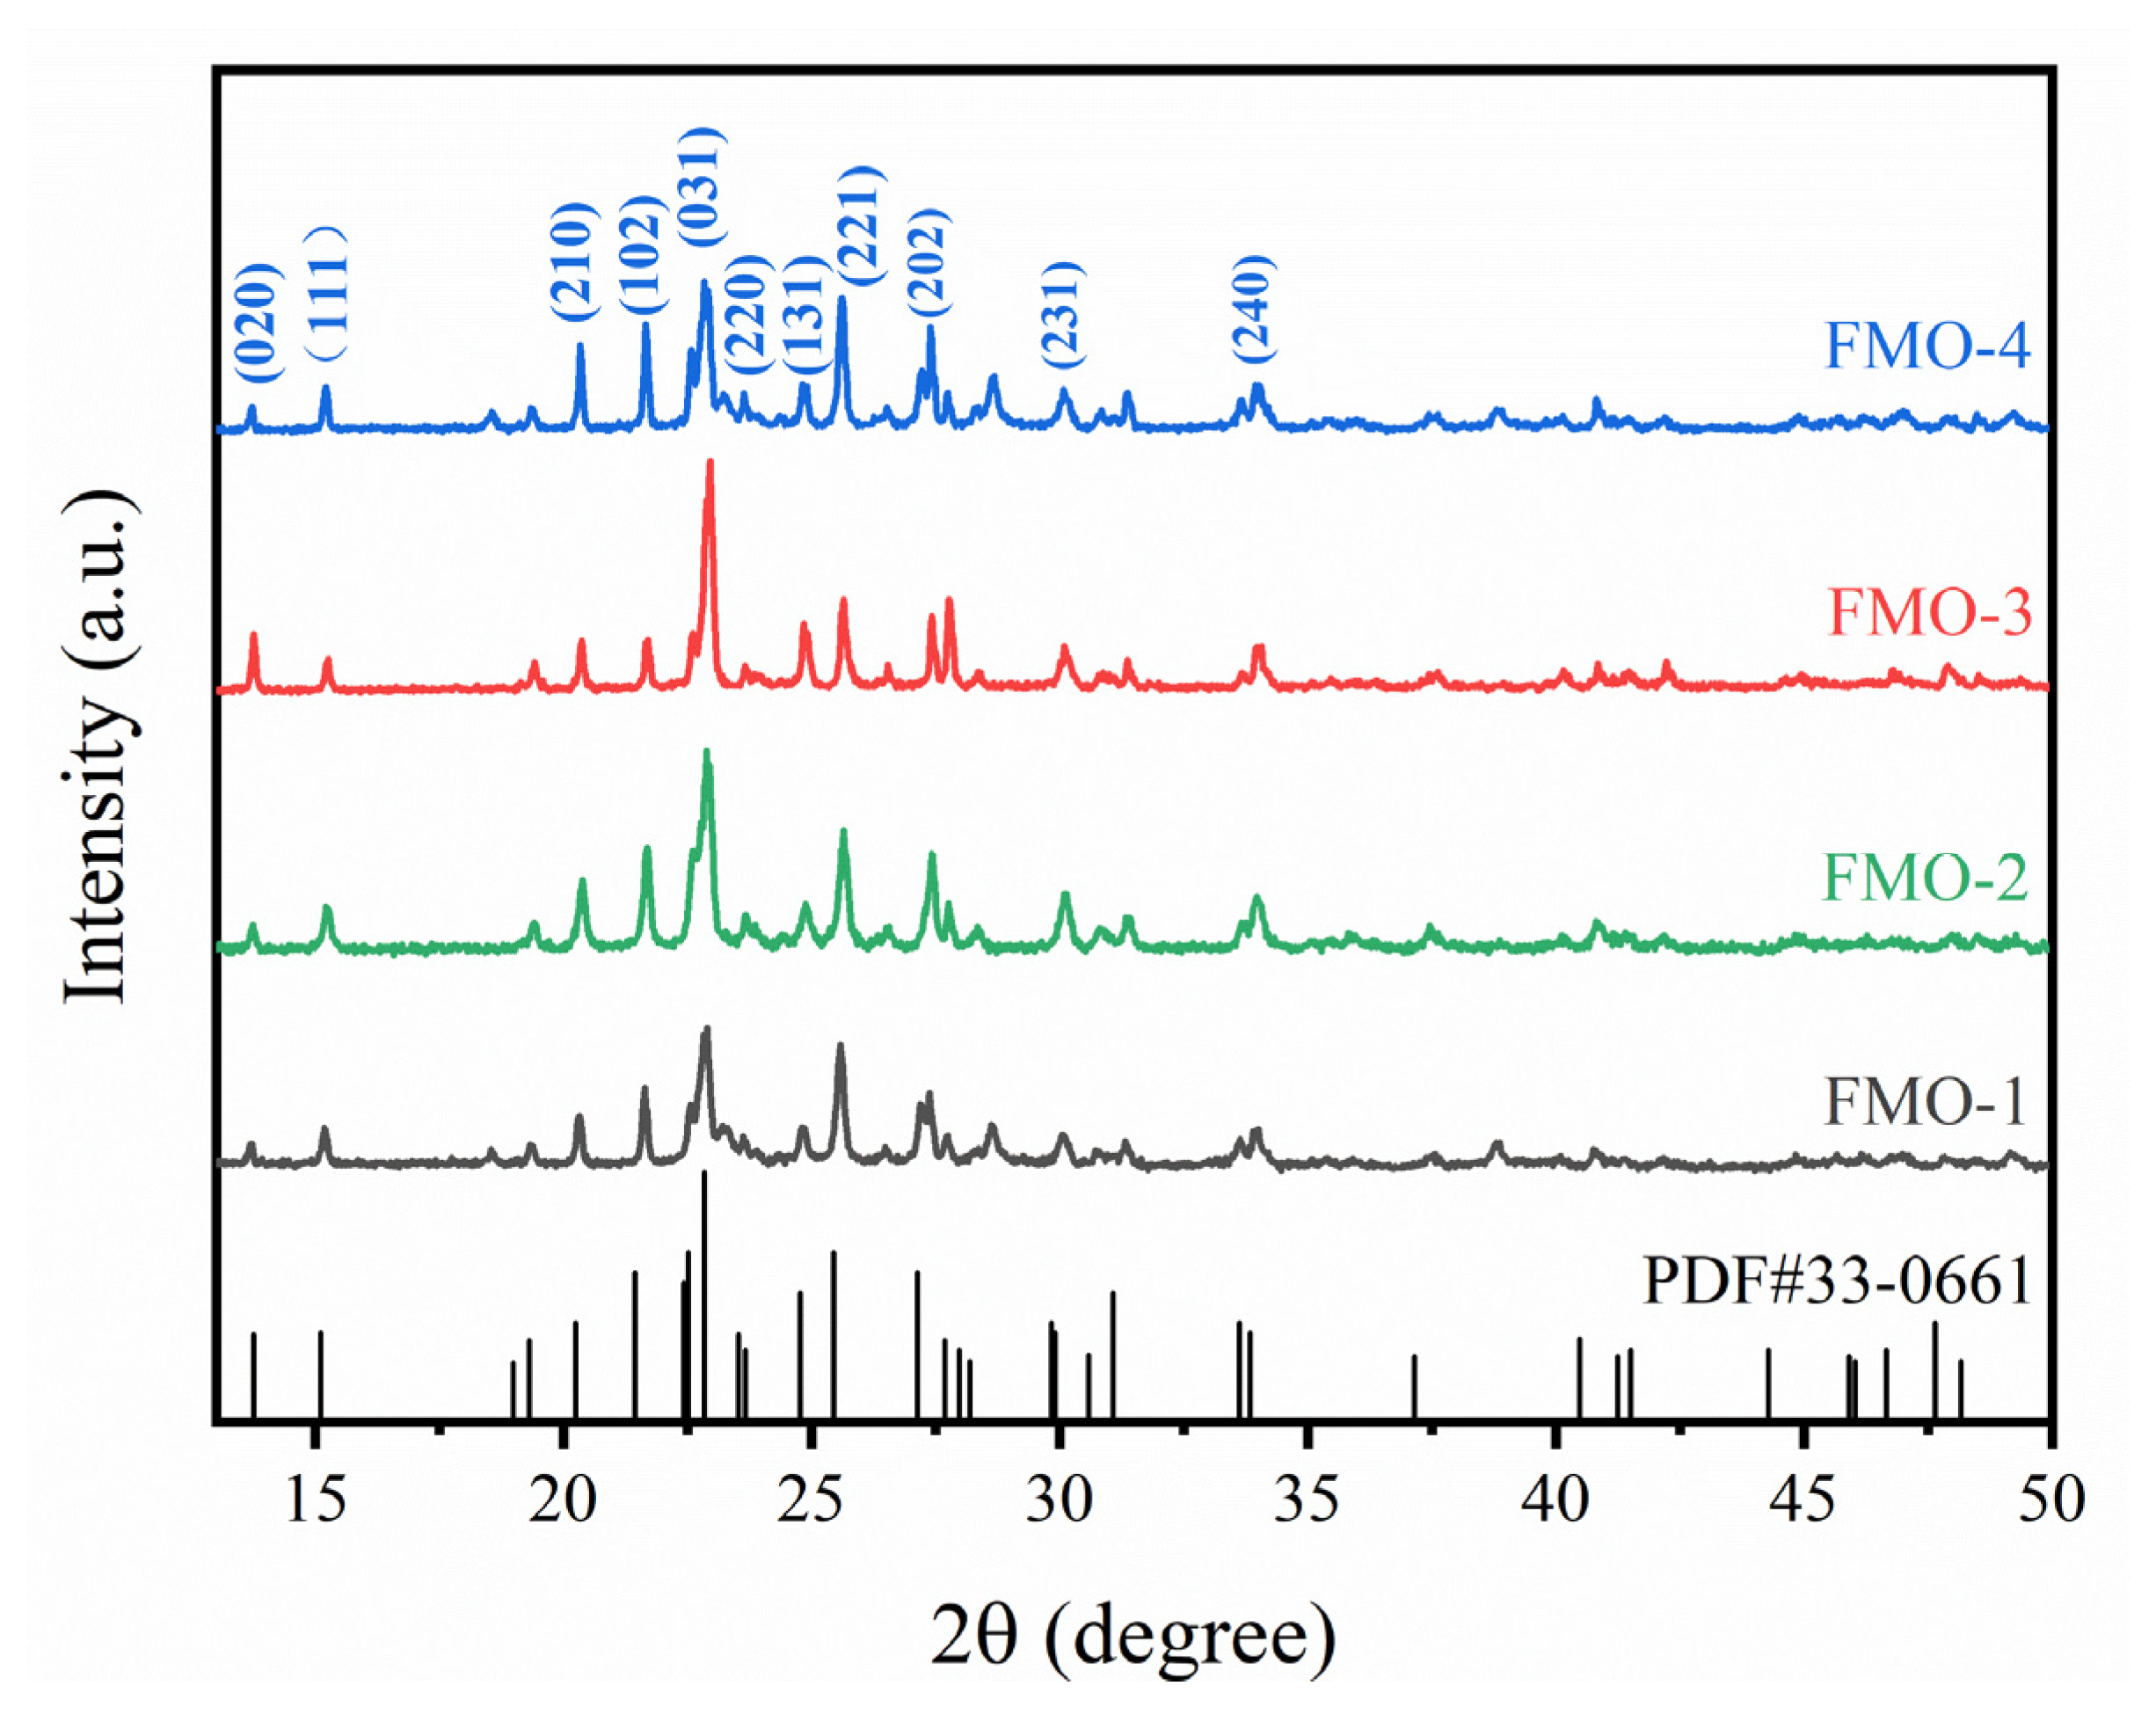
Figure 1. XRD patterns of the samples.
Molecules 28 06595 g001
Figure 2. The SEM images of the Fe2(MoO4)3 samples; (a) FMO-1, (b) FMO-2, (c) FMO-3, (d) FMO-4.
Molecules 28 06595 g002
Figure 3. TEM images of (a) FMO-2, (b) FMO-4; HRTEM images of (c) FMO-2, (d) FMO-4.
Molecules 28 06595 g003
Figure 4. EDS elemental mappings of FMO-2. (a) TEM image and (b) Fe, (c) Mo, and (d) O elements.
Molecules 28 06595 g004
Figure 5. N2 adsorption–desorption isotherms (a) and pore size distribution (b) of FMO-1, FMO-2, FMO-3, and FMO-4.
Molecules 28 06595 g005
Figure 6. (a) XPS spectrum of Fe2(MoO4)3 nanorods, (b) O 1s XPS spectrum, (c) Mo 3d XPS spectrum, and (d) Fe 2p XPS spectrum.
Molecules 28 06595 g006
Figure 7. Effect of ethanolysis reaction temperature and catalyst on the ESP yield.
Molecules 28 06595 g007
Figure 8. Effect of different catalysts on ESP yield at 260 °C.
Molecules 28 06595 g008
Figure 9. FTIR spectra of ESP.
Molecules 28 06595 g009
Figure 10. Compound distribution among ESPNC and ESPFMO-2.
Molecules 28 06595 g010
Scheme 1. Possible pathways for ether production from catalytic ethanolysis.
Molecules 28 06595 sch001
Figure 11. Relative content of oxygen-containing functional groups for NMHC and ER.
Molecules 28 06595 g011
Scheme 2. Possible pathways of the catalytic ethanolysis of BOB in the presence of FMO-2.
Molecules 28 06595 sch002
Scheme 3. Possible pathways for the catalytic ethanolysis of NMHC in the presence of FMO-2.
Molecules 28 06595 sch003
Table 1. Esters detected in the ESPNC and ESPFMO-2.
Retention
Time/s
NameMolecular FormulaRelative Content/(wt%)
ESPNCESPFMO-2
983.3methyl 2-hydroxy-2-methylbutanoateC6H12O3 1.51
1268.7ethyl 3-methylpentanoateC8H16O2 0.27
1407.5ethyl hex-2-enoateC8H14O2 1.04
1429ethyl hexanoateC8H16O20.161.17
1430.5isobutyl methacrylateC8H14O2 0.24
1442.9ethyl (E)-hex-3-enoateC8H14O20.480.44
1444ethyl hex-4-enoateC8H14O2 0.51
1448.8prenyl isobutyrateC9H16O20.18
1542.8γ-CaprolactoneC6H10O20.45
1600ethyl hex-2-enoateC8H14O21.016.52
1730.44-methyloxan-2-oneC6H10O2 2.16
1804.9ethyl hept-6-enoateC9H16O2 0.20
1859.5ethyl heptanoateC9H18O20.690.93
1929.2ethyl (R)-2-(hydroxymethyl)butanoateC7H14O3 0.33
2026.3ethyl octanoateC10H20O2 0.25
2147.8diethyl succinateC8H14O41.150.29
2153.7ethyl benzoateC9H10O2 0.47
2238.5ethyl oct-7-enoateC10H18O20.190.39
2272.2ethyl (Z)-oct-3-enoateC10H18O2 0.81
2291.3ethyl octanoateC10H20O21.981.75
2479.2ethyl 2-octenoateC10H18O2 0.06
2575.3diethyl glutarateC9H16O40.15
2615ethyl 3-methylbenzoateC10H12O20.250.28
2661.8ethyl non-8-enoateC11H20O20.390.20
2709ethyl nonanoateC11H22O23.161.76
3109ethyl decanoateC12H24O22.051.88
3402.7ethyl 3-hydroxybenzoateC9H10O30.19
3486.9ethyl undecanoateC13H26O22.22
3672.5ethyl dodecanoateC14H28O21.891.89
3714.54,4,7a-trimethyl-5,6,7,7a-tetrahydrobenzofuran-2(4H)-oneC11H16O20.20
4430.7diethyl decanedioateC14H26O40.08
5020.9ethyl (E)-hept-3-enoateC9H16O20.24
5657.1ethyl undecanoateC13H26O20.220.15
6621.4ethyl 8-methylnonanoateC12H24O2 3.45
7050.2ethyl icosanoateC22H44O25.437.84
7449.3ethyl docosanoateC24H48O23.01
Table 2. Phenols detected in the ESPNC and ESPFMO-2.
Retention
Time/s
NameMolecular FormulaRelative Content/(wt%)
ESPNCESPFMO-2
1320.5phenolC6H6O2.892.56
1636o-cresolC7H8O0.770.78
1720p-cresolC7H8O1.651.55
1870.52,6-dimethylphenolC8H10O0.370.12
1998.12-ethylphenolC8H10O2.542.12
2046.72,4-dimethylphenolC8H10O 0.50
2054.32,5-dimethylphenolC8H10O0.37
2055.22,3-dimethylphenolC8H10O 0.40
2063.82-ethoxyphenolC8H10O2 0.19
2119.24-ethylphenolC8H10O 1.30
2128.83-ethylphenolC8H10O0.30
2172.22,6-dimethylphenolC8H10O 0.06
2206.32-ethyl-6-methylphenolC9H12O3.174.60
2233.92,4-dimethylphenolC8H10O0.07
2298.92,4,6-trimethylphenolC9H12O0.470.29
2362.62-propylphenolC9H12O0.130.15
2453.13-ethyl-5-methylphenolC9H12O 0.64
2512.55-isopropyl-2-methylphenolC10H14O0.711.02
2516.54-isopropylphenolC9H12O0.22
2608.12-ethyl-4,5-dimethylphenolC10H14O0.740.33
2740.22,5-diethylphenolC10H14O0.360.84
2786.72,6-dimethylbenzene-1,4-diolC8H10O2 0.09
2925.54-butylphenolC10H14O 0.15
2947.22-ethyl-5-propylphenolC11H16O 0.20
3186.82-(tert-butyl)-4-ethylphenolC12H18O 0.29
3458.62,6-diisopropylphenolC12H18O0.200.11
3476.72-isopropyl-5-methylbenzene-1,4-diolC13H26O20.22
3477.34-methoxy-2,3,6-trimethylphenolC10H14O2 0.31
3612.23-(tert-butyl)-4-methoxyphenolC11H16O20.080.42
3714.72-(tert-butyl)-4-methoxyphenolC11H16O2 0.07
Table 3. Catalytic ethanolysis of BOB at different temperatures.
Temperature (°C)Conversion (%)Selectivity (%)
Molecules 28 06595 i001Molecules 28 06595 i002Molecules 28 06595 i003Molecules 28 06595 i004Molecules 28 06595 i005Molecules 28 06595 i006
22046.7745.8034.1416.213.840
24092.3945.2722.3510.5218.353.51
26010043.5911.646.3025.0013.47
28010041.688.956.1924.4718.71
Table 4. Proximate and ultimate analysis of NMHC.
Proximate Analysis (wt%)Ultimate Analysis (wt%, daf)H/C
MadAdVdafCHNOdiff
7.344.7349.8663.384.630.8226.79 0.8766
ad: air-dry basis; daf: dry and ash-free basis; diff: by difference.
Disclaimer/Publisher’s Note: The statements, opinions and data contained in all publications are solely those of the individual author(s) and contributor(s) and not of MDPI and/or the editor(s). MDPI and/or the editor(s) disclaim responsibility for any injury to people or property resulting from any ideas, methods, instructions or products referred to in the content.