Article

Extractive Spectrophotometric Determination and Theoretical Investigations of Two New Vanadium(V) Complexes

by
Kiril B. Gavazov
1,*,
Petya V. Racheva
1,
Antoaneta D. Saravanska
1,
Galya K. Toncheva
2 and
Vasil B. Delchev
2
1
Department of Chemical Sciences, Faculty of Pharmacy, Medical University of Plovdiv, 120 Buxton Bros Str., 4004 Plovdiv, Bulgaria
2
Faculty of Chemistry, University of Plovdiv ‘Paisii Hilendarskii’, 24 Tsar Assen Str., 4000 Plovdiv, Bulgaria
*
Author to whom correspondence should be addressed.
Molecules 2023, 28(18), 6723; https://doi.org/10.3390/molecules28186723
Submission received: 26 August 2023 / Revised: 18 September 2023 / Accepted: 19 September 2023 / Published: 20 September 2023
(This article belongs to the Special Issue Advances in Vanadium Complexes)

Abstract

:
Two new vanadium (V) complexes involving 6-hexyl-4-(2-thiazolylazo)resorcinol (HTAR) and tetrazolium cation were studied. The following commercially available tetrazolium salts were used as the cation source: tetrazolium red (2,3,5-triphenyltetrazol-2-ium;chloride, TTC) and neotetrazolium chloride (2-[4-[4-(3,5-diphenyltetrazol-2-ium-2-yl)phenyl]phenyl]-3,5-diphenyltetrazol-2-ium;dichloride, NTC). The cations (abbreviated as TT+ and NTC+) impart high hydrophobicity to the ternary complexes, allowing vanadium to be easily extracted and preconcentrated in one step. The complexes have different stoichiometry. The V(V)–HTAR–TTC complex dimerizes in the organic phase (chloroform) and can be represented by the formula [(TT+)[VO2(HTAR)]]2. The other complex is monomeric (NTC+)[VO2(HTAR)]. The cation has a +1 charge because one of the two chloride ions remains undissociated: NTC+ = (NT2+Cl)+. The ground-state equilibrium geometries of the constituent cations and final complexes were optimized at the B3LYP and HF levels of theory. The dimer [(TT+)[VO2(HTAR)]]2 is more suitable for practical applications due to its better extraction characteristics and wider pH interval of formation and extraction. It was used for cheap and reliable extraction–spectrophotometric determination of V(V) traces in real samples. The absorption maximum, molar absorptivity coefficient, limit of detection, and linear working range were 549 nm, 5.2 × 10⁴ L mol−1 cm−1, 4.6 ng mL−1, and 0.015–2.0 μg mL−1, respectively.

Graphical Abstract

1. Introduction

Vanadium can be classified as a dispersed trace element with an average content in the upper continental crust of 97 mg kg−1 [1]. It enters the biosphere through natural phenomena (mechanical and chemical rock weathering, volcanism, forest fires, and aeolian processes) and human activity. The main sources of anthropogenic vanadium are ore mining and processing, fossil fuel combustion, agricultural chemicalization, and the production of glass, ceramics, pigments, rubber, redox batteries, plastics, and sulfuric acid [2,3,4,5,6,7]. Recently, its anthropogenic enrichment factors (AEFs) have increased: vanadium ranks first among the trace elements in the atmosphere and fourth among the trace elements in the world’s rivers [2,5,8]. The problem is global [5] and should not be underestimated, as the most common anthropogenic vanadium form—V(V)—is almost as toxic as mercury, arsenic, lead, and cadmium [9]. This form resembles phosphorous (V) in chemical behavior [10] and can interfere with important biochemical processes by inhibiting the activity of key enzymes such as phosphatases and kinases [11,12].
Numerous methods based on coordination compounds have been used to determine V(V). Spectrophotometric methods are simple, cheap, and convenient [13,14,15]. They are often coupled with preconcentration techniques, which can greatly increase their range of application [14,15,16,17,18,19,20,21]. In a previous paper, we described the application of the V(V)—6-hexyl-4-(2-thiazolylazo)resorcinol (HTAR) anionic chelate [VO2(HTAR)] [22] for the liquid–liquid extraction (LLE)–spectrophotometric determination of hydroxyzine hydrochloride in pharmaceuticals [23]. In the present paper, we set three goals:
  • To study the LLE of the V(V)–HTAR species in the presence of tetrazolium salt;
  • To find the ground-state equilibrium geometries of the extracted species using quantum chemical calculations at the B3LYP and HF levels of theory;
  • To develop a competitive LLE–spectrophotometric method for determining V(V) in real samples.
Tetrazolium salts (TSs) are an important class of compounds with versatile uses in chemistry, biology, and physics [24,25,26,27,28,29,30,31]. Two different TSs were used in this study: 2,3,5-triphenyltetrazol-2-ium;chloride (tetrazolium red, TTC) and 2-[4-[4-(3,5-diphenyltetrazol-2-ium-2-yl)phenyl]phenyl]-3,5-diphenyltetrazol-2-ium;dichloride (neotetrazolium chloride, NTC) (Figure 1). They have found applications both as leuco dyes [24] and cationic-type ion-association reagents [25]. The association ability of their cations is governed by various factors such as molecular weight, number of tetrazolium rings, and nature of substituents in these rings [25,32,33]. Here, we concentrate on their application as ion-association reagents with special emphasis on the structure and extractability of the resulting complexes.

2. Results and Discussion

2.1. Absorption Spectra

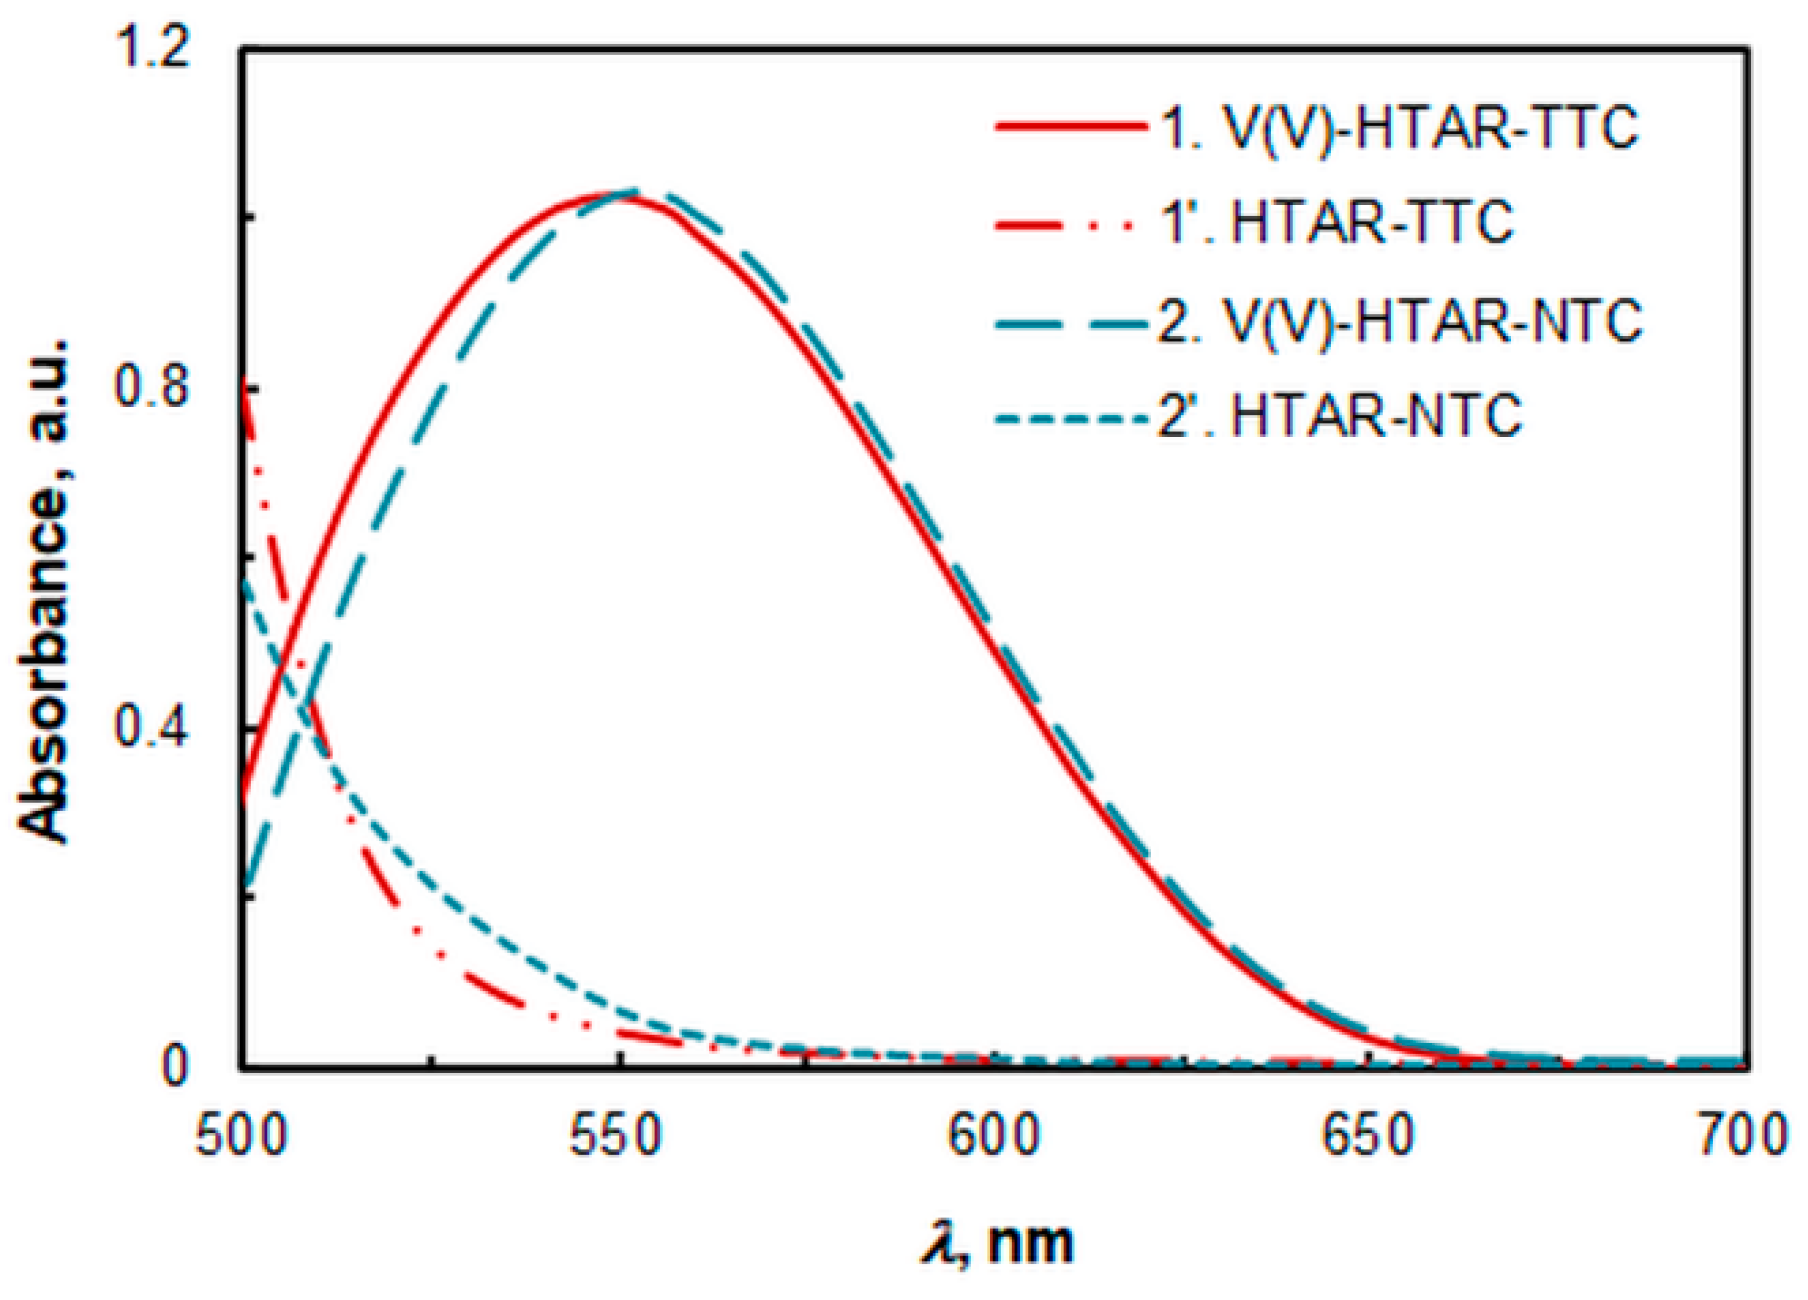
The spectra of the extracted species are shown in Figure 2. The absorbance of the two complexes (1 and 2) at their absorption maxima (λmax) is practically the same. However, there is a small difference in the position of these maxima: λmax (1) = 549 nm and λmax (2) = 556 nm. The spectral band of the V(V)–HTAR–TTC complex (1) is slightly broader, which may be due to the aggregation of the extracted species [34].
The absorbance of the blank samples (1′ and 2′) at the absorption maxima of the corresponding complexes is low. Although the concentrations of the reagents under the optimal extraction conditions (see below) are higher for the HTAR–TTC system, the absorbance of the blank is lower. This is a prerequisite for achieving better repeatability with this TS.

2.2. Effect of pH and the Amount of Buffer

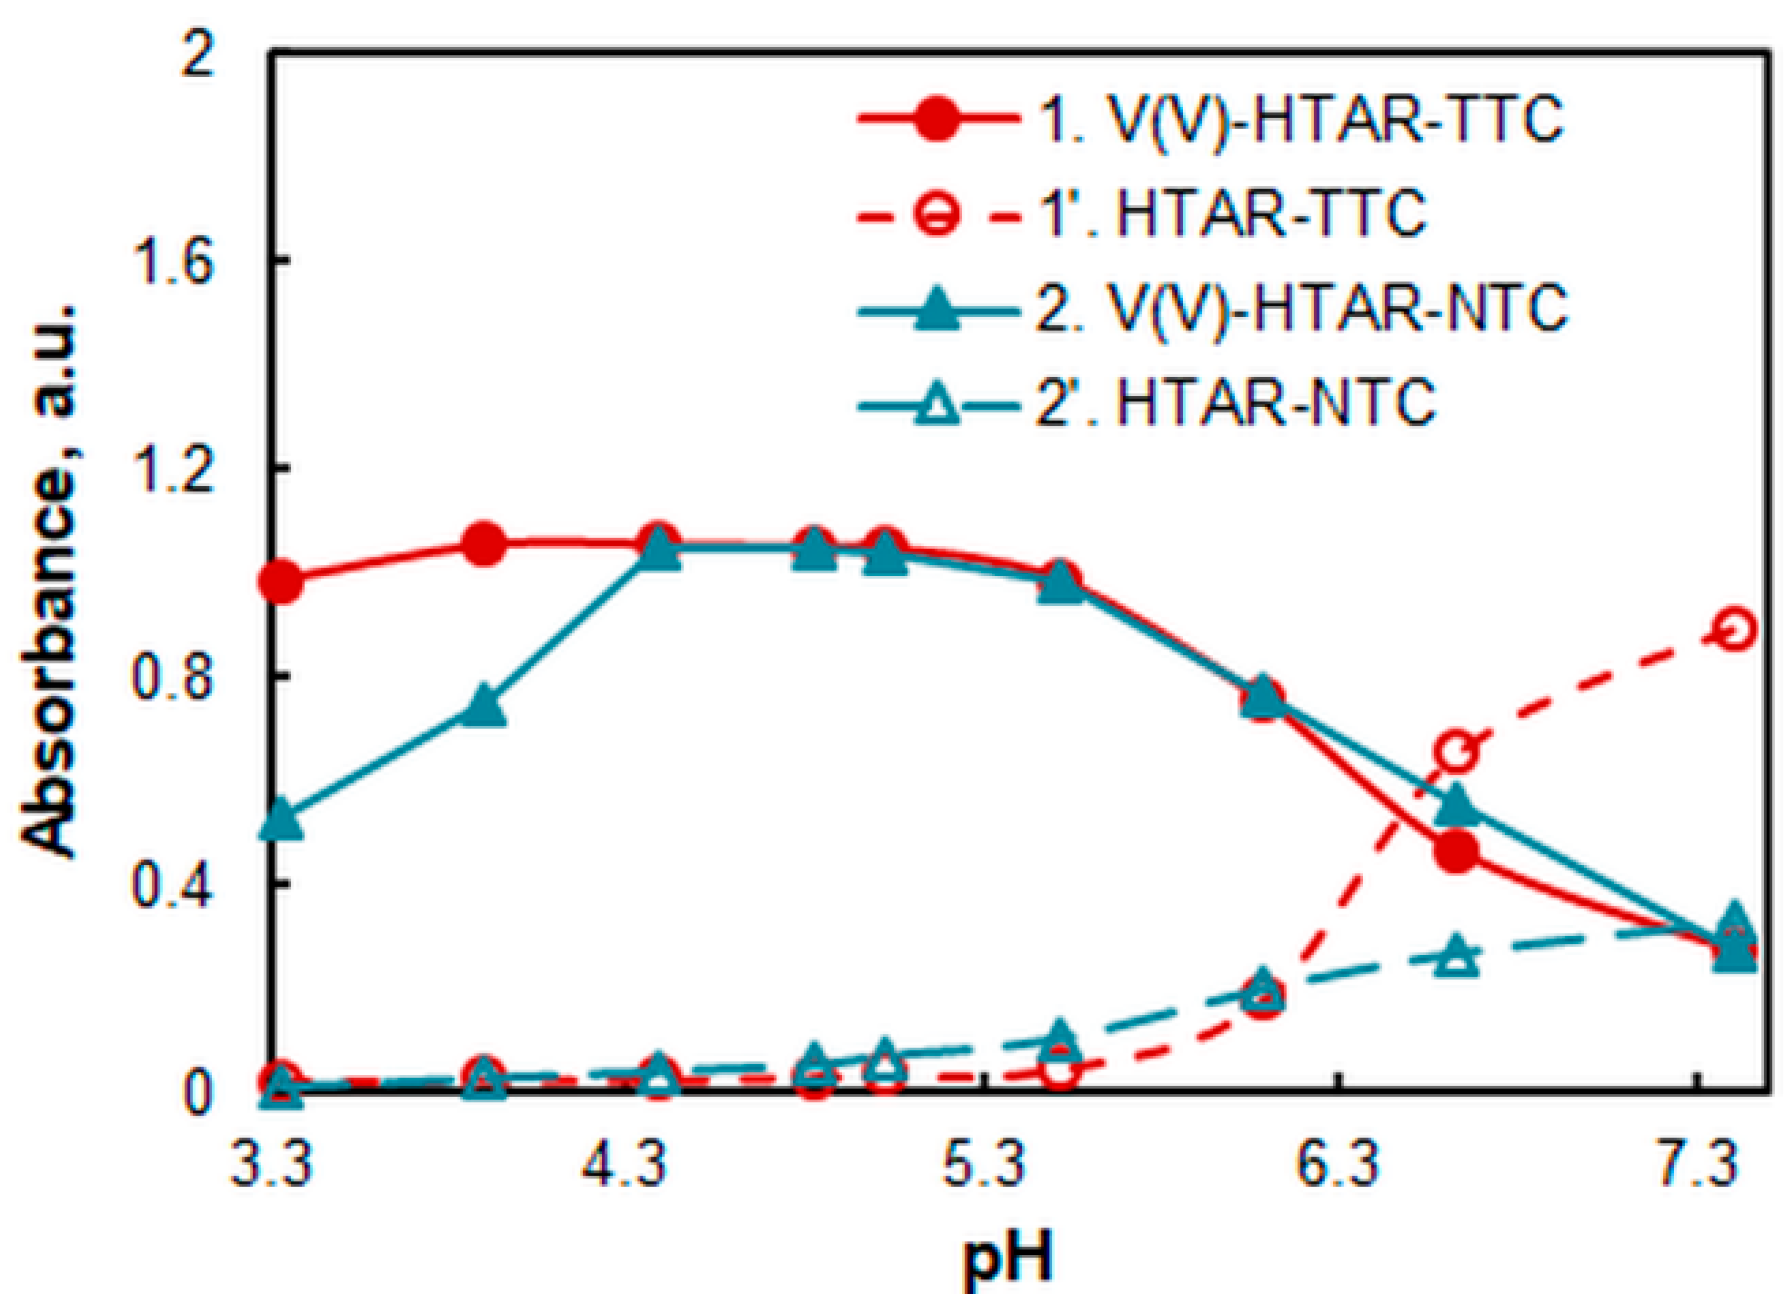
The effect of pH was studied using a series of ammonium acetate buffer solutions with a known pH (Figure 3). The V(V)–HTAR–TTC complex is maximally extracted in a pH range of 3.9–5.0. The maximum extraction range of the V(V)–HTAR–NTC complex is shorter: 4.4–5.0. In this range, the absorbance of both complexes is the same.
To elucidate the effect of the amount of buffer, a series of experiments were carried out at pH 4.7 (one of the two pH values for which the buffering capacity is maximal [35]). It was found that there was no difference in absorbance in the presence of 1, 2, or 3 mL of the buffer solution. For reasons of economy, all subsequent experiments were performed with 1 mL of the buffer.

2.3. Effect of Extraction Time

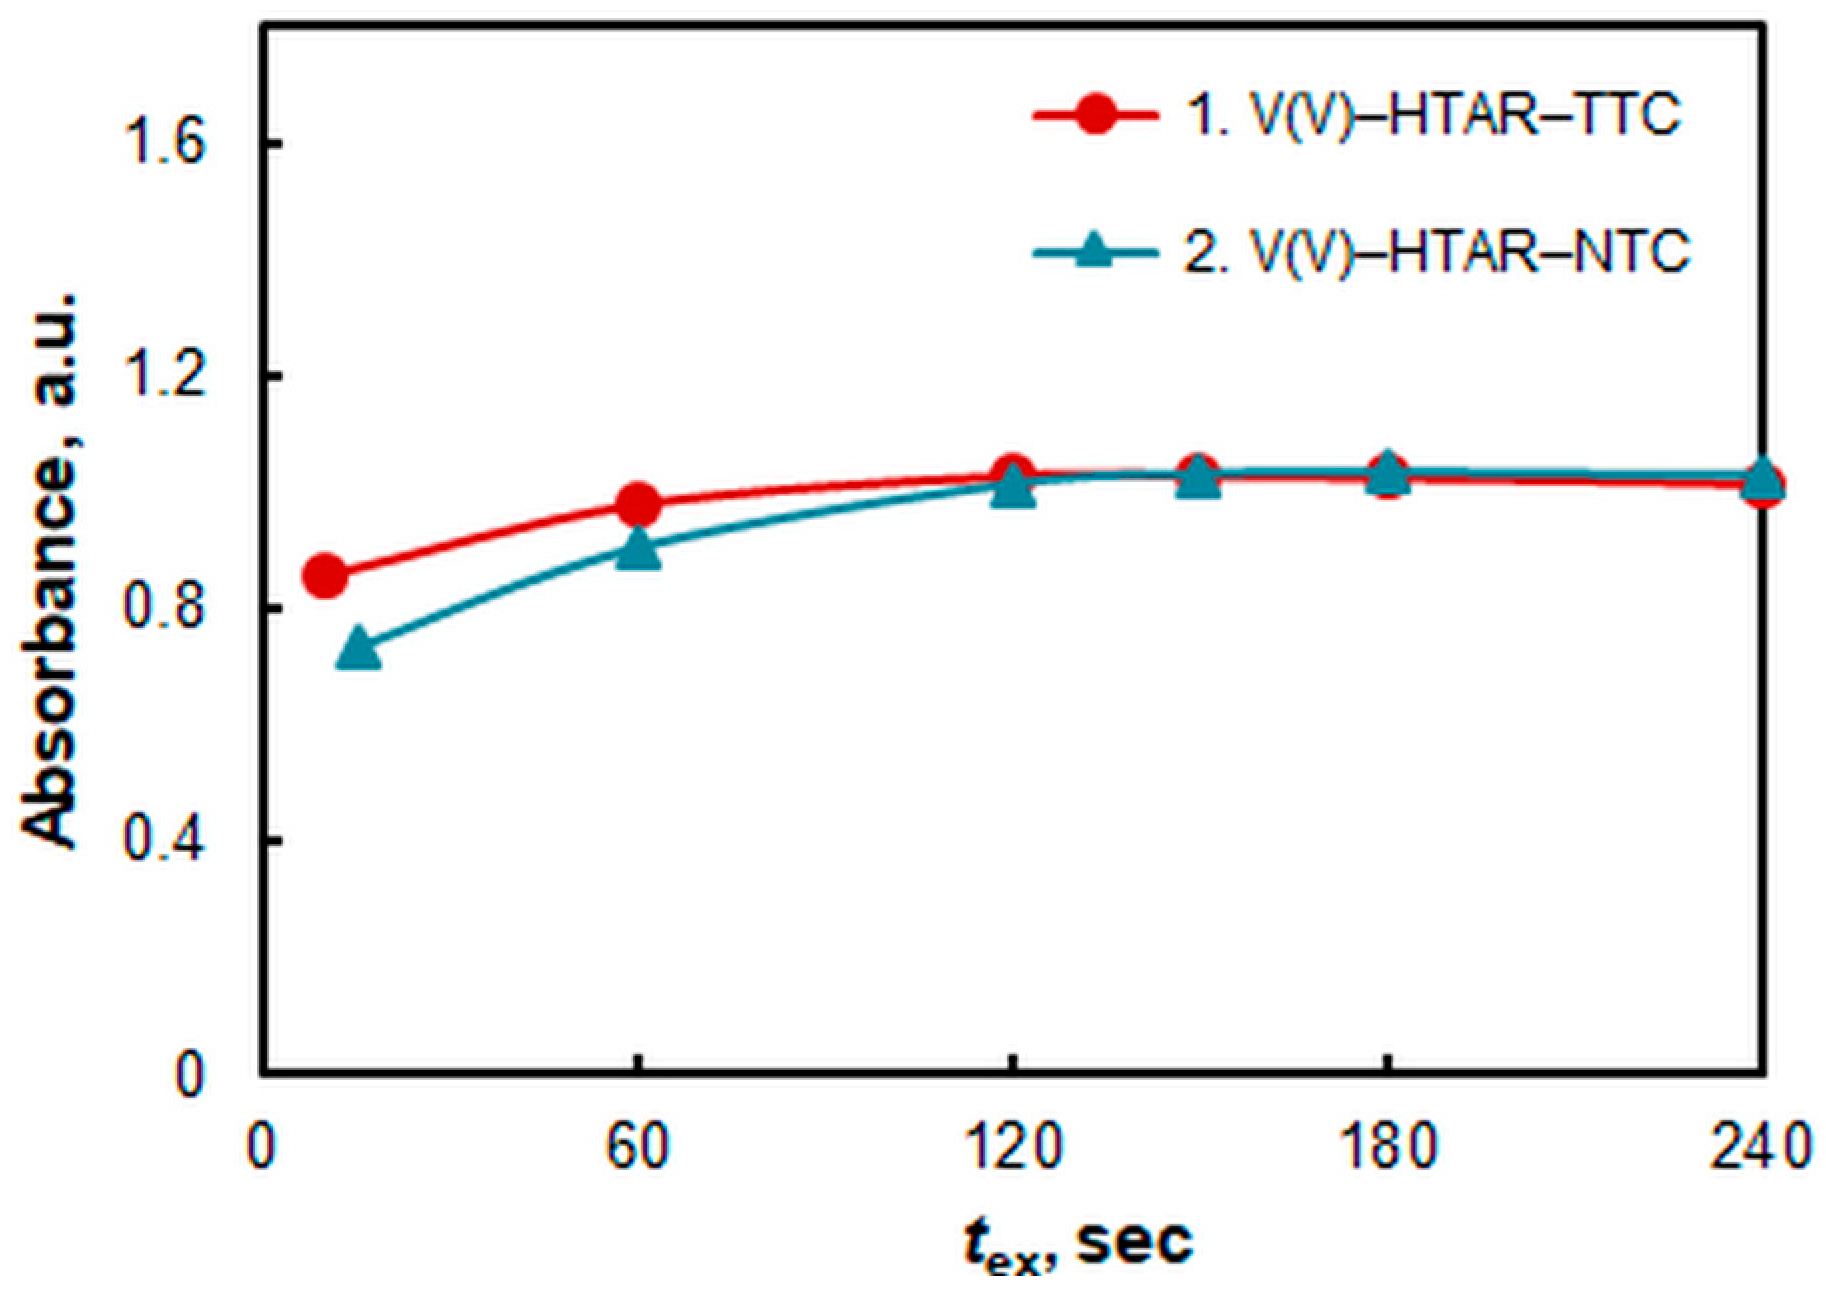
The effect of extraction time is shown in Figure 4. Two minutes are needed to reach extraction equilibrium in the V(V)–HTAR–TTC system. Equilibrium in the other system is established a little slower (2.5 min). Since the shaking rate is a parameter that is difficult to control and depends on the experimenter, in order to avoid random and systematic errors, it is recommended that the extraction time be extended to 2.5 min and 3.0 min, respectively.

2.4. Effect of HTAR and TS Concentrations

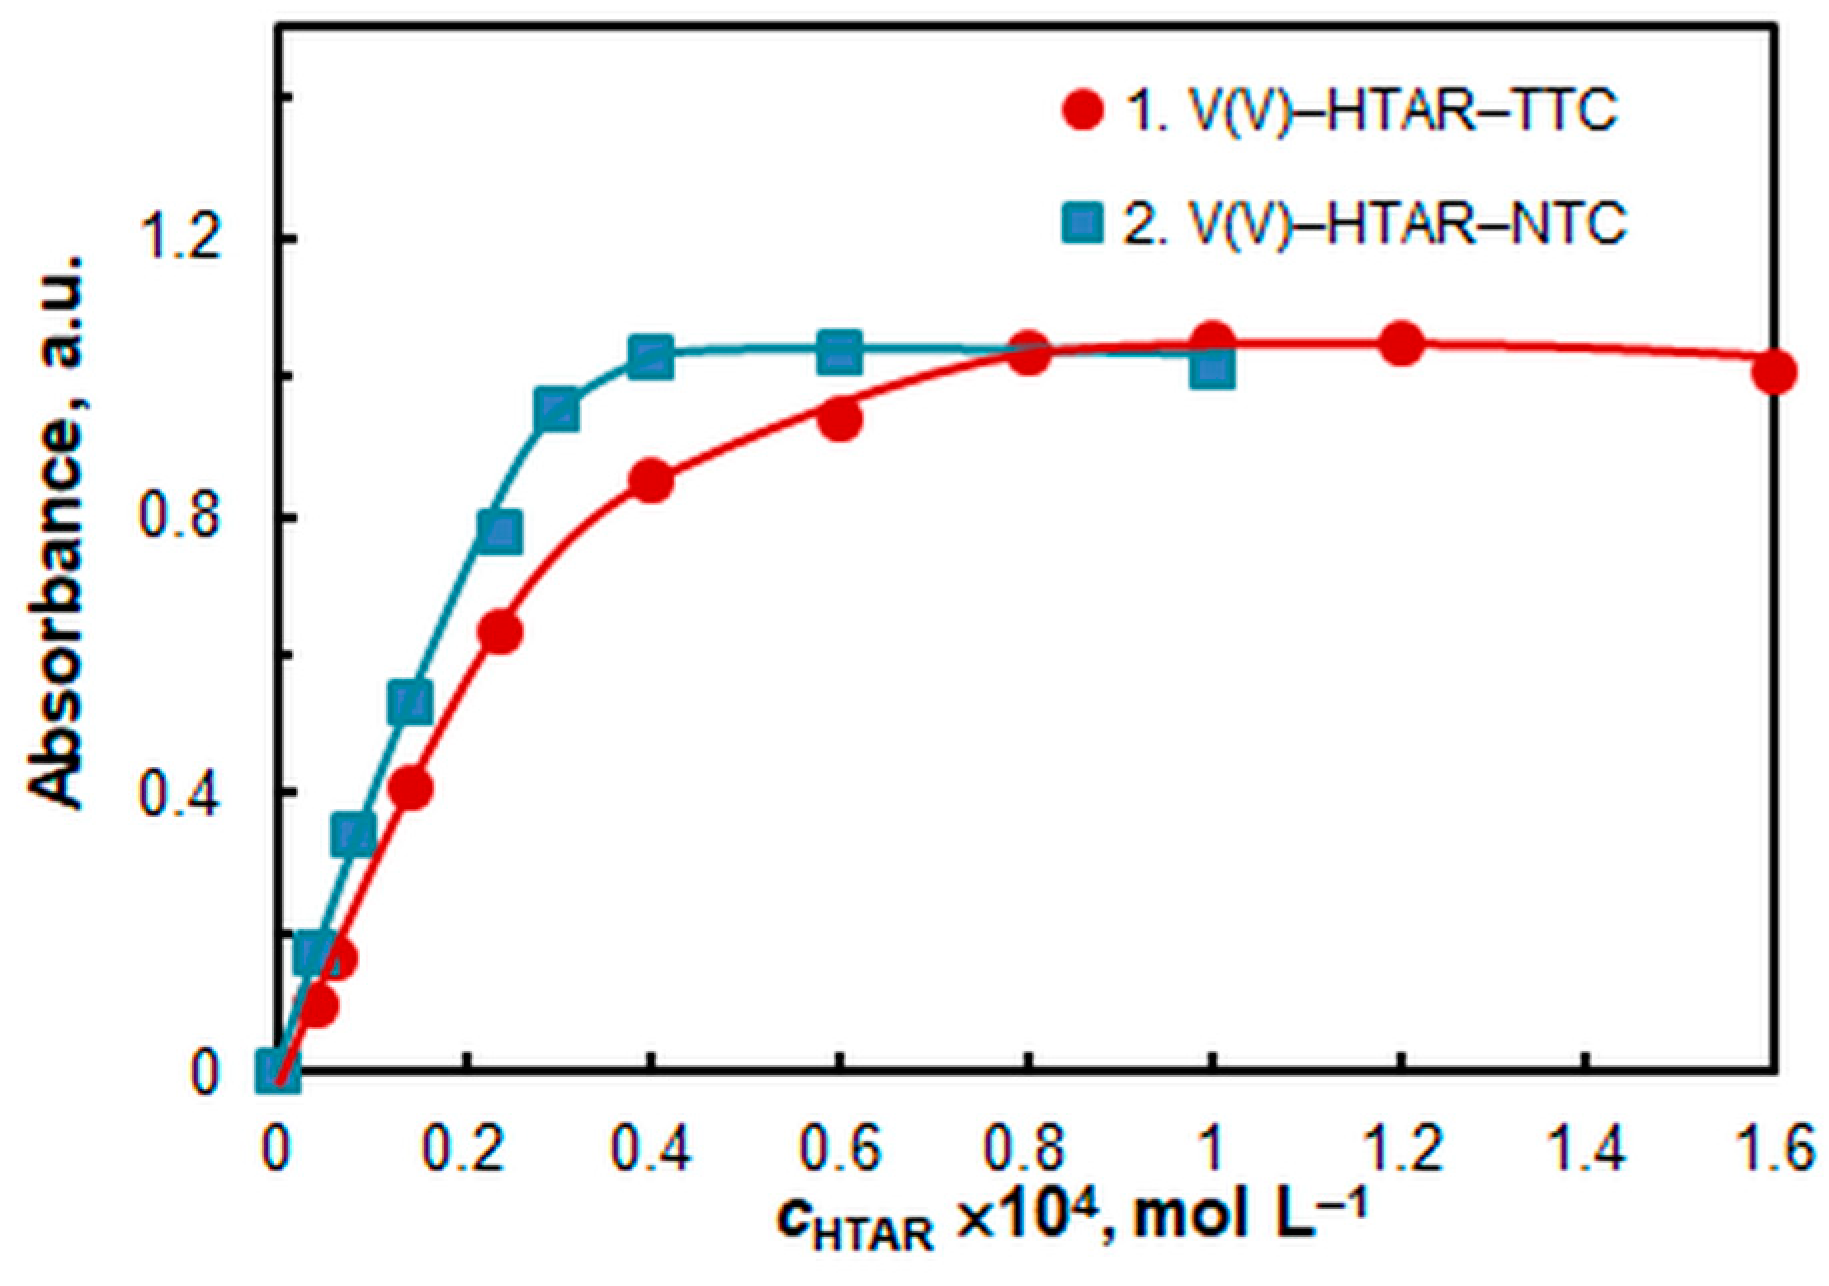
The effect of the HTAR and TS (TTC or NTC) concentrations is shown in Figure 5 and Figure 6, respectively. Saturation is more easily reached in the V(V)–HTAR–NTC system. The optimal reagent concentrations for the two systems, among other optimized parameters, are shown in Table 1.

2.5. Stoichiometry, Formulas, and Equations

The small differences in the spectra (Figure 2) and optimal extraction conditions (Table 1) indicate possible differences in stoichiometry due to aggregation of the extracted species. Therefore, a variety of methods were used to elucidate the formulas of the complexes (Table 2), including those applicable to compounds of the type AnBm (where n = m > 1) [36,37].
Figure 7a and Figure 8a present the results of determining the V(V):HTAR molar ratio in the ternary complexes via the mobile equilibrium method [36]. They show that the molar ratios in the two complexes are not the same: 2:2 (for the complex deriving from TTC) and 1:1 (for the complex deriving from NTC). This can be seen from the slopes (n) of the obtained straight lines, which match well with the correct value of m.
A similar conclusion is reached when studying the TS:V(V) molar ratio. When TS = TTC, the molar ratio is 2:2 (Figure 7b), and when TS = NTC, the molar ratio is 1:1 (Figure 8b).
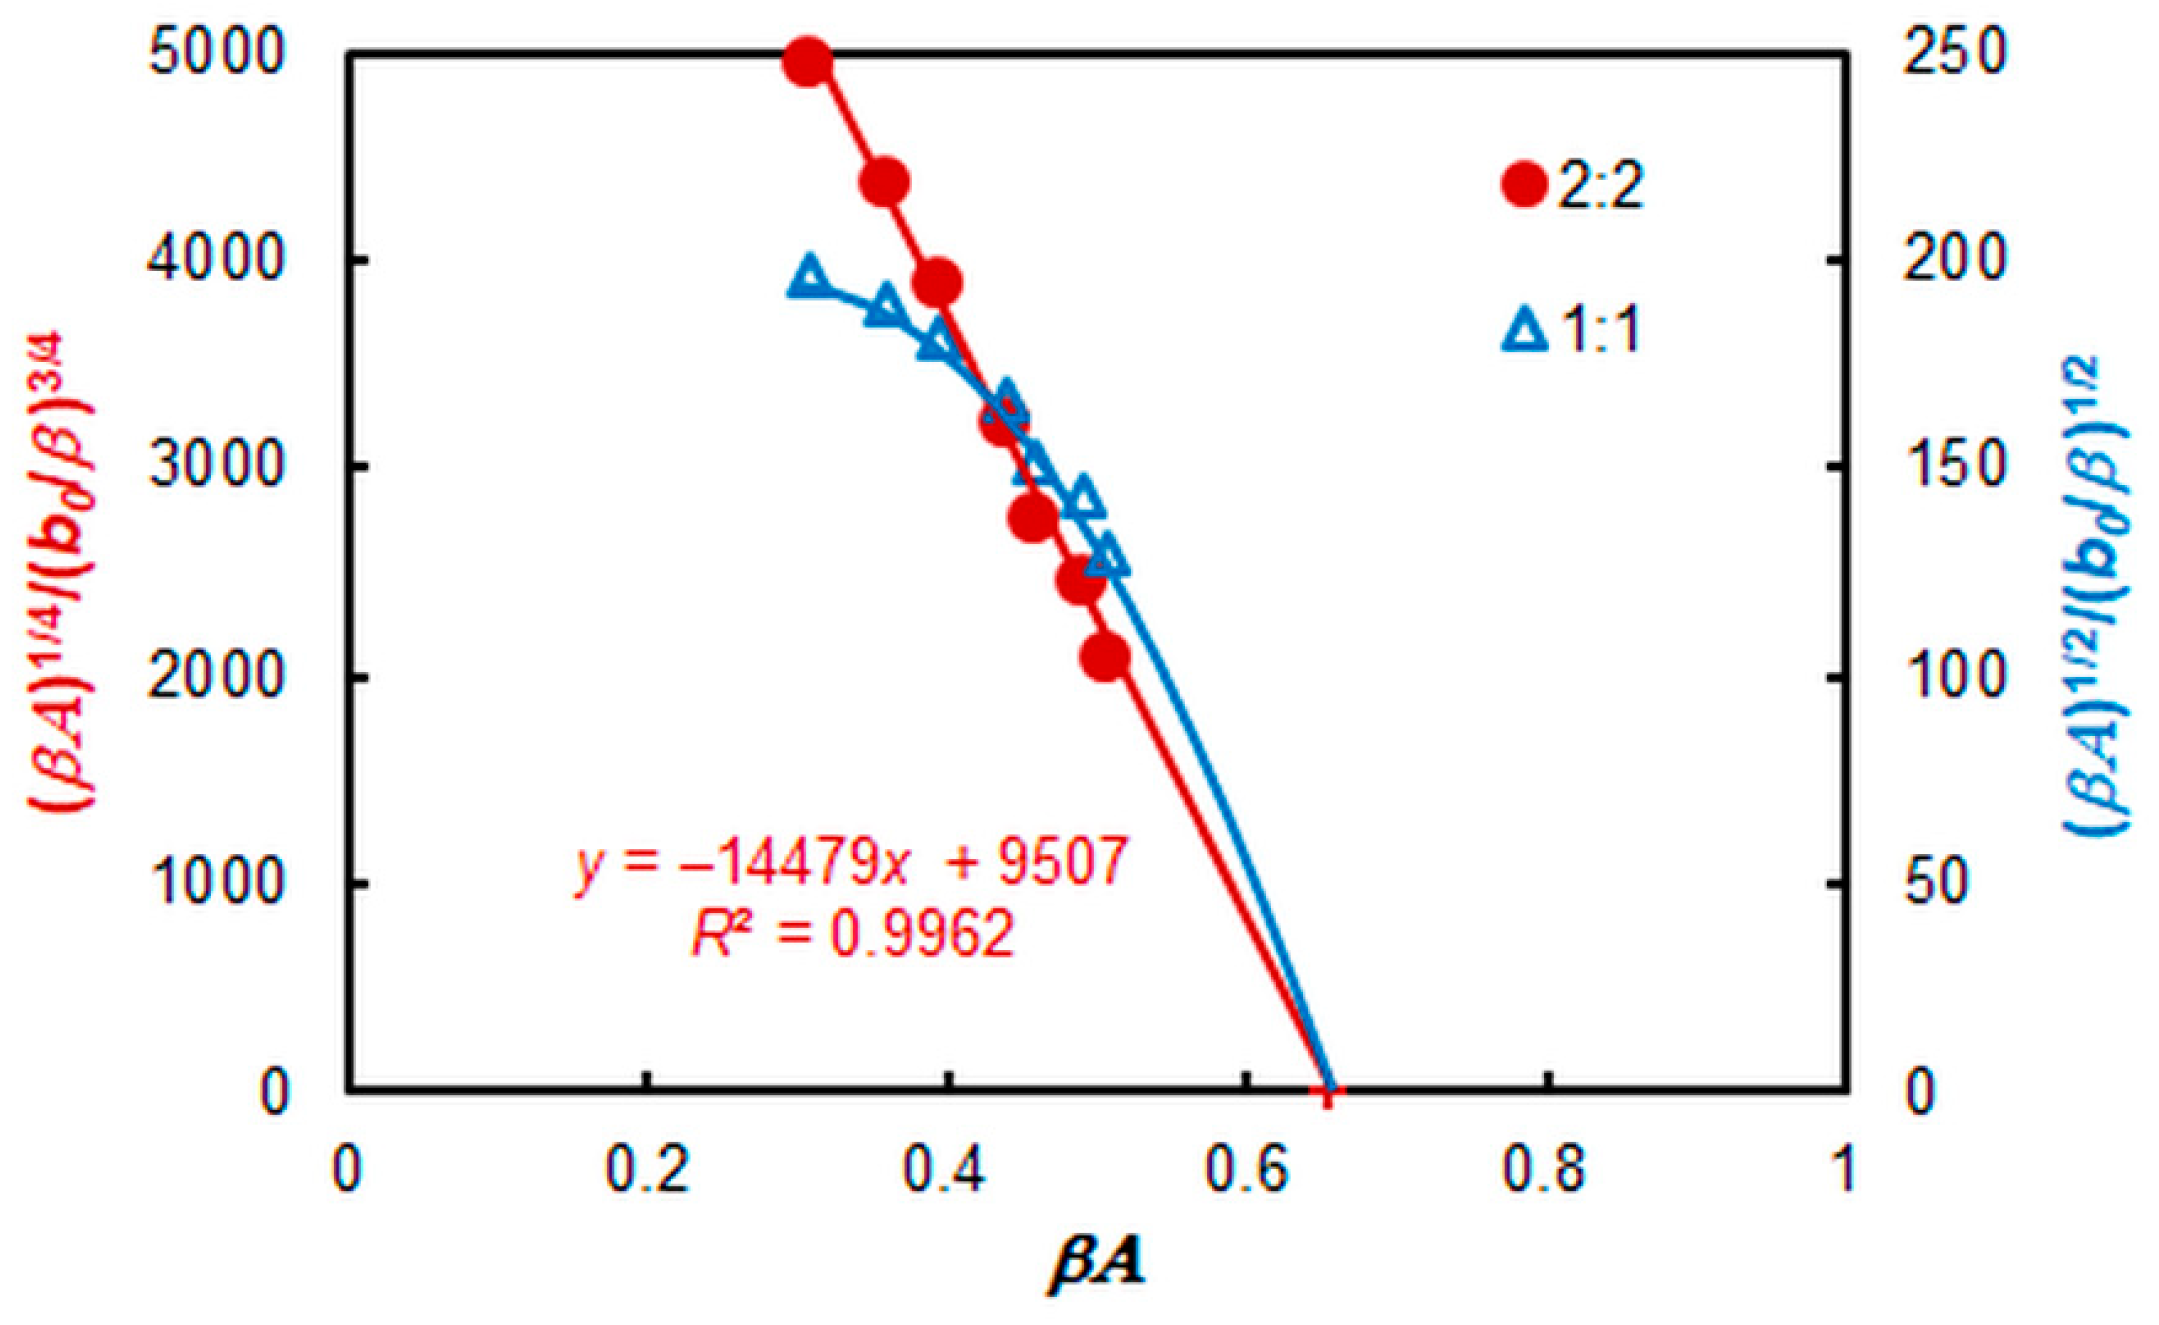
An additional independent method [37] was used to confirm the stoichiometry in the TTC complex (Figure 9). As can be seen, a straight line is obtained for a complex of type A2B2.
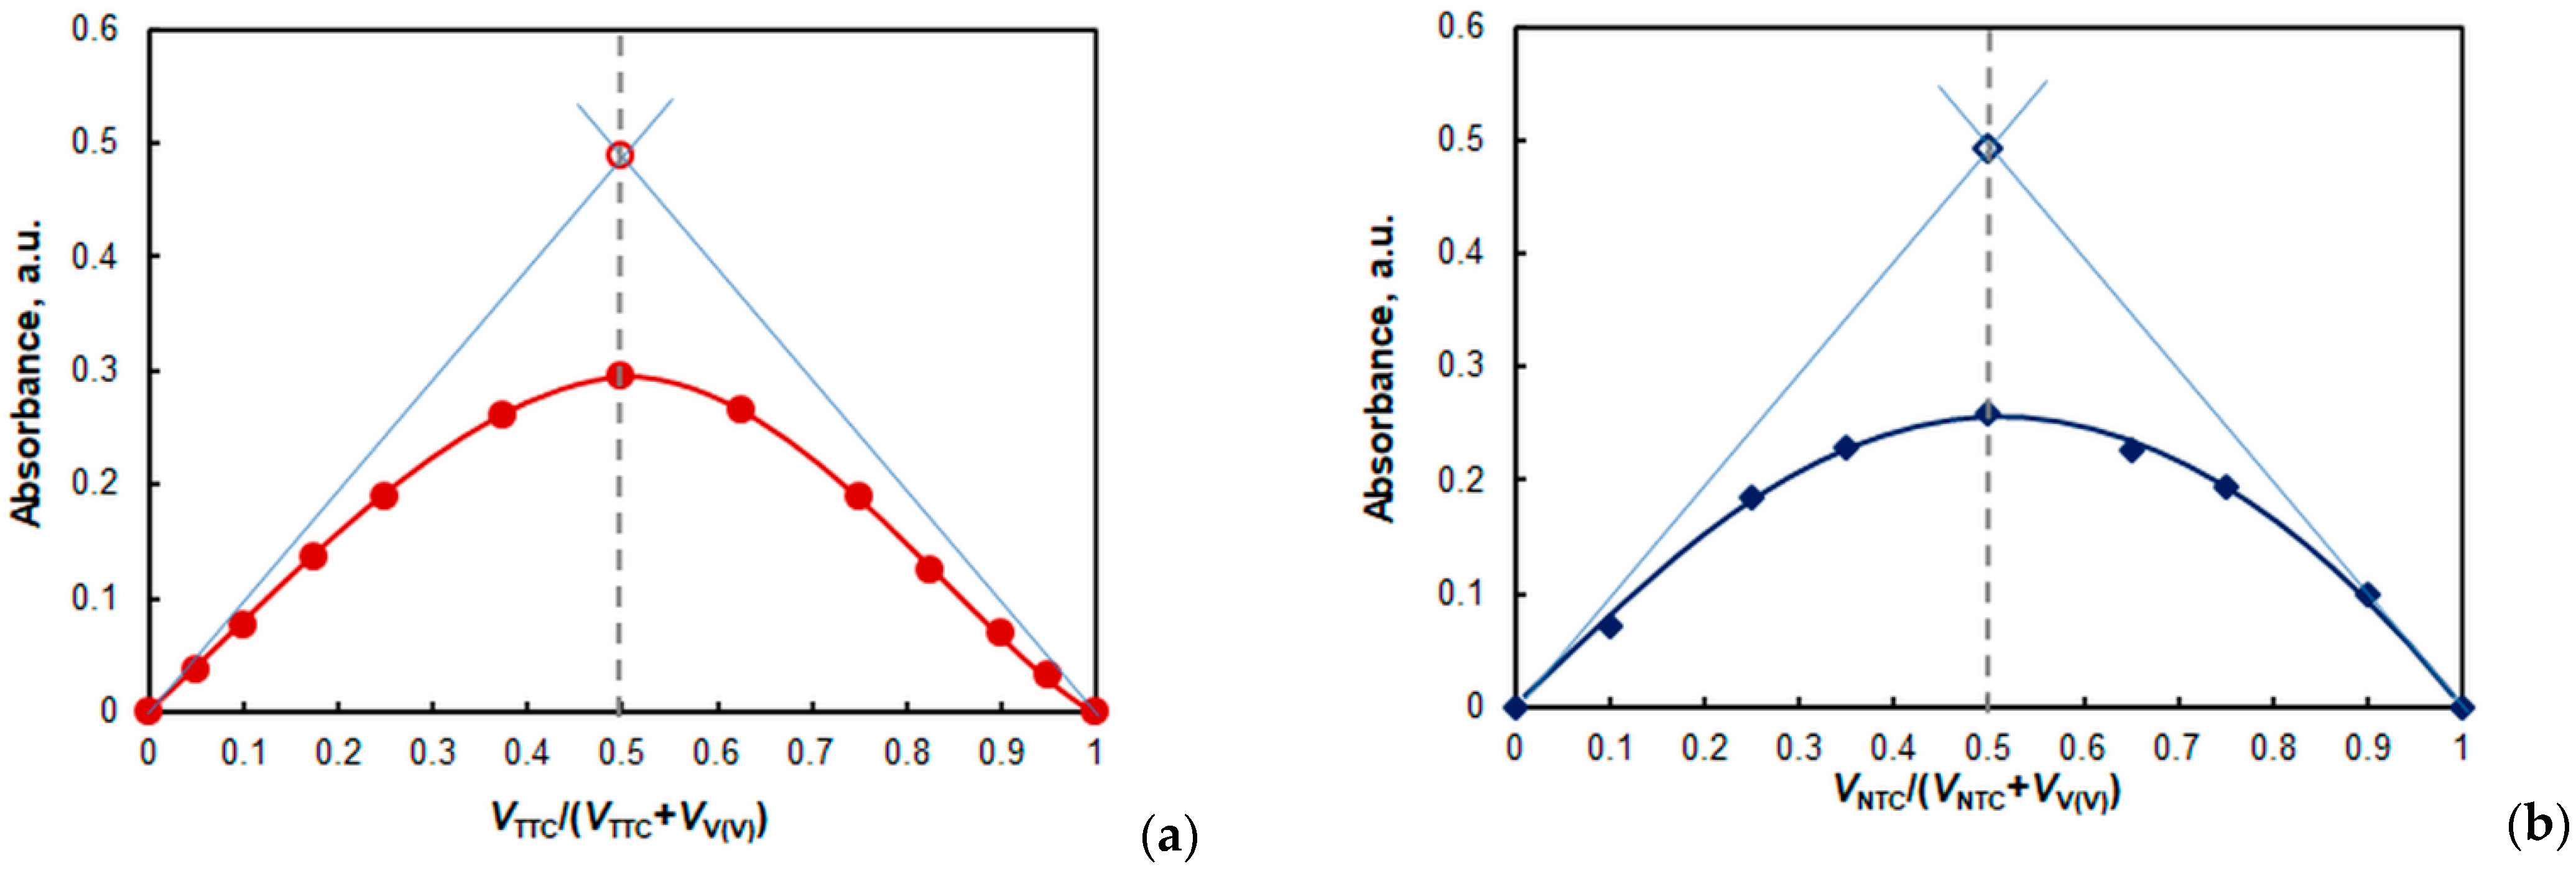
It is known from the literature [39,42,43] that Job’s method [38] can be used to distinguish 1:1-complexes from AnBn (n > 1) complexes (e.g., A2B2, A3B3, A4B4, etc.). The criterion for distinction is the presence or absence of concavities at the ends of the isomolar curve. Although such a distinction is not always reliable, it can be judged from Figure 10 that the NTC complex is most probably of the A1B1 type (no concavities), and the TTC complex is of the AnBn type (n > 1). If this conclusion is compared with the results presented above obtained via the mobile equilibrium method [36] and the dilution method [37], it can be deduced that nTTC:nV = 2:2.
The performed experiments give reason to assume that the complex obtained from TTC is an aggregate obtained in the organic phase via the dimerization of two 1:1:1 complexes represented by the formula (TT+)[VO2(HTAR)]. Such dimerization was reported for similar extraction systems containing V(V) and 5-methyl-4-(2-thiazolylazo)resorcinol [44,45].
The complex of NTC is monomeric (NTC+)[VO2(HTAR)]. The ditertazolium cation in it is most likely +1 charged: NTC+ = [(NT2+)Cl]+. This agrees with Tôei’s concept of low charges (z = ±1) of the ion-associable ions [32,46].
Equations of complex formation and extraction, based on information for the state of V(V) [13] and HTAR (H2L) [47,48] at the optimum pH value, are as follows:
2 H2VO4 (aq) + 2 H2L (aq) + 2 TT+ (aq) = [(TT+)[VO2(L)]]2 (org) + 4 H2O
H2VO4 (aq) + H2L (aq) + NTC+ (aq) = (NTC+)[VO2(L)] (org) + 2 H2O

2.6. Extraction Characteristics

Three independent methods were used to calculate the conditional extraction constant (Kex) characterizing Equation (1): the mobile equilibrium method [36] (Figure 7b, straight line 2), the dilution method [37] (Figure 9), and the Likussar–Boltz method [44,45,49] (Figure 10a).
The mobile equilibrium method (Figure 8b), Likussar–Boltz method (Figure 10b), Holme–Langmyhr method [50], and Harvey–Manning method [51] were used to determine the extraction constant for the NTC system (Equation (2)).
The obtained values, along with the values of distribution ratios (D) and fractions extracted (E), are given in Table 3.

2.7. Ground-State Equilibrium Geometries of the Cations

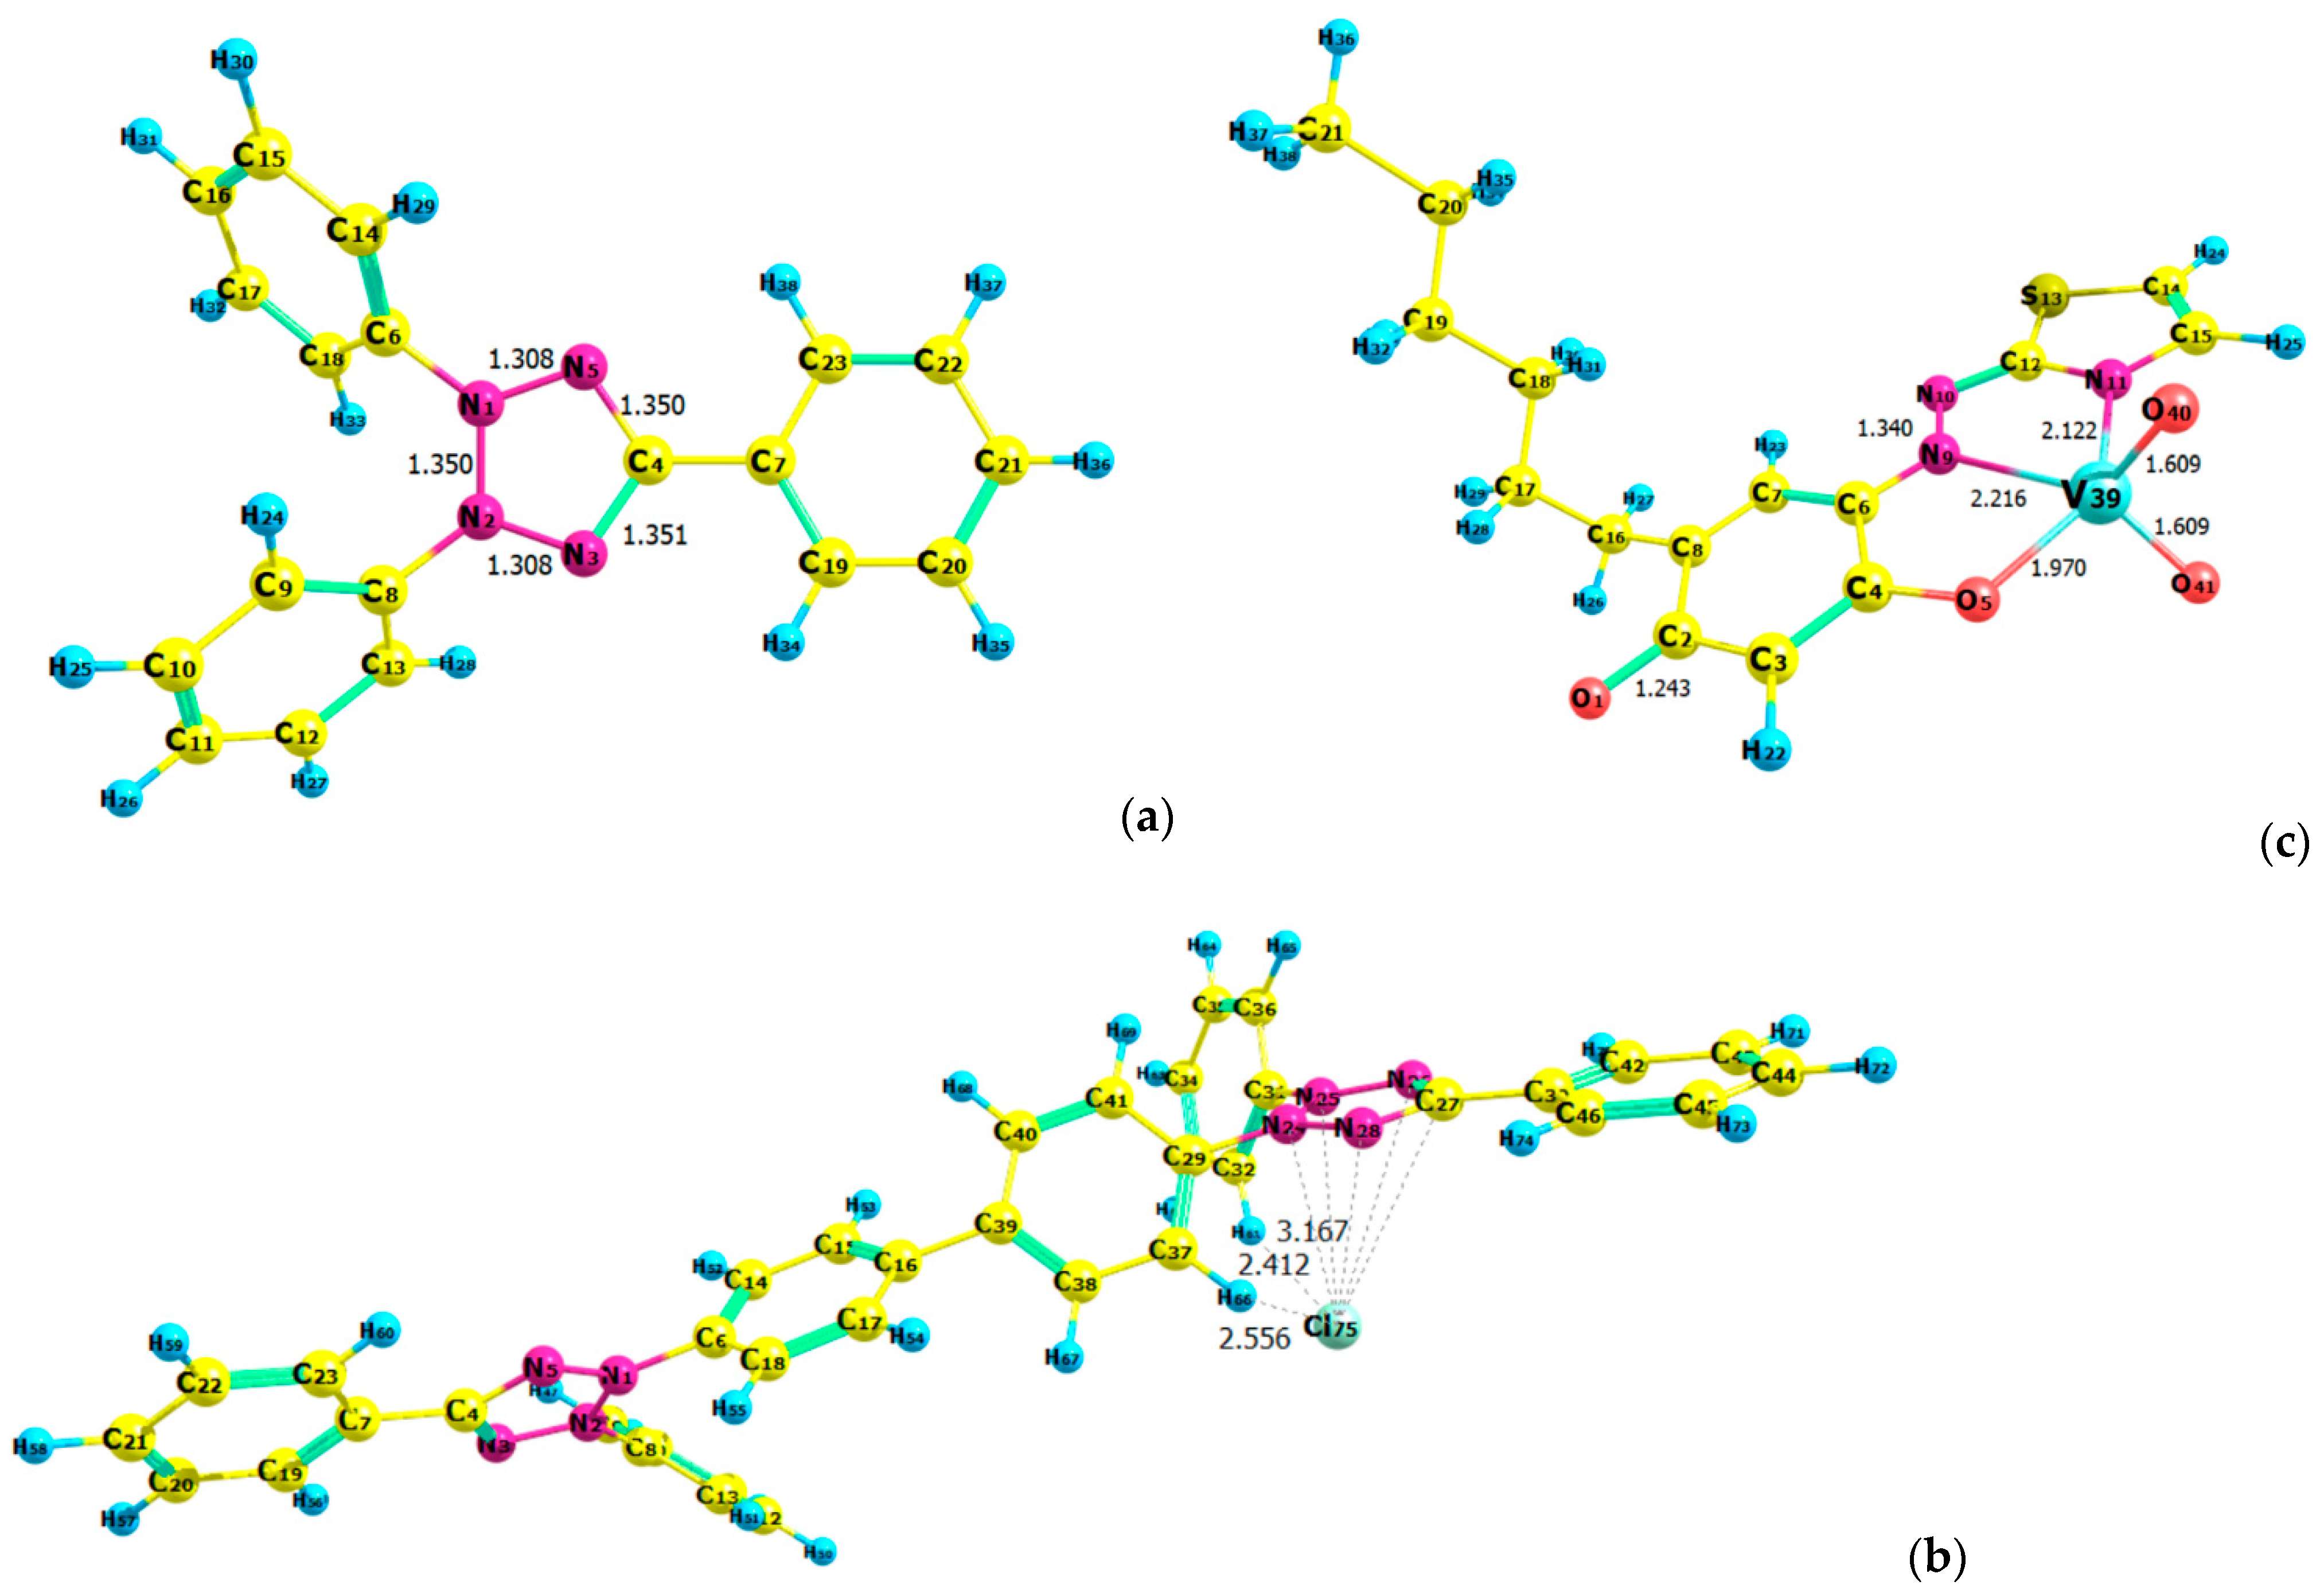
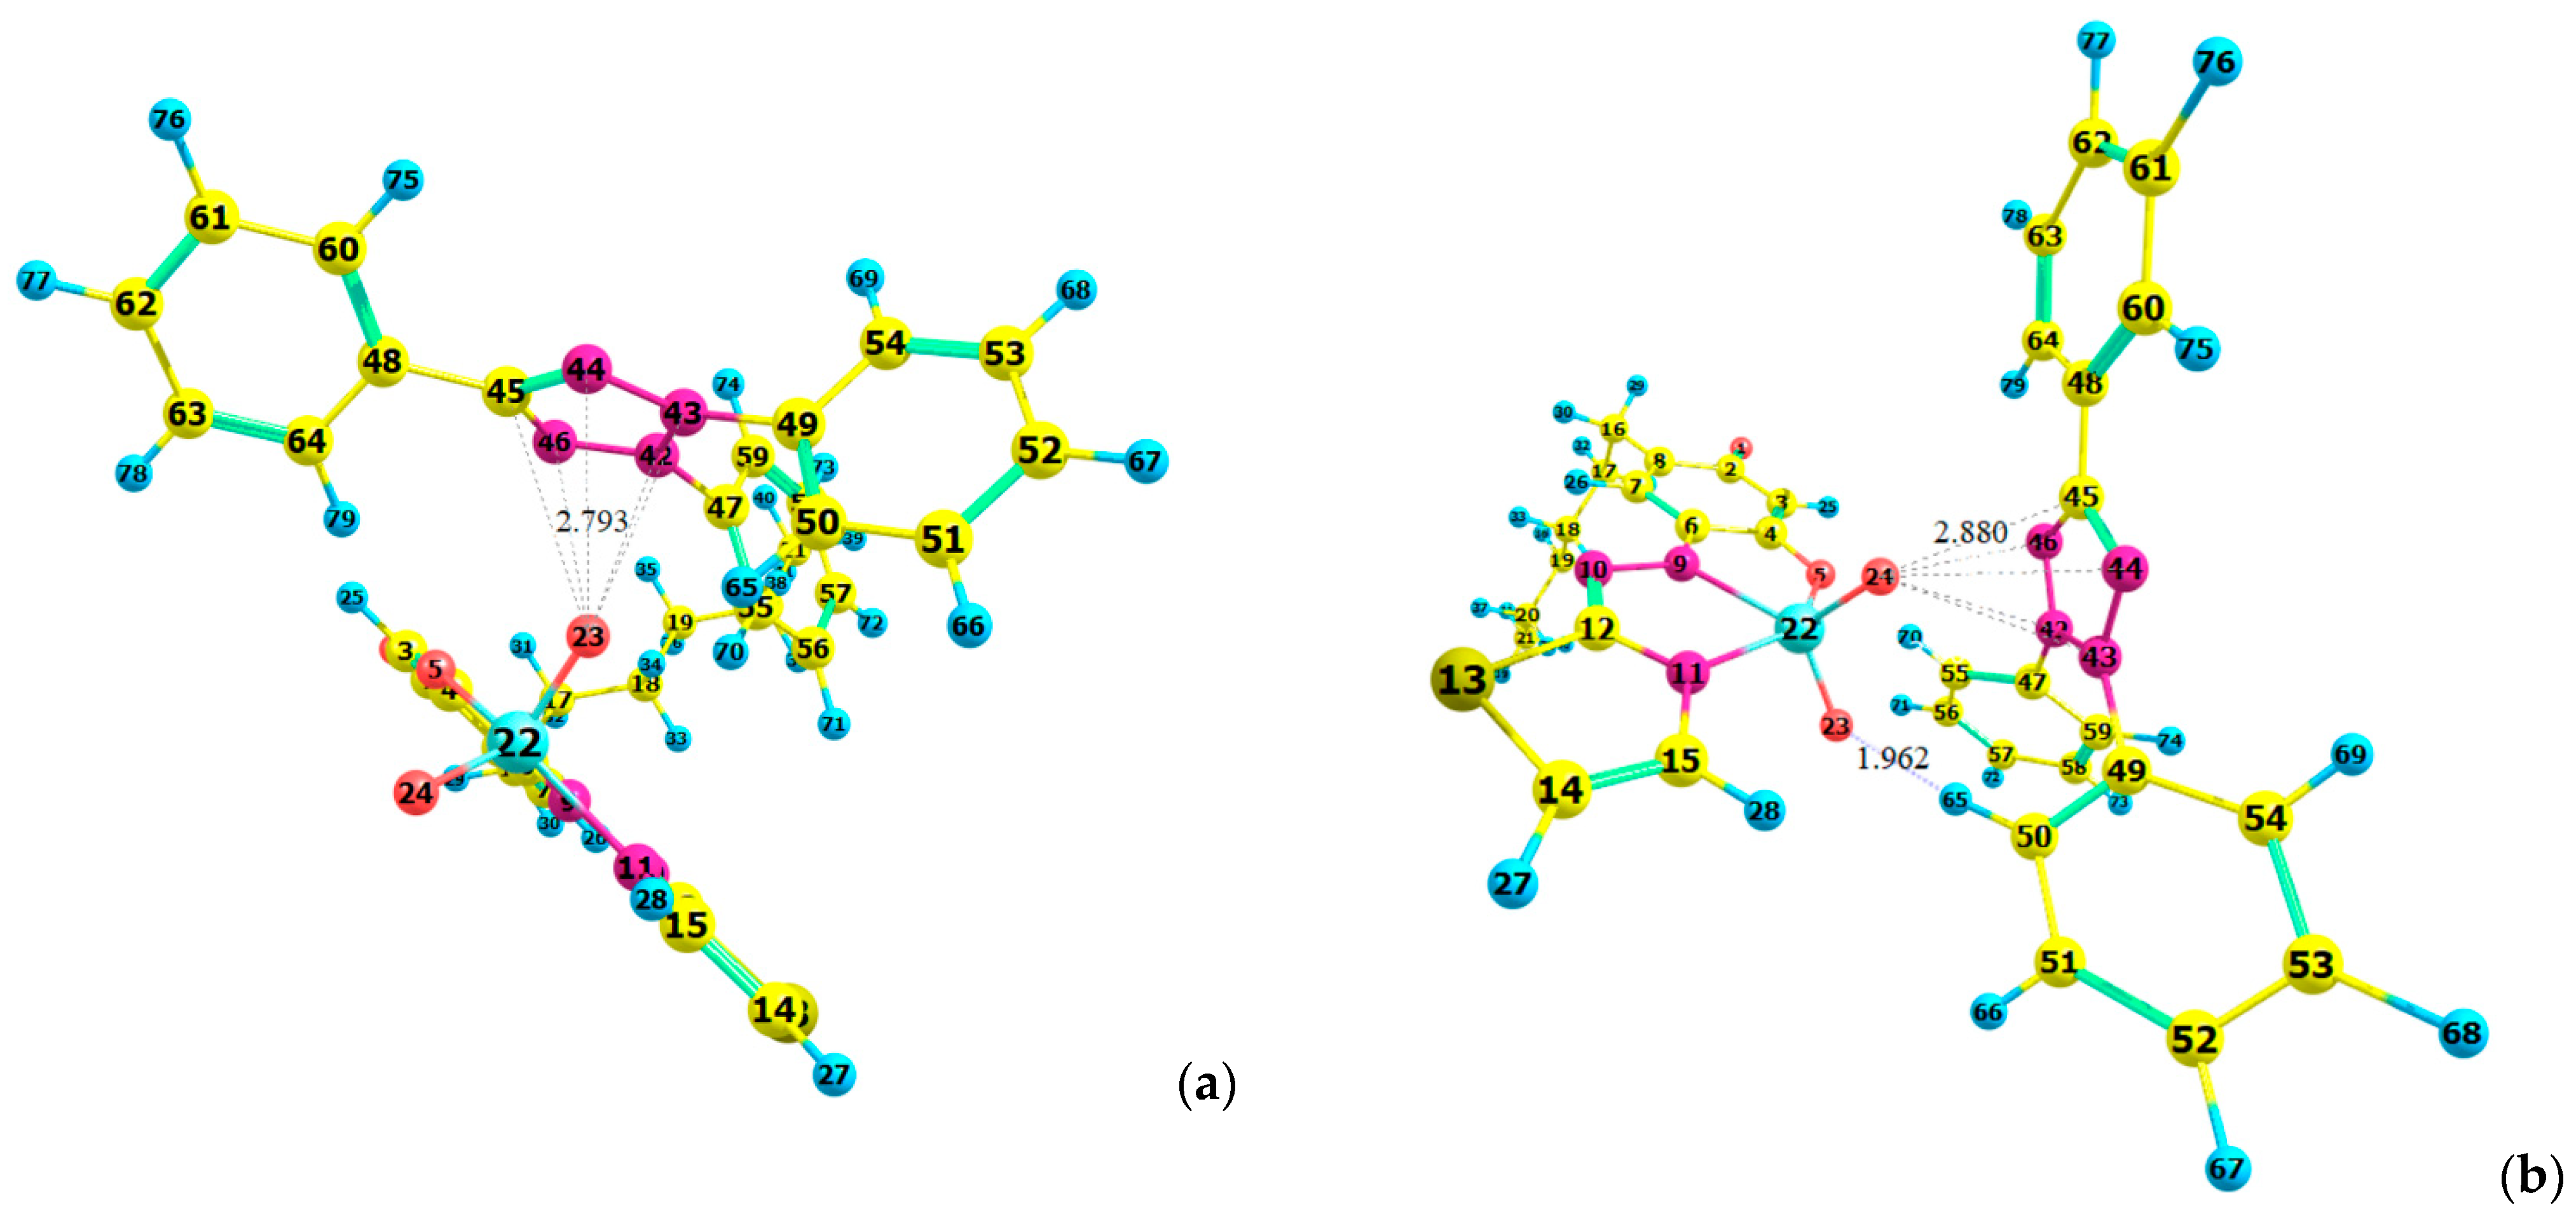
The optimized ground-state equilibrium geometries of the cations (TT+ and NTC+) are shown in Figure 11a,b. The five atoms in each of the tetrazolium rings are coplanar. The lengths of the N1–N5 and N2–N3 bonds in TT+ are equivalent (1.308 Å) and slightly shorter than the other bonds in this ring. The bond lengths between the atoms in the NTC+ rings are also close in length: N(1)–N(5) = 1.313 Å, N(2)–N(3) = 1.313 Å, N(1)–N(2) = 1.353 Å, N(3)–C(4) = 1.352 Å, and N(5)–C(4) = 1.353 Å (left-hand ring), and N(24)–N(28) = 1.306 Å, N(25)–N(26) = 1.305 Å, N(24)–N(25) = 1.348 Å, N(26)–C(27) = 1.351 Å, and N(28)–C(27) = 1.349 Å (right-hand ring). The lack of significant differences is consistent with the conclusion that the internal dimensions “are largely insensitive to the local environment” [30,52]. As seen in Figure 11b, the chloride ion is located near the right-hand tetrazolium ring (closest to N24). It is pincered by two hydrogen atoms (H(64) and H(61)) of the substituent groups.

2.8. Ground-State Equilibrium Geometries of the Complexes

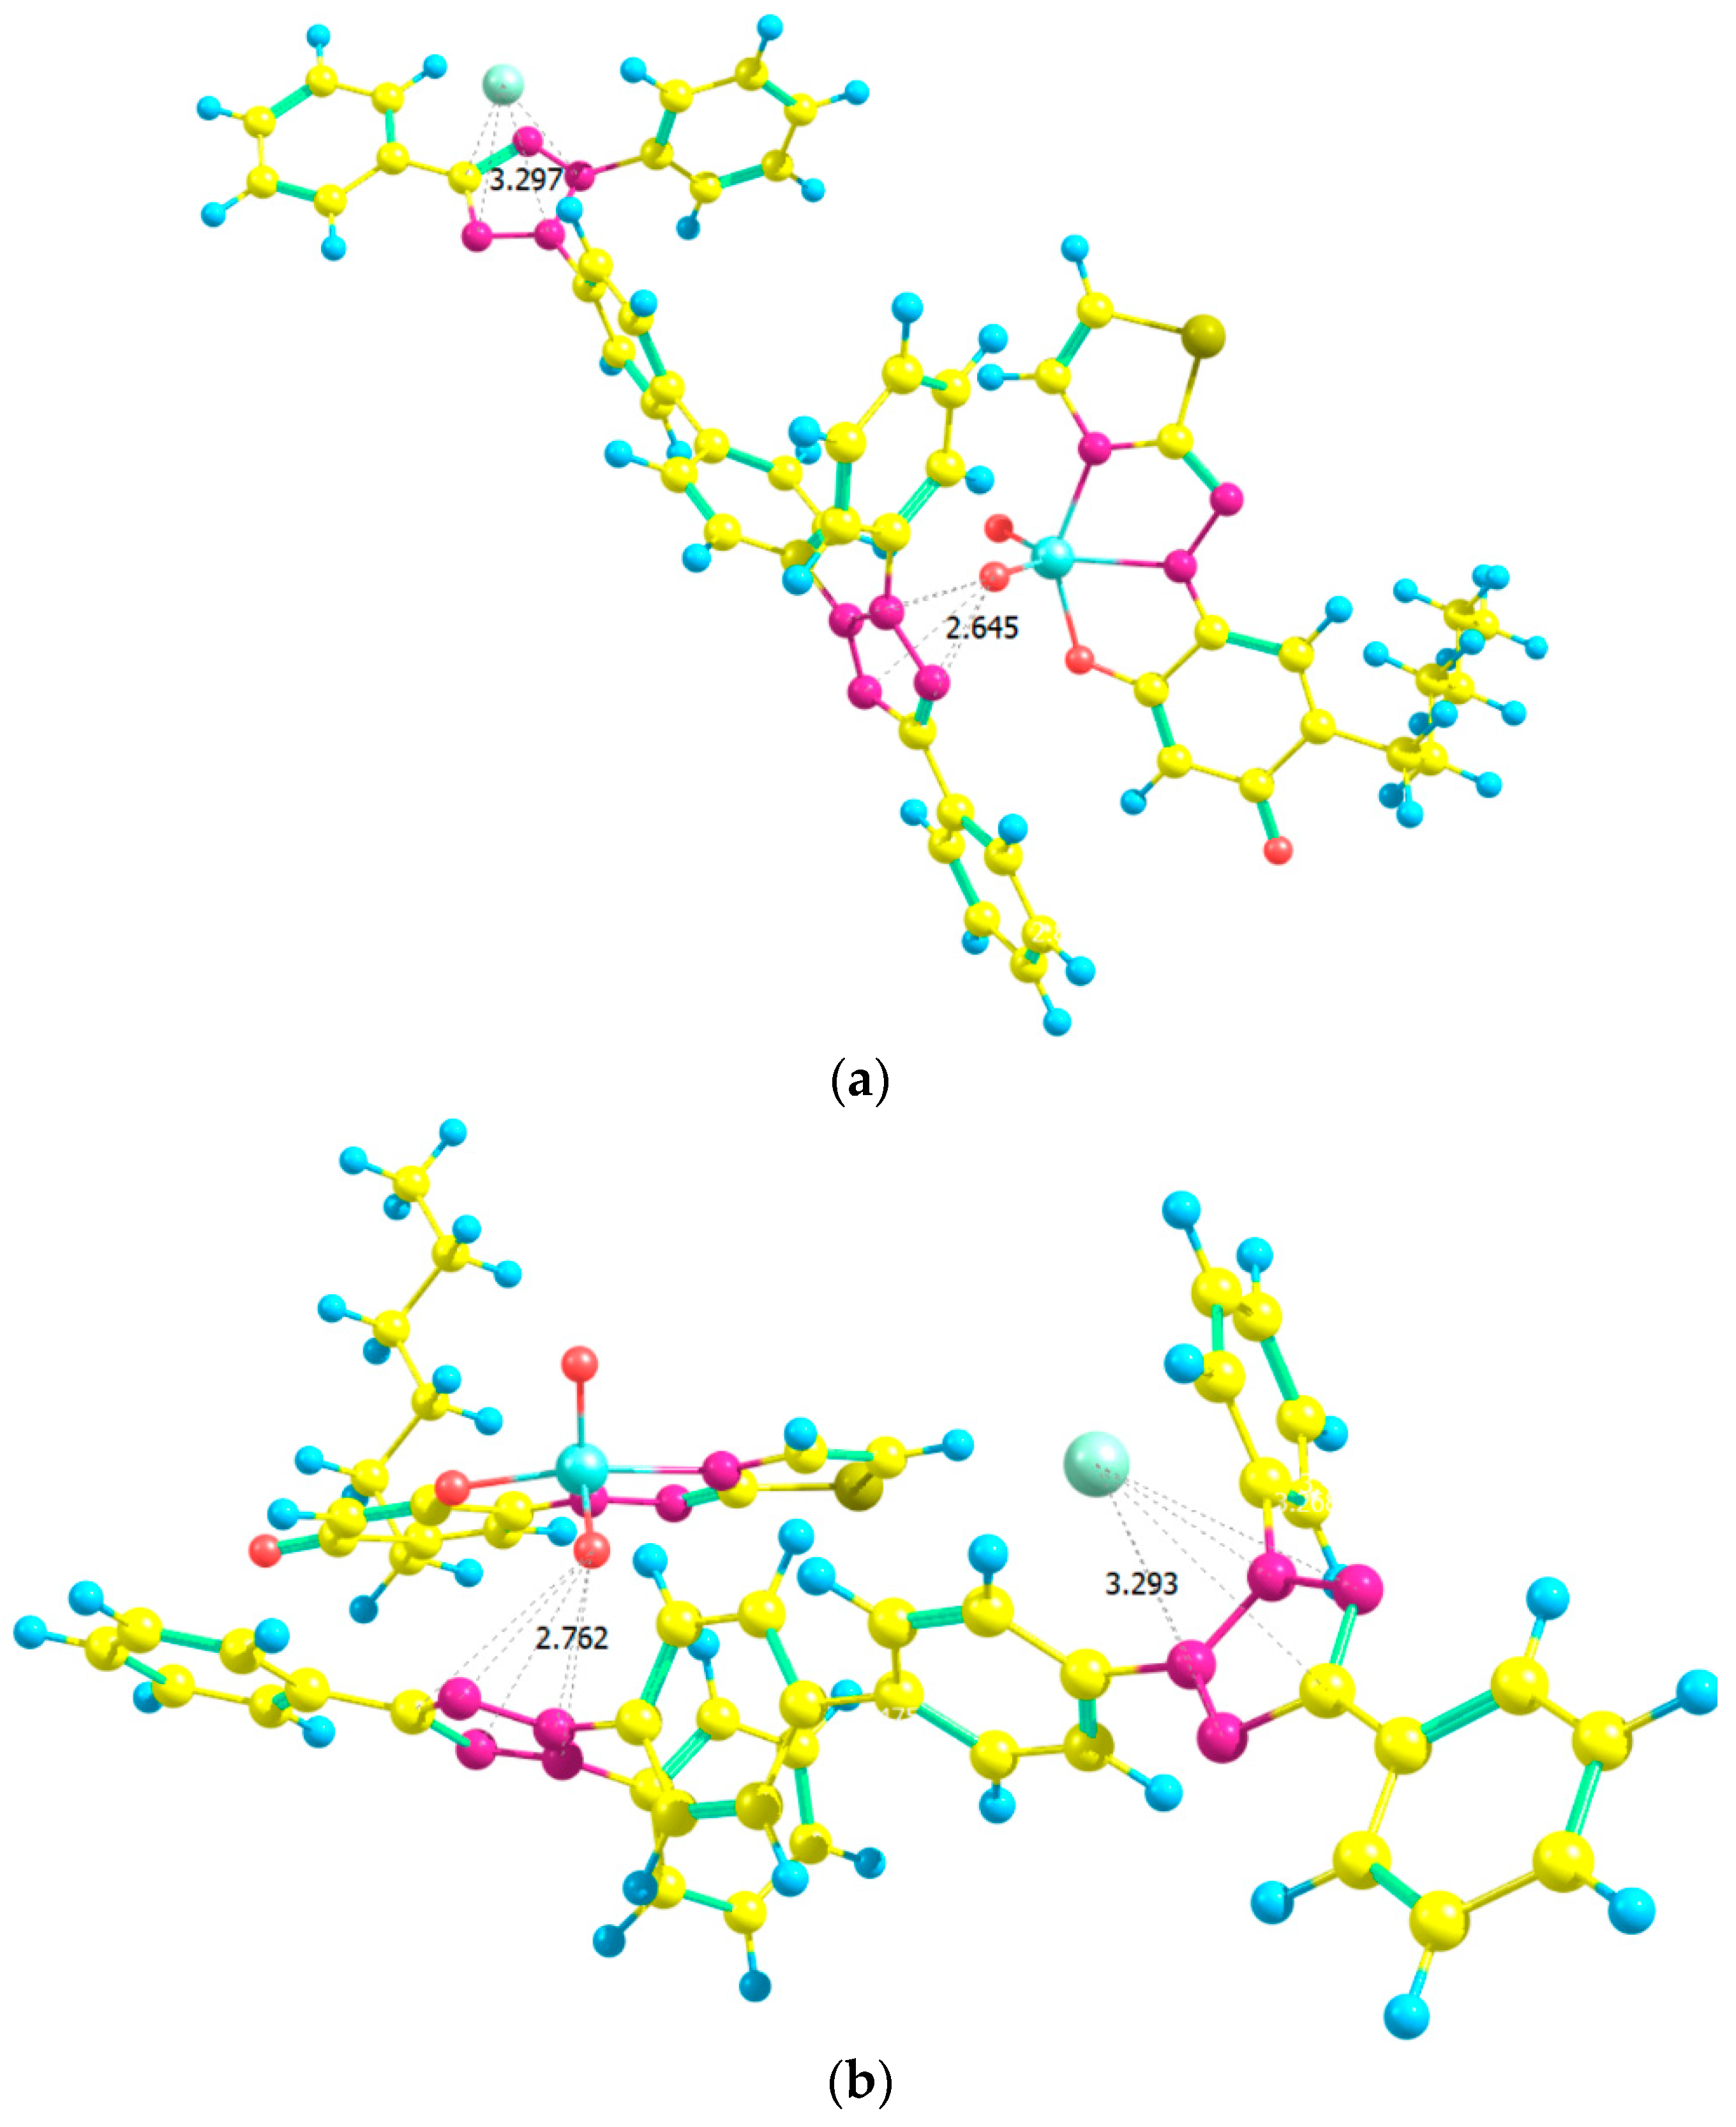
The next step was to correctly pair each of the two cationic structures (Figure 11a,b) with the anion [VO2(HTAR)] optimized in a previous paper [23] (Figure 11c). Two different NTC+–[VO2(HTAR)] structures were constructed and fully optimized at the HF/3–21G theoretical level (Figure 12a,b). Better stacking between the counterions was observed in Structure 1 (Figure 12a). Its energy is 15 kJ mol−1 lower than that of Structure 2.
The structure of [(TT+)[VO2(HTAR)]]2 was optimized in two steps. In the first step, the parent ions were assembled in two different ways, as shown in Figure 13a,b. In structure M1, the O(23) of the VO2 group is located near the tetrazolium ring. In the more stable structure M2, both oxygen atoms from the VO2 group are involved in additional interactions. Oxygen(24) is near the tetrazolium ring, and O(23) participates in a hydrogen bond C(50)–H(65)···O(23). This structure has 20 kJ mol−1 lower energy.
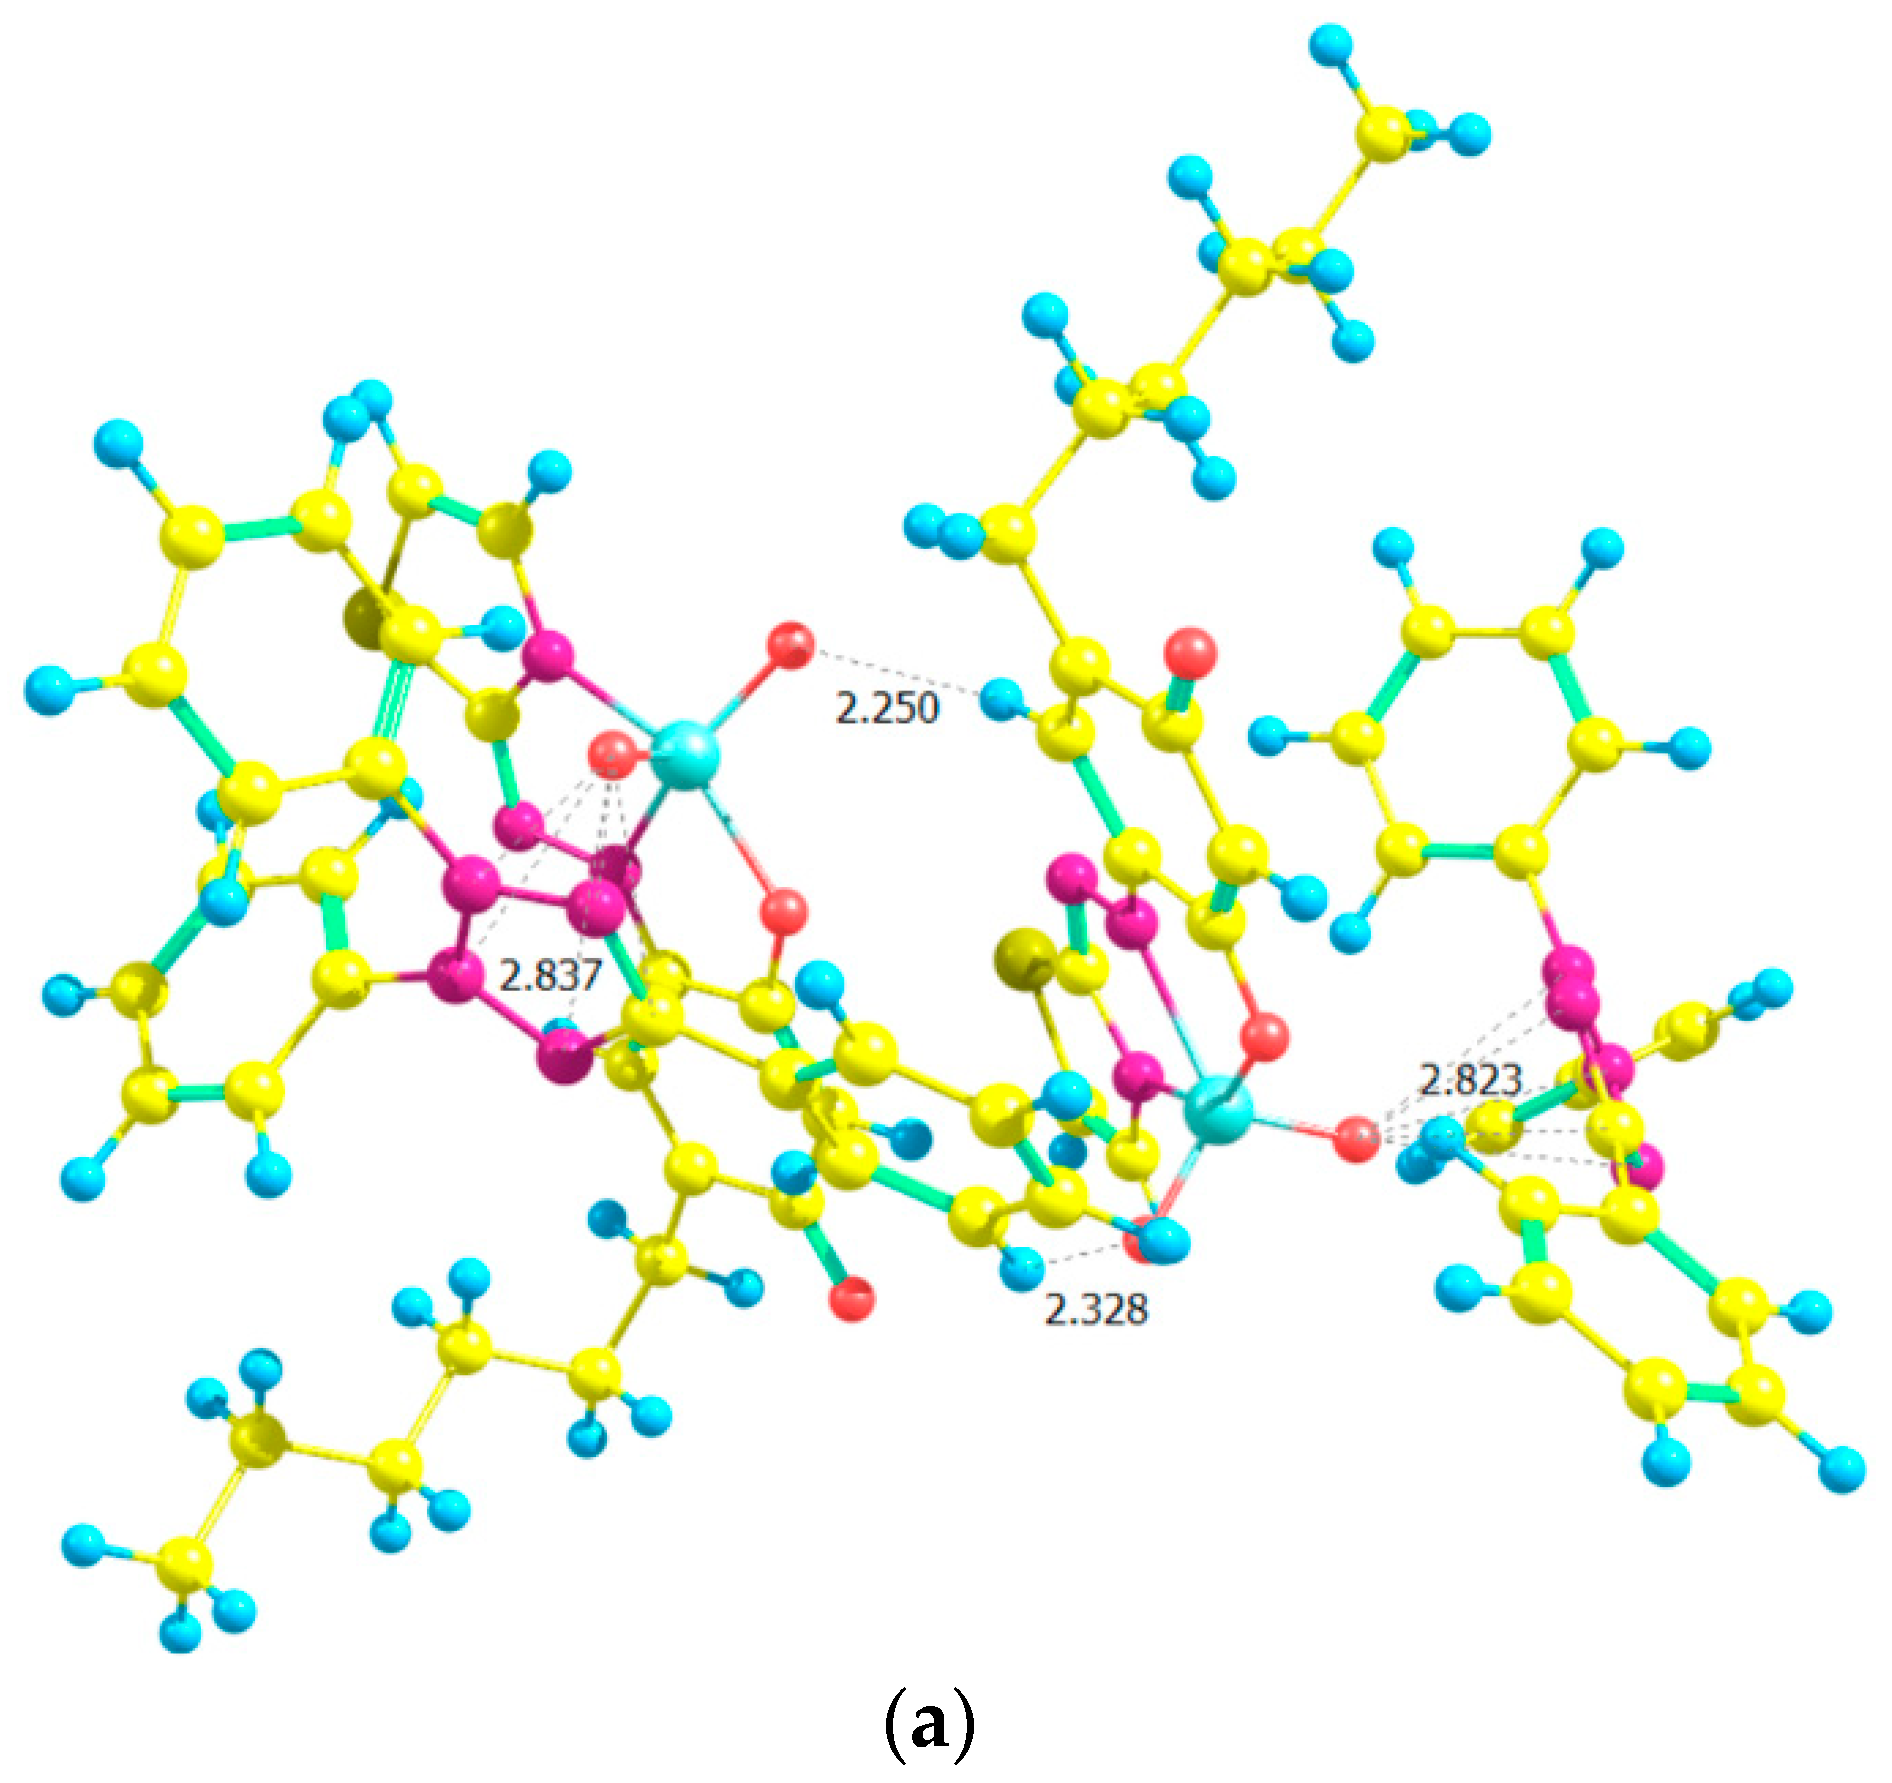
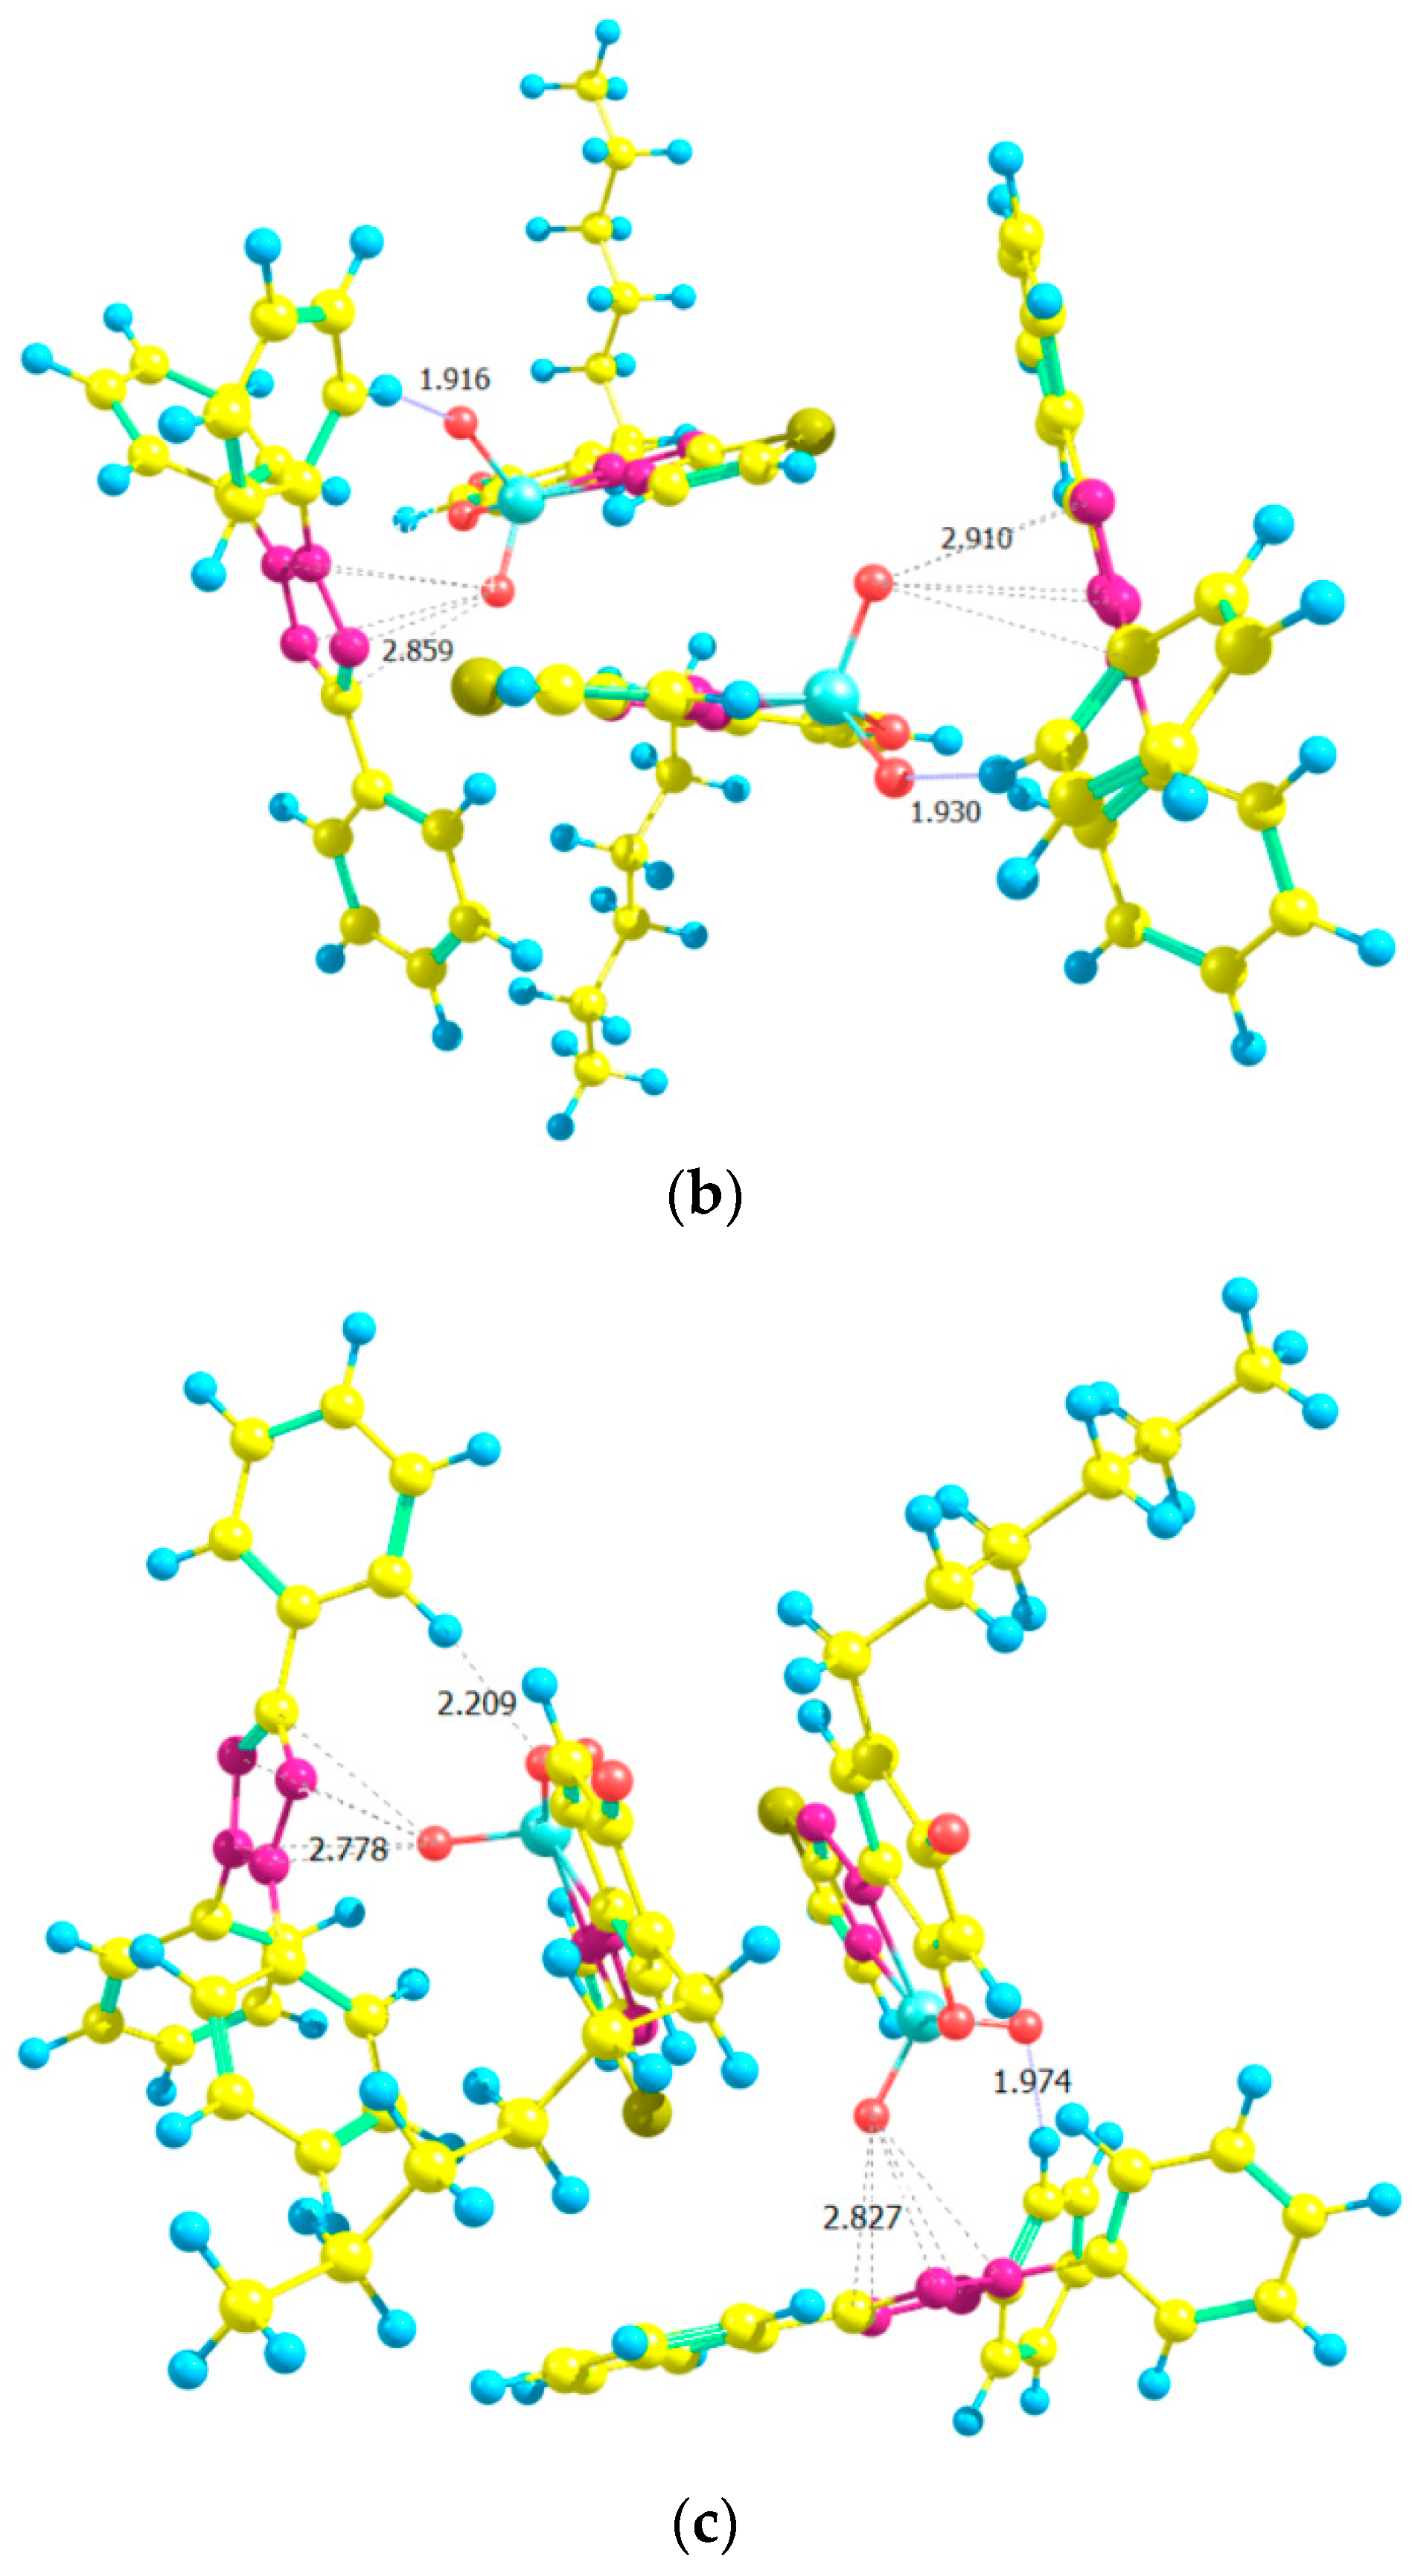
Figure 14 shows structures of dimers obtained in the second step—pairing of monomers. The dimeric structure D1 (a) is derived from two structures, M1, the dimeric structure D2 (b) is derived from two structures, M2, and the dimeric structure D3 (c), is derived from one structure, M1, and one M2.
The formation of D1 from two M1 structures is attended with a change of the Gibbs free energy of ΔG°298 = 20 kJ mol−1 and heat effect of ΔH°298 = –38 kJ mol−1.
The structure D2 (Figure 14b) has 46 kJ mol−1 lower energy than the energy of D1. The change of ΔG°298 for the formation of the dimer from two M2 fragments is 18 kJ mol−1, and the heat effect is ΔH°298 = −44 kJ mol−1.
The formation of the third dimer D3 is accompanied by ΔG°298 = 51 kJ mol−1 and ΔH°298 = −12 kJ mol−1. The dimer complex has 53 kJ mol−1 higher energy than D2 and only 7 kJ mol−1 than D1. In other words, the energy analysis of the three V(V)–HTAR–TT complexes led to the following stability series: D2 > D1 > D3.

2.9. Analytical Characteristics and Application

The relationships between the measured absorbance and the V(V) concentration in the aqueous phase were investigated under optimal conditions (see Table 1). The linear regression equations and some associated parameters related to the application of these systems for the determination of V(V) are included in Table 4. Advantages of the TTC–HTAR system are a wider linear range, a lower LOD, a lower cost of TTC (in comparison to NTC), and the tolerance of higher amounts of side ions such as Al(III), Ba(II), Br, Ca(II), Cl, Cr(VI), I, Mo(VI), NO3, and Re(VII) (Table 5). Advantages of the NTC–HTAR system are the lower reagents concentrations (Table 1) and higher tolerable levels of Zn(II), Cd(II), Hg(II), Mg(II), Pb(II), F, and HPO42− (Table 5).
The HTAR–TTC system was used to determine V(V) in real samples such as vanadium-depleted catalysts from sulfuric acid production and pharmaceuticals. The results of the catalyst analysis are shown in Table 6. They are statistically indistinguishable from those obtained via an alternative spectrophotometric method [53]. The results of V(V) determination in spiked pharmaceutical samples are displayed in Table 7. The recoveries were in the range of 97.2–105%, with relative standard deviations from 2.0% to 4.6%.

2.10. Comparison with Other Spectrophotometric Methods

Table 8 compares the performance of several spectrophotometric procedures for determining vanadium. The proposed HTAR–TTC procedure can be described as simple, cheap, fast, sensitive, and reliable. It does not require any special or expensive equipment and is easier to implement than DLLME-SFOD [54], UA-CPE [17,55], or MA-CPE [53]. It is faster than many procedures requiring prolonged extraction (10–20 min) [16,21,56], centrifugation + cooling (10 min) [54], sonification at elevated temperature + centrifugation + cooling (17–28 min) [17,55], incubation at elevated temperature + cooling (55–110 min) [53,57], or two-fold extraction [21]. The sensitivity is higher than that of most liquid–liquid extraction (LLE) procedures [16,19,20,21,58,59], and the amount of organic solvent used is less than that of some of them [20,21,44,58]. Reagents are commercially available, and there is no need for tedious syntheses as described in [21,56,58,60]. Finally, the procedure can be considered reliable as the optimal intervals are wide enough and none of the thoroughly investigated parameters is problematic.

3. Materials and Methods

3.1. Reagents and Chemicals

Reagents from Merck (Schnelldorf, Germany), Fluka (Buchs, Switzerland), and Loba Feinchemie (Fischamend, Austria) were used without additional purification as aqueous solutions. The standard solution of V(V) was prepared from NH4VO3 (Merck, puriss. p. a.) at a concentration of 2.0 × 10⁻⁴ mol L−1. Solutions of TTC (Loba Feinchemie, p.a.) and NTC (Fluka, for microbiology) were stored in dark flasks; cTTC = 3 × 10⁻³ mol L−1 and cNTC = 2 × 10⁻³ mol L−1. The azo dye HTAR (Merck) was dissolved in the presence of KOH [22,57,62]; cHTAR = 2 × 10⁻³ mol L−1. A series of buffer solutions (pH 3.3–7.4) were made by mixing 2 mol L−1 solutions of acetic acid and ammonia. Chloroform was purified by distillation and used repeatedly according to safety regulations. Distilled water was used in all experiments.

3.2. Instrumentation

An Ultrospec 3300 pro scanning spectrophotometer (Garforth, UK), equipped with 10 mm path-length quartz (or glass) cuvettes, was used during the work. The pH measurements were made with a WTW InoLab 7110 pH meter (Weilheim, Germany) with a glass electrode.

3.3. Samples

Pharmaceuticals were purchased from a local pharmacy: (i) Marimer inhalation (2.2% hypertonic seawater); (ii) Sterimar for nasal hygiene (a 100% natural, purified seawater-based nasal spray); and (iii) a solution of 0.9% NaCl for intravenous infusion. Aliquots of 5 mL of these solutions were subjected to the extraction procedure.
Samples of spent silica-supported catalysts (from the sulfuric acid production) were provided by KCM SA, Plovdiv (Bulgaria). They were ground in a mortar and prepared for analysis according to a known procedure [59]. Aliquots of 0.5 mL of the obtained solutions were used for the analysis.

3.4. Procedures for Optimization and Determination of Extraction Constants

The following solutions were mixed in a 125 mL separatory funnel: V(V), ammonium acetate buffer, HTAR, and TS (TTC or NTC). Water was added to a total volume of 10 mL. The volume of chloroform was 5 mL (in the optimization experiments) or 10 mL (in the determination of the extraction constant; Figure 7, Figure 8, Figure 9 and Figure 10). After pouring the organic solvent, the funnel was stoppered and shaken for a fixed time. Part of the resulting chloroform extract was filtered through filter paper and transferred to the cuvette. Absorbance was measured against a simultaneously prepared blank containing no V(V).

3.5. Procedure for Determination of Distribution Ratios and Fractions Extracted

The liquid–liquid distribution ratios for each of the systems were calculated after considering the absorbance in single extraction (A1) and triple extraction (A3) experiments: D = A1/(A3A1). The single extraction and the first step of the triple extraction were performed with 10 mL of chloroform under the optimal extraction conditions (Table 1). The organic layers were transferred into 25 mL volumetric flasks. The flask for the single extraction was brought to the mark with chloroform. The second and third steps of the triple extraction were carried out by adding 7 mL of chloroform to the aqueous phase of the previous step. The organic extracts were combined in the second 25 mL volumetric flask, and chloroform was added to the mark. Absorbances were measured against corresponding blanks.
The fractions extracted were calculated using the equation %E = 100 × D/(D + 1).

3.6. Procedure for Determination of Vanadium(V) with HTAR and TTC

An aliquot of the analyzed solution (containing 0.015–2.0 μg mL−1 of V) was transferred in a 125 mL separatory funnel. Solutions of the buffer (1 mL, pH 4.7), HTAR (0.4 mL, 2 × 10⁻³ mol L−1), and TTC (0.8 mL, 3 × 10⁻³ mol L−1) were added, and the sample was diluted with water until a total volume of 10 mL. Then, 5 mL of chloroform was added, and the mixture was shaken for 2.5 min. After the phase separation, a portion of the chloroform extract was poured into the cuvette, and the absorbance was measured at 549 nm against a blank. The unknown V(V) concentration was calculated from a calibration plot prepared using the same procedure.

3.7. Procedure for Determination of Vanadium(V) with HTAR and NTC

An aliquot of the analyzed solution (containing 0.023–1.1 μg mL−1 of V) was transferred in a 125 mL separatory funnel. Solutions of the buffer (1 mL, pH 4.7), HTAR (0.2 mL, 2 × 10⁻³ mol L−1), and NTC (0.7 mL, 2 × 10⁻³ mol L−1) were added, and the sample was diluted with water until a total volume of 10 mL. Then, 5 mL of chloroform was added, and the mixture was shaken for 3.0 min. After the phase separation, a portion of the chloroform extract was poured into the cuvette, and the absorbance was measured at 556 nm against a blank. The unknown V(V) concentration was calculated from a calibration plot prepared using the same procedure.

3.8. Theoretical

The ground-state equilibrium geometries of the cations, TT+ and NTC+, were optimized at the B3LYP/6-311++G** and B3LYP/6-31+G* levels of theory, respectively. Each of these cations was then paired in different ways with the anionic complex [VO2(HTAR)] studied in a previous work [23] as described above.
The NTC+ and [VO2(HTAR)] counterions were assembled in two ways and optimized at the HF/3-21G level of theory. Furthermore, the thermodynamic characteristics of the obtained structures were calculated and compared.
The TT+ and [VO2(HTAR)] counterions were also assembled in two different ways and optimized at the HF/3-21G level of theory to obtain monomeric structures (M1 and M2) of the type (TT+)[VO2(HTAR)]. These structures were combined into three dimers (M1–M1, M2–M2, and M1–M2). Optimization was performed at the HF/3-21G level of theory, and the stability of the obtained species was evaluated.
All calculations were performed for the gas phase using the GAUSSIAN 16 program package [63]. The ChemCraft program (https://chemcraftprog.com (accessed on 13 September 2023)) was used for the visualization of the computed results [64].

4. Conclusions

The complex formation of two new V(V) complexes has been studied. The differences between the extracted species have been highlighted. The behavior of the ditetrazolium salt NTC is interesting because of its participation in the final complex as a singly charged cation [(NT)2+Cl]+. The TT+ complex, on the other hand, is notable for its dimeric structure, which gives it excellent extractability and good analytical characteristics. It has been applied to the analysis of real samples—pharmaceuticals and silica-supported catalysts.

Author Contributions

Conceptualization, K.B.G.; methodology, K.B.G., P.V.R. and V.B.D.; software, V.B.D. and K.B.G.; validation, K.B.G., P.V.R. and A.D.S.; formal analysis, K.B.G., P.V.R. and V.B.D.; investigation, P.V.R., A.D.S. and G.K.T.; resources, K.B.G., V.B.D. and G.K.T.; writing—original draft preparation, K.B.G.; writing—review and editing, V.B.D. and K.B.G.; visualization, K.B.G., G.K.T. and A.D.S.; supervision, K.B.G.; project administration, V.B.D.; funding acquisition, K.B.G. All authors have read and agreed to the published version of the manuscript.

Funding

This research was funded in part by the National Centre for High-performance and Distributed Computing through grant No D01-168/28.07.2022. The APC will be funded by the Medical University of Plovdiv.

Institutional Review Board Statement

Not applicable.

Informed Consent Statement

Not applicable.

Data Availability Statement

Not applicable.

Acknowledgments

We acknowledge the provided access to the e-infrastructure of the NCHDC, a part of the Bulgarian National Roadmap on RIs, with financial support by Grant No D01-168/28.07.2022.

Conflicts of Interest

The authors declare no conflict of interest.

Sample Availability

Not available.

References

  1. Rudnick, R.L.; Gao, S. Treatise on Geochemistry, 2nd ed.; Holland, H.D., Turekian, K.K., Eds.; Elsevier: Oxford, UK, 2014; Volume 4, pp. 1–51. [Google Scholar] [CrossRef]
  2. Schlesinger, W.H.; Klein, E.M.; Vengosh, A. Global biogeochemical cycle of vanadium. Proc. Natl. Acad. Sci. USA 2017, 114, E11092–E11100. [Google Scholar] [CrossRef] [PubMed]
  3. Roychoudhury, A. Vanadium uptake and toxicity in plants. SF J. Agri. Crop Manag. 2020, 1, 1010. [Google Scholar]
  4. Hope, B.K. A dynamic model for the global cycling of anthropogenic vanadium. Glob. Biogeochem. Cycles 2008, 22, GB4021. [Google Scholar] [CrossRef]
  5. Watt, J.A.; Burke, I.T.; Edwards, R.A.; Malcolm, H.M.; Mayes, W.M.; Olszewska, J.P.; Pan, G.; Graham, M.C.; Heal, K.V.; Rose, N.L.; et al. Vanadium: A re-emerging environmental hazard. Environ. Sci. Technol. 2018, 52, 11973–11974. [Google Scholar] [CrossRef] [PubMed]
  6. Wlazłowska, E.; Grabarczyk, M. Adsorptive Stripping Voltammetry for Determination of Vanadium: A Review. Materials 2023, 16, 3646. [Google Scholar] [CrossRef]
  7. Imtiaz, M.; Rizwan, M.S.; Xiong, S.; Li, H.; Ashraf, M.; Shahzad, S.M.; Shahzad, M.; Rizwan, M.; Tu, S. Vanadium, recent advancements and research prospects: A review. Environ. Int. 2015, 80, 79–88. [Google Scholar] [CrossRef]
  8. Viers, J.; Dupré, B.; Gaillardet, J. Chemical composition of suspended sediments in World Rivers: New insights from a new database. Sci. Total Environ. 2009, 407, 853–868. [Google Scholar] [CrossRef]
  9. Vasseghian, Y.; Sadeghi Rad, S.; Vilas–Boas, J.A.; Khataee, A. A global systematic review, meta-analysis, and risk assessment of the concentration of vanadium in drinking water resources. Chemosphere 2021, 267, 128904. [Google Scholar] [CrossRef]
  10. Rayner-Canham, G. Periodic patterns: The Group (n) and Group (n + 10) linkage. Found. Chem. 2013, 15, 229–237. [Google Scholar] [CrossRef]
  11. Rehder, D. The role of vanadium in biology. Metallomics 2015, 7, 730–742. [Google Scholar] [CrossRef]
  12. Rehder, D. Vanadium in health issues. ChemTexts 2018, 4, 20. [Google Scholar] [CrossRef]
  13. Taylor, M.J.C.; Staden, J.F. Spectrophotometric determination of vanadium(IV) and vanadium(V) in each other’s presence. Analyst 1994, 119, 1263–1276. [Google Scholar] [CrossRef]
  14. Pyrzyńska, K. Recent developments in spectrophotometric methods for determination of vanadium. Microchim. Acta 2005, 149, 159–164. [Google Scholar] [CrossRef]
  15. He, W.-Y.; Wang, K.-P.; Yang, J.-Y. Spectrophotometric methods for determination of vanadium: A review. Toxicol. Environ. Chem. 2018, 100, 20–31. [Google Scholar] [CrossRef]
  16. Kuliyev, K.A.; Verdizade, N.A. Spectroscopic investigation complex formation of vanadium using 2,6-dithiolphenol and hydrofob amins. Am. J. Chem. 2015, 5, 10–18. [Google Scholar]
  17. Temel, N.K.; Gürkan, R. Preconcentration and determination of trace vanadium(V) in beverages by combination of ultrasound assisted-cloud point extraction with spectrophotometry. Acta Chim. Slov. 2018, 65, 138–149. [Google Scholar] [CrossRef]
  18. Stefanova, T.S.; Simitchiev, K.K.; Gavazov, K.B. Liquid–liquid extraction and cloud point extraction for spectrophotometric determination of vanadium using 4-(2-pyridylazo) resorcinol. Chem. Pap. 2015, 69, 495–503. [Google Scholar] [CrossRef]
  19. Bychkova, O.A.; Zavodova, M.N.; Nikitina, T.G.; Nikonorov, V.V. Extraction–photometric determination of vanadium in natural waters. J. Anal. Chem. 2015, 70, 962–966. [Google Scholar] [CrossRef]
  20. Singh, S.; Nivedita, A.; Parveen, R.; Rajesh, A.; Vikas, K. Molecular dynamics, biological study and extractive spectrophotometric determination of vanadium (V)-2-methyl-8-quinolinol complex. Iran. J. Chem. Chem. Eng. 2021, 40, 207–214. [Google Scholar] [CrossRef]
  21. Pillai, S.G.; Dwivedi, A.H.; Patni, N. Liquid-liquid extraction and spectrophotometric determination of vanadium(V) with p-carboxy-n-phenyl-calix[4]resorcinarene-hydroxamic acid. Procedia Eng. 2013, 51, 347–354. [Google Scholar] [CrossRef]
  22. Hristov, D.; Milcheva, N.; Gavazov, K. Extraction-chromogenic systems for vanadium(V) based on azo dyes and xylometazoline hydrochloride. Acta Chim. Slov. 2019, 66, 987–994. [Google Scholar] [CrossRef] [PubMed]
  23. Kirova, G.K.; Velkova, Z.Y.; Delchev, V.B.; Gavazov, K.B. Vanadium-Containing Anionic Chelate for Spectrophotometric Determination of Hydroxyzine Hydrochloride in Pharmaceuticals. Molecules 2023, 28, 2484. [Google Scholar] [CrossRef] [PubMed]
  24. Daniel, D.S. The chemistry of tetrazolium salts. In Chemistry and Applications of Leuco Dyes; Muthyala, R., Ed.; Kluwer Academic Publishers: New York, NY, USA, 2002; pp. 207–296. [Google Scholar] [CrossRef]
  25. Gavazov, K.B.; Dimitrov, A.N.; Lekova, V.D. The use of tetrazolium salts in inorganic analysis. Russ. Chem. Rev. 2007, 76, 169–179. [Google Scholar] [CrossRef]
  26. Creanga, D.; Nadejde, C. Molecular modelling and spectral investigation of some triphenyltetrazolium chloride derivatives. Chem. Pap. 2014, 68, 260–271. [Google Scholar] [CrossRef]
  27. Voitekhovich, S.V.; Lesnyak, V.; Gaponik, N.; Eychmüller, A. Tetrazoles: Unique Capping Ligands and Precursors for Nanostructured Materials. Small 2015, 11, 5728–5739. [Google Scholar] [CrossRef]
  28. Penev, K.I.; Wang, M.; Mequanint, K. Tetrazolium salt monomers for gel dosimetry I: Principles. J. Phys. Conf. Ser. 2017, 847, 012048. [Google Scholar] [CrossRef]
  29. Li, X.; Deng, S.; Lin, T.; Xie, X.; Xu, X. Inhibition action of triazolyl blue tetrazolium bromide on cold rolled steel corrosion in three chlorinated acetic acids. J. Mol. Liq. 2019, 274, 77–89. [Google Scholar] [CrossRef]
  30. Bakheit, A.H.; Ghabbour, H.A.; Hussain, H.; Al-Salahi, R.; Ali, E.A.; Mostafa, G.A.E. Synthesis and computational and X-ray structure of 2,3,5-triphenyl tetrazolium, 5-ethyl-5-phenylbarbituric acid salt. Crystals 2022, 12, 1706. [Google Scholar] [CrossRef]
  31. Dawi, E.A.; Mustafa, E.; Padervand, M.; Ashames, A.; Hajiahmadi, S.; Saleem, L.; Baghernejad, M.; Nur, O.; Willander, M. Ag/AgCl decorated ionic liquid@tantalum pentoxide nanostructures: Fabrication, photocatalytic activity, and cytotoxicity effects against human brain tumor cells. J. Inorg. Organomet. Polym. 2023. [Google Scholar] [CrossRef]
  32. Gavazov, K.B.; Toncheva, G.K. Ion-association between some ditetrazolium cations and anions originated from 4-(2-thiazolylazo)resorcinol or 4-(2-pyridylazo)resorcinol. Russ. J. Gen. Chem. 2015, 85, 192–197. [Google Scholar] [CrossRef]
  33. Alexandrov, A.; Simeonova, Z.; Kamburova, M. A relationship between association constants and the molecular mass of tetrazolium ion association complexes. Bulg. Chem. Commun. 1990, 23, 542–544. [Google Scholar]
  34. Yuzhakov, V.I. Association of dye molecules and its spectroscopic manifestation. Russ. Chem. Rev. 1979, 48, 1076–1091. [Google Scholar] [CrossRef]
  35. Konermann, L. Addressing a common misconception: Ammonium acetate as neutral pH “buffer” for native electrospray mass spectrometry. J. Am. Soc. Mass Spectrom. 2017, 28, 1827–1835. [Google Scholar] [CrossRef] [PubMed]
  36. Zhiming, Z.; Dongsten, M.; Cunxiao, Y. Mobile equilibrium method for determining composition and stability constant of coordination compounds of the form MmRn. J. Rare Earths 1997, 15, 216–219. [Google Scholar]
  37. Galan, T.R.; Ramirez, A.A.; Ceba, M.R. A new spectrophotometric method for differentiating mononuclear and polynuclear complexes and for determining their extraction constants. Talanta 1980, 27, 545–547. [Google Scholar] [CrossRef]
  38. Job, P. Recherches sur la formation de complexes minéraux en solution, et sur leur stabilité. Ann. Chim. 1928, 9, 113–134. [Google Scholar]
  39. Klausen, K.S.; Langmyhr, F.J. The use of the method of continuous variation for the classification of complexes with mole ratio 1:1. Anal. Chim. Acta 1963, 28, 335–340. [Google Scholar] [CrossRef]
  40. Asmus, E. Eine neue Methode zur Ermittlung der Zusammensetzung schwacher Komplexe (A new method for the determination of composition of weak complexes). Fresenius’ J. Anal. Chem. 1960, 178, 104–116. [Google Scholar] [CrossRef]
  41. Bent, H.E.; French, C.L. The structure of ferric thiocyanate and its dissociation in aqueous solution. J. Am. Chem. Soc. 1941, 63, 568–572. [Google Scholar] [CrossRef]
  42. Sayago, A.; Boccio, M.; Asuero, A.G. Continuous variation data: 1:1 or 2:2 weak complexes? Int. J. Pharm. 2005, 295, 29–34. [Google Scholar] [CrossRef]
  43. Gavazov, K.B.; Toncheva, G.K.; Delchev, V.B. An extraction-chromogenic system for vanadium(IV,V) based on 2,3-dihydroxynaphtahlene. Open Chem. 2016, 14, 197–205. [Google Scholar] [CrossRef]
  44. Gavazov, K.B.; Delchev, V.B.; Mileva, K.T.; Stefanova, T.S.; Toncheva, G.K. A 2:2:2 complex of vanadium(V) with 4-(2-thiazolylazo)orcinol and 2,3,5-triphenyl-2H-tetrazolium chloride. Acta Chim. Slov. 2016, 63, 392–398. [Google Scholar] [CrossRef] [PubMed]
  45. Gavazov, K.B.; Stefanova, T.S. Liquid-liquid extraction-spectrophotometric investigations of three ternary complexes of vanadium. Croat. Chem. Acta 2014, 87, 233–240. [Google Scholar] [CrossRef]
  46. Tôei, K. Ion-association reagents. A review. Anal. Sci. 1987, 3, 479–488. [Google Scholar] [CrossRef]
  47. Racheva, P.V.; Milcheva, N.P.; Saravanska, A.D.; Gavazov, K.B. Extraction of gallium(III) with a new azo dye in the presence or absence of xylometazoline hydrochloride. Croat. Chem. Acta 2020, 93, 159–165. [Google Scholar] [CrossRef]
  48. Racheva, P.V.; Milcheva, N.P.; Genc, F.; Gavazov, K.B. A centrifuge-less cloud point extraction-spectrophotometric determination of copper(II) using 6-hexyl-4-(2-thiazolylazo)resorcinol. Spectrochim. Acta Mol. Biomol. Spectrosc. 2021, 262, 120106. [Google Scholar] [CrossRef]
  49. Likussar, W.; Boltz, D.F. Theory of continuous variations plots and a new method for spectrophotometric determination of extraction and formation constants. Anal. Chem. 1971, 43, 1265–1272. [Google Scholar] [CrossRef]
  50. Holme, A.; Langmyhr, F.J. A modified and a new straight-line method for determining the composition of weak complexes of the form AmBn. Anal. Chim. Acta 1966, 36, 383–391. [Google Scholar] [CrossRef]
  51. Harvey, A.E.; Manning, D.L. Spectrophotometric methods of establishing empirical formulas of colored complexes in solution. J. Am. Chem. Soc. 1950, 72, 4488–4493. [Google Scholar] [CrossRef]
  52. Gjikaj, M.; Xie, T.; Brockner, W. Uncommon compounds in antimony pentachloride—Ionic liquid systems: Synthesis, crystal structure and vibrational spectra of the complexes [TPT][SbCl6] and [Cl-EMIm][SbCl6]. Z. Anorg. Allg. Chem. 2009, 635, 1036–1040. [Google Scholar] [CrossRef]
  53. Stefanova-Bahchevanska, T.; Milcheva, N.; Zaruba, S.; Andruch, V.; Delchev, V.; Simitchiev, K.; Gavazov, K. A green cloud-point extraction-chromogenic system for vanadium determination. J. Mol. Liq. 2017, 248, 135–142. [Google Scholar] [CrossRef]
  54. Mortada, W.I.; Zedan, H.E.; Khalifa, M.E. Spectrophotometric determination of trace vanadium in fresh fruit juice samples by ion pair-based surfactant-assisted microextraction procedure with solidification of floating organic drop. Spectrochim. Acta Mol. Biomol. Spectrosc. 2023, 302, 123107. [Google Scholar] [CrossRef] [PubMed]
  55. Temel, N.K.; Kuş, B.; Gürkan, R. A new ion-pair ultrasound assisted-cloud point extraction approach for determination of trace V(V) and V(IV) in edible vegetal oils and vinegar by spectrophotometry. Microchem. J. 2019, 150, 104139. [Google Scholar] [CrossRef]
  56. Peroković, V.P.; Ivšić, A.G.; Car, Ž.; Tomić, S. Synthesis of 3-hydroxy-1-(p-methoxyphenyl)-2-methylpyridine-4-one and spectrophotometric extraction studies on its complexation of vanadium(V). Croat. Chem. Acta 2014, 87, 103–109. [Google Scholar] [CrossRef]
  57. Milcheva, N.P.; Genç, F.; Racheva, P.V.; Delchev, V.B.; Andruch, V.; Gavazov, K.B. An environmentally friendly cloud point extraction–spectrophotometric determination of trace vanadium using a novel reagent. J. Mol. Liq. 2021, 334, 116086. [Google Scholar] [CrossRef]
  58. Agnihotri, R.; Agnihotri, N.; Kumar, V.; Kamal, R. Synthesis and application of 3-hydroxy-2-[3-(4-methoxyphenyl)-1-phenyl-4-pyrazolyl]-4-oxo-4h-1-benzopyran for extractive spectrophotometric determination of vanadium (V). Der Chem. Sin. 2017, 8, 158–165. [Google Scholar]
  59. Gavazov, K.B.; Lekova, V.D.; Dimitrov, A.N.; Patronov, G.I. The solvent extraction and spectrophotometric determination of vanadium(V) with 4-(2-thiazolylazo)-resorcinol and tetrazolium salts. Cent. Eur. J. Chem. 2007, 5, 257–270. [Google Scholar] [CrossRef]
  60. Khazal, H.; Mohammed, H.J.; Khazal, F. Spectrophotometric determination of trace amount of Vanadium in rise and flour using 1-[(4-antipyl azo)] 2-Naphthol as new chromogenic spectrophotometry. J. Phys. Conf. Ser. 2020, 1660, 012024. [Google Scholar] [CrossRef]
  61. Pasha, C.; Sunil, K.; Stancheva, K. Crystal violet—A new reagent used for the spectrophotometric determination of vanadium. Oxid. Commun. 2022, 45, 503–513. [Google Scholar]
  62. Gavazov, K.B.; Racheva, P.V.; Milcheva, N.P.; Divarova, V.V.; Kiradzhiyska, D.D.; Genç, F.; Saravanska, A.D. Use of a hydrophobic azo dye for the centrifuge-less cloud point extraction–spectrophotometric determination of cobalt. Molecules 2022, 27, 4725. [Google Scholar] [CrossRef]
  63. Frisch, M.J.; Trucks, G.W.; Schlegel, H.B.; Scuseria, G.E.; Robb, M.A.; Cheeseman, J.R.; Scalmani, G.; Barone, V.; Petersson, G.A.; Nakatsuji, H.; et al. Gaussian 16; Gaussian, Inc.: Wallingford, CT, USA, 2016. [Google Scholar]
  64. ChemCraft. Available online: http://www.chemcraftprog.com (accessed on 13 September 2023).
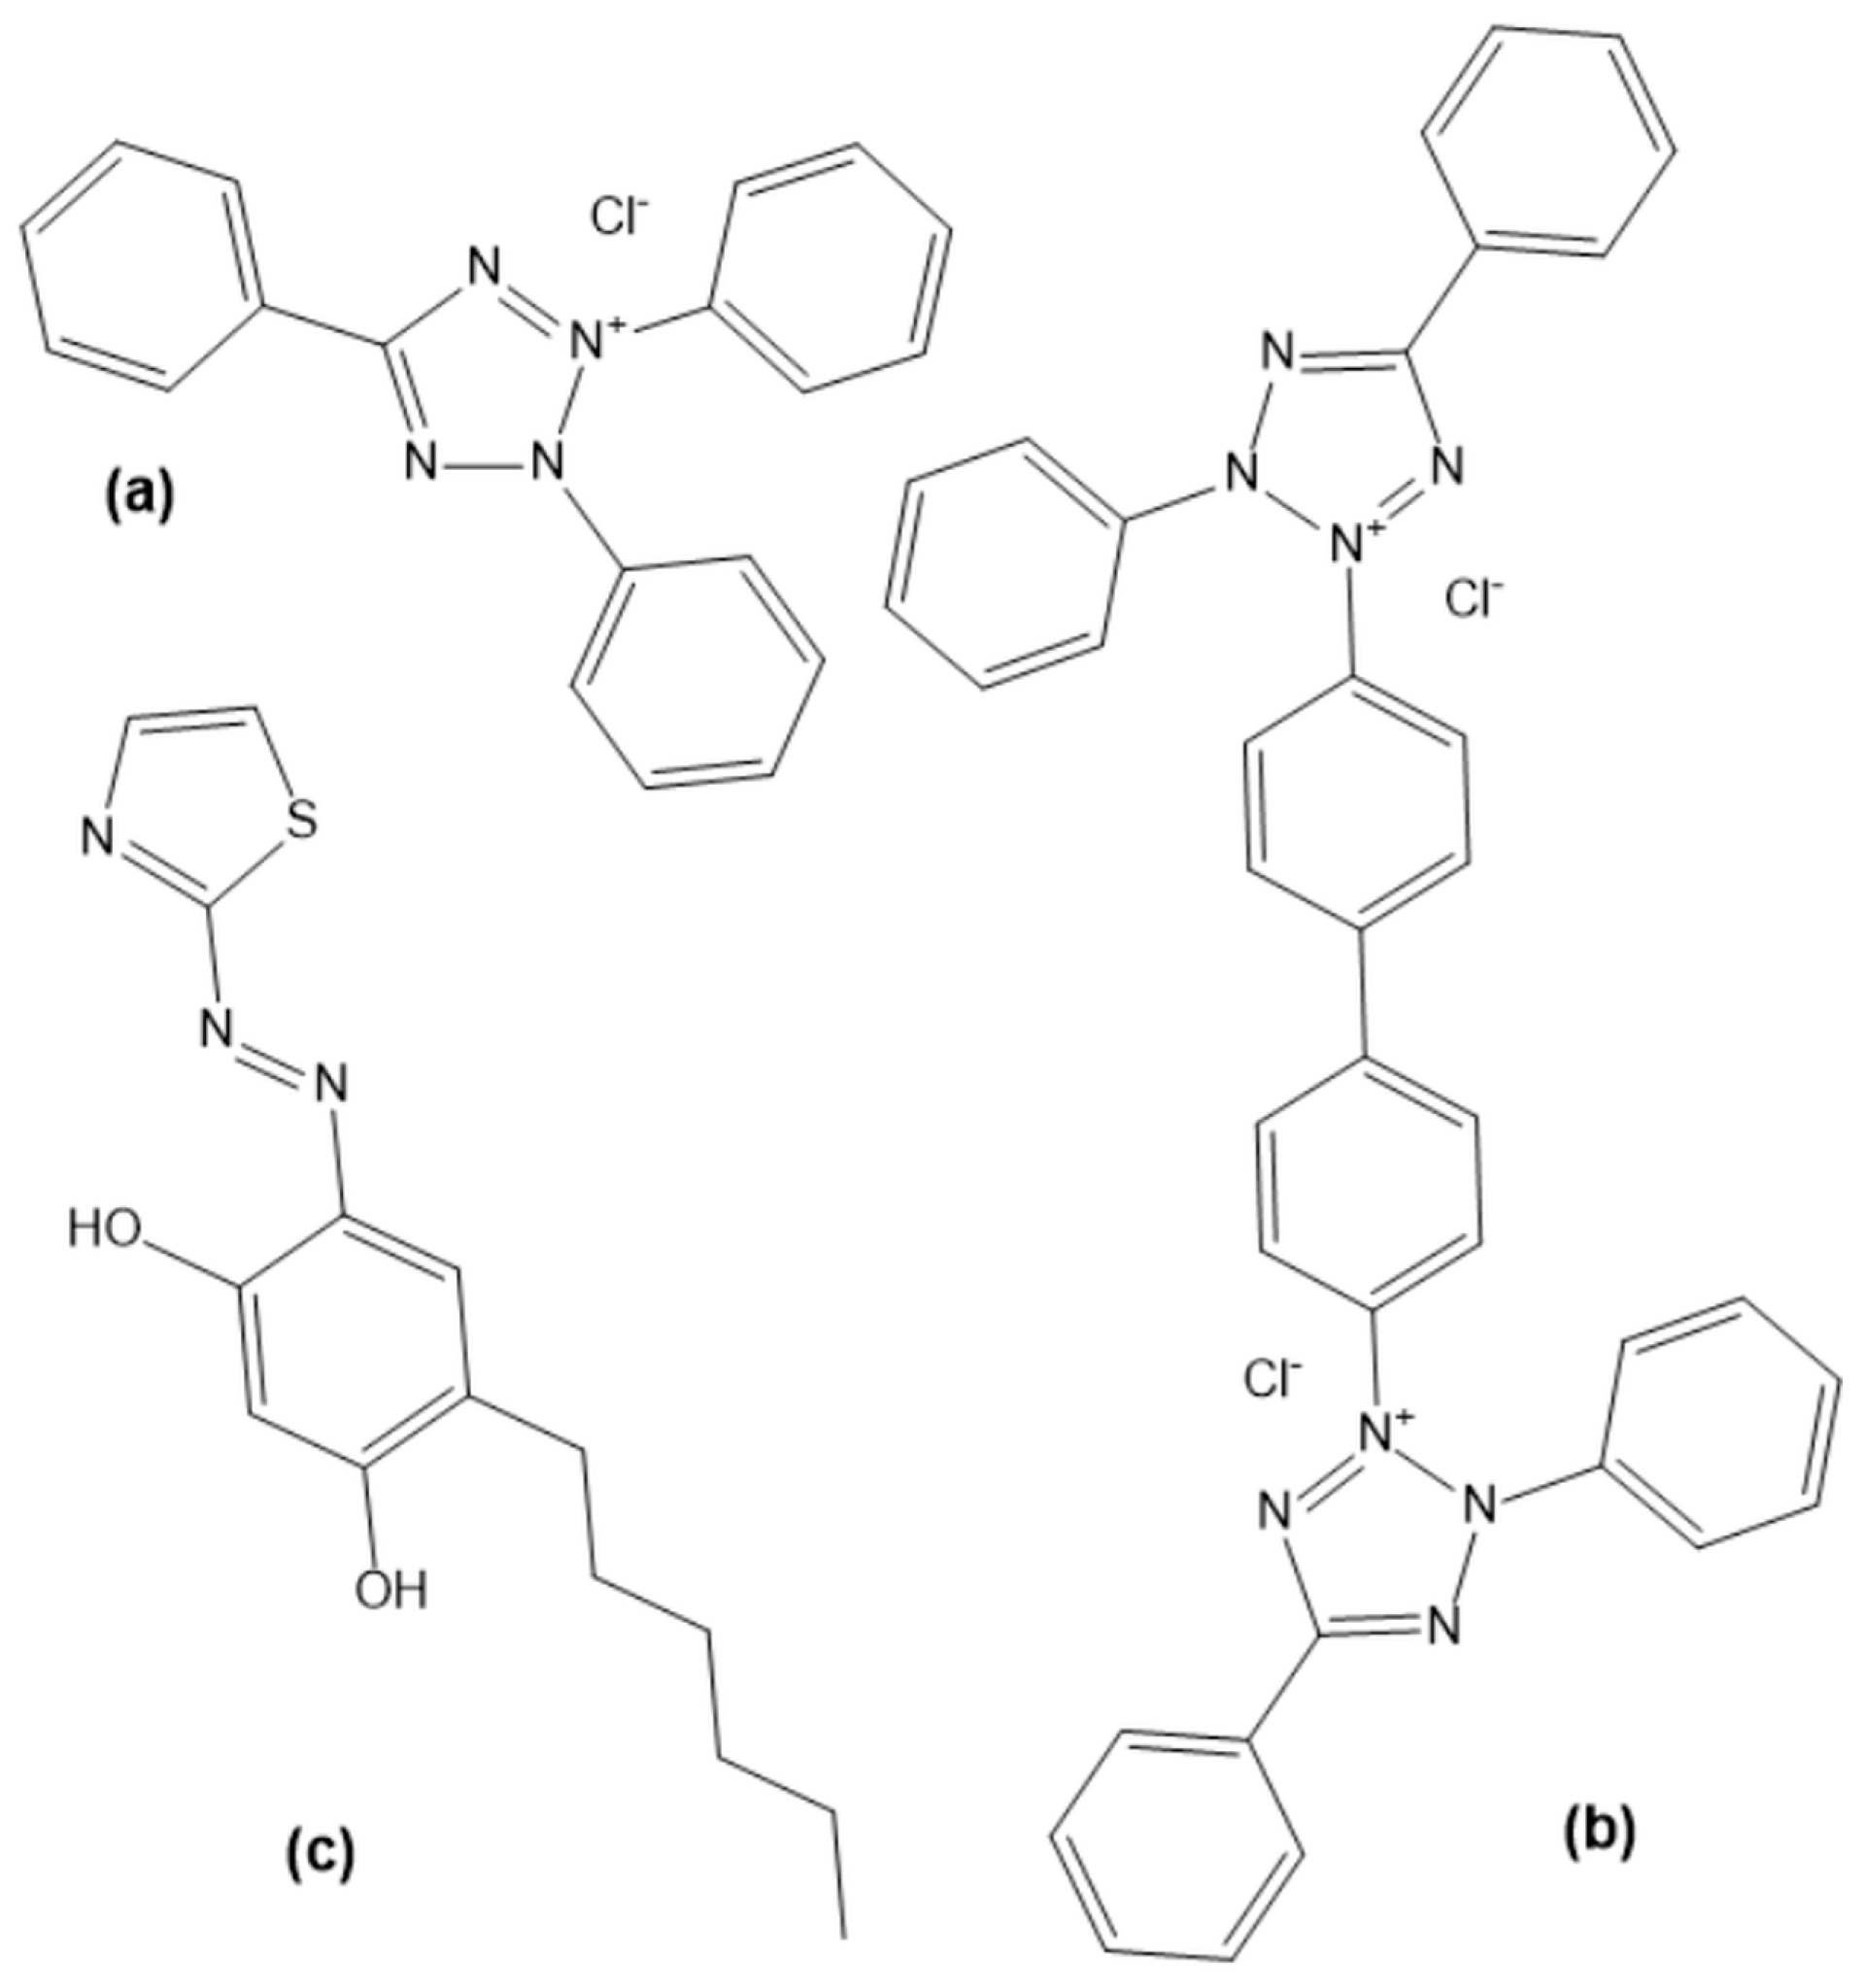
Figure 1. Structural formulae of the reagents TTC (a), NTC (b), and HTAR (c).
Molecules 28 06723 g001
Figure 2. Absorption spectra of the V(V)-HTAR-TTC complex (1) and V(V)-HTAR-NTC complex (2) against corresponding blanks. The spectra of the blanks (1′ and 2′) are recorded against chloroform. cV(V) = 2 × 10⁻⁵ mol L−1, cHTAR = 8 × 10⁻⁵ mol L−1 (1, 1′) or 4 × 10⁻⁵ mol L−1 (2, 2′), cTTC =2.4 × 10⁻⁴ mol L−1, cNTC =1.4 × 10⁻⁴ mol L−1, and pH 5.0 (ammonium acetate buffer).
Molecules 28 06723 g002
Figure 3. Absorbance of the complexes (1, 2) and blanks (1′, 2′) in chloroform vs. pH of aqueous phase. cV(V) = 2 × 10⁻⁵ mol L−1, cHTAR = 8 × 10⁻⁵ mol L−1 (1, 1′) or 4 × 10⁻⁵ mol L−1 (2, 2′), cTTC = 2.4 × 10⁻⁴ mol L−1, cNTC = 1.4 × 10⁻⁴ mol L−1, λ = 549 nm (1, 1′), or 556 nm (2, 2′).
Molecules 28 06723 g003
Figure 4. The effect of extraction time (tex). cV(V) = 2 × 10⁻⁵ mol L−1, cHTAR = 8 × 10⁻⁵ mol L−1 (1) or 4 × 10⁻⁵ mol L−1 (2), cTTC =2.4 × 10⁻⁴ mol L−1, cNTC =1.4 × 10⁻⁴ mol L−1, and pH = 4.7.
Molecules 28 06723 g004
Figure 5. The effect of HTAR concentration. cV(V) = 2 × 10⁻⁵ mol L−1, cTTC =6 × 10⁻⁴ mol L−1, cNTC =4 × 10⁻⁴ mol L−1, and pH = 5.0.
Molecules 28 06723 g005
Figure 6. The effect of TS concentration. TS = TTC (1), TS = NTC (2). cV(V) = 2 × 10⁻⁵ mol L−1, cHTAR = 1 × 10⁻⁴ mol L−1 (1) or 4 × 10⁻⁵ mol L−1 (2), and pH = 5.0.
Molecules 28 06723 g006
Figure 7. Determination of the HTAR:V(V) (a) and TTC:V(V) molar ratios in the V(V)–HTAR–TTC complex via the mobile equilibrium method. cV(V) = 2 × 10⁻⁵ mol L−1cTTC = 3 × 10⁻⁴ mol L−1 (a), and cHTAR = 8 × 10⁻⁵ mol L−1 (b).
Molecules 28 06723 g007
Figure 8. Determination of the HTAR:V(V) (a) and NTC:V(V) molar ratios in the V(V)–HTAR–NTC complex via the mobile equilibrium method. cV(V) = 2 × 10⁻⁵ mol L−1, cNTC = 4 × 10⁻⁴ mol L−1 (a), and cHTAR = 4 × 10⁻⁵ mol L−1 (b).
Molecules 28 06723 g008
Figure 9. Determination of the TTC:V(V) molar ratio in the V(V)–HTAR–TTC complex via the dilution method. cTTC = cV(V), b0 = 3 × 10⁻⁵ mol L−1, cHTAR = 8 × 10⁻⁵ mol L−1, and pH = 4.7.
Molecules 28 06723 g009
Figure 10. Job’s method of continuous variations and Likussar–Boltz approach for the determination of Kex in the V(V)—HTAR—TTC system (a) and V(V)—HTAR—NTC system (b). k = cV(V) + cTS = 4 × 10⁻⁵ mol L−1, cHTAR = 8 × 10⁻⁵ mol L−1 (a) or 4 × 10⁻⁵ mol L−1 (b), and pH = 4.7.
Molecules 28 06723 g010
Figure 11. Optimized ground-state structures of the ions: TT+ (B3LYP/6-311++G**) (a), NTC+ (B3LYP/6-31+G*) (b), and [VO2(HTAR)] (B3LYP/6-311++G**) (c).
Molecules 28 06723 g011
Figure 12. Optimized ground-state structures of the (NTC+)[VO2(HTAR)] ion-association complex at the HF/3-21G theoretical level: (a) Structure 1, E1 = −4706.2401 a.u., G1 = −4705.3824 a.u., H1 = −4705.2128 a.u.; (b) Structure 2, E2 = −4706.2345 a.u., G2 = −4705.3779 a.u., H2 = −4705.2073 a.u.
Molecules 28 06723 g012
Figure 13. Optimized ground-state structures of the (TT+)[VO2(HTAR)] monomer at the HF/3-21G theoretical level: (a) Structure M1, E1 = −3309.4733 a.u., G1 = −3308.8904 a.u., H1 = −3308.7693 a.u.; (b) Structure M2, E2 = −3309.4656 a.u., G2 = −3308.8823 a.u., H2 = −3308.7619 a.u.
Molecules 28 06723 g013
Figure 14. Optimized ground-state structures of the dimer [(TT+)[VO2(HTAR)]]2 at the HF/3-21G theoretical level: (a) Structure D1, E1 = −6618.9481 a.u., G1 = −6617.7571 a.u., H1 = −6617.5383 a.u.; (b) Structure D2, E2 = −6618.9658 a.u., G2 = −6617.7737 a.u., H2 = −6617.5555 a.u.; (c) Structure D3, E3 = −6618.9454 a.u., G3 = −6617.7531 a.u., H3 = −6617.5359 a.u.
Molecules 28 06723 g014aMolecules 28 06723 g014b
Table 1. Optimum conditions a.
Extraction Systemλmax, nmpH bcHTAR,
mol L−1
cTS,
mol L−1
Extraction Time, min
V(V)–HTAR–TTC5494.78 × 10−52.4 × 10−42.5
V(V)–HTAR–NTC5564.74 × 10−51.4 × 10−43.0
a Optimization studies conducted at room temperature (22 ± 1 °C), Vaq = 10 mL, and Vchloroform = 5 mL. b Ammonium acetate buffer (1 mL).
Table 2. Molar ratios in the ternary V(V)–HTAR–TS complexes obtained via different methods.
Molar RatioMobile Equilibrium Method [36] aDilution Method [37] aJob’s Method [38,39] bAsmus’ Method [40] cBent–French Method [41] c
HTAR:V (TS = TTC)2:21:11:1
HTAR:V (TS = NTC)1:11:11:1
TTC:V2:22:2n:n (n > 1)1:11:1
NTC:V1:1 1:11:1
a Methods applicable to complexes of the type A2B2. b A method capable of distinguishing A1B1 complexes from AnBn (n > 1) complexes. c Other methods with more limited capabilities.
Table 3. Calculated values of conditional extraction constants (Kex), distribution ratios (D), and fractions extracted (%E).
Extraction SystemLog KexLog D%E
Mobile Equilibrium Method [36] Dilution Method [37]Likussar–Boltz Method [49]Holme–Langmyhr Method [50]Harvey–Manning Method [51]
V(V)—HTAR—TTC15.2 ± 0.4 a15.8 ± 0.1 c15.2 ± 0.1 d
15.1 ± 0.1 e
1.53 ± 0.08 h 97.1 ± 0.5 h
V(V)—HTAR—NTC5.0 ± 0.1 b5.1 ± 0.1 f5.0 ± 0.1 g5.0 ± 0.1 h0.94 ± 0.14 i90 ± 3 i
a Figure 7b; b Figure 8b; c Figure 9; d Figure 10a, k = 4 × 10⁻⁵; e k = 1 × 10⁻⁴; f Figure 10b; g N = 7; h N = 3; i N = 4.
Table 4. Characteristics concerning the application of the two extraction–chromogenic systems for determining V(V).
CharacteristicsHTAR–TTC SystemHTAR–NTC System
Linear regression equation y = ax + by = 1.020x + 0.0003y = 1.018x − 0.005
Correlation coefficient0.9990 (N = 11)0.9996 (N = 8)
Standard deviations of the slope (a) and y-intercept (b)0.015 and 0.0170.012 and 0.008
Linear range, µg mL−10.015−2.00.023−1.1
Molar absorptivity coefficient (ε), L mol−1 cm−15.2 × 1045.2 × 104
Sandell’s sensitivity, ng cm−20.980.98
Limit of detection (LOD) a, ng mL−14.66.8
Limit of quantitation (LOQ) b, ng mL−11523
a Three times the standard deviation (SD) of the blank divided by the slope. b Ten times the SD of the blank divided by the slope.
Table 5. Effect of foreign ions on determining 5 μg vanadium(V).
Foreign Ion (FI) AddedAdded Salt FormulaHTAR–TTC SystemHTAR–NTC System
FI:V(V) Mass RatioAmount of V(V) Found, μgR, %FI:V(V) Mass RatioAmount of V(V) Found, μgR, %
Al(III)Al2(SO4)3·7H2O 10005.221045004.8496.7
Ba(II)Ba(NO3)22000 a4.8496.8100
1000
5.01
4.42
100
88.5
BrNaBr2000 a4.9398.62504.9398.5
Ca(II)Ca(NO3)2·4H2O2000 a5.011005004.9198.2
Cd(II)3CdSO4·8H2O5
500
5.13
5.89
103
118
50
500
5.24
4.97
105
99.4
ClNaCl10,000 a5.02100250
2000
4.81
4.58
96.3
91.6
Co(II)CoSO4·7H2O0.55.161030.55.24105
Cr(III)Cr2(SO4)344.8396.755.19104
Cr(VI)KCrO45004.8797.42504.9498.7
Cu(II)CuSO4·5H2O0.54.8496.715.10102
FNaF500
1000
4.84
4.54
96.7
90.7
2000
5000
5.02
4.40
100
88.0
Fe(III)Fe2(SO4)30.55.281060.5
10 b
50 b
5.42
5.10
5.40
108
102
108
HPO42−Na2HPO420005.021002000 a5.17103
Hg(II)Hg(NO3)105.231051005.14103
IKI10004.8496.9104.3086.1
Mg(II)MgCl210004.7394.72000 a5.06101
Mn(II)MnSO4·H2O100
500
5.04
5.32
101
106
5005.23105
Mo(VI)(NH4)6Mo7O24·4H2O2504.8897.7104.7494.9
NO3NH4NO32000 a5.1010210004.7194.4
Ni(II)NiSO4·6H2O0.55.151030.55.10102
Pb(II)Pb(NO3)2104.8196.3204.9999.8
Re(VII)NH4ReO4250
500
4.97
4.71
99.4
94.1
5
100
4.97
4.24
99.4
84.7
Tartrate2−KNaC4H4O61004.6392.61003.6372.6
V(IV)VOSO4·5H2O17.2914617.10142
W(VI)Na2WO4·2H2O14.6592.914.9198.3
Zn(II)ZnSO4·7H2O5005.061012000 a4.8396.7
a Higher FI:V(V) mass ratio not studied. b Masked by 10 mg F.
Table 6. Determination a of vanadium(V) in spent silica-supported catalysts.
CatalystVanadium Found, %RSD, %
HTAR—TTC MethodAlternative Method bHTAR—TTC MethodAlternative Method b
Sample 12.96 ± 0.072.89 ± 0.122.44.2
Sample 22.42 ± 0.062.48 ± 0.112.54.4
Sample 32.99 ± 0.083.06 ± 0.112.73.6
Sample 41.95 ± 0.042.03 ± 0.092.14.4
a Four replicate analyses (mean ± standard deviation). b Ref. [53].
Table 7. Determination a of vanadium(V) in pharmaceutical samples.
SampleV(V) Spike,
ng mL−1
V(V) Found,
ng mL−1
RSD, %R, %
Sterimar nasal spray0Not detected
2524.3 ± 1.14.597.2
5051.7 ± 1.32.5103
7573.9 ± 1.52.098.5
Marimer inhalation0Not detected
2526.3 ± 1.24.6105
5049.4 ± 1.83.698.8
7575.2 ± 2.43.2100
Solution for intravenous infusion0Not detected
2525.6 ± 0.83.1102
5050.6 ± 1.32.6101
7574.0 ± 2.33.198.6
a Three replicate analyses (mean ± standard deviation).
Table 8. Comparison with other spectrophotometric procedures.
Reagent(s)Preconcentration Techniqueλmax, nmε × 10−4,
L mol−1 cm−1
Linear Range,
μg mL−1
LOD,
ng mL−1
ApplicationRef.
APANOL5331.020.1–4.0054Rise and flour[60]
BPHALLE5300.545Up to 1.5Water samples[19]
CV + KI5881.270.1–10.2675Soil, biological, and pharmaceutical samples[61]
DTP + AminesLLE615–6202.8–3.00.05–16Soils, oil, and oil products[16]
EDTA + STUA-CPE5300.002–0.180.26Vegetal oils and vinegar[55]
HPMEPBLLE4152.7Up to 2.279.2Synthetic and
technical samples
[58]
MQLLE4000.2449Up to 6.2168[20]
PCNPC4RAHALLE4950.5540.137–9.368.89Steels, environmental and biological samples[21]
PG + STUA-CPE5330.002–0.50.58Beverage samples[17]
TA + CTABDLLME-SFOD6000.006–11.8Fruit juice samples[54]
TAN + H2O2MA-CPE6078.84Up to 0.761.4Mineral water, pharmaceutical, and industrial samples[53]
HTAR + NTCLLE5565.20.023–1.16.8This work
HTAR + TTCLLE5495.20.015–2.04.6Catalysts and pharmaceuticalsThis work
Abbreviations: APANOL, 1-[(4-Antipylazo)]-2-naphthol; BPHA, N-benzoyl-N-phenylhydroxylamine; CTAB, cetyltrimethylammonium bromide; CV, crystal violet; DTP, 2,6-Dithiolphenol; DLLME-SFOD, dispersive liquid–liquid microextraction based on solidified floated organic drop; EDTA, ethylenediaminetetraacetic acid; HPMEPB, 3-Hydroxy-2-[3-(4-methoxyphenyl)-1-phenyl-4-pyrazolyl]-4-oxo-4H-1-benzopyran; LLE, liquid–liquid extraction; MA-CPE, microwave-assisted cloud point extraction; MQ, 2-Methyl-8-quinolinol; PCNPC4RAHA, p-Carboxy-N-phenyl-calix [4]resorcinarene-hydroxamic acid; PG, pyrogallol; ST, safranin T; TA, tannic acid; TAN, 1-(2-thiazolylazo)-2-naphthol; UA-CPE, ultrasound-assisted cloud point extraction.
Disclaimer/Publisher’s Note: The statements, opinions and data contained in all publications are solely those of the individual author(s) and contributor(s) and not of MDPI and/or the editor(s). MDPI and/or the editor(s) disclaim responsibility for any injury to people or property resulting from any ideas, methods, instructions or products referred to in the content.