Article

In Vitro and In Vivo Anti-Aging Effect of Coffee Berry Nanoliposomes

by
Nisakorn Saewan
1,2,*,
Ampa Jimtaisong
1,2,
Nattakan Panyachariwat
1,2 and
Phanuphong Chaiwut
1,3
1
School of Cosmetic Science, Mae Fah Luang University, 333, Moo.1, Thasud, Muang, Chiang Rai 57100, Thailand
2
Cosmetic and Beauty Innovations for Sustainable Development (CBIS) Research Group, Mae Fah Luang University, 333, Moo.1, Thasud, Muang, Chiang Rai 57100, Thailand
3
Green Cosmetic Technology Research Group, Mae Fah Luang University, 333, Moo.1, Thasud, Muang, Chiang Rai 57100, Thailand
*
Author to whom correspondence should be addressed.
Molecules 2023, 28(19), 6830; https://doi.org/10.3390/molecules28196830
Submission received: 8 August 2023 / Revised: 19 September 2023 / Accepted: 20 September 2023 / Published: 27 September 2023

Abstract

:
Encapsulation of bioactive compounds in the liposome system provides several advantages, such as enhancing the stability and lowering the toxicity of active compounds. Coffee berry extract (CBE) has previously been established to have in vitro anti-aging properties and to retard the aging of human skin. The purposes of this study were to encapsulate CBE in nanoliposomes and to assess its stability and in vitro anti-aging potential in human dermal fibroblasts (HDF), as well as in healthy human skin. In the HDF model, anti-aging potential was determined by nitric oxide (NO) and collagenase inhibition assays and a superoxide dismutase (SOD) activity assay, whereas in healthy human skin (in vivo), the skin elasticity and brightness were examined. First, liposomal CBE (L-CBE) was created with a particle size of 117.33 ± 2.91 nm, a polydispersity index (PDI) of 0.36 ± 0.03, and a zeta potential of −56.13 ± 1.87 mV. The percentages of encapsulation efficacy (%EE) and loading efficacy (%LE) were 71.26 ± 3.12% and 2.18 ± 0.18%, respectively. After undergoing a 12-week stability test, the L-CBE retained more phenolic content than the free CBE when stored at 4 °C, room temperature, and 45 °C. Compared to free CBE, the L-CBE demonstrated a more consistent, elevated, and prolonged release of phenolics from the lipid system. In human dermal fibroblasts, L-CBE showed lower toxicity, and at its maximum nontoxic concentration (10 mg/mL), it exhibited slightly higher anti-aging effects than CBE, including NO inhibition, enhanced SOD activity, and anti-collagenase activities. In clinical trials (30 volunteer subjects), none of the participants’ skin was irritated when the L-CBE, the CBE, or base creams were applied. After 2 weeks of application, the L-CBE and CBE creams both demonstrated an improvement in skin elasticity and a reduction in melanin levels, and after 4 weeks, L-CBE cream showed a significantly greater improvement in skin elasticity and lightening. The results demonstrate that the encapsulation of the CBE in liposomal systems could increase its stability and skin penetration, reduce its toxicity, and maintain its anti-aging effect, which is powerful enough to be exploited in anti-aging and whitening agents for application in cosmetics and cosmeceuticals.

1. Introduction

Aging is a complex biological phenomenon characterized by a gradual and ongoing decline in cellular and organismal functionality over the course of a lifetime. This process ultimately leads to senescence, which is influenced by both extrinsic and intrinsic aging. Signs of aging encompass several manifestations, such as hyperpigmentation, diminished skin elasticity and laxity, the presence of fine lines and wrinkles, telangiectasia, uneven skin texture, enlarged pores, periorbital puffiness, keratosis, and additional related indicators [1]. Several research investigations have been conducted globally in the search for active substances that possess the capacity to inhibit and decelerate the manifestations of aging on the skin. Plant extracts are widely utilized in anti-aging cosmetics due to their antioxidant, immunostimulant, radical scavenging, and UV protection qualities, in addition to other functions [1,2].
The coffee berry, which is the fruit of the coffee plant, exhibits a spherical shape and displays colors of crimson and purple when fully ripe. Each individual coffee berry often consists of a pair of seeds, referred to as green beans or green coffee beans due to their characteristic green coloration [3]. The coffee husk and pulp are discarded as waste during the coffee production process, prior to the subsequent roasting phase that imparts the characteristic aroma of coffee, a widely consumed beverage worldwide. Based on the existing literature, it has been established that certain components of the coffee berry fruit have anti-aging properties. The entire fruit exhibits considerable potential for use in formulations aimed at counteracting the effects of aging. In a recent investigation, we found that CBE had a high phenolic content and good antioxidant activity in terms of ferric reducing antioxidant power, 1,1-diphenyl-2-picrylhydrazyl radical (DPPH) radical scavenging, NO and collagenase inhibition, and enhanced SOD activities [4,5]. McDaniel found that using 1% and 0.1% CBE in cream and cleanser, respectively, twice a day improved the skin’s appearance, fine lines and wrinkles, roughness and dryness, and pigmentation. The application of the items reduced collagenase (MMP-1) and IL-1 (inflammatory mediators in skin biopsies), and also increased collagen type I and collagen type IV [6]. Caffeine and chlorogenic acid, among other antioxidant and prooxidant chemicals, are abundant in coffee [7]. Caffeine is an antioxidant that suppresses lipid peroxidation, protects cells from free radical damage, enhances cell oxygenation and microcirculation, and accelerates cell metabolism [8,9]. It is mostly used in hair care cosmetics to prevent hair loss and stimulate new and healthy hair growth by inhibiting the 5-alpha-reductase enzyme [10,11,12]. It also provides skin anti-aging properties, including enhanced keratinocyte cell proliferation and inhibited collagenase activity [4]. Chlorogenic acid is an active polyphenol with anti-inflammatory, antioxidant, and antimicrobial effects [13,14]. It has antioxidant activity which promotes collagen and elastin fiber in skin fibroblasts, providing anti-inflammatory and wound-healing effects that are linked to their ability to slow the signs of aging on the skin [15,16,17,18].
Liposomes are drug delivery systems in the form of spherical vesicles which consist of a phospholipid bilayer membrane. Liposomes provide several advantages for application, such as enhancing the stability of active compounds, having good biocompatibility, and lowering toxicity in the encapsulation system [19]. Moreover, liposomes have been reported as penetration enhancers for dermal and transdermal delivery, resulting in an increased level of efficacy and therapeutic index [20]. The encapsulated molecules in liposomes are better absorbed in the skin and penetrate the stratum corneum through intercellular spaces [21]. Liposomes can be created using natural phospholipids and derived phospholipids with mixed lipid chains. Egg and soybean phosphatidylcholine are most commonly used. Due to being water-insoluble, phosphotidylcholine molecules create bilayer-shaped planner sheets that lessen the unfavorable reaction between long fatty chains of hydrocarbon and the excessive water phase [22]. Other essential elements of more stable liposomes are steroids, such as cholesterol or its derivatives. The primary steroid typically employed in liposome synthesis is cholesterol, which has the effect of decreasing membranous permeability towards hydrophilic molecules, enhancing the fluidity of the phospholipid bilayer, and increasing the stability of the bilayer in the biological environment [23,24]. Liposomes of green coffee and medium-roasted coffee extracts have been separately prepared and have strong antioxidant properties [25]. In another study, spent coffee grounds maintained their antioxidant activity through the supercritical assisted liposome production method [26].
To the best of our knowledge, research on coffee liposomes has primarily concentrated only on in vitro antioxidant tests; however, the stability, skin penetration, and anti-aging benefits of coffee liposomes have not been extensively discussed in the literature. This research aims to investigate the stability, skin penetration, and in vitro anti-aging effects of L-CBE encapsulation in HDF cells and the in vivo anti-aging effect of L-CBE cream formulation in human skin. The stability of L-CBE, based on its total phenolic content, was also examined under different storage temperatures—4 °C, room temperature, and 45 °C—for 12 weeks. The anti-aging properties of the liposomes in HDF cells were investigated using assays for collagenase inhibition, superoxide dismutase activity, and nitric oxide (NO) inhibition. The anti-aging effectiveness of L-CBE in cosmetic formulation was clinically evaluated by measuring skin color (melanin content), firmness (gross elasticity (R2), net elasticity (R5), and immediate recovery elasticity (R7)).

2. Results

2.1. Determination of Chlorogenic Acid and Caffeine

Coffee is rich in biologically active alkaloids and phenolics. The well-known major bioactive constituents of coffee are caffeine and chlorogenic acid [27,28]. Therefore, in this study, the CBE was analyzed to assess the levels of chlorogenic acid and caffeine using HPLC. The chromatogram of the CBE at a UV detection wavelength of 280 nm showed two major peaks, which were identified as chlorogenic acid and caffeine at retention times of 6.127 and 6.406 min, respectively (Figure 1). The concentrations of the chlorogenic acid and the caffeine were calculated from the peak area against the standard calibration curve and showed values of 131.85 and 6.44 µg/mL, respectively.

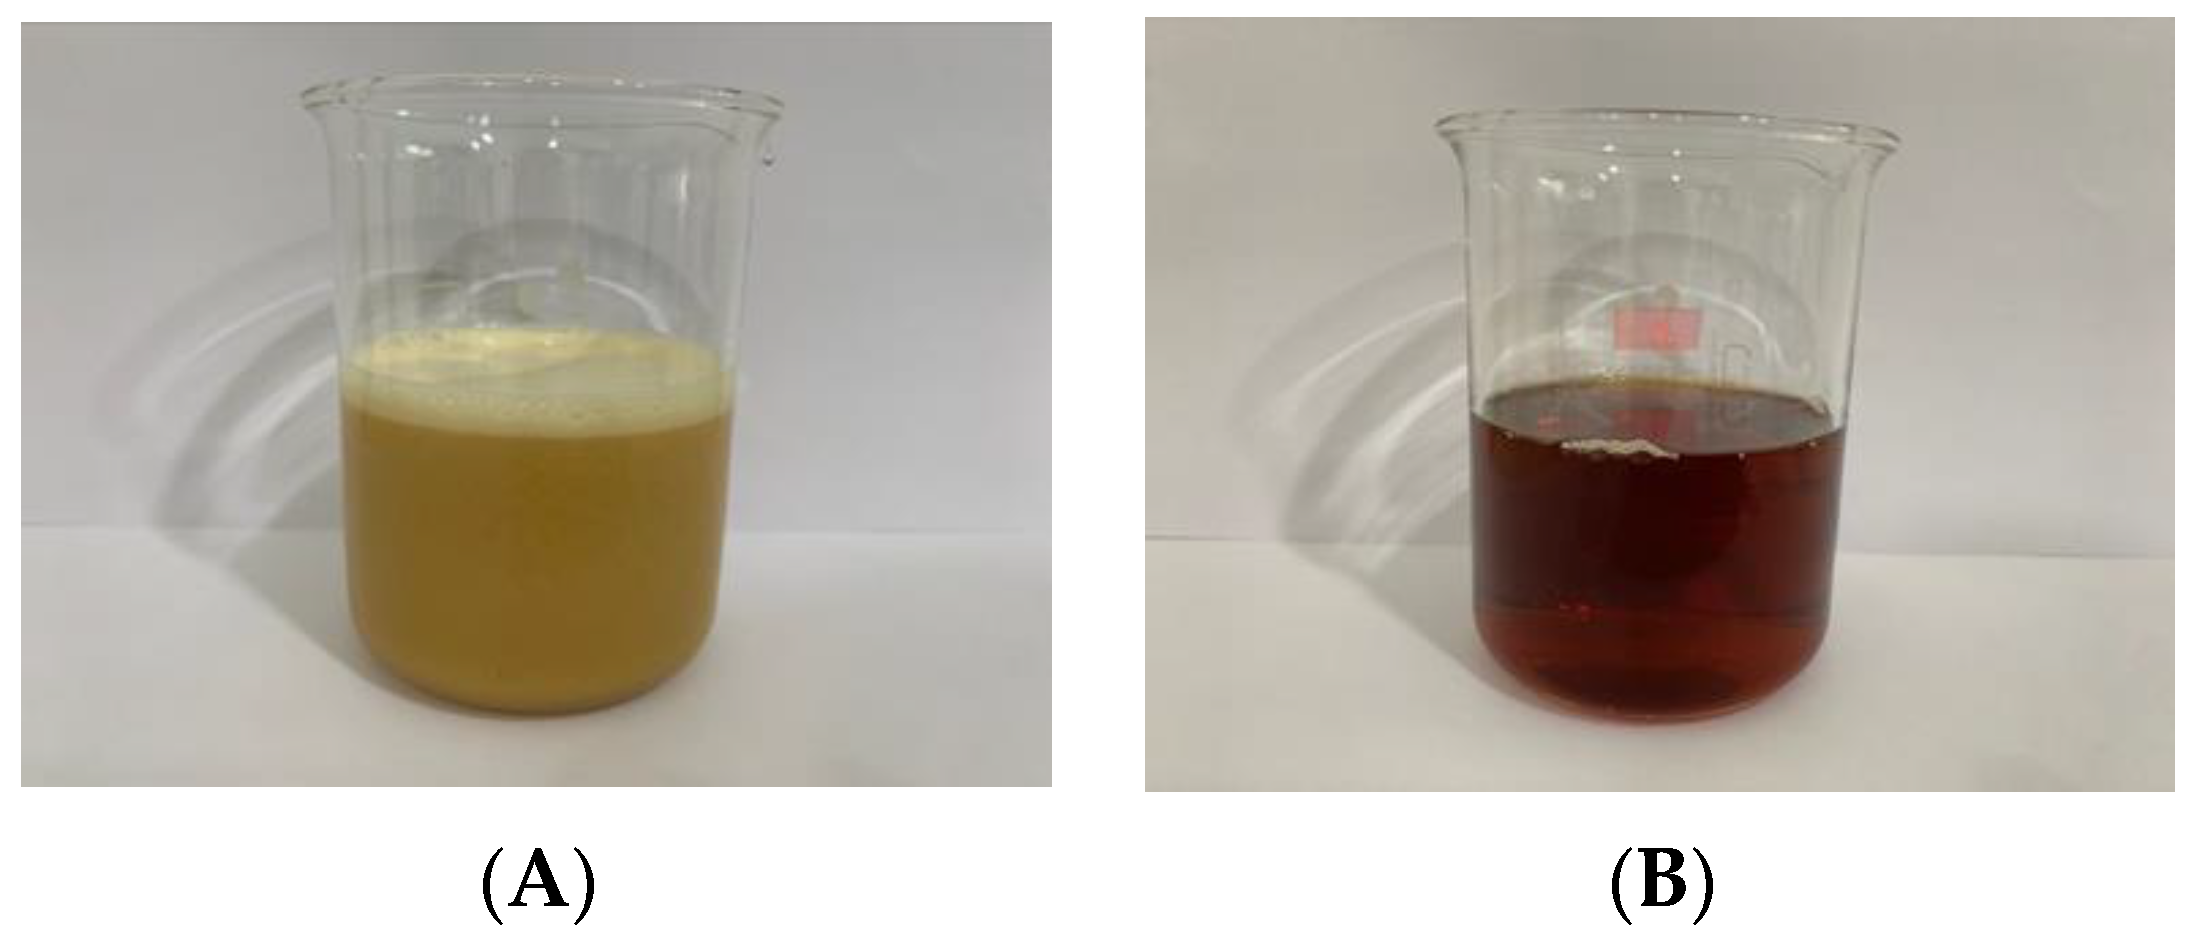
2.2. Preparation and Characterization of the Liposomal CBE

In this investigation, phosphatidylcholine and cholesterol were used as the constituents for liposome formation. Liposomes were first prepared via the film method, with a ratio of phosphotidylcholine and cholesterol of 15:1, and a light brown translucent liquid was obtained. After 5% of the CBE was encapsulated into the liposome system, the L-CBE was derived as a darker liquid. Over the course of five cycles in a microfluidizer operating at 25,000 psi, the liposomes transformed from a translucent to a transparent liquid as a result of the reduction in particle size (Figure 2).

2.2.1. Particle Size and Zeta Potential Measurement

The particle size, PDI, and zeta potential of the L-CBE was investigated by Zetasizer. Before size reduction, the particle size of the liposome was 675.26 ± 24.8 nm, which was noticeably smaller (117.33 ± 2.91 nm, monodisperse) after size reduction. A similar result was found in the preparation of the liposomes using a microfluidizer at pressures of 15,000, 15,000, and 20,000 psi for three cycles. The results indicated a decrease in particle size from an initial value of 2570 ± 2120 to 194 ± 18, 189 ± 4, and 154 ± 22 nm, respectively [29]. A study by Carugo et al. also reported that the microfluid method (1 cycle) creates reproducible liposomes containing cationic dimethyl dioctadecyl ammonium bromide with an average size of 90–150 nm [30].
The polydispersity index (PDI) is an important factor that describes the width or spread of the particle size distribution, which ranges from 0.0–1.0. A greater PDI value will result in a wider variety of particle sizes. According to Lacatusu (2012), the appropriate dispersion value must be close to 0.0 or less than 0.5 [31]. The PDI value of the prepared L-CBE was 0.36 ± 0.03, which should provide good stability by preventing coagulation and phase separation.
Zeta potential, which measures the strength of the repulsion or attraction between particles, is a key technique for assessing the physical stability of the nanocolloid system. Large positive or negative values of a nanoparticle’s zeta potential cause electrostatic repulsion between individual particles and lead to good physical stability of nanosuspensions. Normally, zeta potentials greater than +30 mV or less than −30 mV are regarded as stable [32]. The L-CBE showed a zeta potential of −56.13 ± 1.87 mV, which represented repulsion between particles providing good stability against sediment forming over time.

2.2.2. Encapsulation Efficiency and Loading Efficacy

Encapsulation efficiency (EE) is the proportion of active compounds that are successfully encapsulated in nanoparticles. It refers to the ability of the wall material to enclose the core material, which depends on several variables, including the chemical nature of the core (molecular weight, chemical functionality, polarity, and volatility), the properties of the shell material, and the technique and conditions used for preparation [33,34]. The results showed that the L-CBE yielded an EE of 71.26 ± 3.12%, slightly higher than the loading of green coffee bean extract in the liposome/polyhydroxybutyrate, which obtained 67.50% EE [35]. Loading efficiency (LE), which refers to the percentage of the bioactive ingredient present in the nanoparticle system (L-CBE), was found to be 2.18 ± 0.18%.

2.2.3. Stability Test

The stability of natural extracts in cosmetic and pharmaceutical fields is a concern due to the phytochemicals being easily decomposed, thus causing an unfavorable impact on the quality of the extract [36]. The exposure to high temperatures plays an important role in terms of polyphenol stability, particularly phenolic compounds such as chlorogenic acid, caffeic acid, and ferulic acid. Under the dual factors of light and temperature, these phenolic compounds readily decompose [37,38]. To increase the stability of active compounds under stress conditions, liposome encapsulation is one of the most widely used methods for maintenance. Thus, to evaluate the effects of various temperatures on the accelerated stability of the CBE and the L-CBE, the samples were stored at 4 °C, RT, and 45 °C for 12 weeks. After 4 weeks, the L-CBE retained phenolic contents of 98.27, 97.53, and 97.98% at 4 °C, RT, and 45 °C in storage conditions, which were higher than those of the free CBE, i.e., 97.13, 96.96, and 85.30%, respectively. At the end of the experiment (week 12), the L-CBE retained phenolic contents of 94.66, 96.45, and 89.97%, while the CBE decreased to 93.72, 87.55, and 74.49% at 4 °C, RT, and 45 °C, as displayed in Figure 3. At the low temperature of 4 °C and at ambient temperature, the retained phenolics of both samples were higher than 90%. However, at a high temperature, the retained phenolics in the free CBE quickly decreased to 75%, while that of the encapsulated CBE was about 90%. The results showed that a high temperature exhibited the greatest effect on the stability of the samples. Due to the high temperature’s degradation of the structure of the polyphenols in extract [39,40], they could be affected by their oxidation [41,42]. The evidence showed that encapsulation in liposomes could prevent the degradation of the extract under high thermal conditions. The results, also corresponding to Shariare’s work on liposome preparation by using egg phospholipids, provided significant better bioavailability and stability when compared to a single extract [43].

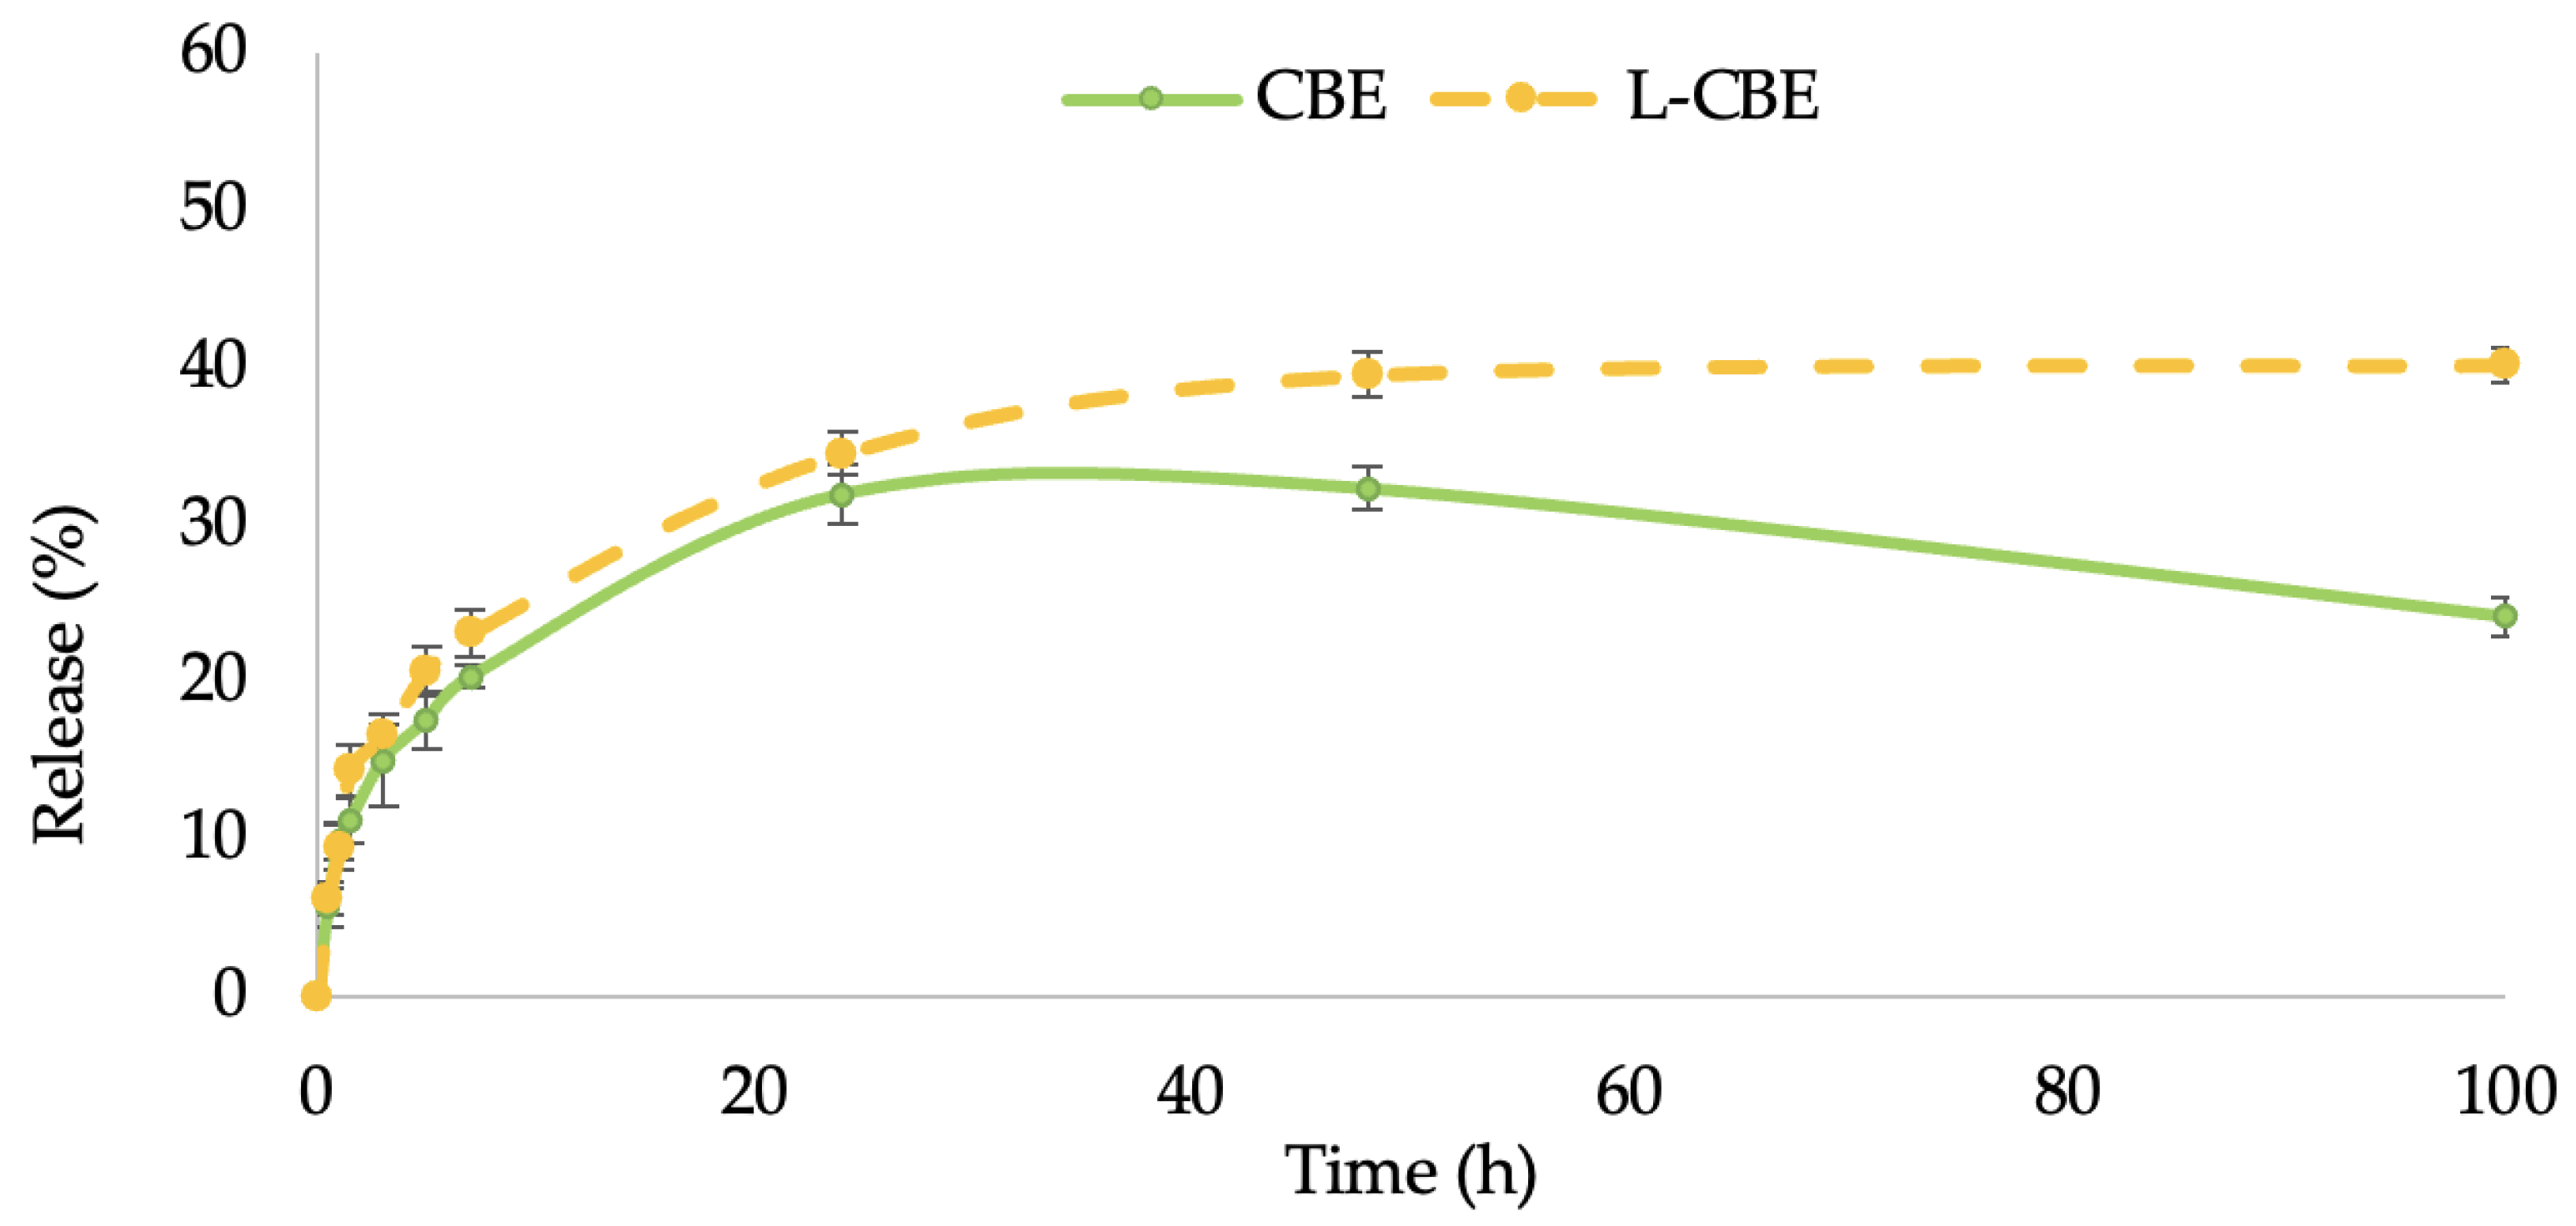
2.2.4. In Vitro Permeation Measurement
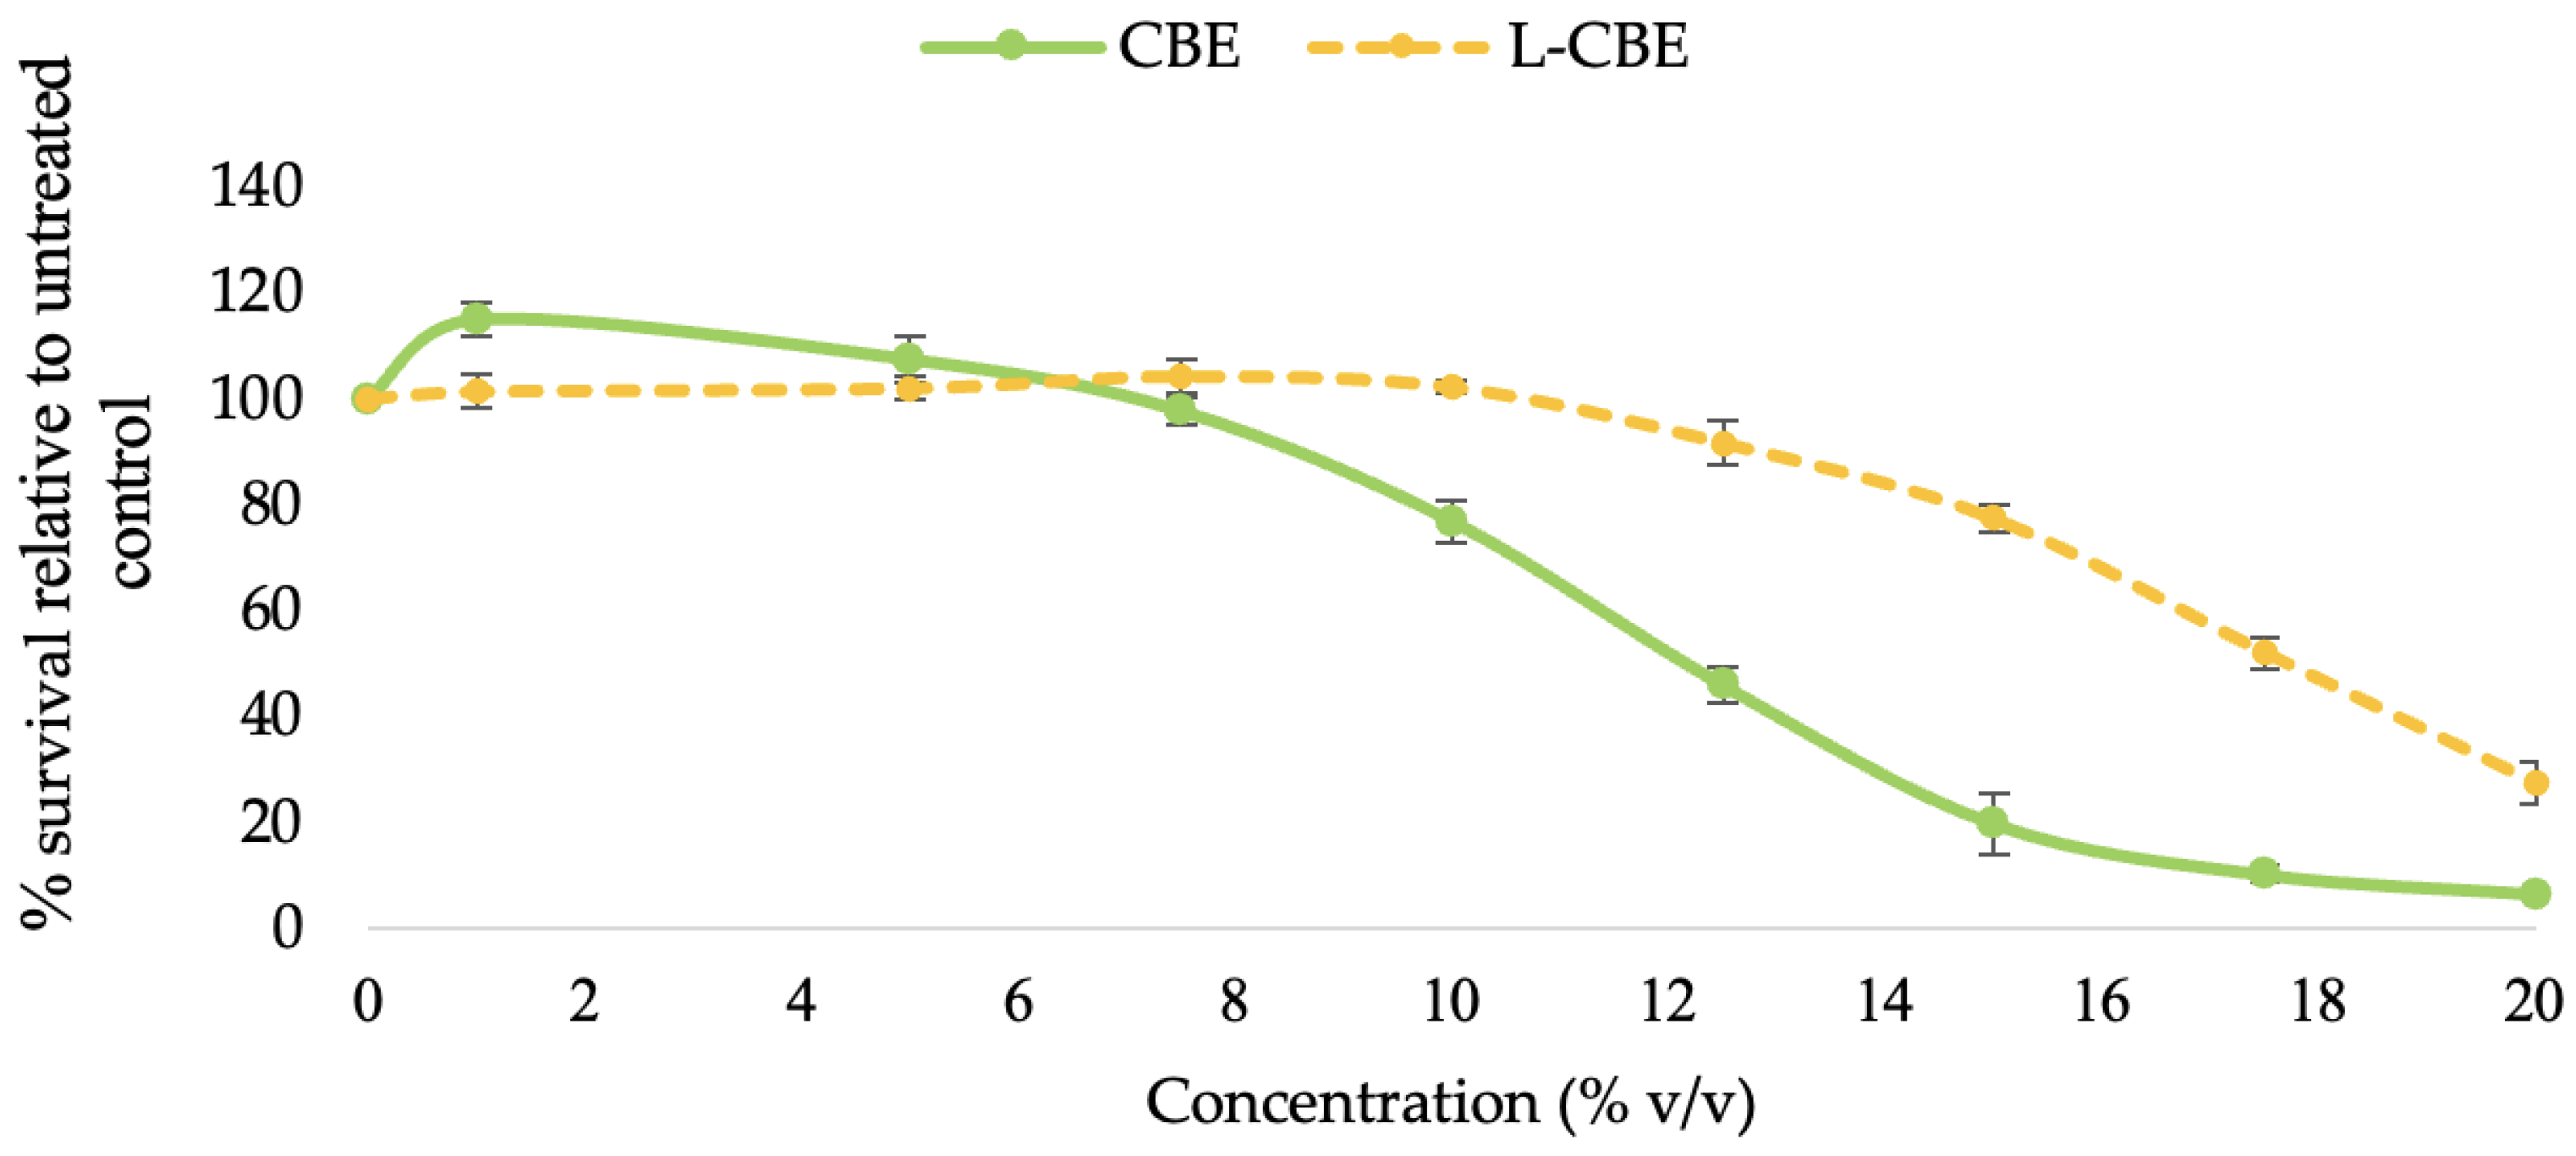
In this study, the permeation ability through the stratum corneum of the CBE-loaded liposomes in comparison to the unloaded CBE was performed by investigating the controlled release of samples through cellulose acetate membranes with a 0.45 µm pore size, which were used as barrier and release media. The release of samples from liposomes followed by permeation through the membrane to the receptor fluid was evaluated using the Franz diffusion cell. The release (%) of phenolic content from the free CBE and the CBE loading in liposomes were plotted versus time. The release rates of both samples increased quickly for the first 6 h before slowing down. Thereafter, the release rates of the CBE encapsulation in the liposomes increased gradually and steadily over the period of time, but the rate of release from the free CBE increased progressively during the first 24 h and decreased over a period of 48 to 100 h (Figure 4). Accordingly, the skin penetration of liposomes is also influenced by their size. Liposomes smaller than 300 nm can permeate deeper skin layers, while liposomes smaller than 70 nm have been found to be the most efficient size for dermal distribution. Liposomes larger than 600 nm remained on the epidermis rather than penetrating deeper layers of the skin [44]. The greater skin penetration of the L-CBE encapsulation is caused by its small particle size (117.33 nm), allowing for basic skin absorption.

2.3. Cytotoxicity

The cytotoxicity of the free CBE and the L-CBE was first assessed by subjecting samples of a range of concentration (0–20 mg/mL) to human dermal fibroblast (HDF) cells. The pattern of cytotoxicity was the same in all test samples and was dose-dependent. The CBE (≤5.0 mg/mL) and the L-CBE (≤10.0 mg/mL) showed non-cytotoxicity to HDF cells at the low dose and also boosted cell proliferation by a small amount. The viability of the cells was reduced, as expected, as the sample concentration increased (Figure 5). The CBE demonstrated 76.84% cell vitality at a dosage of 10.0 mg/mL, whereas the L-CBE had a greater cell viability of 102.19%. At higher doses (12.50 mg/mL), the L-CBE also demonstrated a higher cell vitality of 91.62%, while the CBE exhibited a low cell viability of only 45.91%. Based on dose–response data compared to the control (untreated cells), the test sample concentration would result in 50% (IC50) of the cells surviving was determined. The L-CBE had a considerably higher IC50 (17.66 ± 0.35 mg/mL) compared to the free extract (12.92 ± 0.36 mg/mL), indicating a lower level of toxicity. Therefore, the test concentrations in further experiments were set at the highest non-toxic doses of the CBE (5 mg/mL) and the L-CBE (10 mg/mL).

2.4. Anti-Aging Activities

The anti-aging efficiency levels of the samples were evaluated using three different methods: SOD activity and NO and collagenase inhibition activities. In prior research, chlorogenic acid and CBE showed potent activities in all assays, and caffeine strongly inhibited only collagenase [4,45].

2.4.1. Antioxidant Activity

SOD, the main antioxidant enzyme, catalyzes the interaction between oxygen (O2) and hydrogen peroxide (H2O2) to shield cells from the harmful effects of superoxide radicals (O2) [46]. Oxidative stress is brought on by an imbalance between the quantities of antioxidants and free radicals, which was seen in the decreased activity of SOD antioxidant enzymes [47]. SOD is a significant antioxidant found in human fibroblasts which contributes to the effect of oxidative stress on telomere shortening [48]. Additionally, encouraging SOD activity can help to minimize oxidative stress and photo-induced skin aging. To assess and examine the samples’ capacity to increase SOD antioxidant activity, a SOD determination kit that enables a practical assay by creating a water-soluble formazan dye upon reduction with a superoxide anion was utilized. Since SOD inhibits xanthine oxidase activity, decreased O2 is linearly related to that activity. As a result, the reduction in the color development of WST-1 formazan can be used to calculate the level of SOD activity. At the highest non-toxic doses of the tested samples, in comparison to the extract treatment (79.27 ± 0.96%), the liposomes’ treatment resulted in significant higher SOD activity (93.58 ± 9.45%) (Figure 6A).

2.4.2. NO Inhibition Activities

Under normal physiological circumstances, NO functions as an anti-inflammatory agent and is involved in a variety of inflammatory disorders. However, NO overproduction is regarded as a pro-inflammatory mediator that causes inflammation when conditions are abnormal [49]. Moreover, NO is also a potent immunological mediator with strong cytotoxic and wound-healing effects [50]. Therefore, a reliable method by which to identify cell inflammation is to measure NO levels. In this work, HDF was treated with test samples and the amount of NO generation in the culture medium was measured using Griess reagent. With the same trend as SOD activity, the L-CBE showed a slightly higher level of NO inhibition at 78.50 ± 3.01% in comparison to the extract (65.30 ± 3.14%) (Figure 6B). The cause of this result could be the controlled release and penetration of active ingredients from the lipid bilayer in the encapsulation system.

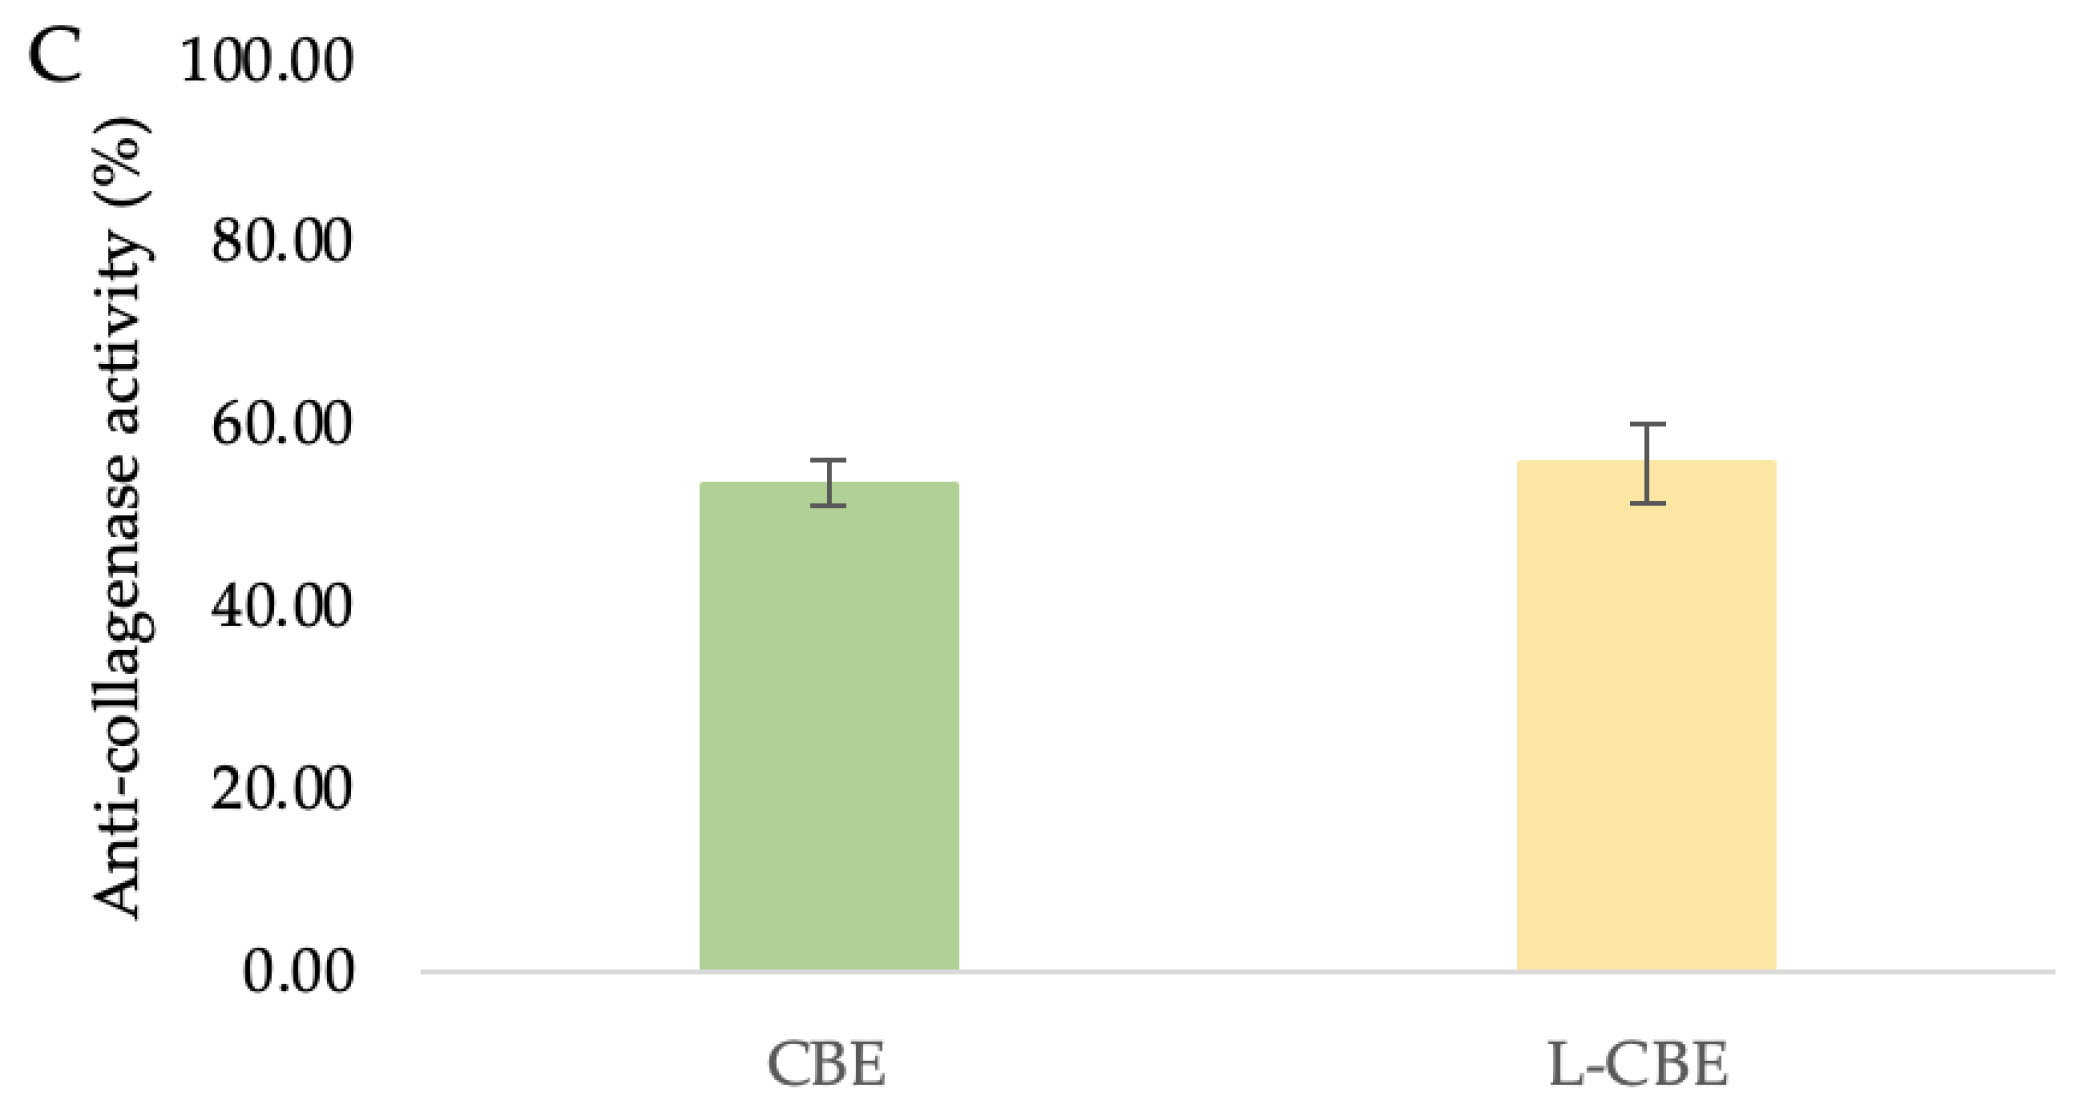
2.4.3. Anti-Collagenase Activity
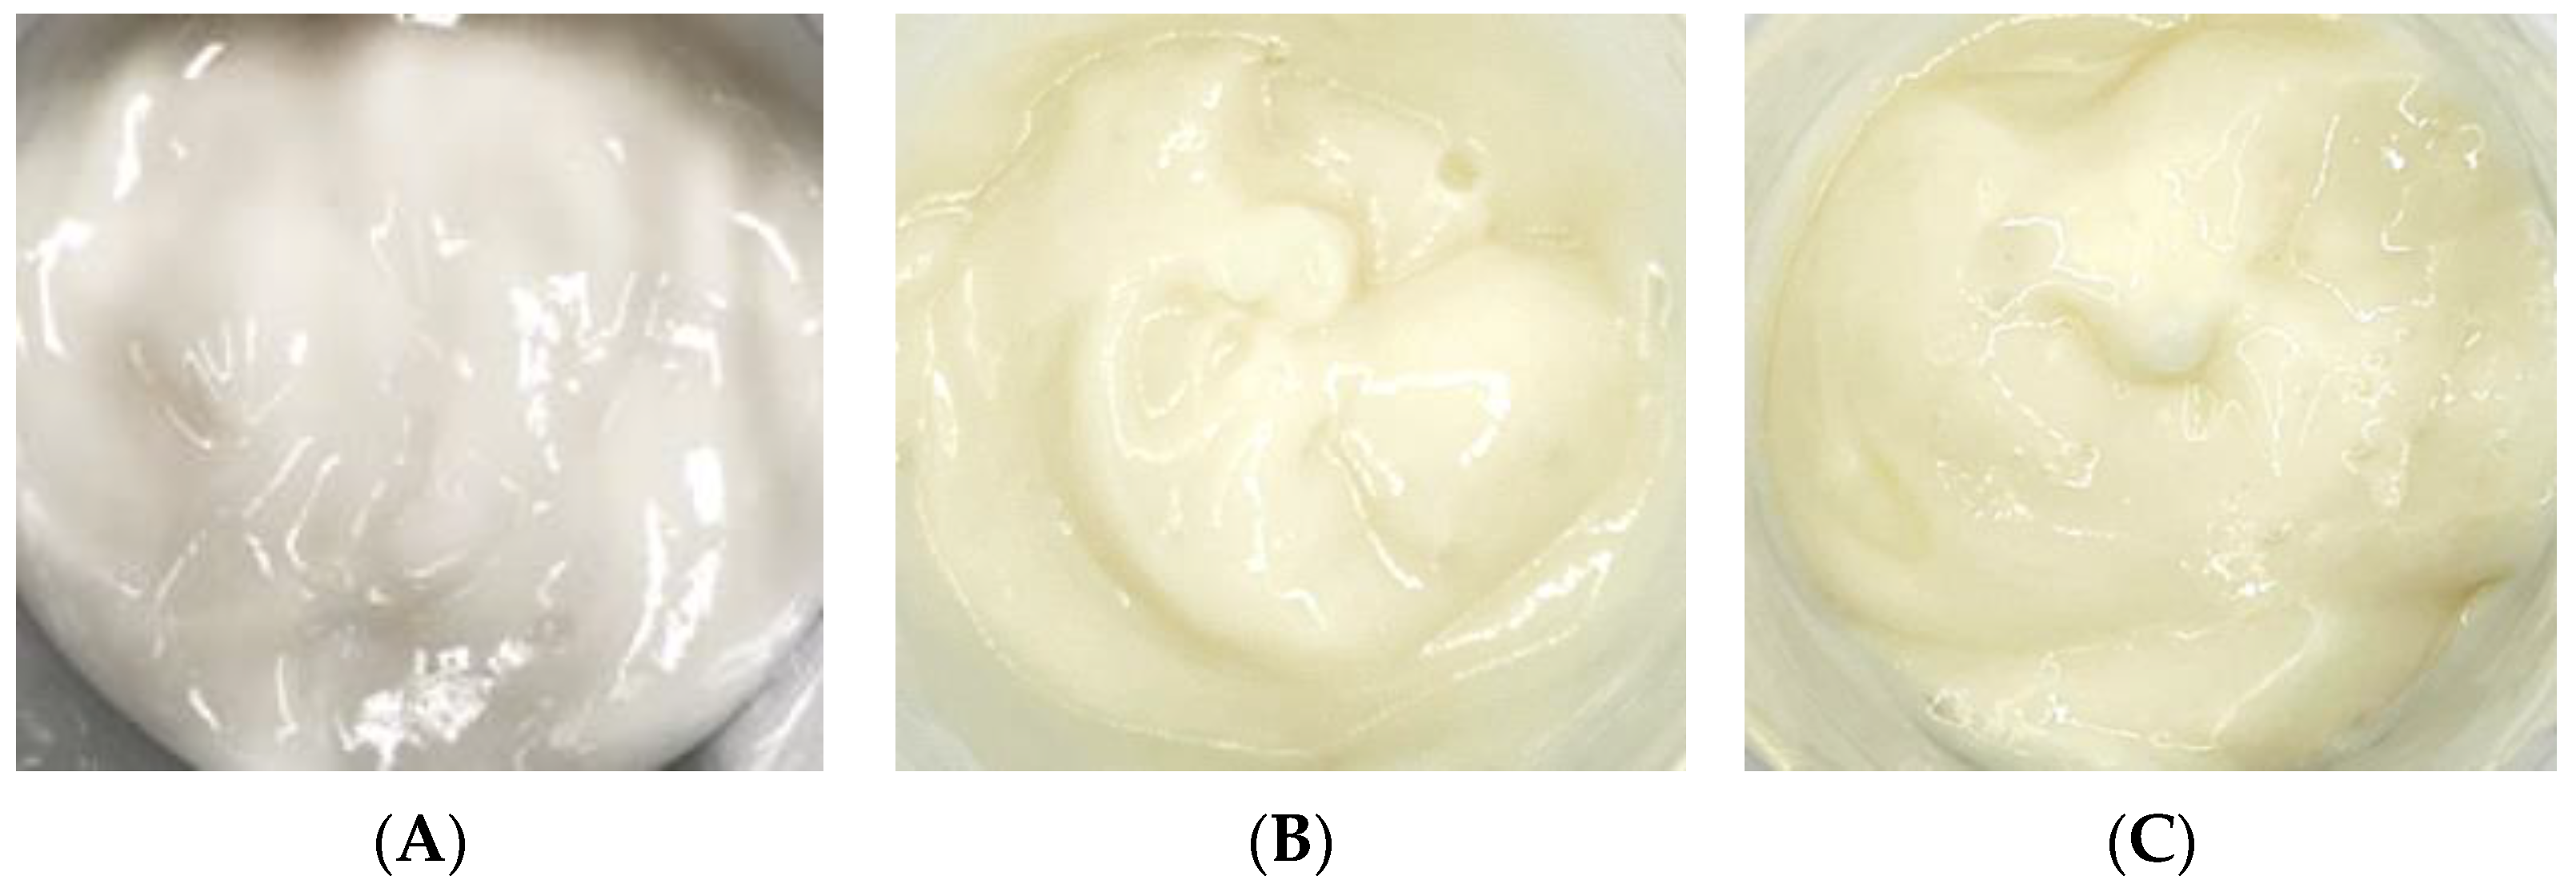
The primary causes of the clinical signs of aging skin, such as wrinkles, sagging, and laxity, indicate the degradation of interstitial collagens and changes in the extracellular matrix [51,52]. Collagenase inhibition has been suggested as a method by which to limit the advancement of drooping as well as the loss of skin elasticity [53]. Therefore, the investigation of collagenase inhibition ability is the most frequently used assay to evaluate the anti-aging benefits of various natural substances to be utilized as cosmeceutical components. In our previous study, the CBE showed the highest significant inhibition of MMP-1 at 65.88%, which was higher than its major compounds, i.e., chlorogenic acid (53.19%) and caffeine (43.47%) [45]. To investigate the collagenase inhibition activity of the CBE loading in liposomes, bioassays were performed with a member of the group of matrix metalloproteinases, MMP-1. Inhibition of collagenase by the free CBE was slightly lower (53.72 ± 2.46%) than that of the L-CBE (55.96 ± 4.45%) (Figure 6C).

2.5. Formulation

After adding the free CBE and liposome encapsulation of the CBE to an emulsion cream base as anti-aging components, both products exhibited light yellow colors, whereas the cream base (B cream) appeared as a white cream (Figure 7). The cosmetic formulation had pH values of 5.06 and 5.14 for the CBE and the liposomal CBE creams, respectively. In general, the texture, spreadability, thickness, and smoothness of both creams were noticeable. Overall, both creams were satisfactorily acceptable for topical application, with appreciable appearance, color, and texture; easy absorption; good spreadability; and non-greasiness.

2.6. Clinical Study

2.6.1. Skin Irritation Testing

The skin irritation patch test was performed on 30 volunteer subjects. The erythema and edema of all tested samples were evaluated after 30 min and after 24 h patch removal. Slight erythema on the subjects’ skin was observed where sodium lauryl sulfate had been applied, with an M.I.I value of 0.13 after the 30 min patch had been removed. However, after 24 h, it had stopped showing erythema. All tested creams and deionized water indicated that no erythema occurred with an M.I.I. of 0.00. In addition, there was no edema in any of the tested samples (M.I.I. was 0.00). The outcome was consistent with various test reports. The application of hair tonic with 10% CBE on the scalp did not irritate human skin [10]. Coffee silver skin extract demonstrated no irritancy in an in vitro test on human epidermis and in an in vivo test on subjects’ skin when patched for 48 h [54]. Amnuaikit et al. reported that the gel base formula containing 3% caffeine caused no signs of discomfort after being applied on subjects’ arms for 24 h [55]. Both coffee extract and the major compounds in coffee have also been reported for their nonirritating properties. These results revealed that creams containing coffee extract can be considered safe and did not irritate human skin.

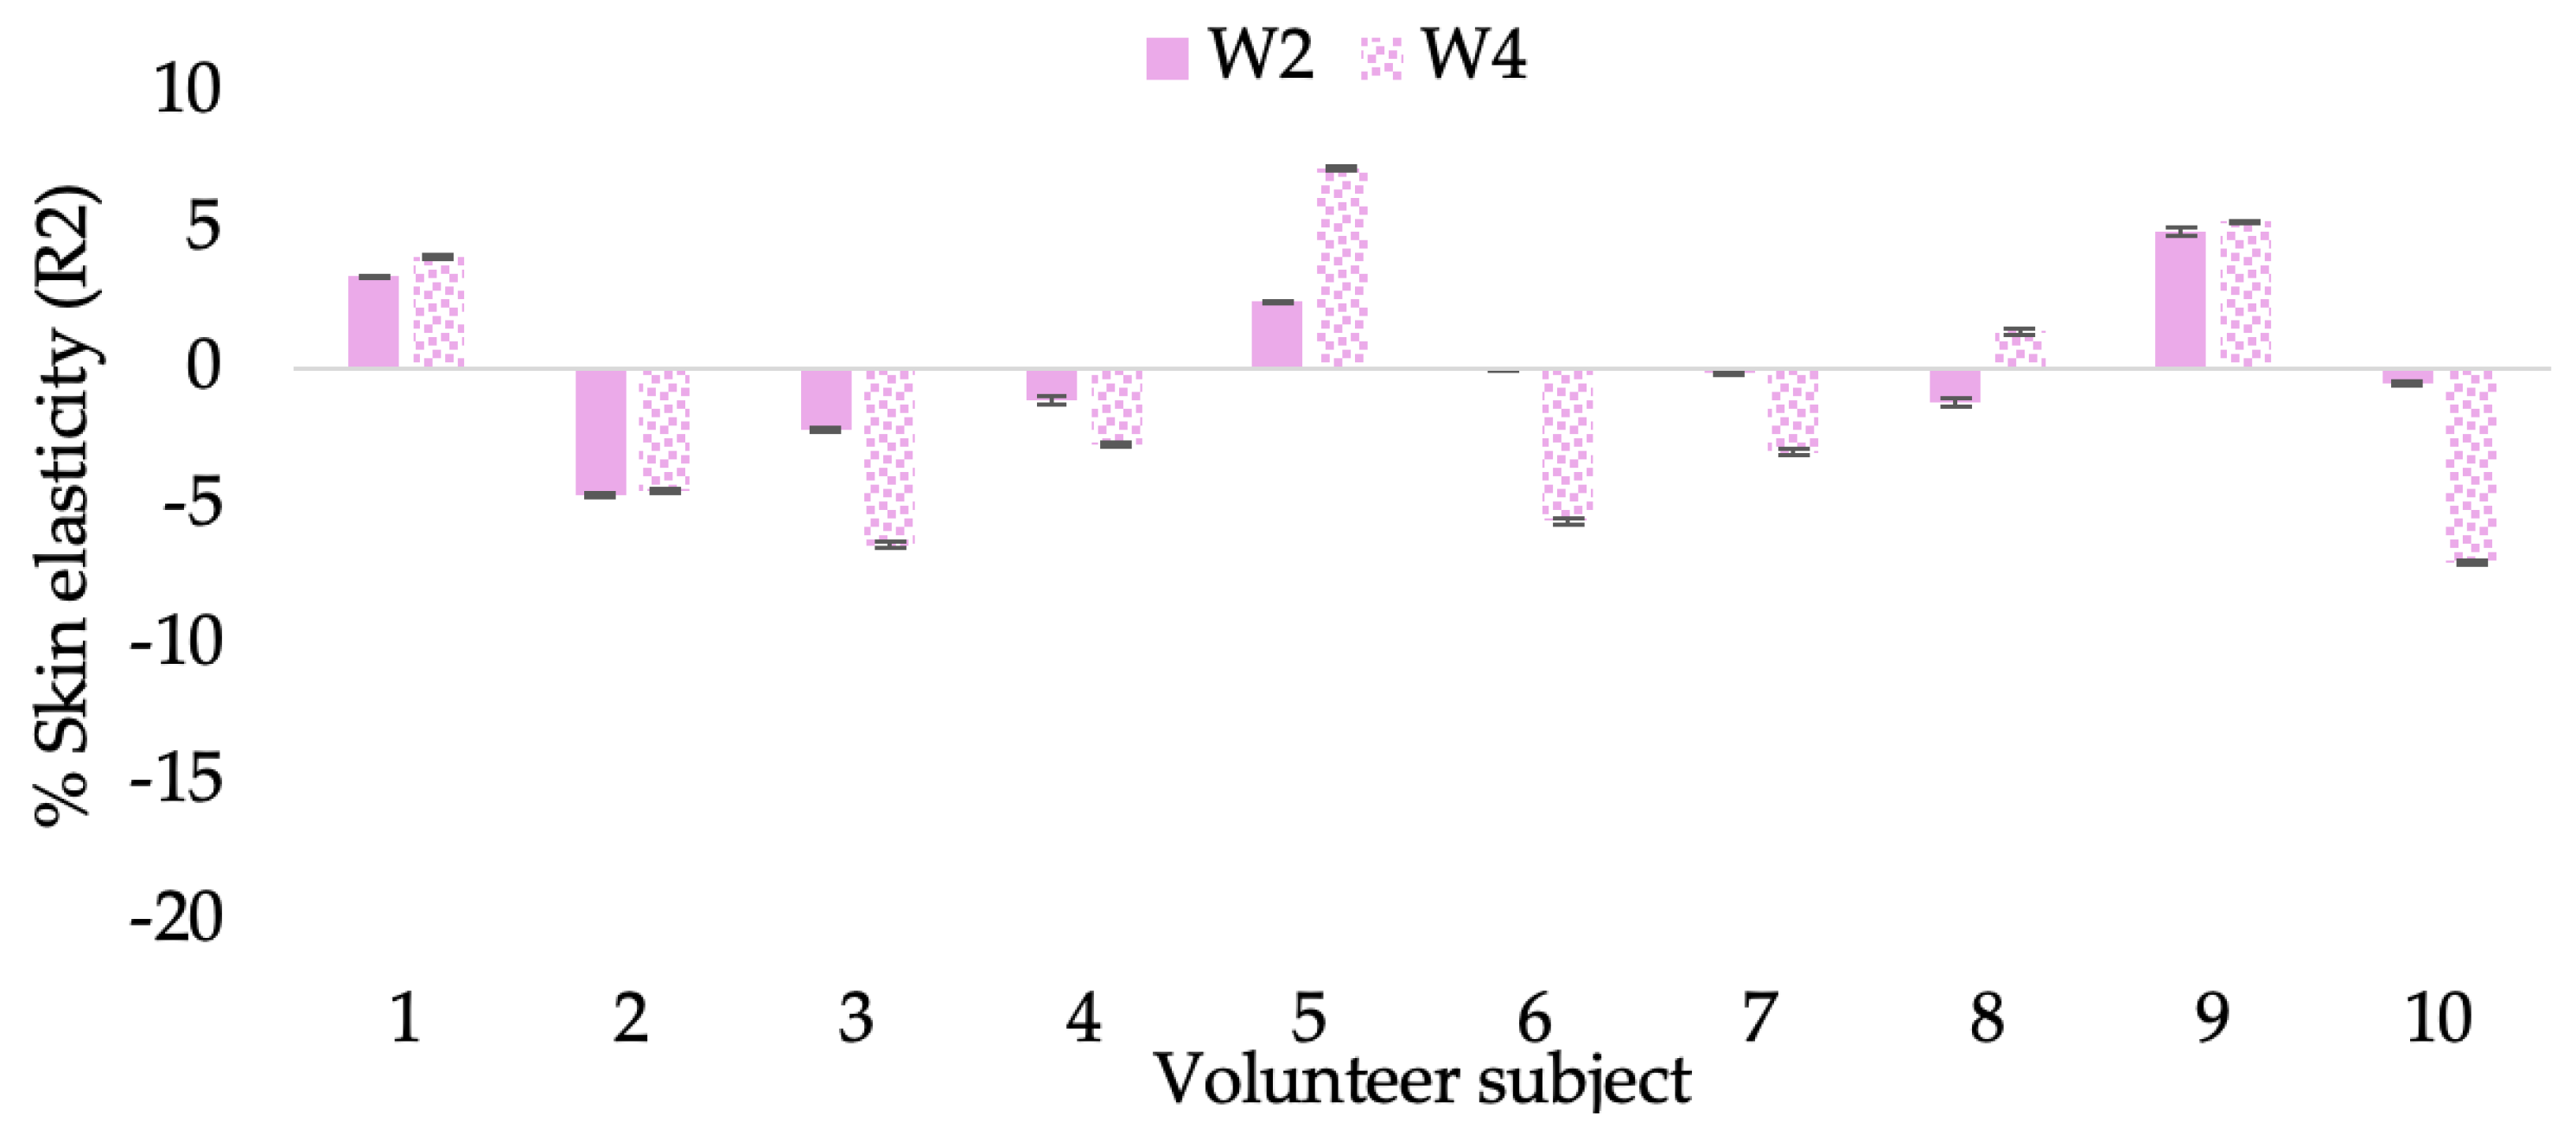
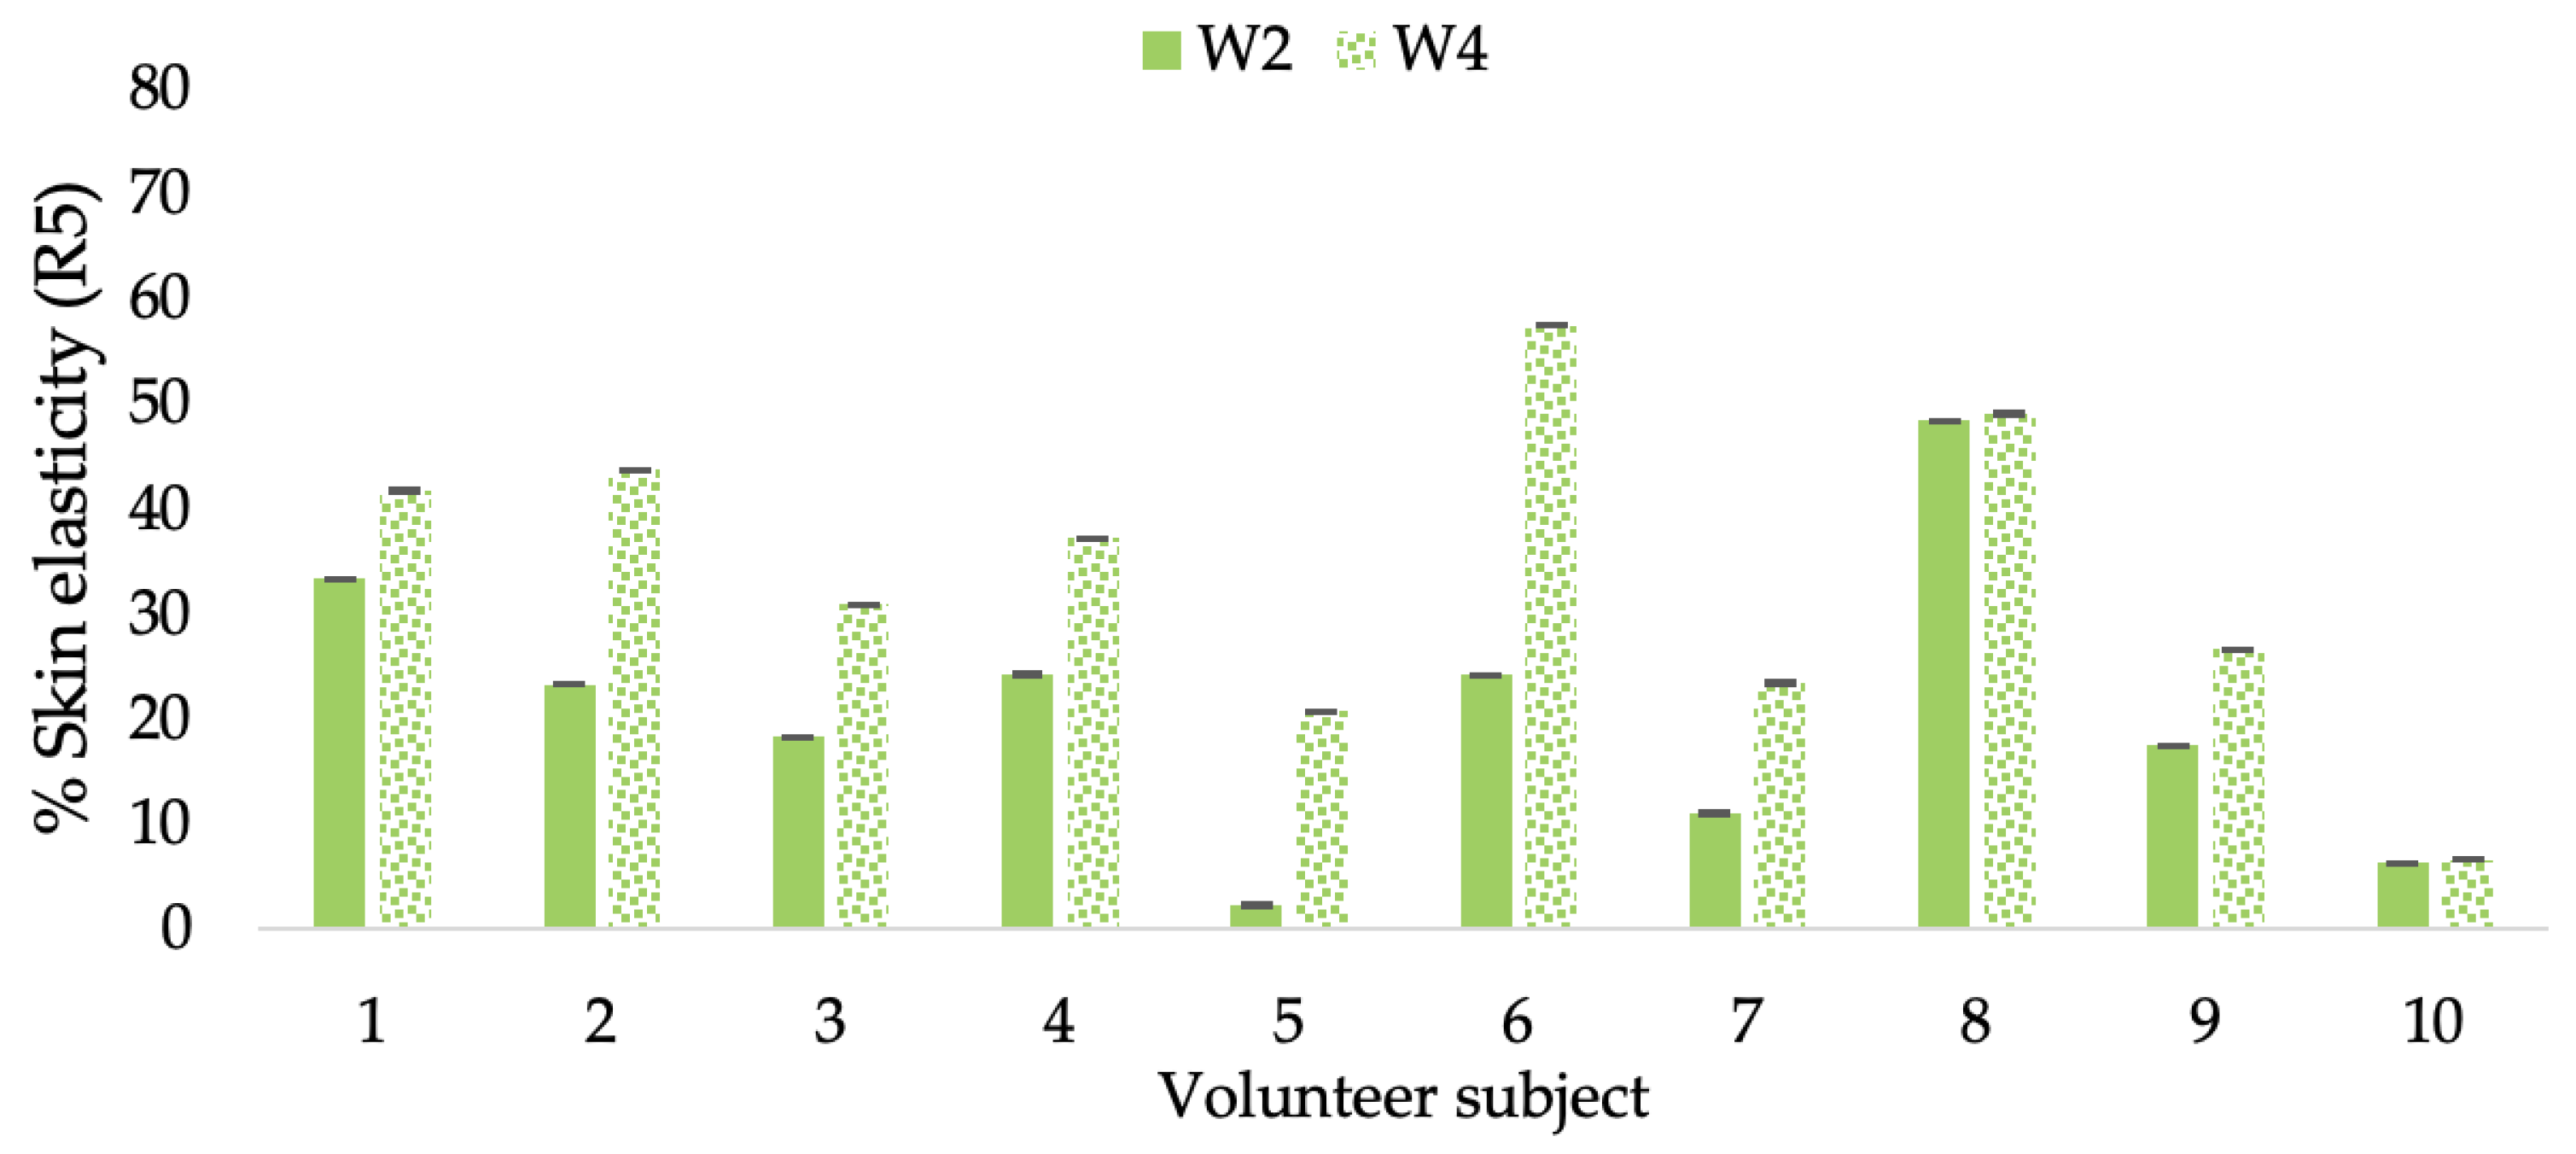
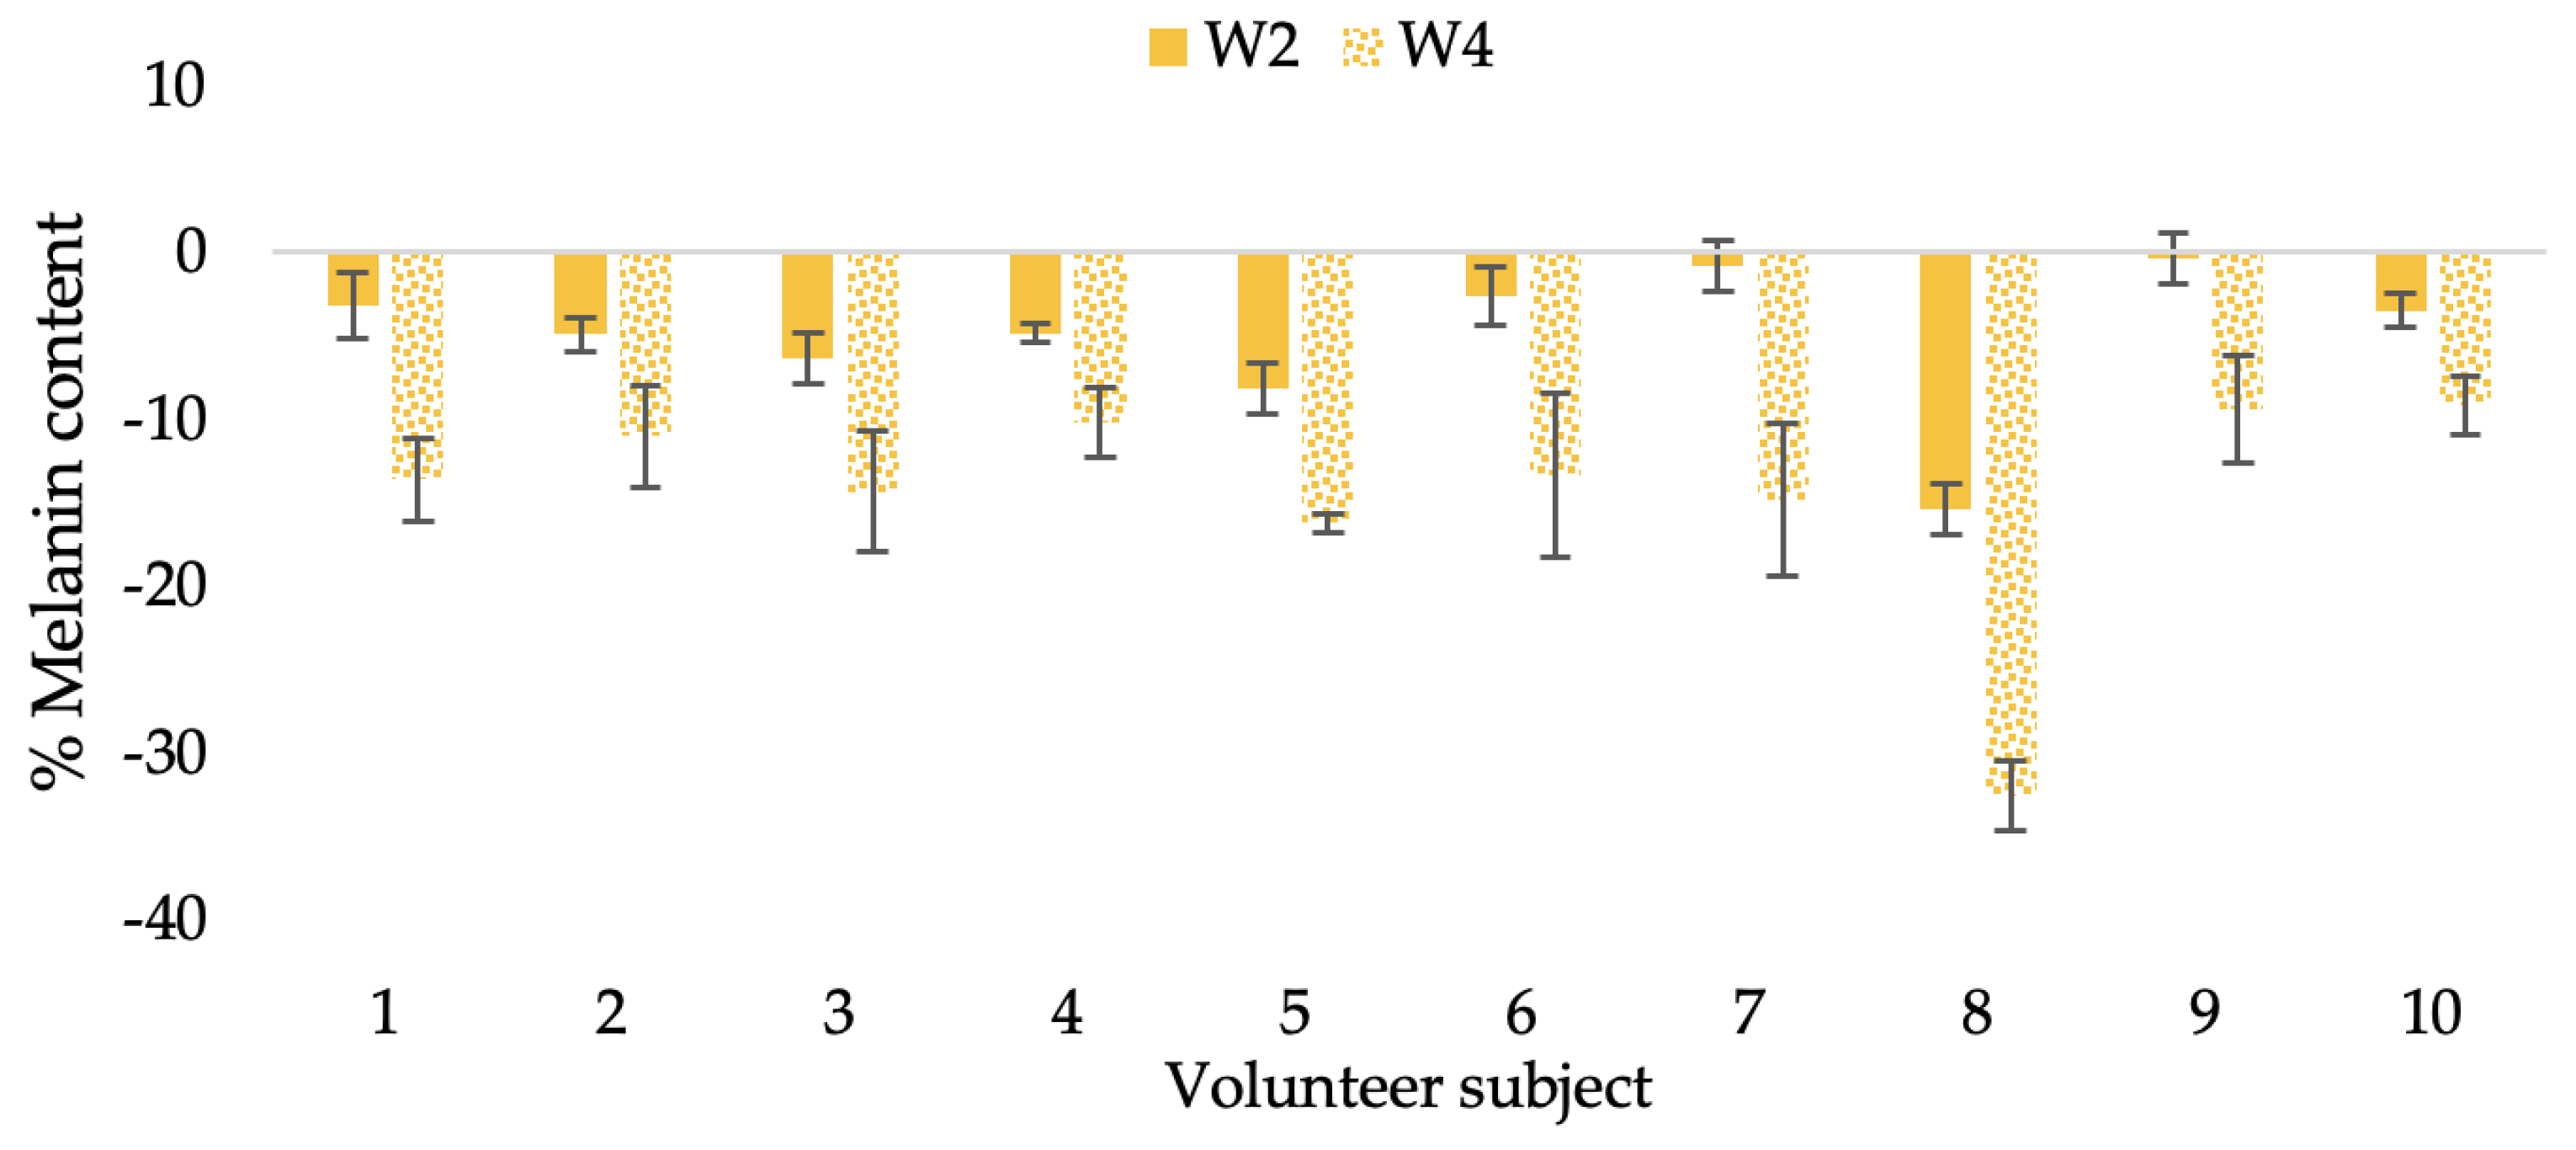
2.6.2. Efficacy Test

Caffeine is one of the most common alkaloids found in coffee, and can be absorbed into both rat and human skin membranes (in vitro test) with small amounts of caffeine remaining [56,57]. The results of Meesen [58] showed that caffeine in O/W emulsion can penetrate through pig skin (in vitro test). Transepidermal water loss (TEWL) is the amount of water lost from the stratum corneum per skin area unit, which reflects the integrity of the skin barrier function and has previously been used to indicate healthy or unhealthy (damaged) human skin. High rates of TEWL indicated a weak skin barrier function, which can alter skin dryness and accelerate aging. In contrast, lower TEWL helps to restore the skin’s barrier and to preserve the skin’s moisture [59,60]. Caffeine (0.5%) in gel base has been effective in increasing the skin barrier function, and reduced transepidermal water loss (TEWL) in subjects’ skin [61]. Additionally, an in vivo investigation on mouse skin tissue showed that caffeine can shield the skin from oxidative-stress-related skin senescence [62]. Chlorogenic acid is a well-known free radical scavenging antioxidant [13]. It has shown anti-aging properties through decreasing reactive oxygen species (ROS) levels, the primary cause of aging, thus inhibiting related skin-aging enzymes such as MMP-1 and elastase and increasing hyaluronic acid and collagen contents in fibroblast cells [17,18,35,45,63]. Therefore, coffee extract, caffeine, and chlorogenic acid have the potential to prevent premature skin aging.
A typical element of aging is the loss of skin elasticity, which causes wrinkles and fine lines as people age. Accordingly, skin elasticity is a significant indicator of skin aging and is a measure to assess skin aging. A cutometer is a device for measuring the mechanical and viscoelastic characteristics of skin by measuring the response of skin to an applied suction force [64,65]. A cutometer was employed in this study to evaluate the anti-aging effectiveness of the L-CBE. Once the R parameters (R2, R5, and R7) had been determined, all values could be reported as elasticity. R2 refers to the skin’s overall elasticity and how resistant it is to mechanical force compared to its reversal. R5 is the net elastic, which is an elastic portion of the suction part versus an elastic portion of the relaxation part. R7 represents the ratio of immediate recovery to total deformation, known as the biological elasticity. The amount of elasticity is in relation to the final distension. If the skin were more elastic, the R values would have been closer to 1.0000 (100%). Thirty volunteer subjects with an average age of 42 ± 11.7 years participated in this single blind test. The oldest subject was 60 years old, while the youngest was 24. The participants were randomly divided into three groups of ten subjects. The first group applied a placebo cream without any active ingredient (B cream), while the second and third groups applied a cream containing 5% of the free CBE and the loaded liposomes (CBE and L-CBE creams, respectively). The participants were instructed to apply the test creams on their facial skin for 4 weeks. Following application, the elasticity of the skin was measured in triplicate at week 0 (baseline), week 2, and week 4. The variations in each subject’s skin elasticity throughout the 4-week product therapy experiment and the percentage changes in the skin elasticity (R2, R5, and R7) of each group were calculated as displayed in Figure 8, Figure 9, Figure 10, Figure 11, Figure 12, Figure 13, Figure 14, Figure 15, Figure 16, Figure 17, Figure 18 and Figure 19.
The results after using the cream for two weeks revealed that volunteer subjects who used the CBE and L-CBE creams experienced greater changes in skin elasticity (R2, R5, and R7) than those who used the placebo cream (p < 0.05). The change in skin gloss elasticity (R2) was significantly enhanced as compared to the baseline at 11.32 and 16.14% and continuously increased from the starting point, with 19.52 and 30.54% for the CBE and the L-CBE creams, respectively, after being applied for 4 weeks (Figure 8, Figure 9, Figure 10 and Figure 11). The net skin elasticity (R5) continuously increased the course of the investigation, reaching its highest levels at the end of the study, with maximum values of 33.75 and 49.63% for the CBE and L-CBE creams, respectively, in comparison to the baseline (Figure 12, Figure 13, Figure 14 and Figure 15). The biological elasticity (R7) increased noticeably in the second week of the trial, with 18.49 and 24.07%, and appreciably in the fourth week, with 32.45 and 62.54% for the CBE and L-CBE creams, respectively (Figure 16, Figure 17, Figure 18 and Figure 19).
There was no significant difference in skin elasticity (R2, R5, and R7) between the L-CBE and CBE groups 2 weeks following the operation. However, the L-CBE group had a significantly higher level of elasticity (R2, R5, and R7) than the CBE group after using the creams for 4 weeks. These findings may be due to the CBE’s increase in skin collagen, which is predominantly connective tissue that is found in the dermis and plays a major role in providing a flexible and taut skin layer [66]. Collagen alterations are fundamental to the skin aging process, in that as people age, the levels of collagen decline, leading to wrinkles [67]. The results correspond to the report of an in vivo test in which Girsang applied 10% coffee bean extract cream to the skin of rat tails that had been shaved for 4 weeks, boosting the collagen level by 91.30% [18]. Rodrigues also founded that the application of coffee silverskin extract exhibited equivalent efficiency to hyaluronic acid in reducing deep wrinkles in the crow’s feet area over the course of 28 days [68]. In addition, 0.5% of the caffeine in a gel base considerably enhanced forehead skin elasticity after 4 weeks of use [69]. Furthermore, the L-CBE cream appeared to significantly increase skin elasticity to a greater degree than the CBE cream (p < 0.05) by the end of the experiment. This might be a result of the liposome system enabling a higher level of active chemical penetration in the skin. The results indicate that CBE has the potential to be employed for the purpose of boosting skin elasticity and slowing down the signs of skin aging. It can also be loaded into liposome formulations to increase its effectiveness in skin anti-aging cosmetic and cosmeceutical products.
Human skin color is influenced by the pigment melanin, which is found in the skin. Therefore, melanin levels can be distinguished between darker and lighter skin. In this study, Mexameter was used to detect the amount of melanin in the epidermis beneath the skin’s surface in order to assess the brightening effects of the CBE and the L-CBE creams on volunteer subjects’ skin at weeks 0, 2, and 4.
The findings demonstrated that volunteer subjects who used the CBE and the L-CBE creams tended to have lower melanin contents than the baseline (Figure 20, Figure 21, Figure 22 and Figure 23). After 2 weeks, it was evident that the CBE and the L-CBE creams could lower melanin levels by 3.97 and 4.99% compared to the initial value. At week 4, the melanin content had dramatically decreased from the beginning, with 6.71 and 14.43% for the CBE and the L-CBE creams, respectively (p < 0.05). In comparison to the placebo cream, both creams significantly outperformed it in terms of reducing melanin. This was due to the presence of numerous significant phenolic and alkaloid chemicals in coffee extract, which strongly inhibit the tyrosinase enzyme and melanin synthesis [70,71,72,73,74,75]. In addition, the liposome cream showed a significantly higher efficacy of melanin reduction than the CBE cream (p < 0.05) at week 4. The findings suggest that the CBE can be used to lighten skin and can be included into the liposome encapsulation system, increasing its effectiveness.

3. Materials and Methods

3.1. Reagents and Chemicals

Phosphatidylcholine, cholesterol, caffeine, chlorogenic acid, Folin–Ciocalteu reagent, gallic acid, lipopolysaccharide (LPS), phenylmethanesulfonyl fluoride, sodium carbonate, Tris/HCl, triton x-100, vanillin, and SOD assay Kit-WST were purchased from Sigma-Aldrich Co., St. Louis, MO, USA. Ethanol, sulfuric acid, and trichloroacetic acid were purchased from Merck, Darmstadt, Germany. Ferric chloride and potassium ferricyanide were purchased from Fisher Scientific, Waltham, MA, USA. Dimethyl sulfoxide (DMSO) and 3-(4,5-dimethylthiazol-2-yl)-2,5-diphenyltetrazolium bromide (MTT) were purchased from Bio Basic Inc., Markham, ON, Canada. Fetal bovine serum, fibroblast, penicillin streptomycin solution, phosphate-buffered saline (PBS), and typsin/EDTA solution were purchased from Gibco, Grand Island, NY, USA. The CBE was obtained as a gift from The NIC Company Limited, Chiang Rai, Thailand.

3.2. Identification of Chlorogenic Acid and Caffeine Using HPLC

The major chemical constituents of the CBE, chlorogenic acid and caffeine, were determined using high-performance liquid chromatography (HPLC, 1290 Infinity II LC System, Agilent Technologies, Waldbronn, Germany) with photodiode array (PDA) detection at 280 nm [45]. After being filtered via Whatman® (Maidstone, UK) membrane filters with nylon pore sizes of 0.2 μm, the CBE was then injected into a Poroshell 120 EC-C18 (4.6 × 250 mm, 4 μm) with 10 μL of the extract. The mobile phase systems included (A) acetonitrile and 1.5% acetic acid in a 10:90 ratio and (B) acetonitrile and 1.5% acetic acid in a 15:85 ratio. Mobile phase A was eluted from 0 to 6 min, while mobile phase B was eluted from 6 to 12 min, both at flow rates of 1 mL/min. The standard retention times for chlorogenic acid and caffeine were 6.139 and 6.441 min, respectively. The chromatograms were plotted and processed using Agilent software (version C.01.07 [22]) and the peak areas were automatically integrated. Peak areas acquired from HPLC analysis were plotted against standard solution concentrations to construct the standard calibration curves. The stock solutions of caffeic acid and chlorogenic acid were dissolved in DMSO and diluted to obtain concentrations of 5, 10, 25, 50, and 100 μg/mL for the calibration range. Linear regression was used to fit the calibration curves of both standards. Using the calibration curve of the standards, the concentrations of chlorogenic acid and caffeine were estimated.

3.3. Preparation and Characterization of Nanoliposomes

3.3.1. Nanoliposome Preparation

In this study, the liposomes were prepared by the film method. Briefly, 15 g of phosphatidylcholine (PC) and 1 g of cholesterol (CL) were dissolved in 60 mL of ethanol with constant stirring at 50 °C for 30 min. Then, the solvent was removed using an evaporator (Buchi R-114 Rotary Vap System, BUCHI Corporation, New Castle, DE, USA) at 40 °C until it formed a thin film, which was further mixed with 30 mL of deionized water using a homogenizer (T25 digital ultra turrax, IKA, Staufen, Germany) at 8000 rpm for 30 min. After an opaque solution was obtained, the CBE (5%) was added and mixed using a homogenizer at 5000 rpm for 10 min. Then, the liposomes’ particle sizes were decreased by feeding them through a high-pressure microfluidizer (LM20 Microfluidizer, Microfluidics, Westwood, MA, USA) at 25,000 psi for 5 cycles.

3.3.2. Particle Size and Zeta Potential Measurement

The sample particle size, polydispersity index (PDI), and zeta potential were measured by Zetasizer (Zetasizer Nano S, Malvern Instruments, Worcestershire, MA, USA). The sample (0.01%, w/v) was suspended in water and sonicated with an ultrasonic bath (DT 255 H, Bandelin Co., Berlin, Germany) for 5 min at 20 KHz for complete dispersion of particles.

3.3.3. Encapsulation Efficiency and Loading Efficiency

The encapsulation efficiency (EE) based on total phenolic content was determined using spectrophotometry. Encapsulation efficiency quantifies the percentage of successfully encapsulated active substances. Briefly, liposomes (10 g) were centrifuged at 9000 rpm at 4 °C for 30 min. The supernatant and precipitate were separately collected. The precipitate was redissolved in ethanol. Both solutions were measured for their total phenolic content using the Folin–Ciocalteu method, and chlorogenic acid was used as a standard compound. Finally, the EE and LE were expressed as percentages through the following equation.
%   E E = A P C S P C A P C × 100
where SPC is total phenolic content of the supernatant (surface total phenolic content) and APC is the added total phenolic content in the liposome preparation process.
%   L E = I P C W L × 100
where IPC is total phenolic content of the precipitate (inner total phenolic content) and WL is the weight of L-CBE.

3.3.4. Stability Test

In order to determine the effect of accelerated conditions on the stability of the CBE and the L-CBE, the method was performed following the protocol of Marx [76]. Briefly, 50 g of samples were weighed in a wide-mouth glass jar with closed-screw cap; then, the prepared samples were stored in various conditions, including at a low temperature (4 °C) in a refrigerator, at room temperature (RT), and at a high temperature (45 °C) in a hot air oven, for 12 weeks. Before and during testing, samples were analyzed and recorded as the initial and remaining amounts of total phenolic contents, which used the standard calibration curve of chlorogenic acid. All samples were investigated in triplicate at baseline and at time durations of 2, 4, 8, and 12 weeks.

3.3.5. In Vitro Permeation Measurement

The permeation experiment was studied according to the method described by Mattiasson [77] using a Franz diffusion cell. Cellulose acetate membranes were washed prior to use to remove any dirt that could interfere with the execution of the experiments or impregnation. Washing was performed by soaking the membranes in phosphate-buffered saline (PBS), pH 7.4, for 60 min. The membrane was mounted on a receiver cell with the stratum corneum side facing the donor cell. During the experiment, the receiver cells were filled with PBS (pH 7.4), which was continuously stirred at 300 rpm. The temperature (37 ± 0.2 °C) was maintained with an external circulating water bath. In the donor cell, 1 mL samples of 1 mg/mL were separately applied homogeneously on the membrane. At pre-set time points (0.5, 1, 1.5, 3, 5, 7, 24, 48, and 100 h), 1 mL of the receptor solution was withdrawn, and the same volume of fresh receptor was added to the receptor cell in order to maintain the condition. Samples were measured for total phenolic content using the Folin–Ciocalteu method.

3.4. Cytotoxicity

The cytotoxicity assessment was performed by MTT assay [78]. Human dermal fibroblast (HDF) cells (100 µL), suspended in a complete culture medium at a density of 1 × 10⁶ cells/mL, were placed into a 96-well plate for 24 h. Then, cells were treated with 100 µL of various sample concentrations (0–20 mg/mL) in media for 24 h. Afterward, the culture medium was removed. Then, 0.5 mg/mL of MTT solution (100 µL) was added to each well and incubated for 4 h. DMSO (100 µL) was added to all wells and incubated for 30 min at room temperature. The absorbance of each well was measured at 570 nm using a microplate reader (UVM 340, Biochrom, Holliston, MA, USA). The percentage of cell viability was calculated by the following formula, and the IC50 was expressed.
V i a b l e   c e l l % = A t r e a t e d   g r o u p A u n t r e a t e d   g r o u p × 100

3.5. Anti-Aging Activity

3.5.1. Superoxide Dismutase Activity

Fibroblast cells were supplemented with 100 μL of samples and incubated in a 5% CO2 humidified incubator at 37 °C for 24 h. Then, cells were harvested with 0.05% typsin solution. Cells were lysed with lysis buffer and centrifuged at 3000 rpm for 15 min (Vichit and Saewan, 2016). The SOD activity in the supernatants was measured using a SOD assay kit (Sigma-Aldrich, USA). A microplate reader was used to measure the absorbance at 450 nm after the mixture of the supernatant (20 µL), WST working solution (200 µL), and enzyme working solution (20 µL) was incubated at 37 °C for 20 min (Biochrom, Holliston, MA, USA). The following equation was used to compute the SOD activity:
%   S O D   a c t i v i t y = A c o n t r o l A s a m p l e A c o n t r o l × 100

3.5.2. Nitric Oxide Inhibition

Fibroblast cells (20,000 cells/mL, 100 uL) were supplemented with 100 μL samples before being stimulated with 1 μg/mL lipopolysaccharide (LPS) and incubated for 24 h [79]. A 50 μL solution of sulfanilamide in 5% phosphoric acid was added to the culture medium (50 μL). After adding 50 μL of 0.1% N-1-napthylethylenediamine dihydrochloride aqueous solution, the absorbance at 540 nm was measured. Using a sodium nitrite standard curve, the quantity of nitrite in the sample was measured. The following equation was used to calculate the nitric oxide inhibition percentage:
%   i n h i b i t i o n   o f   n i t r i c   o x i d e = A c o n t r o l A s a m p l e A c o n t r o l × 100

3.5.3. Collagenase Inhibition

The collagenase inhibitory activity was assessed using a MMP-1 colorimetric drug discovery kit, which was created to screen MMP-1 inhibitors utilizing a thiopeptide as a chromogenic substrate. Human dermal fibroblast cells (20,000 cells/mL, uL) were supplemented with a 100 µL sample and incubated for 24 h. Cells were then harvested using a 0.05% trypsin solution. After being lysed with a lysis buffer, the cells were centrifuged at 3000 rpm for 15 min. The supernatants, 20 µL of 153 mU/µL MMP-1 and 20 μL of 1.3 µM prototypic control inhibitor, were mixed and incubated at 37 °C for 60 min to allow for interaction between the inhibitor and the enzyme. Following the addition of 10 μL of 100 µM thiopeptide, the absorbance was measured at 412 nm. This formula was used to determine the collagenase inhibition percentage:
%   C o l l a g e n a s e   i n h i b i t i o n = A c o n t r o l A s a m p l e A c o n t r o l × 100

3.6. Formulation

The CBE and L-CBE creams were prepared according to the O/W emulsion base cream, as displayed in Table 1. In parts A and B, all ingredients were separately weighed and heated to 70 °C. Then, part A was added into part B with constant stirring until well mixed. Part C was added into part AB and mixed using a homogenizer (T25 digital ultra turrax, IKA, Staufen, Germany) at 6000 rpm for 15 min. After that, the mixture was cooled down to 40 °C, and part D was added into part ABC, then homogenized using a homogenizer. The free CBE and L-CBE, at concentrations of 5%, were separately incorporated into the prepared base cream, and CBE and L-CBE creams were obtained. Phase separation did not appear in either cream when centrifuged at 9000 rpm for 30 min. The products were evaluated for characteristics such as appearance, color, texture, and spreadability by visual observation and skin application. The products were measured for their pH values using a pH meter (HI2211 HANNA Basic pH/ORP Benchtop Meter, Hanna Instruments, Bangkok, Thailand).

3.7. Clinical Study

3.7.1. Ethical Aspects

The protocol was approved by the Mae Fah Luang University Ethics Committee under approval number EC21228-17. The research protocols were followed in accordance with the Helsinki Declaration on human subjects. Before taking part in the clinical study, each participant signed a written informed agreement that detailed the nature of the study, the steps to be taken, the general characteristics of the substances being evaluated, and any known or predicted negative effects that could arise from participation.

3.7.2. Subjects

The 30 participants in this study were concerned about their skin’s tone and dullness, wrinkles, and fine lines. Men and women with normal skin and Fitzpatrick skin types II-IV, aged 20 to 60 years, met the primary inclusion criteria for this study. The routine usage of other skincare products at the same time as the study’s duration was prohibited. Subjects were selected excluding those who did not meet the clinical criteria due to factors that could interfere with the test’s results. Those who had a chronic skin condition, sensitive or easily irritated skin, were pregnant, who regularly smoked or drank alcohol, and those who had taken part in the same experiment within the previous month were excluded from the study.

3.7.3. Skin Irritation Testing

Skin irritation testing was carried out utilizing a Draize model [80]. A single occlusive patch test was performed on the subjects. The upper arm of the volunteer subjects was covered with Finn chambers® at a size of 8 mm (Smartpractice, McDowell, WV, USA) which were used to observe skin irritation for 24 h. Each chamber was saturated with B cream as a placebo, CBE cream, L-CBE cream, 0.5% w/v of sodium lauryl sulfate as a positive reaction, and deionized water as a negative reaction. Then, at 30 min and at 24 h after removing the patch, erythema and edema were observed. The mean irritation index (M.I.I.) was utilized to evaluate each test material (Table 2 and Table 3).

3.7.4. Efficacy Test

Everyone who passed the occlusive single patch test without experiencing any irritation (M.I.I score 0.5) was eligible to take part in this study. To prevent bias, a number rather than a name was given to each volunteer. Three treatment groups were randomly assigned to the volunteer subjects. Group 1 received the B cream. The CBE cream was given to group 2, while the L-CBE cream was given to group 3. Volunteer subjects, who received instruction on how to use the cream, applied 0.5 g of the tested creams onto their faces twice daily at home in the morning and before bedtime under normal conditions for 4 weeks. In particular, the study’s participants were instructed not to use any other skincare products and to avoid sunlight as much as possible. Before measurements were taken, each volunteer’s face was cleansed with a gentle facial cleanser, and individuals spent at least 30 min acclimating to the room’s conditions. All skin measurements were performed in a controlled environment at a constant temperature (20 ± 5 °C) and relative humidity (60 ± 5%). By using the single-blind method, measurements of the skin’s elasticity and melanin content were taken in triplicate at week 0 (baseline), week 2, and week 4 following application. Facial skin elasticity was measured using Cutometer® dual MPA 580 (Courage Khaazaka electronic GmbH, Cologne, Germany) by assessing the net elasticity of the skin without viscous deformation, and this was repeated three times to obtain an accurate measurement of the same part by pressing the measurement probe onto the skin. The melanin content of the skin was measured using a Mexameter (MX18, Courage Khaazaka electronic, Cologne, Germany). The content of melanin was expressed as the mean value, which was calculated and compared following sensor contact at the selected site of the skin’s surface.

3.8. Statistical Analysis

IBM SPSS statistics software version 23 (SPSS Inc., Chicago, IL, USA) was used to conduct the statistical analysis. The mean and standard deviation were used to express continuous variables (SD). The data were presented as the triplicate values’ means and standard deviations. Each experiment’s statistical comparisons were carried out using a paired t-test with a 95% confidence level. Statistical significance was defined as a p-value of 0.05.

4. Conclusions

In this study, the major compound in CBE was found to be chlorogenic acid (131.85 µg/mL) by HPLC analysis. The CBE was successfully loaded in nanosized liposomes with a high EE of 71.26%. The liposomal encapsulation system enhanced the stability of chlorogenic acid, especially when stored under high thermal conditions. It provided a higher controlled release and penetration of active compounds through an artificial membrane than the free extract did. The liposomes showed lower cytotoxicity than the free extract, while its anti-aging activities, NO inhibition and SOD activity, and anti-collagenase inhibition in HDF cells were slightly higher than those of the free extract. The clinical evaluation demonstrated that the L-CBE cream significantly enhances skin elasticity and decreases melanin content more effectively than the free extract. To our knowledge, this present work is the first report of the clinical efficacy of CBE encapsulation in nanoliposomes. The results indicate that a satisfactory encapsulation efficacy of CBE in a lipid-nanocarrier, which could enhance stability, lower toxicity, and maintain biological activity, has the potential to be used as an active ingredient for anti-aging and skin brightening in cosmetic and cosmeceutical products.

Author Contributions

Conceptualization, N.S. and P.C.; methodology, N.S., A.J., N.P. and P.C.; validation, N.S. and A.J.; formal analysis, N.S., N.P. and P.C.; investigation, N.S. and P.C.; resources, N.S. and P.C.; data curation, N.S., A.J., N.P. and P.C.; writing—origination draft preparation, N.S., A.J. and N.P.; writing—review and editing, N.S., A.J., N.P. and P.C.; visualization, N.S.; supervision, N.S. and A.J.; project administration, N.S.; funding acquisition, N.S. All authors have read and agreed to the published version of the manuscript.

Funding

This work was financially supported by the Office of National Higher Education Science Research and Innovation Policy Council through Program Management Unit for Competitiveness, grant number C10F640029.

Institutional Review Board Statement

The study was conducted in accordance with the Declaration of Helsinki and approved by the Ethics Committee of Mae Fah Luang University. The certificate of analysis (COA) and protocol number EC21228-17 (Approval date: 13 February 2022).

Informed Consent Statement

Informed consent was obtained from all subjects involved in the study.

Data Availability Statement

All the data are available within the manuscript.

Acknowledgments

Cosmetic and Beauty Innovations for Sustainable Development (CBIS) Research Group for instrument and funding support for instruments and funding support.

Conflicts of Interest

The authors declare no conflict of interest.

Sample Availability

Samples of CBE and liposomal CBE are available from the authors.

References

  1. Chiu, P.C.; Chan, C.C.; Lin, H.M.; Chiu, H.C. The clinical anti-aging effects of topical kinetin and niacinamide in Asians: A randomized, double-blind, placebo-controlled, split-face comparative trial. J. Cosmet. Dermatol. 2007, 6, 243–249. [Google Scholar] [CrossRef] [PubMed]
  2. Williams, R.; Pawlus, A.D.; Thornton, J.M. Getting under the skin of hair aging: The impact of the hair follicle environment. Exp. Dermatol. 2020, 29, 588–597. [Google Scholar] [CrossRef] [PubMed]
  3. Hall, R.D.; Trevisan, F.; de Vos, R.C. Coffee berry and green bean chemistry–Opportunities for improving cup quality and crop circularity. Food Res. Int. 2022, 151, 110825. [Google Scholar] [CrossRef]
  4. Saewan, N. Effect of coffee berry extract on anti-aging for skin and hair—In vitro approach. Cosmetics 2022, 9, 66. [Google Scholar] [CrossRef]
  5. Murthy, P.S.; Naidu, M.M. Recovery of phenolic antioxidants and functional compounds from coffee industry by-products. Food Bioprocess Technol. 2012, 5, 897–903. [Google Scholar] [CrossRef]
  6. McDaniel, D.H. Clinical safety and efficacy in photoaged skin with coffeeberry extract, a natural antioxidant. Cosmet. Dermatol. Cedark Knollis 2009, 22, 610. [Google Scholar]
  7. Azam, S.; Hadi, N.; Khan, N.U.; Hadi, S.M. Antioxidant and prooxidant properties of caffeine, theobromine and xanthine. Med. Sci. Monit. 2003, 9, 325–330. [Google Scholar]
  8. Duangjai, A.; Suphrom, N.; Wungrath, J.; Ontawong, A.; Nuengchamnong, N.; Yosboonruang, A. Comparison of antioxidant, antimicrobial activities and chemical profiles of three coffee (Coffea arabica L.) pulp aqueous extracts. Integr. Med. Res. 2016, 5, 324–331. [Google Scholar] [CrossRef]
  9. Devasagayam, T.P.; Kamat, P.C.; Mohan, H.; Kesavan, P.C. Caffeine as an antioxidant: Inhibition of lipid peroxidation induced by reactive oxygen species. Biochim. Biophys. Acta 1996, 1282, 63–70. [Google Scholar] [CrossRef]
  10. Prinyarux, T.; Saewan, N. Anti-hairloss efficacy of coffee berry extract. Food Appl. Biosci. J. 2020, 8, 27–39. [Google Scholar]
  11. Fischer, T.W.; Hipler, U.C.; Elsner, P. Effect of caffeine and testosterone on the proliferation of human hair follicles in vitro. Int. J. Dermatol. 2007, 46, 27–35. [Google Scholar] [CrossRef] [PubMed]
  12. Bussoletti, C.; Mastropietro, F.; Tolaini, M.V.; Celleno, L. Use of a caffeine shampoo for the treatment of male androgenetic alopecia. J. Appl. Cosmetol. 2010, 28, 153. [Google Scholar]
  13. Santana-Galvez, J.; Cisneros-Zevallos, L.; Jacobo-Velazquez, D.A. Chlorogenic acid: Recent advances on its dual role as a food additive and a nutraceutical against metabolic syndrome. Molecules 2017, 22, 358. [Google Scholar] [CrossRef] [PubMed]
  14. Meng, S.; Cao, J.; Feng, Q.; Peng, J.; Hu, Y. Roles of chlorogenic acid on regulating glucose and lipids metabolism: A review. Evid. Based Complement. Alternat. Med. 2013, 2013, 801457. [Google Scholar] [CrossRef]
  15. Affonso, R.C.L.; Voytena, A.P.L.; Fanan, S.; Pitz, H.; Coelho, D.S.; Horstmann, A.L.; Pereira, A.; Uarrota, V.G.; Hillmann, M.C.; Varela, L.A.C.; et al. Phytochemical composition, antioxidant activity, and the effect of the aqueous extract of coffee (Coffea arabica L.) bean residual press cake on the skin wound healing. Oxid. Med. Cell. Longev. 2016, 2016, 1923754. [Google Scholar] [CrossRef]
  16. Kolarsick, P.A.; Kolarsick, M.A.; Goodwin, C. Anatomy and physiology of the skin. J. Dermatol. Nurses’ Assoc. 2011, 3, 203–213. [Google Scholar] [CrossRef]
  17. Alves, G.D.A.D.; Oliveira de Souza, R.; Ghislain Rogez, H.L.; Masaki, H.; Fonseca, M.J.V. Cecropia obtusa extract and chlorogenic acid exhibit anti aging effect in human fibroblasts and keratinocytes cells exposed to UV radiation. PLoS ONE 2019, 14, e0216501. [Google Scholar] [CrossRef]
  18. Girsang, E.; Ginting, C.; Lister, I.N.; Widowati, W.; Wibowo, S.; Perdana, F.; Rizal, R. In silico analysis of phytochemical compound found in snake fruit (Salacca zalacca) peel as anti-aging agent. Thai J. Pharm. Sci. 2019, 43, 105–109. [Google Scholar]
  19. Sopyan, I.; Gozali, D. A review: A novel of efforts to enhance liposome stability as drug delivery approach. Syst. Rev. Pharm. 2020, 11, 555–562. [Google Scholar]
  20. Subongkot, T.; Wonglertnirant, N.; Songprakhon, P.; Rojanarata, T.; Opanasopit, P.; Ngawhirunpat, T. Visualization of ultradeformable liposomes penetration pathways and their skin interaction by confocal laser scanning microscopy. Int. J. Pharm. 2013, 441, 151–161. [Google Scholar] [CrossRef]
  21. Wu, W.; Wang, Z.; Wu, Y.; Wu, H.; Chen, T.; Xuel, Y.; Liu, Q. Mechanisms of Penetration Enhancement and Transport Utilizing Skin Keratine Liposomes for the Topical Delivery of Licochalcone A. Molecules 2022, 27, 2504. [Google Scholar] [CrossRef] [PubMed]
  22. Anwekar, H.; Patel, S.; Singhai, A. Liposome- as drug carriers. Int. J. Pharm. Life Sci. (IJPLS) 2011, 2, 945–951. [Google Scholar]
  23. Nsairat, H.; Khater, D.; Sayed, U.; Odeh, F.; Al Bawab, A.; Alshaer, W. Liposomes: Structure, composition, types, and clinical applications. Heliyon 2022, 8, e09394. [Google Scholar] [CrossRef] [PubMed]
  24. Yusaf, R.; Nawaz, R.; Hayat, S.; Khursheed, A.; Zafar, N.; Ahmad, A.; Majeed, I. Structural components of liposomes and characterization tools. Am. J. Pharm. Res. 2014, 4, 3559–3567. [Google Scholar]
  25. Macit, M.; Eyupoglu, O.E.; Macit, C.; Duman, G. Formulation development of liposomal coffee extracts and investigation of their antioxidant capacities. J. Drug Deliv. Sci. Technol. 2021, 64, 102605. [Google Scholar] [CrossRef]
  26. Pettinato, M.; Trucillo, P.; Campardelli, R.; Perego, P.; Reverchon, E. Bioactives extraction from spent coffee grounds and liposome encapsulation by a combination of green technologies. Chem. Eng. Process. 2020, 151, 107911. [Google Scholar] [CrossRef]
  27. Ramirez-Martinez, J.R. Phenolic compounds in coffee pulp: Quantitative determination by HPLC. J. Sci. Food Agric. 1988, 43, 135–144. [Google Scholar] [CrossRef]
  28. Pandey, A.; Soccol, C.R.; Nigam, P.; Brand, D.; Mohan, R.; Roussos, S. Biotechnological potential of coffee pulp and coffee husk for bioprocesses. Biochem. Eng. J. 2000, 6, 153–162. [Google Scholar] [CrossRef]
  29. Khadke, S.; Roces, C.B.; Donaghey, R.; Giacobbo, V.; Su, Y.; Perrie, Y. Scalable solvent-free production of liposomes. J. Pharm. Pharmacol. 2020, 72, 1328–1340. [Google Scholar] [CrossRef]
  30. Carugo, D.; Bottaro, E.; Owen, J.; Stride, E.; Nastruzzi, C. Liposome production by microfluidics: Potential and limiting factors. Sci. Rep. 2016, 6, 25876. [Google Scholar] [CrossRef]
  31. Lacatusu, I.; Badea, N.; Stan, R.; Meghea, A. Novel bio-active lipid nanocarriers for the stabilization and sustained release of sitosterol. Nanotechnology 2012, 23, 455702. [Google Scholar] [CrossRef] [PubMed]
  32. Manaia, E.B.; Abuçafy, M.P.; Chiari-Andréo, B.G.; Silva, B.L.; Oshiro-Júnior, J.A.; Chiavacci, L. Physicochemical characterization of drug nanocarriers. Int. J. Nanomed. 2017, 12, 4991–5011. [Google Scholar] [CrossRef] [PubMed]
  33. Idham, Z.; Muhamad, I.I.; Sarmidi, M.R. Degrdation kinetics and color stability of spray-dried encapsulated anthocyanins from Hibiscus sabdariffa L. J. Food Process Eng. 2012, 35, 522–542. [Google Scholar] [CrossRef]
  34. Casanova, F.; Santos, L. Encapsulation of cosmetic active ingredients for topical application—A review. J. Microencapsul. 2016, 33, 1–17. [Google Scholar] [CrossRef]
  35. Pavelkova, R.; Matouskova, P.; Hoova, J.; Porizka, J.; Marova, I. Preparation and characterisation of organic UV filters based on combined PHB/liposomes with natural phenolic compounds. J. Biotechnol. 2020, 324, 100021. [Google Scholar] [CrossRef]
  36. Thitilertdecha, N. Storage effect on phenolic compounds and antioxidant activity of Nephelium lappaceum L. extract. Cosmetics 2022, 9, 33. [Google Scholar] [CrossRef]
  37. Farah, A.; Donangelo, C.M. Phenolic compounds in coffee. Braz. J. Plant Physiol. 2006, 18, 23–36. [Google Scholar] [CrossRef]
  38. Wianowska, D.; Gil, M. Recent advances in extraction and analysis procedures of natural chlorogenic acids. Phytochem. Rev. 2019, 18, 273–302. [Google Scholar] [CrossRef]
  39. Volf, I.; Ignat, I.; Neamtu, M.; Popa, V.I. Thermal stability, antioxidant activity, and photo-oxidation of natural polyphenols. Chem. Pap. 2014, 68, 121–129. [Google Scholar] [CrossRef]
  40. Del-Toro-Sánchez, C.L.; Gutiérrez-Lomelí, M.; Lugo-Cervantes, E.; Zurita, F.; Robles-García, M.A.; Ruiz-Cruz, S.; Guerrero-Medina, P.J. Storage effect on phenols and on the antioxidant activity of extracts from Anemopsis californica and inhibition of elastase enzyme. J. Chem. 2015, 2015, 602136. [Google Scholar] [CrossRef]
  41. Guimarães, R.; Barreira, J.C.; Barros, L.; Carvalho, A.M.; Ferreira, I.C. Effects of oral dosage form and storage period on the antioxidant properties of four species used in traditional herbal medicine. Phytother. Res. 2011, 25, 484–492. [Google Scholar] [CrossRef] [PubMed]
  42. Jiménez-Zamora, A.; Delgado-Andrade, C.; Rufián-Henares, J.A. Antioxidant capacity, total phenols and color profile during the storage of selected plants used for infusion. Food Chem. 2016, 199, 339–346. [Google Scholar] [CrossRef] [PubMed]
  43. Shariare, M.H.; Pinky, N.J.K.; Abedin, J.; Kazi, M.; Aldughaim, M.S.; Uddin, M.N. Liposomal drug delivery of Blumea lacera leaf extract: In-Vivo hepatoprotective effects. Nanomaterials 2022, 12, 2262. [Google Scholar] [CrossRef] [PubMed]
  44. Choi, M.J.; Maibach, H.I. Liposomes and niosomes as topical drug delivery systems. Skin Pharmacol. Physiol. 2005, 18, 209–219. [Google Scholar] [CrossRef] [PubMed]
  45. Lee, E.K.; Bharadwaj, S.; Yadava, U.; Kang, G.S. Evaluation of caffeine as inhibitor against collagenase, elastase and tyrosinase using in silico and in vitro approach. J. Enzyme Inhib. Med. Chem. 2019, 34, 927–936. [Google Scholar]
  46. Pieme, C.A.; Penlap, V.N.; Ngogang, J.; Costache, M. In vitro cytotoxicity and antioxidant activities of five medicinal plants of Malvaceae family from Cameroon. Environ. Toxicol. Pharmacol. 2010, 29, 223–228. [Google Scholar] [CrossRef]
  47. Mohd Esa, N.; Abdul Kadir, K.K.; Amom, Z.; Azlan, A. Antioxidant activity of white rice, brown rice and germinated brown rice (in vivo and in vitro) and the effects on lipid peroxidation and liver enzymes in hyperlipidaemic rabbits. Food Chem. 2013, 141, 1306–1312. [Google Scholar] [CrossRef]
  48. Serra, V.; von Zglinicki, T.; Lorenz, M.; Saretzki, G. Extracellular superoxide dismutase is a major antioxidant in human fibroblasts and slows telomere shortening. J. Biol. Chem. 2003, 278, 6824–6830. [Google Scholar] [CrossRef]
  49. Debnath, T.; Park, S.; Kim, D.; Jo, J.; Lim, B. Anti-oxidant and anti-inflammatory activities of Inonotus obliquus and germinated brown rice extracts. Molecules 2013, 18, 9293–9304. [Google Scholar] [CrossRef]
  50. Aramwit, P.; Kanokpanont, S.; De-Eknamkul, W.; Kamei, K.; Srichana, T. The effect of sericin with variable amino-acid content from different silk strains on the production of collagen and nitric oxide. J. Biomater. Sci. Polym. Ed. 2009, 20, 1295–1306. [Google Scholar] [CrossRef]
  51. Philips, N.; Auler, S.; Hugo, R.; Gonzalez, S. Beneficial regulation of matrix metalloproteinases for skin health. Enzyme Res. 2011, 2011, 427285. [Google Scholar] [CrossRef] [PubMed]
  52. Demaria, M.; Desprez, P.Y.; Campisi, J.; Velarde, M.C. Cell autonomous and non-autonomous effects of senescent cells in the skin. J. Investig. Dermatol. 2015, 135, 1722–1726. [Google Scholar] [CrossRef] [PubMed]
  53. Wittenauer, J.; Mackle, S.; Sussmann, D.; Schweiggert-Weisz, U.; Carle, R. Inhibitory effects of polyphenols from grape pomace extract on collagenase and elastase activity. Fitoterapia 2015, 101, 179–187. [Google Scholar] [CrossRef] [PubMed]
  54. Bessada, S.M.F.; Alves, R.C.; Oliveira, M.B.P.P. Coffee silverskin: A review on potential cosmetic applications. Cosmetics 2018, 5, 5. [Google Scholar] [CrossRef]
  55. Amnuaikit, T.; Maneenuan, D.; Boonme, P. Evaluation of caffeine gels on physicochemical characteristics and in vivo efficacy in reducing puffy eyes. J. Appl. Pharm. Sci. 2011, 1, 56–59. [Google Scholar]
  56. Gebeyehu, B.T.; Bikila, S.L. Determination of caffeine content and antioxidant activity of coffee. Am. J. Appl. Chem. 2015, 3, 69–76. [Google Scholar] [CrossRef]
  57. Van de Sandt, J.J.M.; Van Burgsteden, J.A.; Cage, S.; Carmichael, P.L.; Dick, I.; Kenyon, S.; Williams, F.M. In vitro predictions of skin absorption of caffeine, testosterone, and benzoic acid: A multi-centre comparison study. Regul. Toxicol. Pharmacol. 2004, 39, 271–281. [Google Scholar] [CrossRef]
  58. Meesen, S. In Vitro Percutaneous Absorption of Caffeine from Emulsions for Cosmetic Formulation Development. Ph.D. Thesis, Prince of Songkla University, Songkhla, Thailand, 2011. [Google Scholar]
  59. Thakur, R.; Batheja, P.; Kaushik, D.; Michniak, B. Structural and biochemical changes in aging skin and their impact on skin permeability barrier. In Skin Aging Handbook; William Andrew Publishing: Norwich, NY, USA, 2009; pp. 55–90. [Google Scholar]
  60. Wallen-Russell, C. Is there a relationship between transepidermal water loss and microbial biodiversity on the skin? Cosmetics 2019, 6, 18. [Google Scholar] [CrossRef]
  61. Brandner, J.M.; Behne, M.J.; Huesing, B.; Moll, I. Caffeine improves barrier function in male skin. Int. J. Cosmet. Sci. 2006, 28, 343–347. [Google Scholar] [CrossRef]
  62. Li, H.R.; Habasi, M.; Xie, L.Z.; Aisa, H.A. Effect of chlorogenic acid on melanogenesis of B16 melanoma cells. Molecules 2014, 19, 12940–12948. [Google Scholar] [CrossRef]
  63. Shields, H.J.; Traa, A.; Van Raamsdonk, J.M. Beneficial and detrimental effects of reactive oxygen species on lifespan: A comprehensive review of comparative and experimental studies. Front. Cell Dev. Biol. 2021, 9, 628157. [Google Scholar] [CrossRef]
  64. Buranasirin, P.; Pongpirul, K.; Meephansan, J. Development of a global subjective skin aging assessment score from the perspective of dermatologists. BMC Res. Notes 2019, 12, 364. [Google Scholar] [CrossRef] [PubMed]
  65. Dobrev, H.P. A study of human skin mechanical properties by means of Cutometer. Folia Med. 2002, 44, 5–10. [Google Scholar]
  66. Farage, M.A.; Miller, K.W.; Elsner, P.; Maibach, H.I. Structural characteristics of the aging skin: A review. Cutan. Ocul. Toxicol. 2007, 26, 343–357. [Google Scholar] [CrossRef] [PubMed]
  67. Tobin, D.J. Introduction to skin aging. J. Tissue Viability 2017, 26, 37–46. [Google Scholar] [CrossRef]
  68. Rodrigues, F.; Matias, R.; Ferreira, M.; Amaral, M.H.; Oliveira, M.B. In vitro and in vivo comparative study of cosmetic ingredients coffee silverskin and hyaluronic acid. Exp. Dermatol. 2016, 25, 572–574. [Google Scholar] [CrossRef]
  69. Dewi, S.R.; Cahyono, A.; Anggana Rafika, P.; Mawardi, P. The Comparison of the Effects of Caffeine Topical 0.25% and 0.5% as Anti-wrinkle Therapy. In Proceedings of the 23rd Regional Conference of Dermatology (RCD 2018), Surabaya, Indonesia, 8–11 August 2018; SciTePress: Setúbal, Portugal, 2021; pp. 113–117. [Google Scholar]
  70. Duangjai, A.; Utsintong, M.; Saokaew, S. Coffee (Coffea arabica L.) pulp extracts as a potential source of whitening agents. Int. J. Pharm. Sci. Rev. Res. 2020, 64, 123–127. [Google Scholar]
  71. Kiattisin, K.; Intasai, N.; Nitthikan, N.; Nantarat, T.; Kuan-Han, L.; Lin, W.; Lue, S.; Leelapornpisid, P. Antioxidant, anti-tyrosinase, anti-aging potentials and safety of arabica coffee cherry extract. Chiang Mai J. Sci. 2019, 46, 930–945. [Google Scholar]
  72. Seo, S.B.; Kim, Y.M. Implications for beneficial effects on cosmetic activity by optimizing the 4 coffee variety extraction process. Nat. Prod. Commun. 2019, 14, 1934578X19857363. [Google Scholar] [CrossRef]
  73. Huang, H.C.; Wei, C.M.; Siao, J.H.; Tsai, T.C.; Ko, W.P.; Chang, K.J.; Hii, C.H.; Chang, T.M. Supercritical fluid extract of spent coffee grounds attenuates melanogenesis through downregulation of the PKA, PI3K/Akt, and MAPK signaling pathways. eCAM 2016, 2016, 5860296. [Google Scholar] [CrossRef]
  74. Li, Y.F.; Ouyang, S.H.; Tu, L.F.; Wang, X.; Yuan, W.L.; Wang, G.E.; He, R.R. Caffeine protects skin from oxidative stress-induced senescence through the activation of autophagy. Theranostics 2018, 8, 5713. [Google Scholar] [CrossRef] [PubMed]
  75. Lee, J.H.; Park, J.; Shin, D.W. The molecular mechanism of polyphenols with anti-aging activity in aged human dermal fibroblasts. Molecules 2022, 27, 4351. [Google Scholar] [CrossRef] [PubMed]
  76. Marx, S. Guidelines on Stability Testing of Cosmetic Products; European Cosmetic Toiletry and Perfumery Asociation: Colipa, Mexico, 2004. [Google Scholar]
  77. Mattiasson, J. Method Development of an In Vitro Vertical Franz Diffusion Cell System to Assess Permeation of Cosmetic Active Ingredients. Master’s Thesis, Uppsala University, Uppsala, Sweden, 2020. [Google Scholar]
  78. Vichit, W.; Saewan, N. Antioxidant activities and cytotoxicity of Thai pigmented rice. Int. J. Pharm. Pharm. Sci. 2015, 7, 329–334. [Google Scholar]
  79. Vichit, W.; Saewan, N. Effect of germination on antioxidant, anti-inflammatory and keratinocyte proliferation of rice. Int. Food Res. J. 2016, 23, 2006–2015. [Google Scholar]
  80. Baldisserotto, A.; Buso, P.; Radice, M.; Dissette, V.; Lampronti, I.; Gambari, R.; Manfredini, S.; Vertuani, S. Moringa oleifera leaf extracts as multifunctional ingredients for “natural and organic” sunscreens and photoprotective preparations. Molecules 2018, 23, 664. [Google Scholar] [CrossRef]
Figure 1. Chromatogram of the CBE by HPLC.
Molecules 28 06830 g001
Figure 2. Appearance of L-CBE before (A) and after (B) size reduction.
Molecules 28 06830 g002
Figure 3. Stability of the CBE and the L-CBE at various storage conditions.
Molecules 28 06830 g003
Figure 4. In vitro permeation of total phenolic content of the free CBE compared to the L-CBE.
Molecules 28 06830 g004
Figure 5. Cytotoxicity of various concentrations of the CBE and L-CBE on HDF cells.
Molecules 28 06830 g005
Figure 6. The superoxide dismutase (A), nitric oxide inhibition (B), and anti-collagenase (C) activities of the CBE and L-CBE on HDF cells.
Molecules 28 06830 g006aMolecules 28 06830 g006b
Figure 7. Emulsion cream base (A) with the CBE (B) and the L-CBE (C).
Molecules 28 06830 g007
Figure 8. Changing percentage of elasticity (R2) of each volunteer subject after application of B cream.
Molecules 28 06830 g008
Figure 9. Changing percentage of elasticity (R2) of each volunteer subject after application of CBE cream.
Molecules 28 06830 g009
Figure 10. Changing percentage of elasticity (R2) of each volunteer subject after application of the L-CBE cream.
Molecules 28 06830 g010
Figure 11. Changing percentage of elasticity (R2) of all volunteer subject subjects after product application. Data with different letters (A, B, and C) indicate significant differences (p < 0.05) between creams.
Molecules 28 06830 g011
Figure 12. Changing percentage of elasticity (R5) of each volunteer subject after application of B cream.
Molecules 28 06830 g012
Figure 13. Changing percentage of elasticity (R5) of each volunteer subject after application of CBE cream.
Molecules 28 06830 g013
Figure 14. Changing percentage of elasticity (R5) of each volunteer subject after application of L-CBE cream.
Molecules 28 06830 g014
Figure 15. Changing percentage of elasticity (R5) of all volunteer subject subjects after product application. Data with different letters (A, B, and C) indicate significant differences (p < 0.05) between creams.
Molecules 28 06830 g015
Figure 16. Changing percentage of elasticity (R7) of each volunteer subject after application of B cream.
Molecules 28 06830 g016
Figure 17. Changing percentage of elasticity (R7) of each volunteer subject after application of CBE cream.
Molecules 28 06830 g017
Figure 18. Changing percentage of elasticity (R7) of each volunteer subject after application of L-CBE cream.
Molecules 28 06830 g018
Figure 19. Changing percentage of elasticity (R7) in all volunteer subjects after product application. Data with different letters (A, B, and C) indicate significant differences (p < 0.05) between creams.
Molecules 28 06830 g019
Figure 20. Changing percentage of melanin content of each volunteer subject after application of B cream.
Molecules 28 06830 g020
Figure 21. Changing percentage of melanin content of each volunteer subject after application of CBE cream.
Molecules 28 06830 g021
Figure 22. Changing percentage of melanin content of each volunteer subject after application of L-CBE cream.
Molecules 28 06830 g022
Figure 23. Changing percentage of melanin content of all volunteer subjects after product application. Data with different letters (A, B, and C) indicate significant differences (p < 0.05) among creams.
Molecules 28 06830 g023
Table 1. The formulation of the CBE and L-CBE creams.
PartIngredients% w/wFunction
AWaterq.s. to 100Solvent
Butylene Glycol2.0Humectant
Glycerin5.0Humectant
BGlyceryl Stearate SE1.2Emulsifier
Cetearyl Alcohol1.5Emollient
Glyceryl Stearate SE (and) PEG-100 Stearate1.5Emulsifier
CAcrylates/Acrylamide Copolymer (and) Mineral Oil (and) Polysorbate 851.5Thickener/Emulsifier
DPhenoxyethanol0.8Preservative
CBE or L-CBE5.0Active
Table 2. Scores for erythema, edema, and other skin irritations.
ScoresClinical Description
ErythemaEdema
0No erythemaNo edema
1Light erythema (hardly visible)Light edema (hardly visible)
2Clearly visible erythemaLight edema
3Moderate erythemaModerate edema (about 1 mm raised skin)
4Serious erythema (dark red with possible formation of light scars)Strong edema (extended swelling even beyond the application area)
Table 3. Classification of M.I.I. (according to the amended Draize classification).
M.I.IClassification
<0.50Non-irritation
From 0.50 to <2.00Slightly irritation
From 2.00 to <5.00Moderately irritation
From 5.00 to <8.00Strongly irritation
Disclaimer/Publisher’s Note: The statements, opinions and data contained in all publications are solely those of the individual author(s) and contributor(s) and not of MDPI and/or the editor(s). MDPI and/or the editor(s) disclaim responsibility for any injury to people or property resulting from any ideas, methods, instructions or products referred to in the content.

