2. Results
The acetone extract of
S. nanolobata was portioned between Et
2O and H
2O to afford the Et
2O-soluble fraction, which was subjected to silica gel column chromatography to yield 12 subfractions. The subfractions were further purified using repeated silica gel, Sephadex LH-20, and reversed-phase HPLC to afford compounds
1–
7. The known compounds were rapidly characterized as grandilobatin D (
5) [
6], 11,12-epoxy-1
E,3
E,7
E-cembratrien-15-ol (
6) [
15], and casbene (
7) [
16] by comparing the observed and reported spectroscopic data.
Compound
1 was obtained as an optically active {[
α −13.5 (c 0.25, CHCl
3)} colorless oil. Its molecular formula, C
21H
34O
2, was determined using the HR-EIMS ion peak at
m/
z 318.2554 [M]
+ (calcd. for C
21H
34O
2,
Figure S1g), implying 5 degrees of unsaturation. The IR spectrum showed the presence of a carbonyl group (1708 cm
−1,
Figure S1h). The
1H NMR data (
Table 1) of
1 displayed two vinyl methyls at
δH 1.75 (3H, s) and 1.70 (3H, s), two tertiary methyls at
δH 1.29 (3H, s) and 1.30 (3H, s), a bimodal methyl at
δH 0.98 (3H, d,
J = 6.9 Hz), an oxymethyl at
δH 3.02 (3H, s), and three olefinic protons at
δH 6.17 (1H, d,
J = 10.7 Hz), 5.89 (1H, d,
J = 10.7 Hz), and 5.24 (1H, m), respectively. The
13C NMR data together with DEPT and HSQC spectra indicated the presence of 21 carbon signals, which were classified as 6 methyls, 6 methylenes, 4 methines, and 5 quaternary carbons. The aforementioned data revealed that
1 was a cembrane-type diterpenoid and closely resembled that of co-occurring known compound, grandilobatin D (
5) [
6], with the only difference being the methoxyl group at C-15 in
1 instead of the C-15 hydroxyl group in
5, which is in agreement with the mass data. This replacement caused the
13C NMR resonance of C-15 to be shifted downfield from
δC 73.9 to 78.2 in
1. The position of the methoxyl group at C-15 was further confirmed by the HMBC correlation from −OMe (
δH 3.02) to C-15 (
δC 78.2) (
Figure 2). The geometries of the double bonds at Δ
1,2, Δ
3,4, and Δ
7,8 were both assigned to be
E by the observed chemical shifts (<20 ppm) of the two vinyl methyls resonance at
δC 17.4 (C-18) and
δC 17.6 (C-19), along with the NOESY correlations of H-2 (
δH 6.17)/Me-18 (
δH 1.75), H-3 (
δH 5.89)/H
2-14 (
δH 2.23 and 1.97), and H-7 (
δH 5.24)/H
2-9 (
δH 3.03).
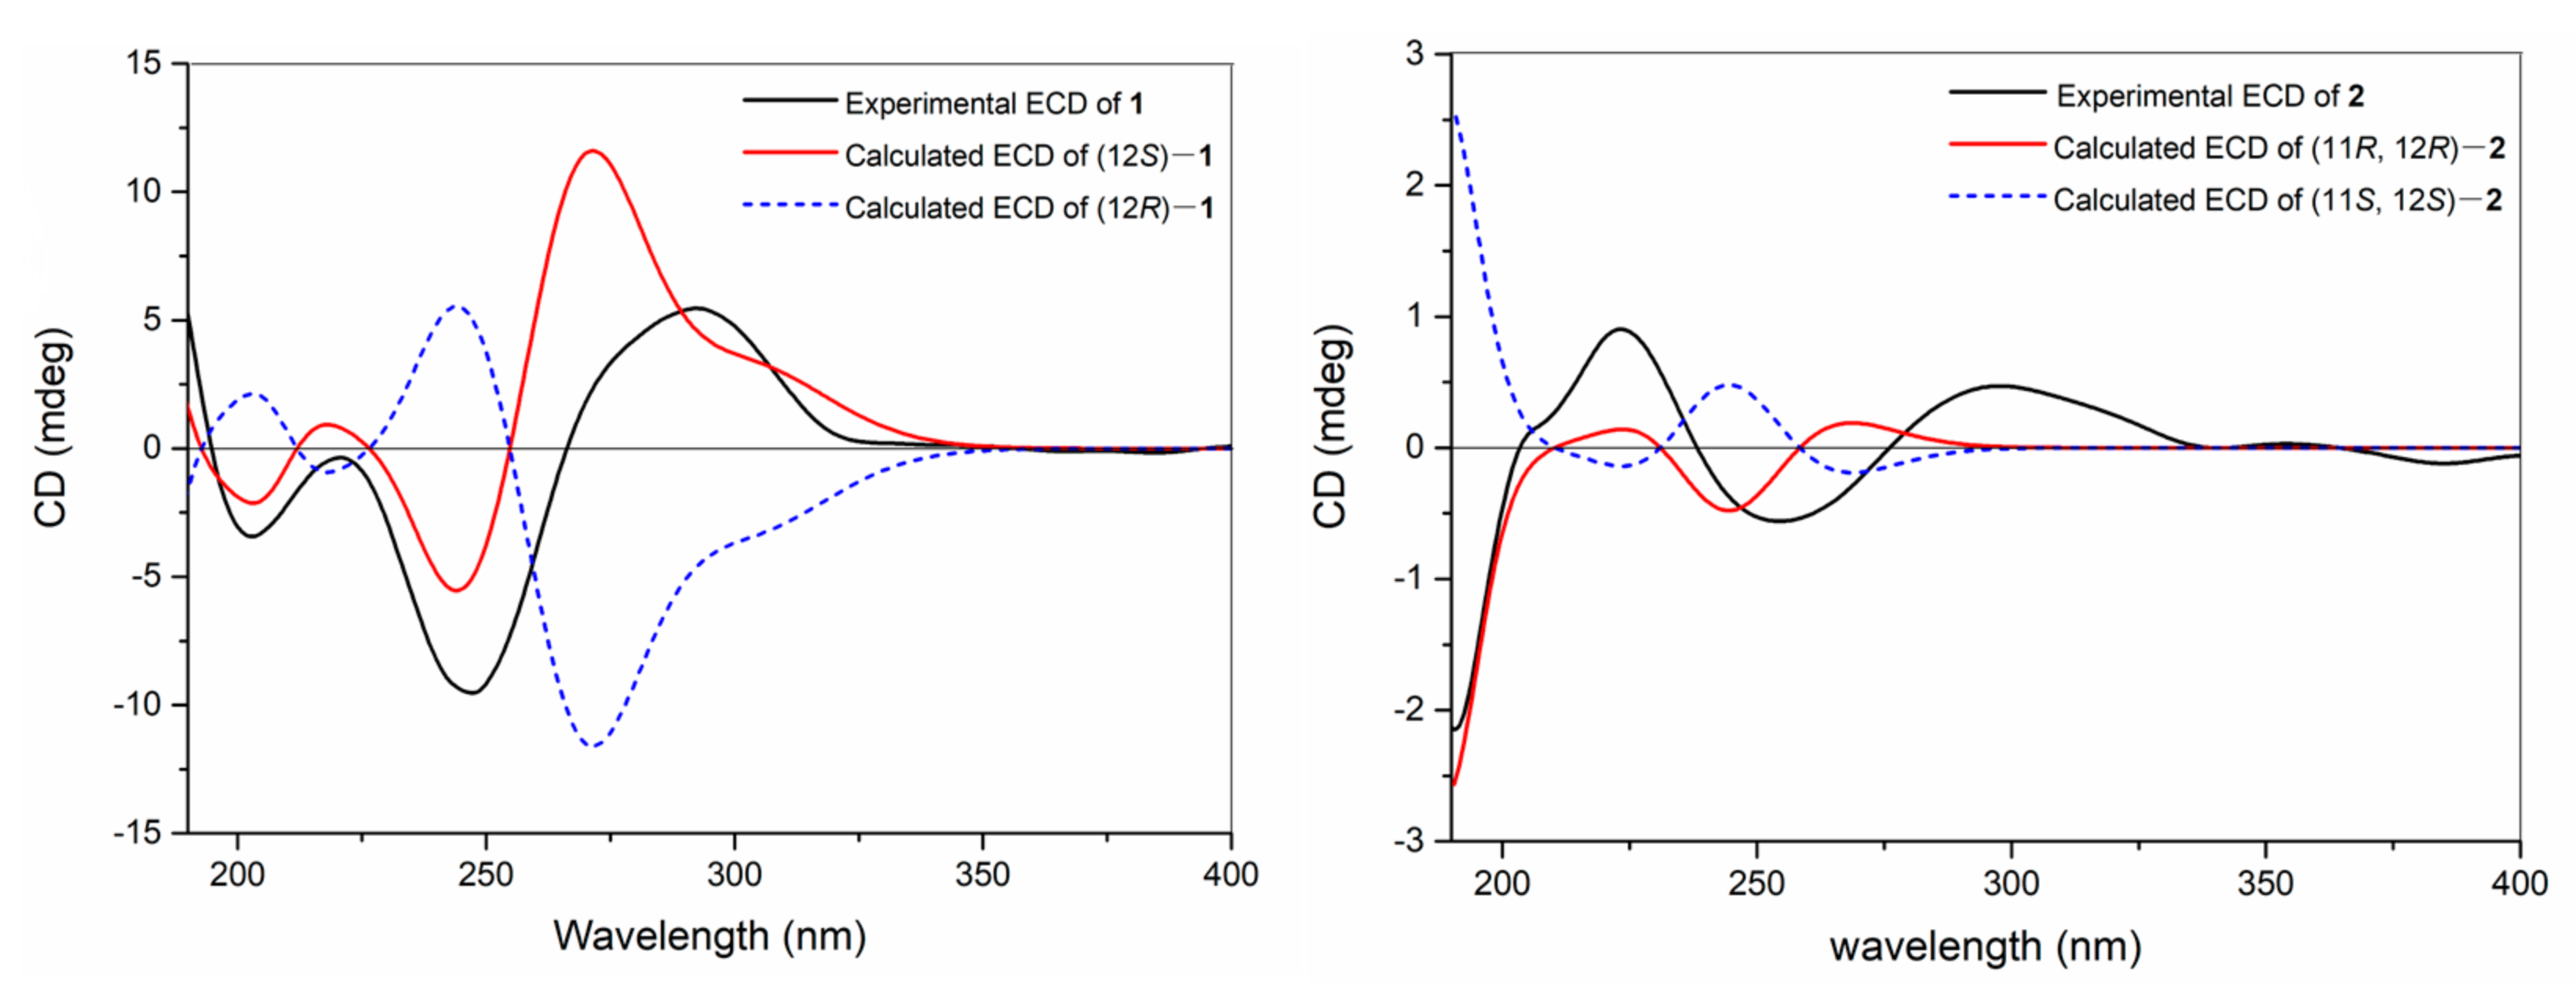
The TDDFT-ECD calculation was carried out to deduce the absolute configuration of
1, which has been proven to be a reliable structure elucidation method for the determination of the absolute configuration of natural products. In detail, torsional sampling conformational searches using MMFFs (Merck Molecular Force Field) were carried out by means of the conformational search module in the Macromodel by applying an energy window of 21 kJ/mol, which afforded 145 conformers for (12
S)-
1. The Boltzmann populations of the conformers were obtained based on the potential energy provided by the MMFFs, which afforded five conformers for re-optimization. The re-optimization and the following TDDFT calculations of the re-optimized geometries were all performed using Gaussian 09 at the B3LYP/6-311G(d,p) level with IEFPCM (Polarizable Continuum Model using the Integral Equation Formalism variant) solvent model for acetonitrile. Frequency analysis was performed as well to confirm that the re-optimized geometries were at the energy minima. Finally, the SpecDis 1.62 software was used to obtain the Boltzmann-averaged ECD spectra and visualize the results. Detailed comparison of the experimental ECD spectrum with those of calculated ones revealed that the Boltzmann-averaged ECD spectrum of (12
S)-
1 displayed an identical curve compared to the experimental one (
Figure 3). Consequently, the absolute configuration of
1 was determined as 12
S.
Compound
2, which was isolated as a colorless oil, gave the molecular formula C
21H
34O
2, the same as that of
1, on the basis of HR-EIMS ion peak at
m/
z 318.2558 [M]
+ (calcd. for C
21H
34O
2, 318.2553). The
1H and
13C NMR data (
Table 1) of
2 were virtually identical to those of the known co-isolated compound, 11,12-epoxy-1
E,3
E,7
E-cembratrien-15-ol (
6), with the exception of a methoxyl group at C-15 in
2 instead of the C-15 hydroxyl group in
6. The planar structure of
2 was further elucidated via
1H–
1H COSY and HMBC experiments (
Figure 2). The
E geometries of the double bonds Δ
3,4 and Δ
7,8 in
2 were determined using the chemical shifts (<20 ppm) of the C-18 (
δC 18.3) and C-19 (
δC 15.1) methyl groups, which were further confirmed by the NOESY cross-peaks of H-2 (
δH 6.14)/Me-18 (
δH 1.74), and H-7 (
δH 5.29)/H
2-9 (
δH 2.26) (
Figure 2). Moreover, the NOESY correlations of H-2/Me-16 (
δH 1.30) and H-3 (
δH 5.82)/H
2-14 (
δH 2.12 and 2.03) assigned the
E geometry of the double bond Δ
1,2. The relative configuration of C-11 and C-12 of
2 were suggested to be the same 11
R*, 12
R* as those of
6 due to the similar NMR data and the diagnostic NOESY relationships of H-11 (
δH 2.90)/H-13
β (
δH 1.33) and Me-20 (
δH 1.25)/H-10
β (
δH 1.45) (
Figure 2). The absolute configuration of
2 was established by the application of the TDDFT-ECD calculation method. In this case, conformational search afforded 171 conformers for (11
R, 12
R)-
2 and 5 conformers for re-optimization and the following TDDFT-ECD calculation. As shown in
Figure 3, the Boltzmann-averaged ECD spectrum of (11
R, 12
R)-
2 was matched to the experimental ECD spectrum of
2. Accordingly, the structure of
2 was elucidated as depicted in
Figure 1.
Compound
3 was also obtained as a colorless oil with the molecular formula of C
21H
34O
2 on the basis of HR-EIMS ion peak at
m/
z 318.2566 [M]
+ (calcd. for C
21H
34O
2, 318.2553). Analysis of the
1H and
13C NMR data of
3 (
Table 2) revealed similarities to
2, except for the location of the methoxyl group from the C-15 in
2 transferred to C-4 in
3, and accompanied by the isomerization of olefins from Δ
1,2 and Δ
3,4 to Δ
1,15 and Δ
2,3, respectively. These observations were supported by the HMBC correlations from the methyl protons Me-18 (
δH 1.31) to C-3 (
δC 130.5), C-4 (
δC 77.3), and C-5 (
δC 41.7); −OMe (
δH 3.07) to C-4 (
δC 77.3); Me-16 (
δH 1.81) to C-1 (
δC 129.5) and C-15 (
δC 131.7); and from the olefinic proton H-2 (
δH 5.71) to C-15 (
Figure 2). The large coupling constant (
J2,3 = 16.3 Hz) and the
13C chemical shift of the methyl group Me-19 (
δC 14.8) established the
E geometries of the double bonds Δ
2,3 and Δ
7,8. Its relative configuration at C-11 and C-12 was proven to be the same 11
R* and 12
R* as those of
2 on the basis of the NOESY experiment (
Figure 2). The whole relative configuration of the remaining chiral center C-4 and the distant stereochemical domain C-11/C-12 were defined using the QM-NMR calculation and DP4+ analysis [
17,
18]. These calculation methods utilize Bayes’s theorem to estimate the probability of the selected candidate being correct. The common stages included the generation of plausible isomers and conformational search for each isomer in the gas phase using the MMFFs as applied in the Macromodel software Schrodinger2015-2. Finally, the NMR parameters on the two possible candidate isomers (
Figure S5a,
3a: 4
R*, 11
R*, and 12
R*;
3b: 4
S*, 11
R*, and 12
R*) were calculated by the means of gauge including atomic orbitals (GIAO) method at the mPW1PW91/6-31+G(d) level of theory following the DP4+ protocols. As a result, the experimentally observed NMR data of
3 gave the best match of over 99% to the
3b isomer (
Figure S5b).
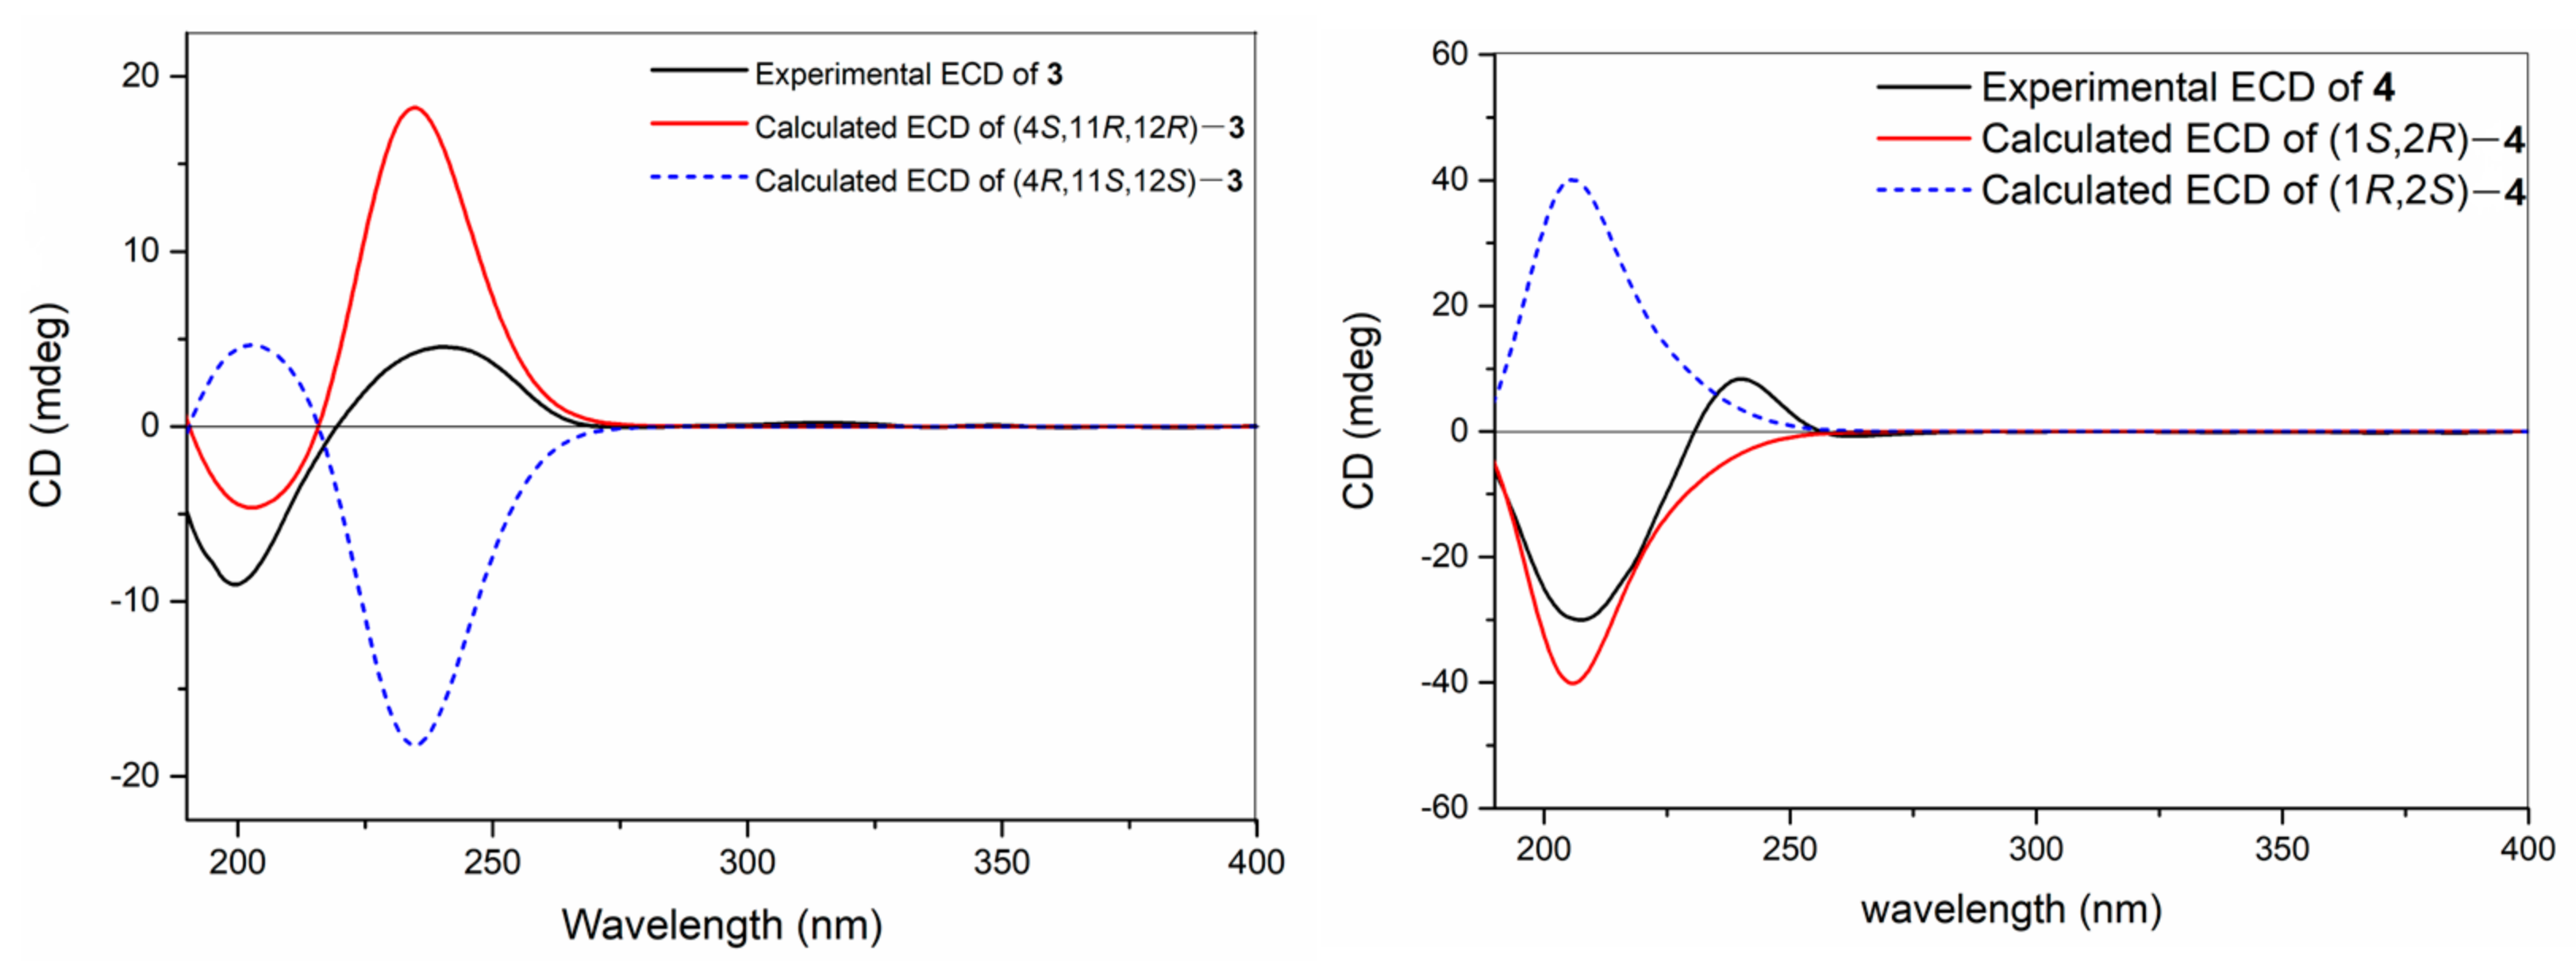
With the relative configuration assigned, the following task was the determination of the absolute configuration of
3. Similarly, TDDFT-ECD calculation method was again applied in this case to determine the absolute configuration of
3. The conformational search of isomer (4
S, 11
R, 12
R)-
3 afforded 125 conformers and obtained 5 conformers with Boltzmann populations of more than 1% for the following re-optimization and TDDFT-ECD calculations. As shown in
Figure 4, the Boltzmann-averaged ECD spectrum of (4
S, 11
R, and 12
R)-
3 highly matched the experimental ECD curve of
3. In light of these evidence, the structure of compound
3 was established as depicted in
Figure 1.
Compound
4 was isolated as a colorless oil, possessing the molecular formula of C
20H
30 by the HR-EIMS ion peak at
m/
z 270.2342 [M]
+ (calcd. for C
20H
30, 270.2342), suggesting that
4 possessed 6 degrees of unsaturation. The
1H and
13C NMR data (
Table 2) of
4 resembled those of the known co-isolated compound, casbene (
7), with the exception of a conjugated terminal double bond in
4 instead of the vinyl methyl in
7. This replacement caused the presence of another three olefinic protons and the absence of a methyl signal in the
1H NMR of
4. The planar structure of
4 was further confirmed by the analysis of its
1H–
1H COSY and HMBC correlations (
Figure 2). The geometries of the double bonds Δ
3,4 and Δ
7,8 were assigned to be both
E by the shielded carbon resonances of the two vinyl methyls at
δC 15.8 (C-18) and 18.0 (C-19), along with the obvious NOESY correlations of Me-18 (
δH 1.65)/H-2 (
δH 1.32) and Me-19 (
δH 1.64)/H
2-6 (
δH 2.16) (
Figure 2). Moreover, the large coupling constants (
J10,11 = 16.2 Hz) between H-10 and H-11 established the
E geometry of the double bond Δ
10,11. The 1,2-
cis-configuration of C-1 and C-2 was determined by the NOE relationships of H-1/H-2/Me-16 (
Figure 2) and the large ∆
δC value (13.1 ppm) between the gem-dimethyls C-16 (
δC 29.2) and C-17 (
δC 16.1). Moreover, the TDDFT-ECD calculation method was also applied to determine the absolute configuration of
4. As a result, the Boltzmann-averaged ECD spectrum of (1
S, 2
R)-
4 highly matched to the experimental one, while the ECD profile of enantiomer (1
R, 2
S)-
4 showed completely opposite curve (
Figure 4). Consequently, the absolute configuration of
4 was determined to be 1
S, 2
R.
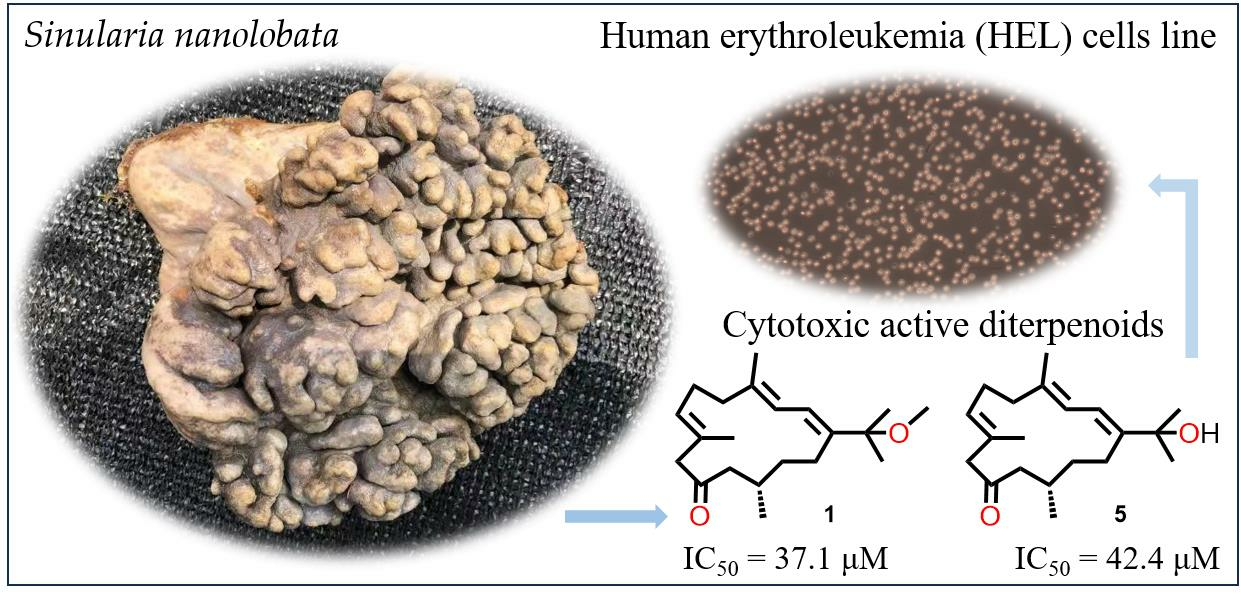
In the in vitro bioassay, cembrane-type diterpenoids have been well documented to display the growth inhibitory activities against various cancer cell lines [
19]. Accordingly, the cytotoxic activities of all the isolated compounds
1–
7 were evaluated in vitro against HEL (human erythroleukemia cells), H1975 (human lung adenocarcinoma cells), A549 (human non-small cell lung cancer cells), H1299 (human non-small cell lung cancer cells), and MDA-MB-231 (human breast cancer cells) by using the CCK8 and MTT methods. The dose-dependent assay was performed for the determination of IC
50 values for the active compounds, and only compounds
1 and
5 exhibited medium cytotoxic activities against HEL cells with IC
50 values of 37.09 and 42.37 μM, respectively, compared to that of the positive control doxorubicin (IC
50 = 0.05 μM for HEL). In light of the above data, the primary structure–activity relationships of
1–
7 were summarized, and the moderate potency of
1,
5 and the inactivity of
2–
4,
6,
7 suggested that the carbonyl group at C-10 seemed to have a significant impact on the cytotoxic activity against the tested cell lines. Furthermore, the structural comparison for the pair of
1 and
5 revealed that the substitutes at C-15 also contributed to the activity.
4. Materials and Methods
4.1. The General Experimental Procedures
Optical rotations were measured on a Perkin-Elmer 241MC polarimeter (PerkinElmer, Fremont, CA, USA). IR spectra were recorded using a Nicolet 6700 spectrometer (Thermo Scientific, Waltham, MA, USA); peaks were reported in cm–1. The NMR spectra were measured at 300 K on Bruker DRX 400 and Avance 600 MHz NMR spectrometers (Bruker Biospin AG, Fallanden, Germany); chemical shifts were reported in parts per million (δ) in CDCl3 (δH reported referred to CHCl3 at 7.26 ppm; δC reported referred to CDCl3 at 77.16 ppm) and coupling constants (J) in Hz; assignments were supported by 1H–1H COSY, HSQC, HMBC, and NOESY experiments. EIMS and HR-EIMS spectra were recorded using a Finnigan-MAT-95 mass spectrometer (ThermoFisher Scientific, Waltham, USA). Semi-preparative HPLC was performed on an Agilent-1260 system equipped with a DAD G1315D detector using ODS-HG-5 (250 mm × 9.4 mm, 5 µm) by eluting with CH3OH–H2O or CH3CN–H2O system at 3 mL/min. Commercial silica gel (200−300 and 400−500 mesh; Qingdao, China) was used for column chromatography. Precoated SiO2 plates (HSGF-254; Yantai, China) were used for analytical TLC. Spots were detected using TLC under UV light or by heating after spraying with an anisaldehyde H2SO4 reagent. All solvents used for extraction and isolation were of analytical grade.
4.2. Biological Material
Specimens of titled animals were collected along the coast of Ximao Island, Hainan province, China, in May 2019, at a depth of −20 m, and were frozen immediately after collection. The high-definition photos and biological samples of the titled animals were sent to Hainan University, and the specimens were accordingly identified as S. nanolobata by Prof. Xiu-Bao Li. The voucher sample is available for inspection at the Shanghai Institute of Materia Medica, SIBS-CAS (No. 19-XD-12).
4.3. Extraction and Isolation
The frozen soft coral (856 g, dry weight after extraction) was extracted exhaustively with acetone at room temperature (3 × 5.0 L). The acetone extract (40 g) was then partitioned between Et2O (3 × 1.0 L) and H2O (3 × 1.0 L), and the Et2O-soluble fraction was concentrated under reduced pressure to obtain a brown residue (16.5 g). Subsequently, the residue was separated into 12 fractions (A-L) via gradient silica gel column chromatography. Fraction A (264 mg) was partially purified using semi-preparative RP-HPLC (CH3CN–H2O, 97:3, 3.0 mL/min) to yield compounds 4 (0.6 mg, tR = 24.4 min) and 7 (4.0 mg, tR = 29.8 min). Fraction G (583 mg) was initially chromatographed using a Sephadex LH-20 column and eluted with PE/DCM/MeOH (2:1:1), affording four subfractions (G1–G4). Purification of subfraction G3 using semi-preparative RP-HPLC (CH3CN–H2O, 60:40) yielded compounds 1 (2.5 mg, tR = 19.4 min), 2 (39.7 mg, tR = 20.8 min), and 3 (4.9 mg, tR = 21.7 min). Fraction H (356 mg) was further chromatographed using a Sephadex LH-20 column and eluted with PE/DCM/MeOH (2:1:1), affording five subfractions (H1–H5). Subfraction H3 was subsequently separated via silica gel column chromatography (300–400 mesh) and eluted with PE–DCM (1:1) to give compounds 5 (21.8 mg) and 6 (3.9 mg).
4.3.1. 12α-methyl-1E,3E,7E-cembratrien-10-one (1)
Colorless oil; [
α −13.5 (c 0.25 CHCl
3); IR (KBr)
νmax = 2928, 2871, 1708, 1456, 1376, 1154, 1072 cm
−1; UV (MeCN)
λmax 249.0 nm (log
ε 4.65);
1H and
13C NMR data, see
Table 1; HR-EIMS
m/
z 318.2554 [M]
+ (calcd. for C
21H
34O
2, 318.2553).
4.3.2. 15-methoxyl-11,12-epoxy-1E,3E,7E-cembratrien (2)
Colorless oil; [
α −2.8 (c 0.53 CHCl
3); IR (KBr)
νmax = 2977, 2937, 1144, 1071 cm
−1; UV (MeCN)
λmax 192.0 nm (log
ε 4.29);
1H and
13C NMR data, see
Table 1; HR-EIMS
m/
z 318.2558 [M]
+ (calcd. for C
21H
34O
2, 318.2553).
4.3.3. 4α-methoxyl-11,12-epoxy-1,2E,7E-cembratrien (3)
Colorless oil; [
α +9.9 (c 0.28 CHCl
3); IR (KBr)
νmax = 2974, 2934, 1374, 1075 cm
−1; UV (MeCN)
λmax 243.5 nm (log
ε 3.80);
1H and
13C NMR data, see
Table 2; HR-EIMS
m/
z 318.2566 [M]
+ (calcd. for C
21H
34O
2, 318.2553).
4.3.4. 2E,7E,10E,12-casbatetraen (4)
Colorless oil; [
α −96.7 (c 0.04 CHCl
3); IR (KBr)
νmax = 2923, 2853, 1456 cm
−1; CD (MeCN)
λ (∆ε) 207.5 (−3.94), 240.5 (+0.99); UV (MeCN)
λmax 203.0 nm (log
ε 4.05);
1H and
13C NMR data, see
Table 2; HR-EIMS
m/
z 270.2342 [M]
+ (calcd. for C
20H
30, 270.2342).
4.4. Computational Methods
Conformational searches were carried out using the torsional sampling (MCMM) method and the MMFFs force field. Conformers above 1% of the population were re-optimized at the B3LYP/6-311G(d,p) level using the IEFPCM solvent model for acetonitrile. Subsequently, NMR calculations were performed at the PCM/mPW1PW91/6-31G(d) level, as recommended for DP4+. NMR shielding constants were calculated by using the GIAO method. Finally, the shielding constants were averaged over the Boltzmann distribution obtained for each stereoisomer and correlated with the experimental NMR data. For the resulting geometries, ECD spectra were obtained via TDDFT calculations performed with Gaussian 09 using the same functional, basis set, and solvent model as the energy optimization. At last, the Boltzmann-averaged ECD spectra were obtained using SpecDis 1.62 software.
4.5. Bioactivity Assays
The cytotoxicity of compounds 1–7 was evaluated by using the CCK8 (HEL) and MTT (H1975, MDA MB-231, A549, and H1299) methods, with doxorubicin (DOX) as the positive control. The growth inhibition of compounds on cancer cells from different tissue sources was tested using five concentration gradients. The maximum concentration of the compounds was 50 μM, diluted five times, and the cancer cells were treated with five concentration gradients for 72 h. Compounds with the highest concentration of 50 μM and an inhibition rate greater than 60% were re-screened, and the half-maximal inhibition (IC50) values were calculated.


 ,
, 


