
The Prediction of Cu(II) Adsorption Capacity of Modified Pomelo Peels Using the PSO-ANN Model


Abstract
:
1. Introduction
2. Results and Discussion
2.1. Results Predicted from the ANN Model
2.2. Results Predicted from the PSO-ANN Model
2.3. Discussion
3. Materials and Methods
3.1. Database Description and Variable Analysis
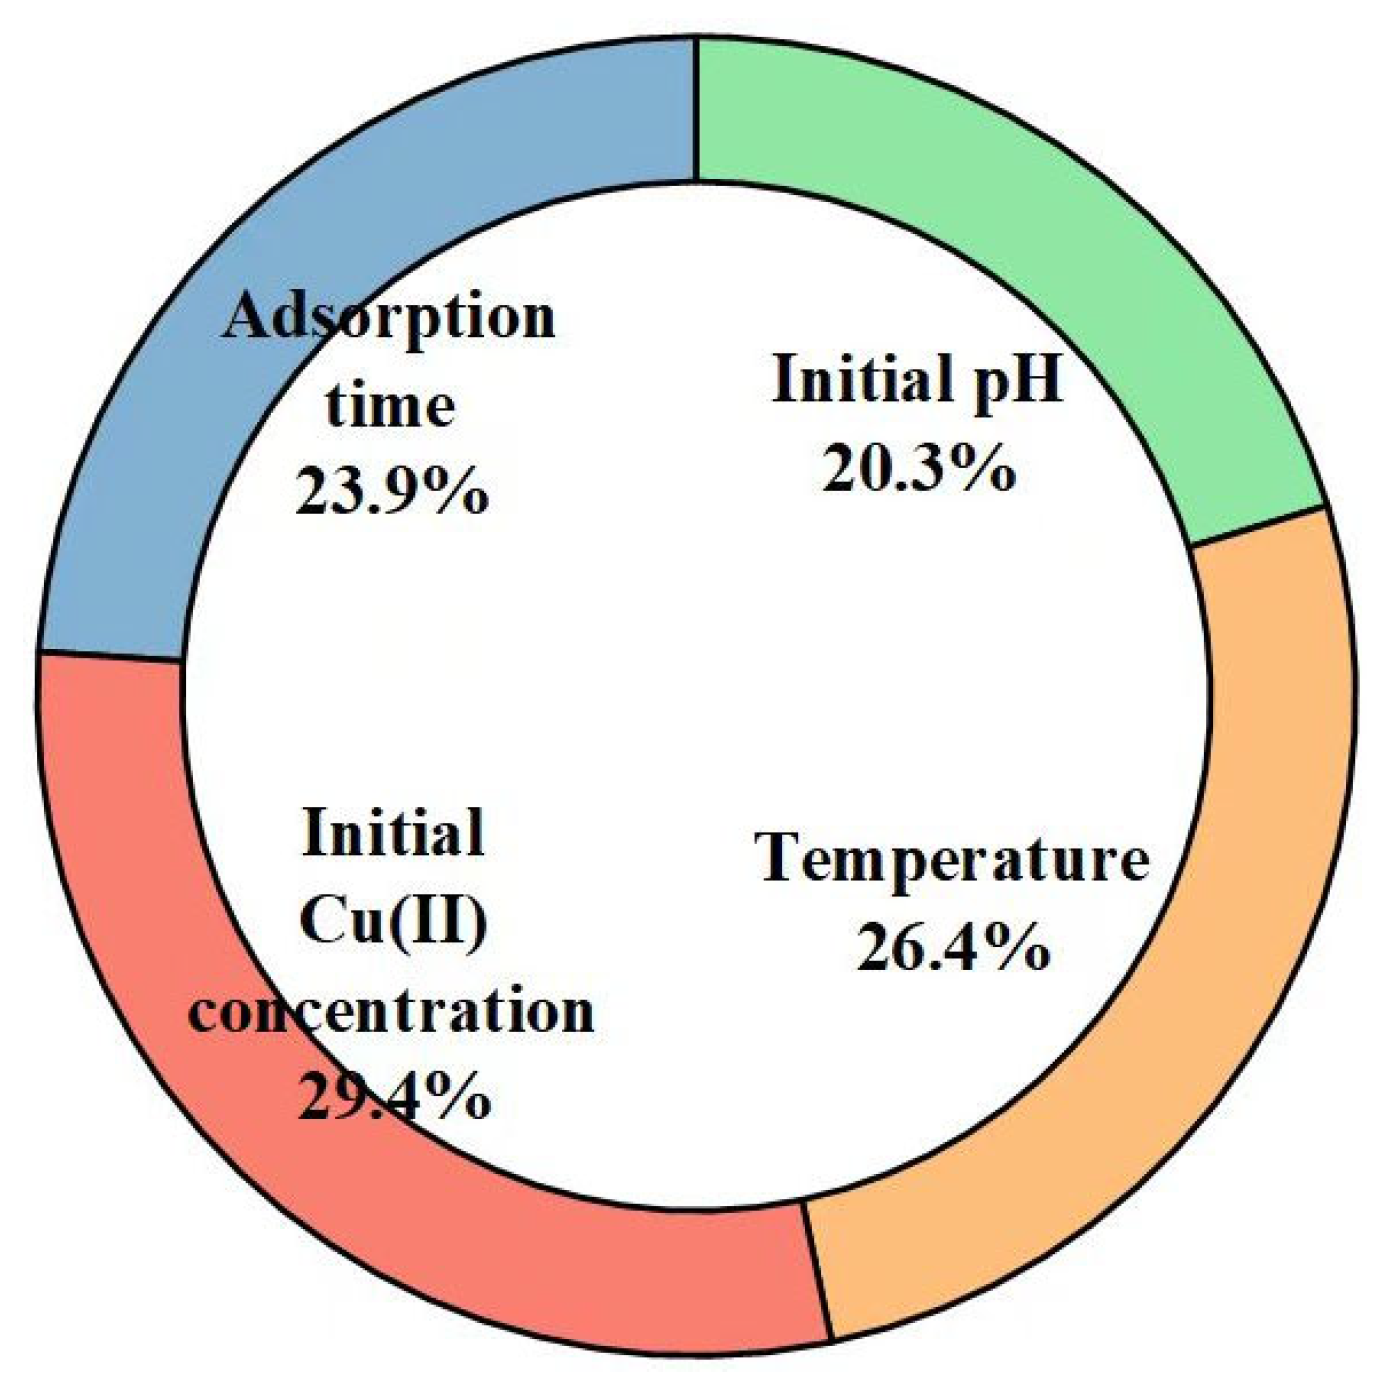
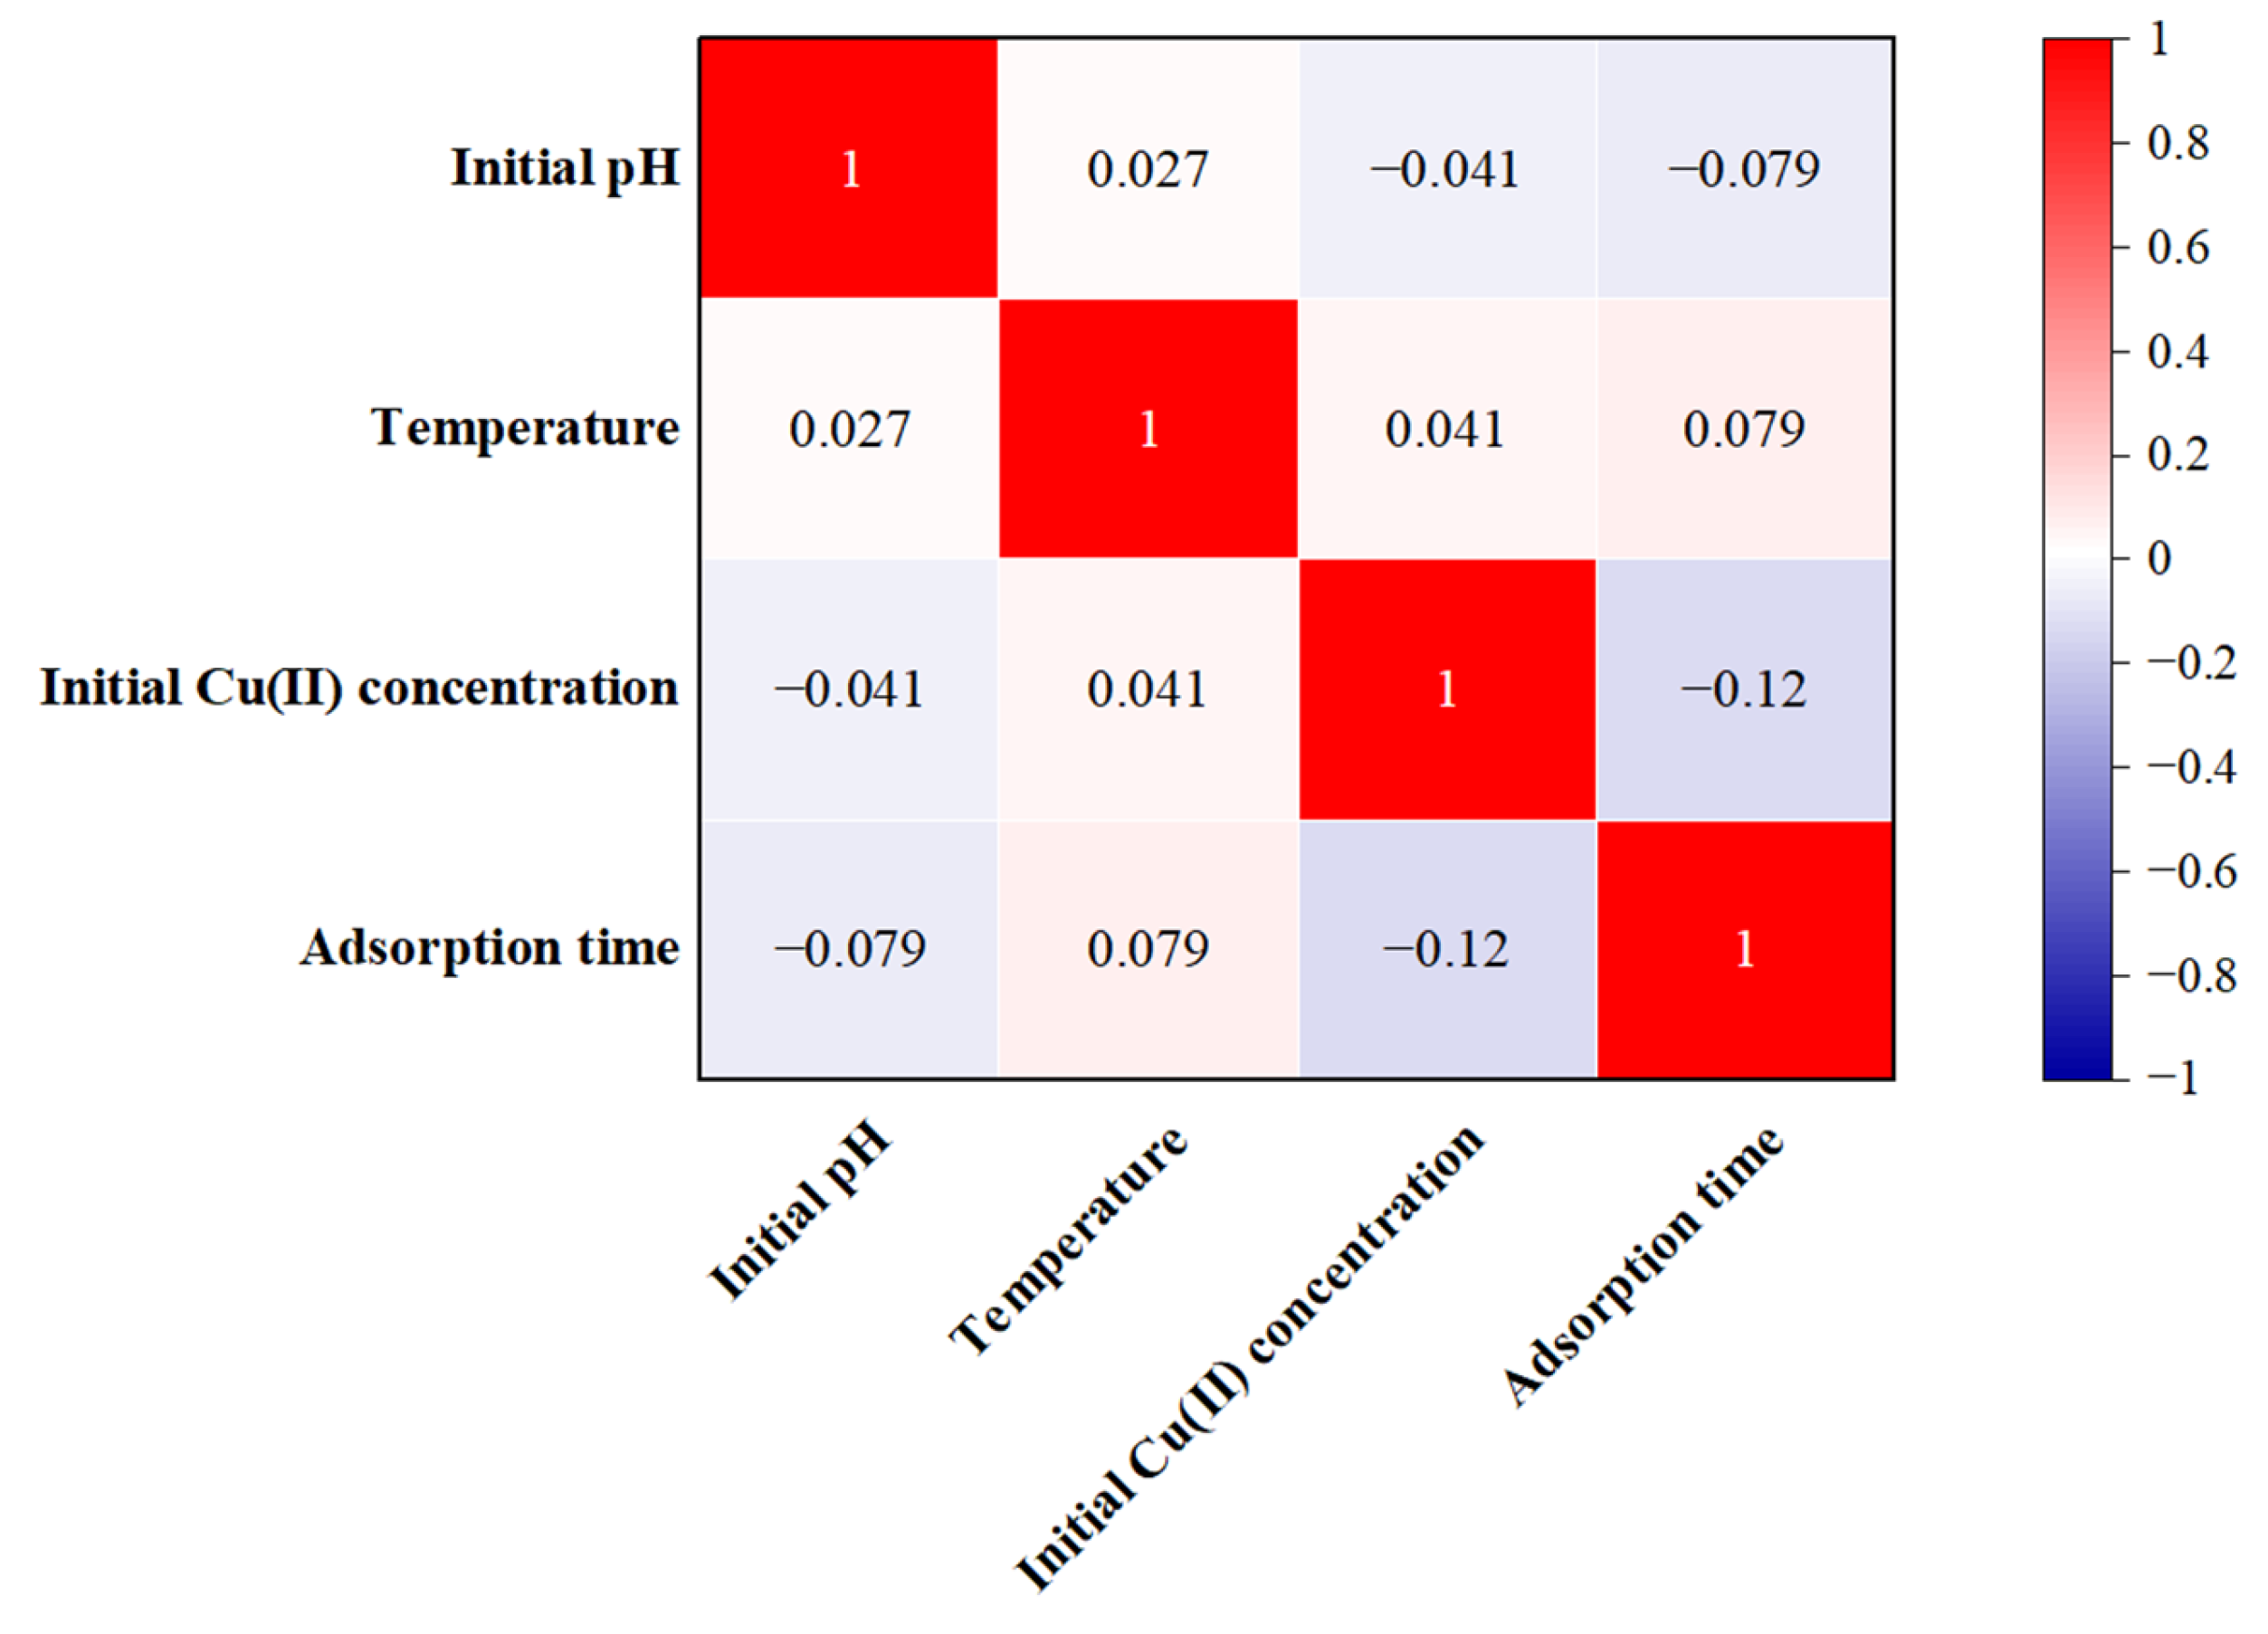
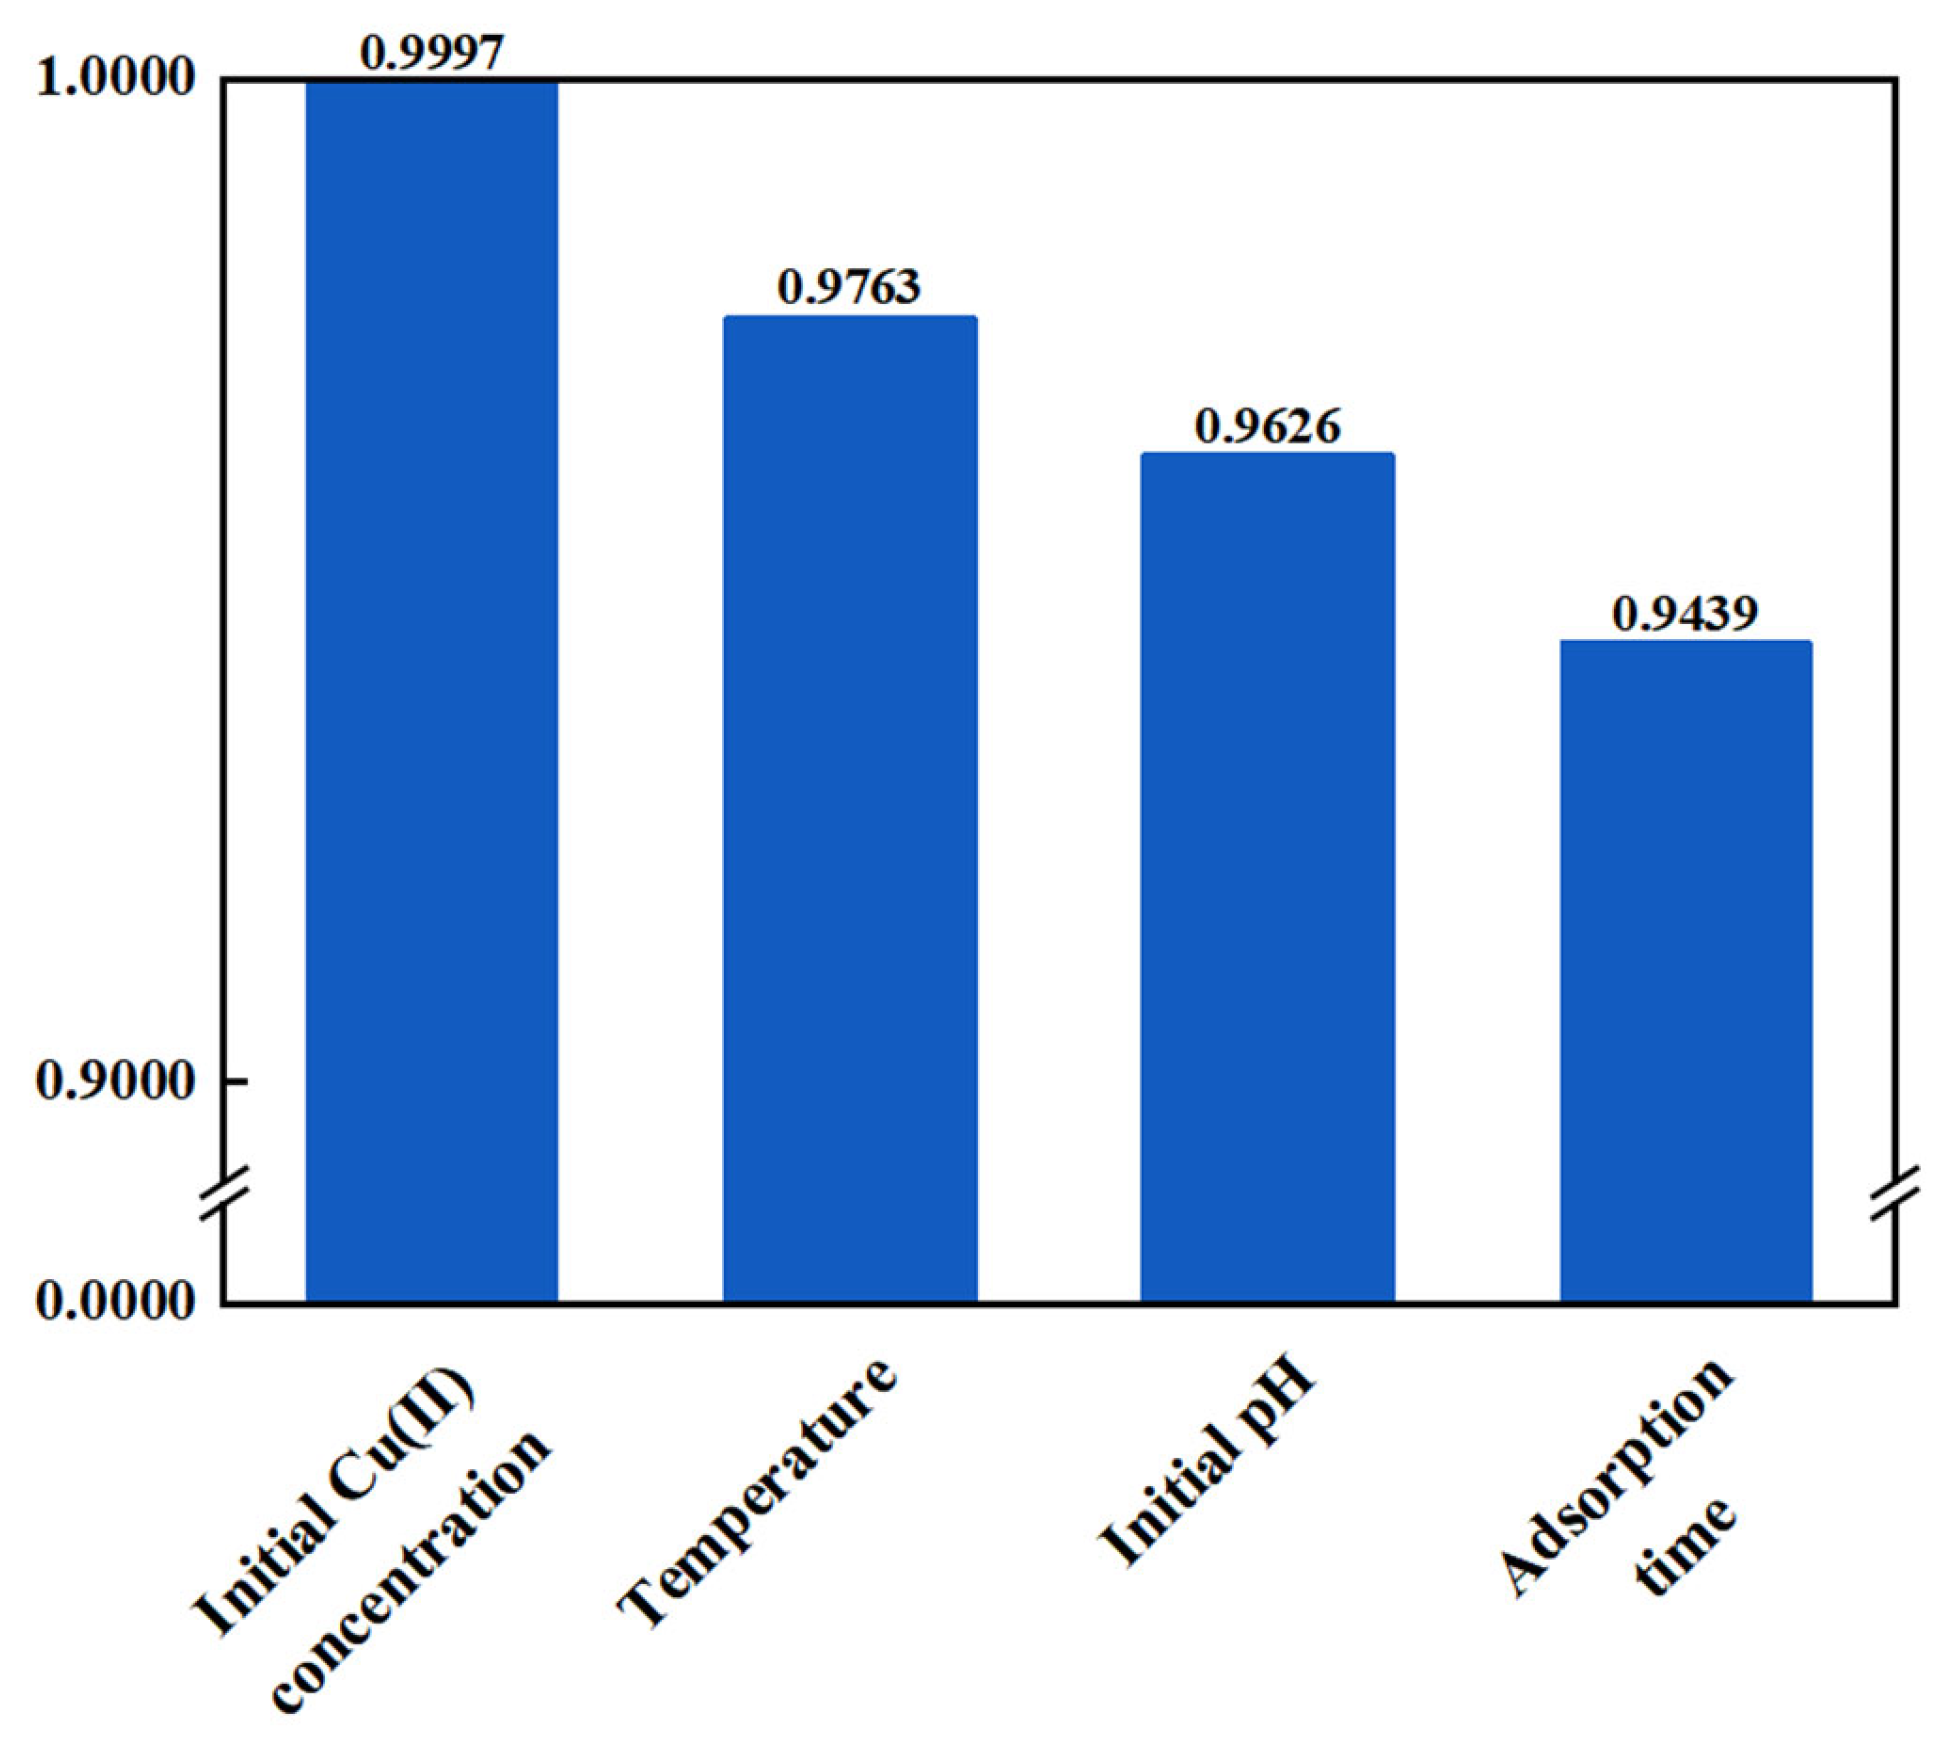
3.2. Sensitivity Factor Analysis of Input Variables
3.3. Methods
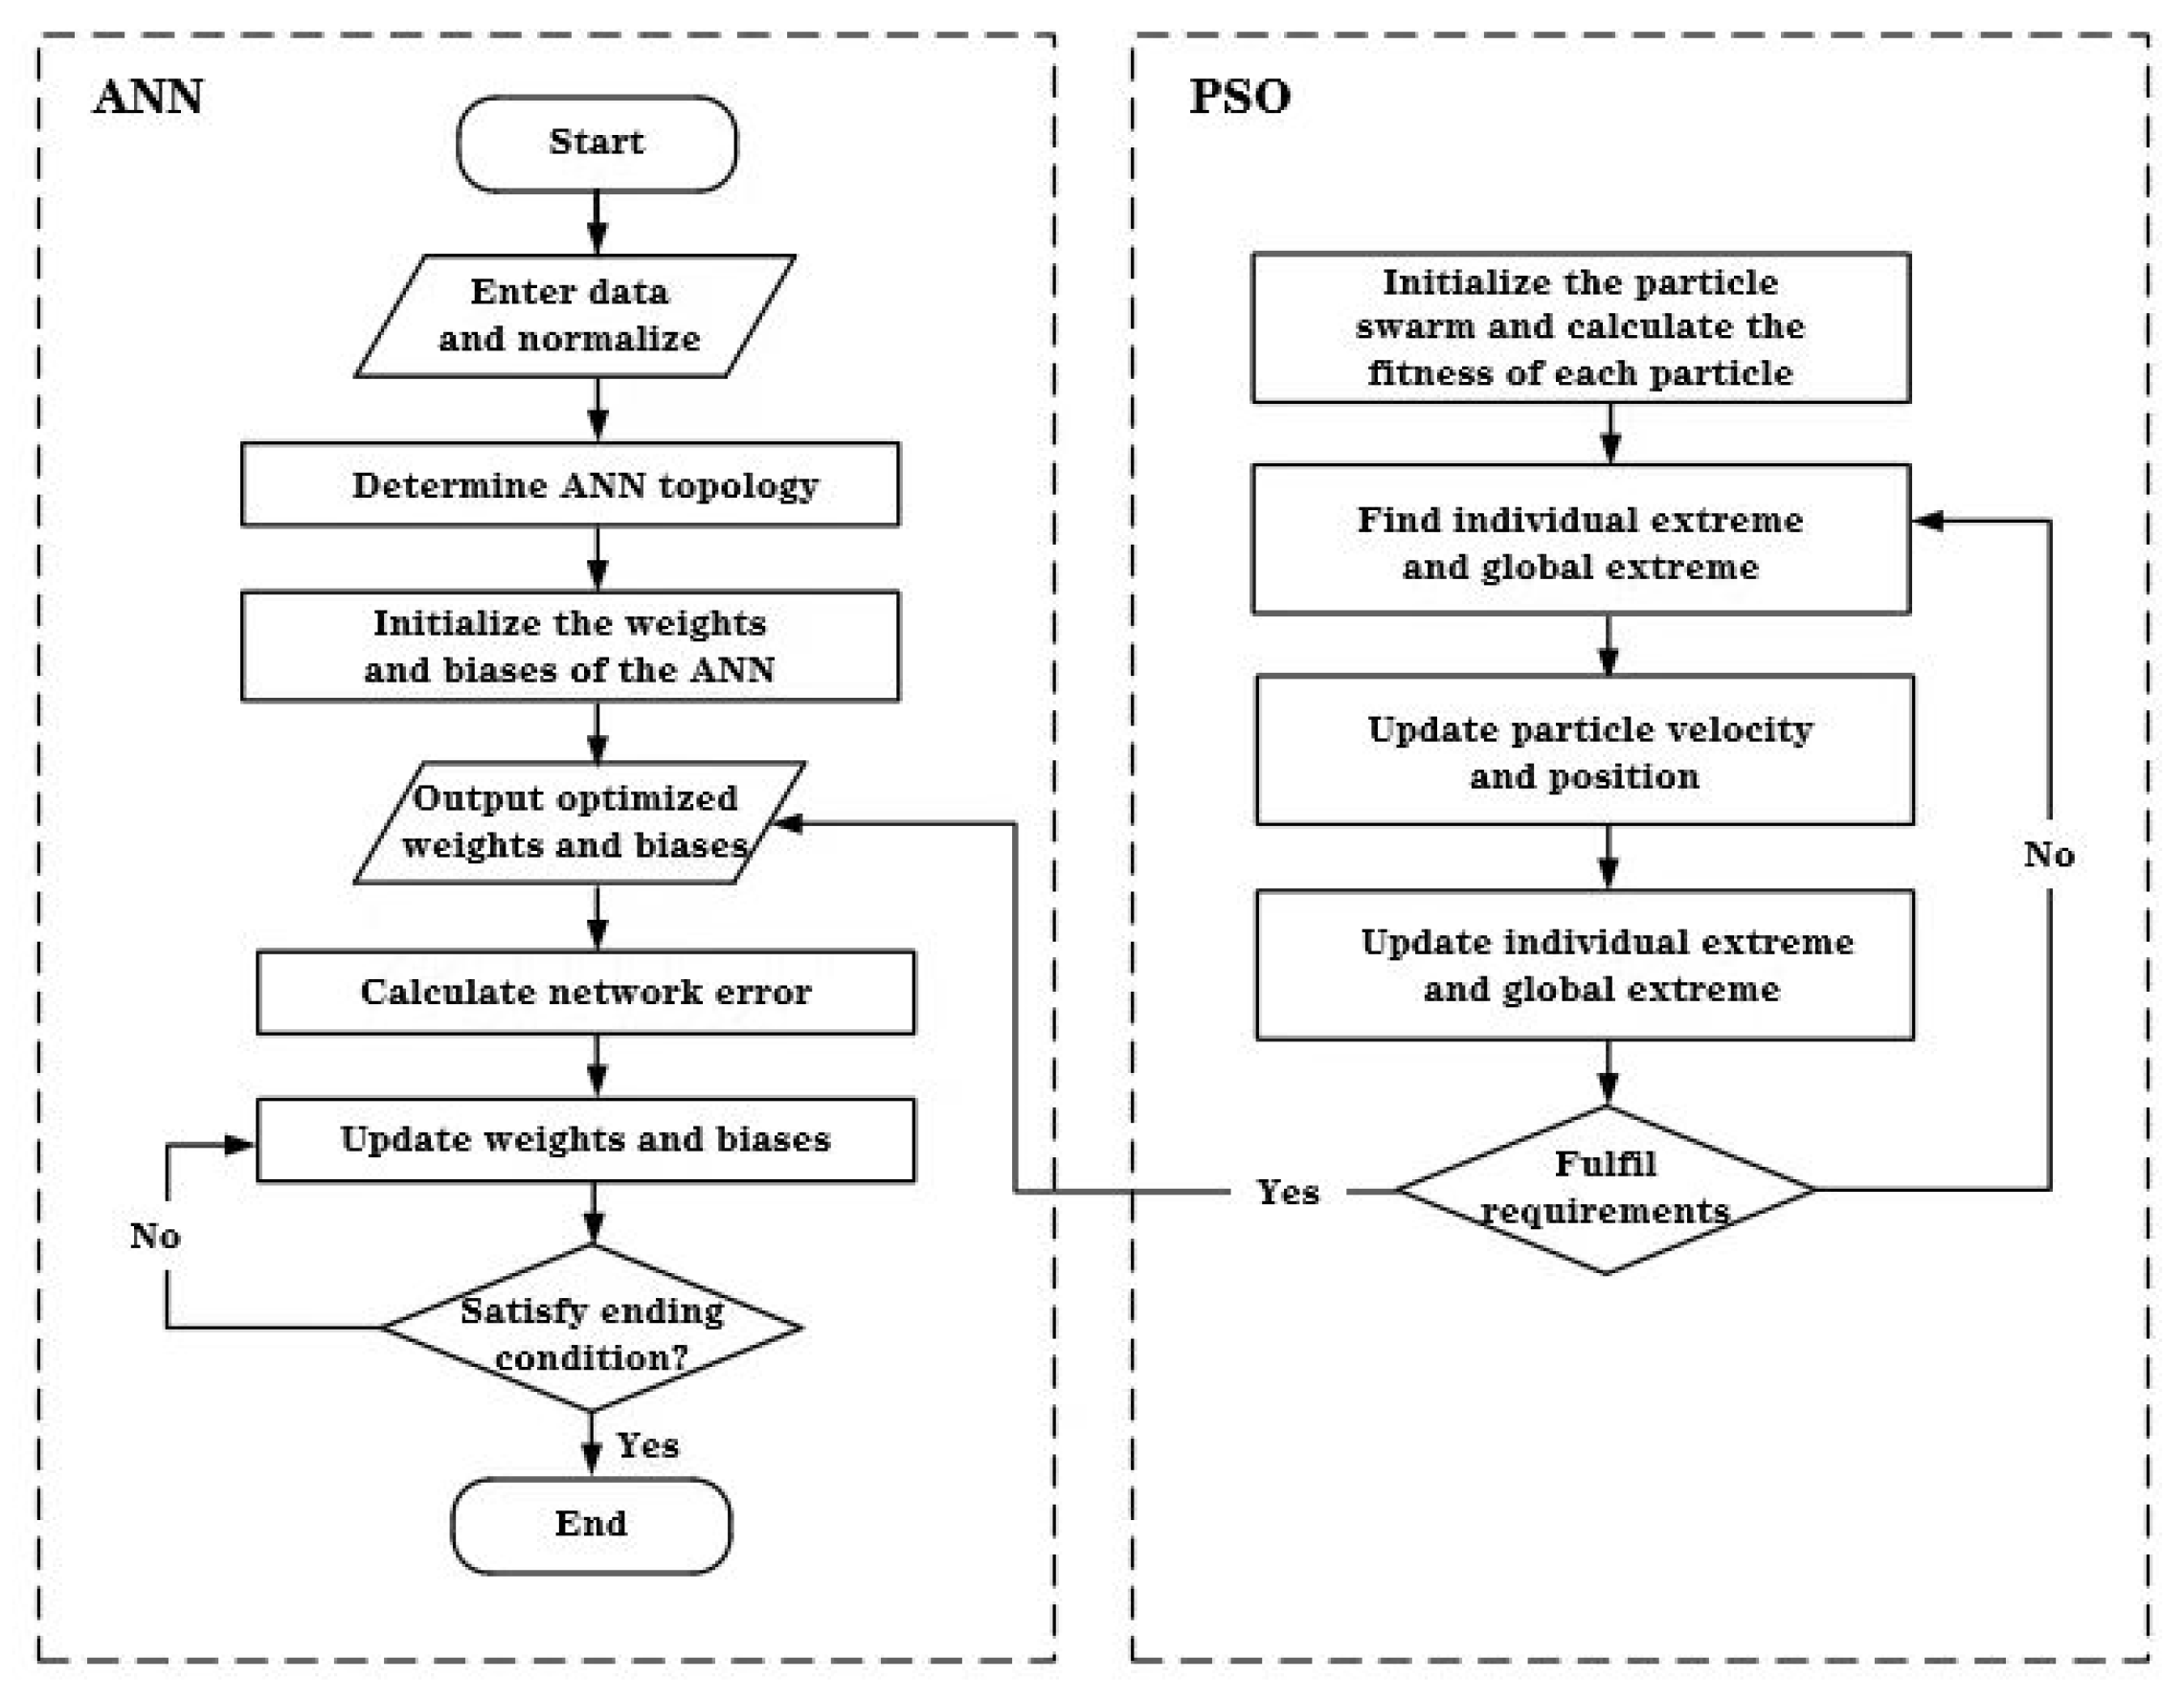
3.3.1. ANN
3.3.2. PSO
3.3.3. PSO-ANN
- (1)
- Data Normalization. The training and testing sets were constructed after reading the sample data.
- (2)
- Setting the Model Parameters. The maximum number of iterations, neuron numbers of each layer, functions, and termination criteria for the ANN topology were set in accordance with the features of the input data.
- (3)
- Optimization of Weights and Biases. The parameters of the PSO were set. The initial weights and biases of the ANN training model were then optimized using the particle swarm algorithm.
- (4)
- Establishment of the PSO-ANN model. The optimized weights and biases obtained from the position information of the optimal particle were assigned to the ANN as the initial values for the following training. The testing dataset was applied to verify the well-trained hybrid ANN and output the prediction result.
3.4. Model Performance
4. Conclusions
Supplementary Materials
Author Contributions
Funding
Institutional Review Board Statement
Informed Consent Statement
Data Availability Statement
Conflicts of Interest
Appendix A
References
- Damodaran, D.; Shetty, K.V.; Mohan, B.R. Effect of chelaters on bioaccumulation of Cd(II), Cu(II), Cr(VI), Pb(II) and Zn(II) in Galerina vittiformis from soil. Int. Biodeterior. Biodegrad. 2013, 85, 182–188. [Google Scholar] [CrossRef]
- Çoruh, S.; Geyikçi, F.; Kılıç, E.; Çoruh, U. The use of NARX neural network for modeling of adsorption of zinc ions using activated almond shell as a potential biosorbent. Bioresour. Technol. 2014, 151, 406–410. [Google Scholar] [CrossRef] [PubMed]
- Chen, D.Z.; Xie, S.S.; Chen, C.Q.; Quan, H.Y.; Hua, L.; Luo, X.B.; Guo, L. Activated biochar derived from pomelo peel as a high-capacity sorbent for removal of carbamazepine from aqueous solution. RSC Adv. 2017, 7, 54969–54979. [Google Scholar] [CrossRef]
- Cheng, D.; Ngo, H.H.; Guo, W.S.; Chang, S.W.; Nguyen, D.D.; Zhang, X.B.; Varjani, S.; Liu, Y. Feasibility study on a new pomelo peel derived biochar for tetracycline antibiotics removal in swine wastewater. Sci. Total Environ. 2020, 720, 137662. [Google Scholar] [CrossRef]
- Dinh, V.P.; Huynh, T.D.T.; Le, H.M.; Nguyen, V.D.; Dao, V.A.; Hung, N.Q.; Tuyen, L.A.; Lee, S.; Yi, J.; Nguyen, T.D.; et al. Insight into the adsorption mechanisms of methylene blue and chromium(iii) from aqueous solution onto pomelo fruit peel. RSC Adv. 2019, 9, 25847–25860. [Google Scholar] [CrossRef]
- Dinh, V.P.; Xuan, D.T.; Hung, N.Q.; Luu, T.T.; Do, T.T.T.; Nguyen, T.D.; Nguyen, V.D.; Anh, T.T.K.; Tran, N.Q. Primary biosorption mechanism of lead(II) and cadmium(II) cations from aqueous solution by pomelo (Citrus maxima) fruit peels. Environ. Sci. Pollut. Res. 2021, 28, 63504–63515. [Google Scholar] [CrossRef]
- Zhang, R.X.; Jiao, M.Q.; Zhao, N.; Jacquemin, J.; Zhang, Y.Q.; Liu, H.L. Assessment of Cu(II) removal from aqueous solutions by modified pomelo peels: Experiments and modelling. Molecules 2023, 28, 3438. [Google Scholar] [CrossRef]
- Du, J.; Shang, X.; Shi, J.; Guan, Y. Removal of chromium from industrial wastewater by magnetic flocculation treatment: Experimental studies and PSO-BP modelling. J. Water Process Eng. 2022, 47, 102822. [Google Scholar] [CrossRef]
- Marsland, S. Machine Learning: An Algorithmic Perspective; CRC Press: Boca Raton, FL, USA, 2015. [Google Scholar]
- Sarkar, B.; Sharma, U.; Adhikari, K.; Lahiri, S.K.; Baltrėnaitė, E.; Baltrėnas, P.; Dutta, S. Application of artificial neural network and particle swarm optimization for modelling and optimization of biosorption of lead(II) and nickel(II) from wastewater using dead cyanobacterial biomass. J. Indian Chem. Soc. 2021, 98, 100039. [Google Scholar] [CrossRef]
- Ma, X.M.; Guan, Y.L.; Mao, R.; Zheng, S.; Wei, Q. Modeling of lead removal by living Scenedesmus obliquus using backpropagation (BP) neural network algorithm. Environ. Technol. Innov. 2021, 22, 101410. [Google Scholar] [CrossRef]
- Faisal, A.A.H.; Nassir, Z.S.; Naji, L.A.; Naushad, M.; Ahamad, T. A sustainable approach to utilize olive pips for the sorption of lead ions: Numerial modeling with aid of artificial neural network. Sustain. Chem. Pharm. 2020, 15, 100220. [Google Scholar] [CrossRef]
- Moradi, P.; Hayati, S.; Ghahrizadeh, T. Modeling and optimization of lead and cobalt biosorption from water with rafsanjan pistachio shell, using experiment based models of ANN and GP, and the grey wolf optimizer. Chemom. Intell. Lab. Syst. 2020, 202, 104041. [Google Scholar] [CrossRef]
- Mohammadi, F.; Yavari, Z.; Rahimi, S.; Hashemi, M. Artificial neural network modeling of Cr(VI) biosorption from aqueous solutions. J. Water Chem. Technol. 2019, 41, 219–227. [Google Scholar] [CrossRef]
- Shandi, S.G.; Ardejani, F.D.; Sharifi, F. Assessment of Cu(II) removal from an aqueous solution by raw gundelia tournefortii as a new low-cost biosorbent: Experiments and modelling. Chin. J. Chem. Eng. 2019, 27, 1945–1955. [Google Scholar] [CrossRef]
- Yildiz, S. Artificial neural network (ANN) approach for modeling Zn(II) adsorption in batch process. Korean J. Chem. Eng. 2017, 34, 2423–2434. [Google Scholar] [CrossRef]
- Pant, P.; Chatterjee, D. Prediction of clad characteristics using ANN and combined PSO-ANN algorithms in laser metal deposition process. Surf. Interfaces 2020, 21, 100699. [Google Scholar] [CrossRef]
- Lan, Q.; Wang, X.C.; Sun, J.W.; Chang, Z.Y.; Deng, Q.C.; Sun, Q.C.; Liu, Z.H.; Yuan, L.Y.; Wang, J.C.; Wu, Y.J.; et al. Artificial neural network approach for mechanical properties prediction of as-cast A380 aluminum alloy. Mater. Today Commun. 2022, 31, 103301. [Google Scholar] [CrossRef]
- Garson, G.D. Interpreting neural-network connection weights. AI Expert 1991, 6, 46–51. [Google Scholar]
- Zheng, X.; Nguyen, H. A novel artificial intelligent model for predicting water treatment efficiency of various biochar systems based on artificial neural network and queuing search algorithm. Chemosphere 2022, 287, 132251. [Google Scholar] [CrossRef] [PubMed]
- Ke, B.; Nguyen, H.; Bui, X.N.; Bui, H.B.; Choi, Y.; Zhou, J.; Moayedi, H.; Costache, R.; Nguyen-Trang, T. Predicting the sorption efficiency of heavy metal based on the biochar characteristics, metal sources, and environmental conditions using various novel hybrid machine learning models. Chemosphere 2021, 276, 130204. [Google Scholar] [CrossRef]
- Bhagat, S.K.; Pyrgaki, K.; Salih, S.Q.; Tiyasha, T.; Beyaztas, U.; Shahid, S.; Yaseen, Z.M. Prediction of copper ions adsorption by attapulgite adsorbent using tuned-artificial intelligence model. Chemosphere 2021, 276, 130162. [Google Scholar] [CrossRef] [PubMed]
- Pooladi, M.A.; Jafari, D.; Esfandyari, M. Experimental and theoretical investigation of lead ion adsorption from the synthetic wastewater using the biosorbent derived from Cardita bicolor shell. Biomass Convers. Biorefin. 2023. [CrossRef]
- Zafar, M.; Aggarwal, A.; Rene, E.R.; Barbusiński, K.; Mahanty, B.; Behera, S.K. Data-driven machine learning intelligent tools for predicting chromium removal in an adsorption system. Processes 2022, 10, 447. [Google Scholar] [CrossRef]
- Azim, I.; Yang, J.; Javed, M.F.; Iqbal, M.F.; Mahmood, Z.; Wang, F.; Liu, Q.F. Prediction model for compressive arch action capacity of RC frame structures under column removal scenario using gene expression programming. Structures 2020, 25, 212–228. [Google Scholar] [CrossRef]
- Dunlop, P.; Smith, S. Estimation key characteristics of the concrete delivery and placement process using linear regression analysis. Civ. Eng. Environ. Syst. 2003, 20, 273–290. [Google Scholar] [CrossRef]
- Li, X.; Liu, X.J.; Li, H.Y.; Liu, R.; Zhang, Z.F.; Li, H.W.; Lyu, Q.; Chen, S.J. Prediction of SO2 and NOx in sintering flue gas based on PSO-BP neural network model. Ironmak. Steelmak. 2023, 1–8. [Google Scholar] [CrossRef]
- Armaghani, D.J.; Hajihassani, M.; Sohaei, H.; Mohamad, E.T.; Marto, A.; Motaghedi, H.; Moghaddam, M.R. Neuro-fuzzy technique to predict air-overpressure induced by blasting. Arab. J. Geosci. 2015, 8, 10937–10950. [Google Scholar] [CrossRef]
- Duan, Z.H.; Kou, S.C.; Poon, C.S. Prediction of compressive strength of recycled aggregate concrete using artificial neural networks. Constr. Build. Mater. 2013, 40, 1200–1206. [Google Scholar] [CrossRef]
- Dahou, Z.; Sbarta, Z.M.; Castel, A.; Ghomari, F. Artificial neural network model for steel-concrete bond prediction. Eng. Struct. 2009, 31, 1724–1733. [Google Scholar] [CrossRef]
- Chasiotis, V.K.; Tzempelikos, D.A.; Filios, A.E.; Moustris, K.P. Artificial neural network modelling of moisture content evolution for convective drying of cylindrical quince slices. Comput. Electron. Agric. 2020, 172, 105074. [Google Scholar] [CrossRef]
- Liu, Q.F.; Iqbal, M.F.; Yang, J.; Lu, X.Y.; Zhang, P.; Rauf, M. Prediction of chloride diffusivity in concrete using artificial neural network: Modelling and performance evaluation. Constr. Build. Mater. 2021, 268, 121082. [Google Scholar] [CrossRef]
- Huang, C.L.; Dun, J.F. A distributed PSO-SVM hybrid system with feature selection and parameter optimization. Appl. Soft Comput. 2008, 8, 1381–1391. [Google Scholar] [CrossRef]
- Ghorbani, N.; Kasaeian, A.; Toopshekan, A.; Bahrami, L.; Maghami, A. Optimizing a hybrid wind-PV-battery system using GA-PSO and MOPSO for reducing cost and increasing reliability. Energy 2018, 154, 581–591. [Google Scholar] [CrossRef]
- Huang, X.Y.; Wu, K.Y.; Wang, S.; Lu, T.; Lu, Y.F.; Deng, W.C.; Li, H.M. Compressive strength prediction of rubber concrete based on artificial neural network model with hybrid particle swarm optimization algorithm. Materials 2022, 15, 3934. [Google Scholar] [CrossRef] [PubMed]
- Ge, H.W.; Qian, F.; Liang, Y.C.; Du, W.L.; Wang, L. Identification and control of nonlinear systems by a dissimilation particle swarm optimization-based Elman neural network. Nonlinear Anal. Real World Appl. 2008, 9, 1345–1360. [Google Scholar] [CrossRef]
- Choudhary, S.; Sugumaran, S.; Belazi, A.; Abd El-Latif, A.A. Linearly decreasing inertia weight PSO and improved weight factor-based clustering algorithm for wireless sensor networks. J. Ambient Intell. Humaniz. Comput. 2021, 14, 6661–6679. [Google Scholar] [CrossRef]
- Ly, H.B.; Le, L.M.; Phi, L.V.; Phan, V.H.; Tran, V.Q.; Pham, B.T.; Le, T.T.; Derrible, S. Development of an AI model to measure traffic air pollution from multisensor and weather data. Sensors 2019, 19, 4941. [Google Scholar] [CrossRef]
- Pham, B.T.; Jaafari, A.; Prakash, I.; Bui, D.T. A novel hybrid intelligent model of support vector machines and the MultiBoost ensemble of landslide susceptibility modeling. Bull. Eng. Geol. Environ. 2019, 78, 2865–2886. [Google Scholar] [CrossRef]


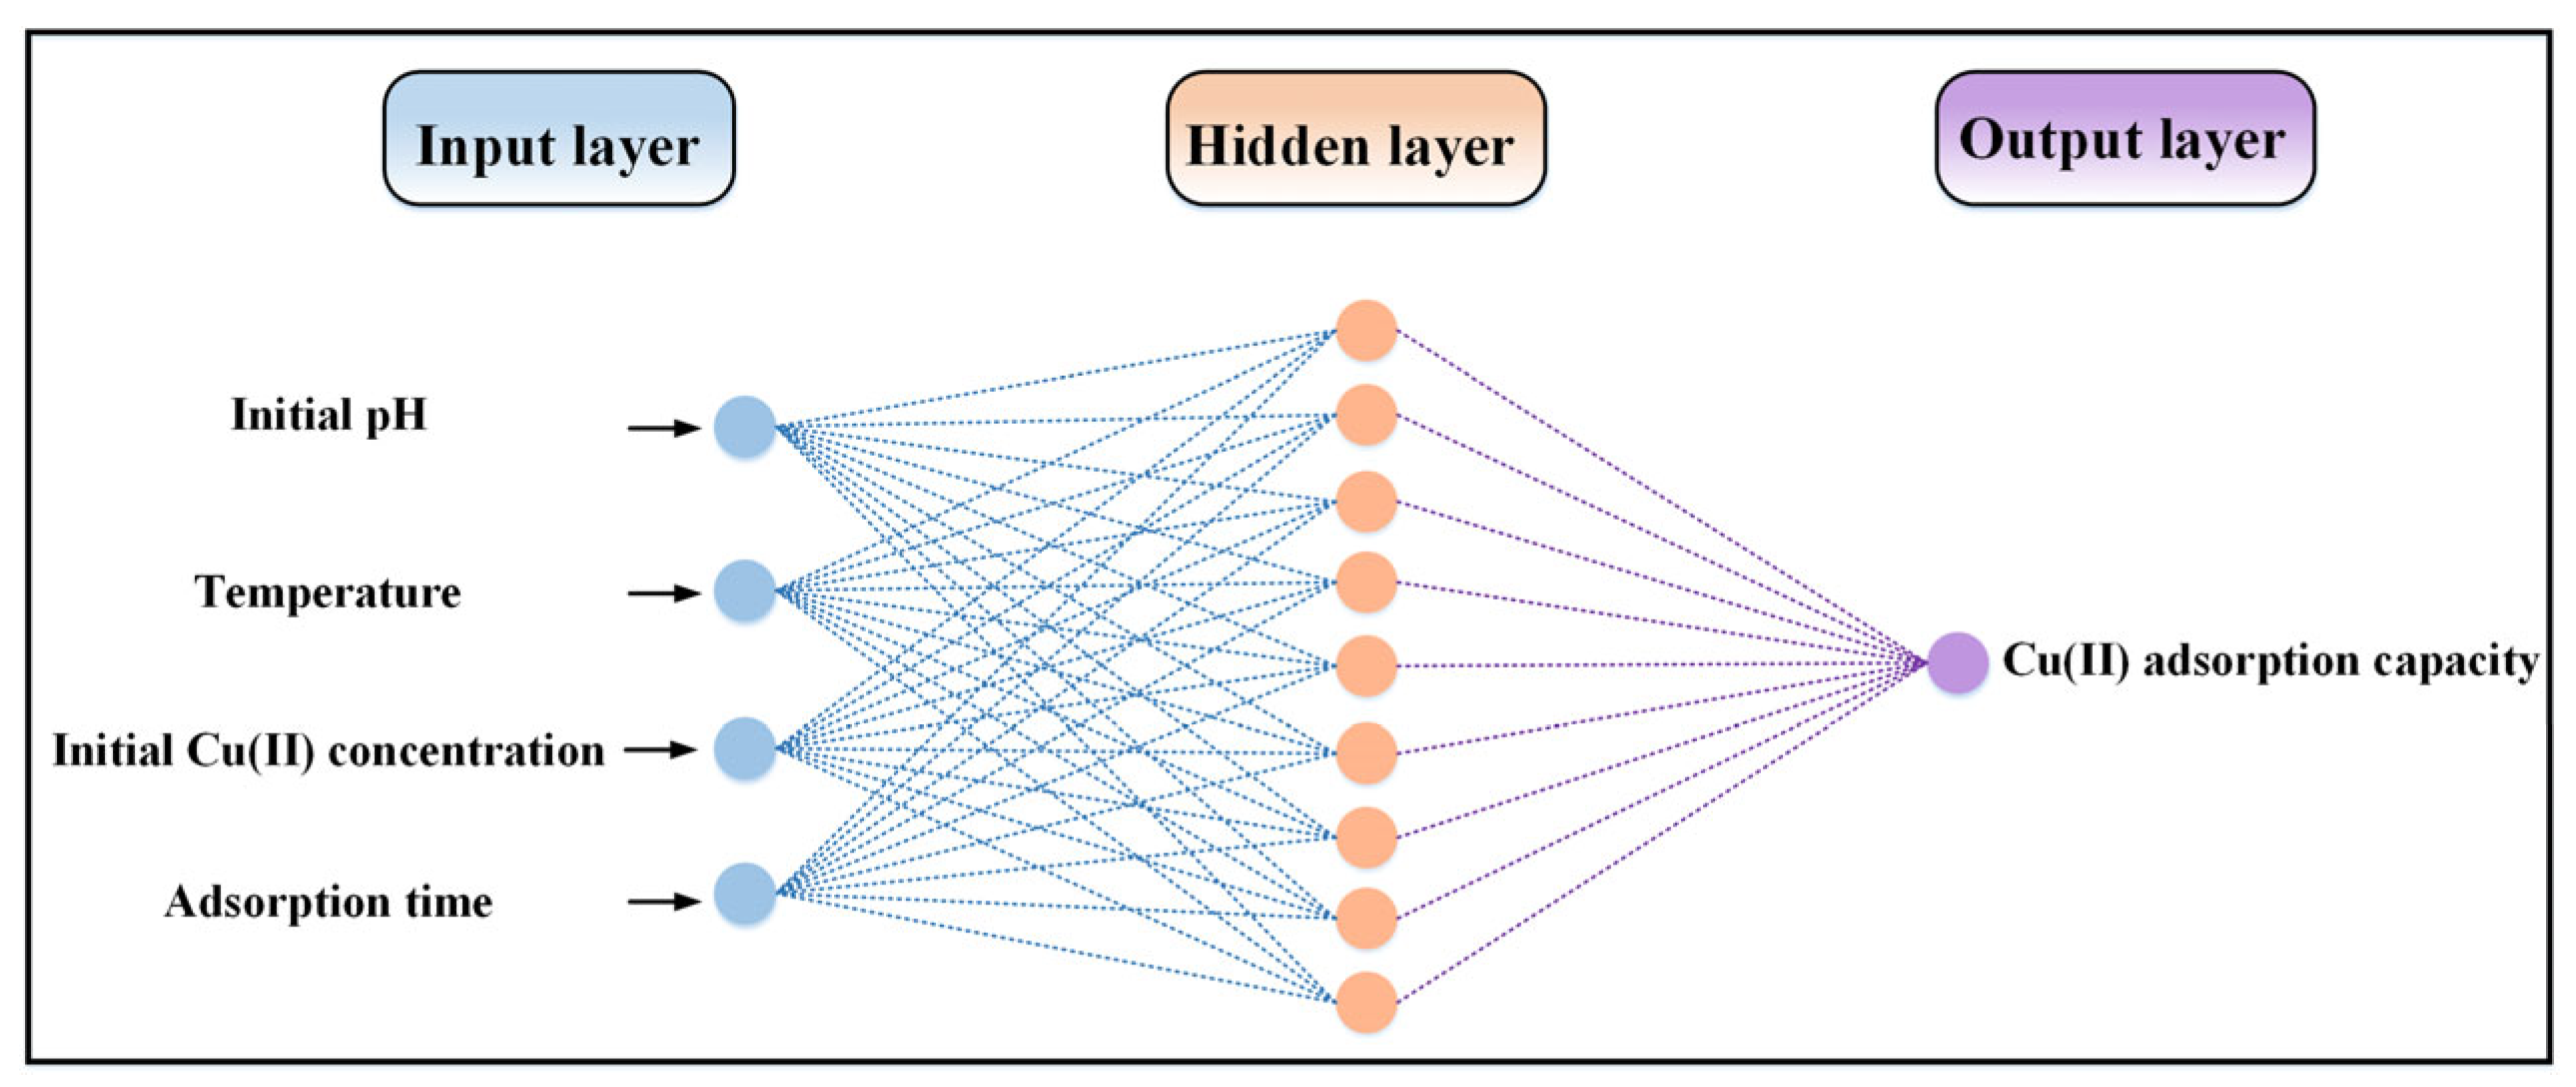
| Parameter | Setting |
|---|---|
| Input layer node | 4 |
| Hidden layer node | 9 |
| Output layer node | 1 |
| Activation function | tansig, purelin |
| Training function | trainlm |
| Epochs | 1000 |
| Learning rate | 0.01 |
| Precision | 1 × 10⁻⁵ |
| Epochs between display | 25 |
| Momentum factor | 0.01 |
| Minimum performance gradient | 1.00 × 10⁻⁶ |
| Maximum validation failure | 6 |
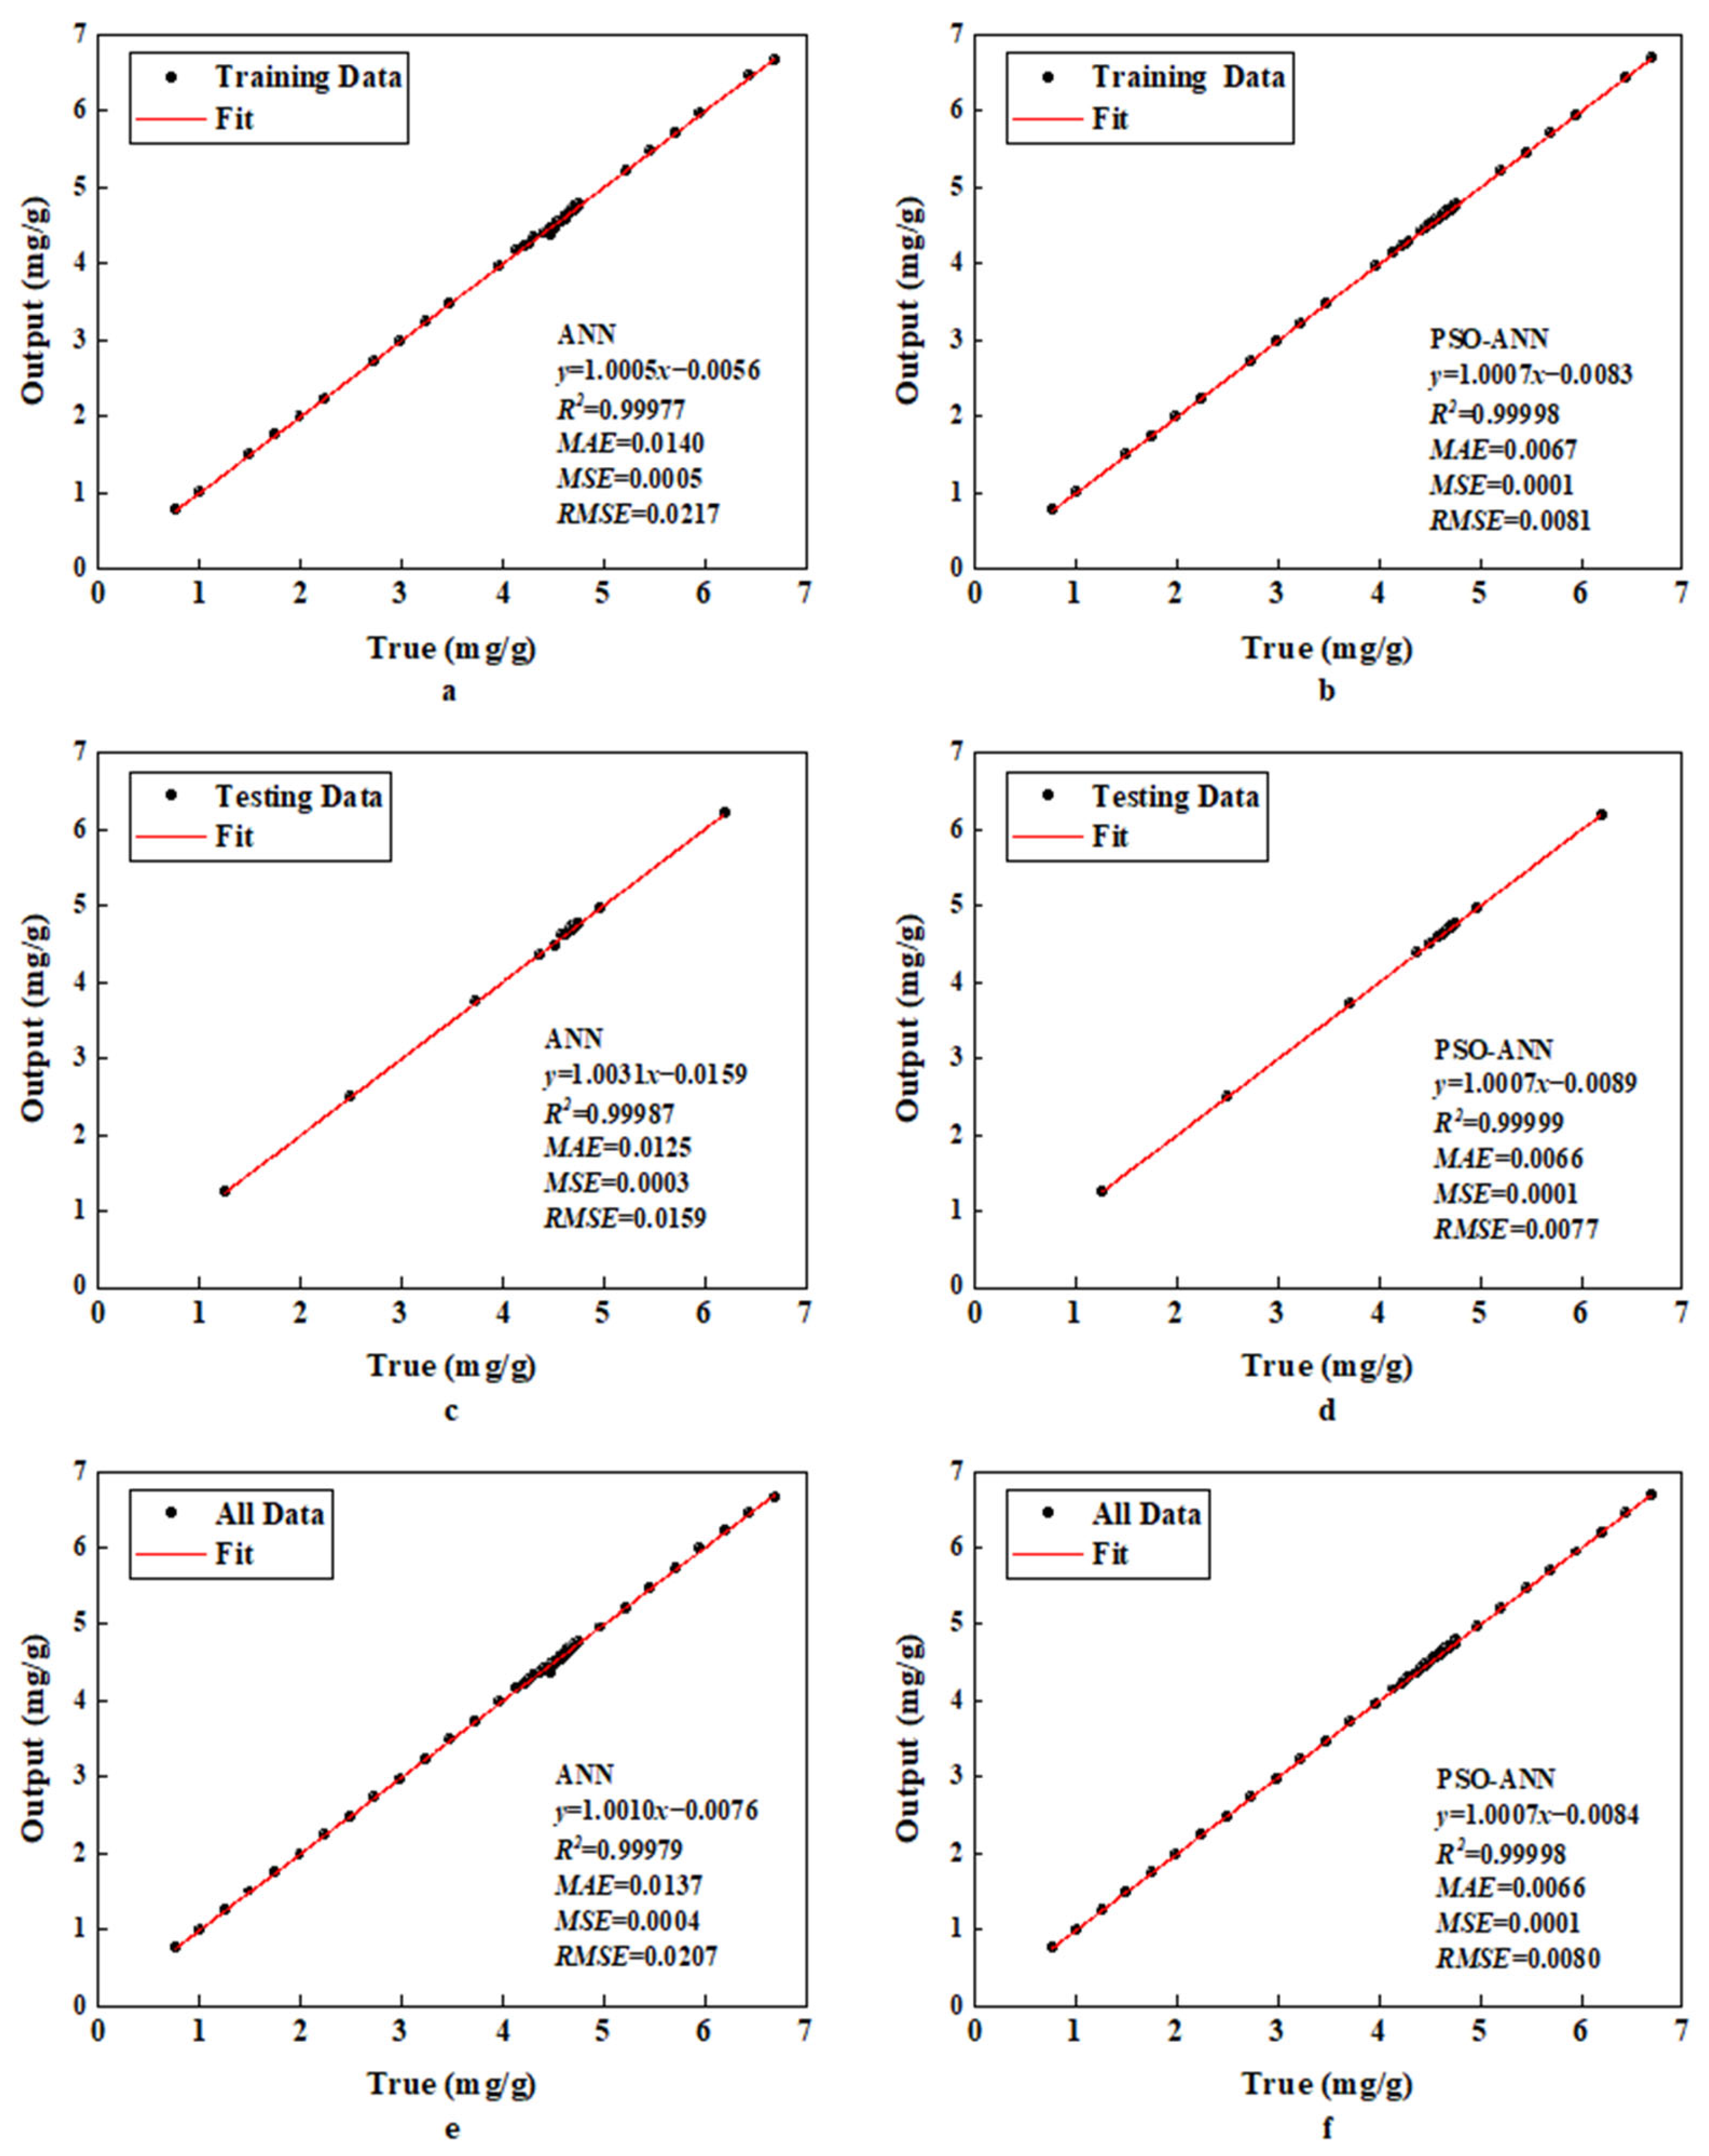
| ANN | PSO-ANN | ||
|---|---|---|---|
| R2 | Training | 0.99977 | 0.99998 |
| Testing | 0.99987 | 0.99999 | |
| MSE | Training | 0.0005 | 0.0001 |
| Testing | 0.0003 | 0.0001 | |
| RMSE | Training | 0.0217 | 0.0081 |
| Testing | 0.0159 | 0.0077 | |
| MAE | Training | 0.0140 | 0.0067 |
| Testing | 0.0125 | 0.0066 |
| Parameter | Setting |
|---|---|
| Particle swarm size | 20 |
| Maximum iterations | 60 |
| c1 | 2 |
| c1 | 2 |
| ωmax | 0.90 |
| ωmin | 0.40 |
| Position constraint | [−5, 5] |
| Velocity constraint | [−1, 1] |
| Reference | Model | Removal Ions | Dataset | Performance | |
|---|---|---|---|---|---|
| Training | Testing | ||||
| This study | PSO-ANN | Cu(II) | 100 | R2 = 0.99998 RMSE = 0.0081 MAE = 0.0067 | R2 = 0.99999 RMSE = 0.0077 MAE = 0.0066 |
| Zheng et al. [20] | QSA-ANN | Cu(II), Pb(II), Zn(II), As(III), Cd(II), and Ni(II) | 353 | R2 = 0.978 RMSE = 0.051 | R2 = 0.960 RMSE = 0.074 |
| Ke et al. [21] | SVM-ANN | Cu(II), Pb(II), Zn(II), As(III), Cd(II), and Ni(II) | 353 | R2 = 0.995 RMSE = 0.036 MAE = 0.018 | R2 = 0.987 RMSE = 0.046 MAE = 0.026 |
| Bhagat et al. [22] | ANN-M5 | Cu(II) | 95 | R2 = 0.9983 RMSE = 1.3799 MAE = 1.0338 | R2 = 0.9974 RMSE = 0.9283 MAE = 0.6200 |
| Pooladi et al. [23] | GMDH-ANN | Pb(II) | Not reported | R2 = 0.94 RMSE = 3.5524 MAE = 2.6958 | R2 = 0.9315 RMSE = 5.3083 MAE = 4.041 |
| Zafar et al. [24] | ANFIS | Cr(VI) | 18 | R2 = 0.99 RMSE = 0.63 | R2 = 0.94 RMSE = 6.23 |
| Max | Min | Average | Median | Standard Deviation | Skewness | |
|---|---|---|---|---|---|---|
| Temperature (K) | 313.15 | 288.15 | 298.80 | 298.15 | 3.98 | 1.33 |
| Initial pH | 7.00 | 2.00 | 4.87 | 5.00 | 0.80 | −1.33 |
| Adsorption time (min) | 60.00 | 10.00 | 53.50 | 60.00 | 13.37 | −1.99 |
| Initial Cu(II) concentration (mg/L) | 28.00 | 4.00 | 19.00 | 20.00 | 4.00 | −1.95 |
| Cu(II) adsorption capacity (mg/g) | 6.6994 | 0.7726 | 4.4236 | 4.6865 | 0.9820 | −1.8389 |
Disclaimer/Publisher’s Note: The statements, opinions and data contained in all publications are solely those of the individual author(s) and contributor(s) and not of MDPI and/or the editor(s). MDPI and/or the editor(s) disclaim responsibility for any injury to people or property resulting from any ideas, methods, instructions or products referred to in the content. |
© 2023 by the authors. Licensee MDPI, Basel, Switzerland. This article is an open access article distributed under the terms and conditions of the Creative Commons Attribution (CC BY) license (https://creativecommons.org/licenses/by/4.0/).
Share and Cite
Jiao, M.; Jacquemin, J.; Zhang, R.; Zhao, N.; Liu, H. The Prediction of Cu(II) Adsorption Capacity of Modified Pomelo Peels Using the PSO-ANN Model. Molecules 2023, 28, 6957. https://doi.org/10.3390/molecules28196957
Jiao M, Jacquemin J, Zhang R, Zhao N, Liu H. The Prediction of Cu(II) Adsorption Capacity of Modified Pomelo Peels Using the PSO-ANN Model. Molecules. 2023; 28(19):6957. https://doi.org/10.3390/molecules28196957
Chicago/Turabian StyleJiao, Mengqing, Johan Jacquemin, Ruixue Zhang, Nan Zhao, and Honglai Liu. 2023. "The Prediction of Cu(II) Adsorption Capacity of Modified Pomelo Peels Using the PSO-ANN Model" Molecules 28, no. 19: 6957. https://doi.org/10.3390/molecules28196957