Abstract
The direct and rapid determination of trace cobalt ion (Co2+) in the electrolyte of zinc smelting plants is urgently needed but is impeded by the severe interference of extremely high-concentration zinc ions in the solution. Herein, colorimetric detection of Co2+ by the polyvinylpyrrolidone functionalized silver nanoparticles (PVP-AgNPs) is realized in solutions with the Zn/Co ratio being high, up to (0.8–5) × 104, which is located within the ratio range in industrial solution. The high concentration of Zn2+ induces a strong attenuation of Co2+-related signals in ultraviolet-visible (UV-vis) extinction spectra; nevertheless, a good linear range for detecting 1–6 mg/L Co2+ in 50 g/L Zn2+ solution is still acquired. The strong anti-interference toward other metal ions and the mechanism understanding for trace Co2+ detection in such a high-concentration Zn2+ solution are also revealed by systematic analysis techniques. The results extend the AgNPs as colorimetric sensors to industrial solutions, providing a new strategy for detecting trace-metal ions in industrial plants.
1. Introduction
Colorimetry is a commonly used strategy for the detection of metal ions; however, it is confined to applications in relatively narrow fields [1,2]. The colorimetric method possesses many merits including convenience, rapid response, and low detection limit [3,4]. For example, the silver nanoparticles (AgNPs) suspension, which is a widely used agent for colorimetric detection, can be processed into portable test paper for the qualitative visual inspection or the quantitative spectrophotometry detection of metal ions within a very short timeframe [5,6]. Despite the above superiorities, the reported detection fields for both AgNPs suspension and other colorimetric agents are mainly focused on solutions with a very low total concentration of metal ions, i.e., drinking water, pesticide residue analysis, and sera diagnosis [7,8,9,10]. The above samples contain a relatively low concentration of metal ions, though serum as a special case reached ~4 g/L [11]. For high-concentration solutions, the signals of trace ions can be easily blocked by the dominant metal ions during detection [12]. Therefore, extending the colorimetric method to the detection of trace ions in high-concentration solutions is very challenging, yet is urgently needed.
The zinc smelting plant is one of those areas that is urgently needed for the detection of trace-metal ions in high-concentration solutions. For example, the Zn2+ concentration in the electrolyte for industrial electrodeposition of metal zinc is high, up to 50 g/L [13], however, the Co2+ must be strictly controlled to be lower than 1.0 mg/L [14]. Fluctuation of Co2+ concentration in the high-concentration Zn2+ solution will largely decrease the electro-deposition efficiency of metal zinc, even leading to “plate-burning” during the electrodeposition process [15,16].
Precise and rapid monitoring of the trace Co2+ in the high-concentration Zn2+ solution is very important in a zinc smelting plant, but there are great challenges in its implementation. Industrially, detection of Co2+ in the Zn2+-containing electrolyte is carried out using electrothermal atomic absorption spectrometry with expensive instruments, or spectrophotography which involves cumbersome operation [17,18]. Additionally, the on-site detection and real-time monitoring of Co2+ is difficult to conduct because the acid and the noisy, mechanical vibrational environment on site do not allow for the stable functioning of these precise instruments [19,20]. In fact, the tedious analysis procedures, including the sample preparation, transfer of sample from the on-site spot to the analysis-testing center, and sample pretreatment for analysis, have greatly hindered the precise control and swift emergency response of the electrolysis process in the industry.
In recent years, facile and high-efficiency detection of Co2+ in zinc electrolyte is explored by the polarography method, which uses a dropping mercury electrode to increase the sensitivity and selectivity of trace Co2+ [16,21,22,23]. However, the following challenges restrict its widespread application: (1) the highly toxic property of mercury. The usage of mercury poses a huge threat to both the environment and human health [24]. (2) The detection range of Co2+ concentration is not suitable for zinc electrolyte. Zhu Hong-qiu et al. [15] determined the linear range for Co2+ detection to be 5.89 × 10⁻⁶ mg/L–1.89 × 10−2 mg/L, showing a huge deviation with the actual concentration of 0.3–2 mg/L. Exploring environmentally friendly and on-site applicable detection methods for Co2+ in zinc electrolyte is still of prime importance.
Herein, using the polyvinylpyrrolidone-functionalized AgNPs (PVP-AgNPs) as the colorimetric agent, the detection of trace Co2+ (1–6 mg/L) in 50 g/L Zn2+ solution is performed. The AgNPs with a strong surface plasmon resonance (SPR) effect were chosen to increase the sensibility for detecting trace Co2+ [25,26,27,28]. The anchored PVP was designed to act as a capping agent for linking the target analytes as well as stabilizer for the AgNPs [29]. The mechanism analysis revealed that the anchored PVP plays an important role in grabbing the trace Co2+ in the high-concentration solution, therefore, partially counteracting the interference of high-concentration Zn2+ in the solution. The results of this paper can provide new insights for the detection of trace-metal ions in high-concentration Zn2+ solution.
2. Results and Discussion
2.1. Interference of Zn2+ for Sensing Co2+
The PVP-AgNPs present a strong sensing ability toward trace Co2+ in Zn2+-free solutions. The incubation time between PVP-AgNPs and Co2+ was chosen according to the color change of the solution. After mixing different concentrations of Co2+ with PVP-AgNPs, a rapid color response occurred, and the color basically did not change after 2 min, so 2 min was selected as the incubation time. As shown in Figure 1a, the color of the solution gradually changes from light yellow to light purple when the added Co2+ increases from 0 mg/L to 2 mg/L, implying the outstanding sensing ability of PVP-AgNPs for Co2+ in the absence of Zn2+. Such a conclusion is also revealed by the UV-vis spectrum in Figure 1b. For single PVP-AgNPs, a strong absorption peak at around 393 nm is observed (Figure 1b), implying the highly dispersed state of the particles [30,31]. After adding Co2+, the peak intensity at 393 nm progressively decays with the increase of Co2+ concentration, accompanied by the intensity enhancement of a newly generated peak at 533 nm (Figure 1b), which denotes the distance decrease between particles in the solution [32]. The above phenomenon means that adding Co2+ induces the aggregation of PVP-AgNPs in the solution, implying that the trace Co2+ is grabbed by the PVP chains on the surface of AgNPs [29]. Such results are further quantitatively characterized by the peak intensity ratio, as shown in Figure 1c. A good linear relationship was found between A533/A393 (intensity ratio for peak at 533 nm and peak at 393 nm) and ln[Co2+] (natural logarithm function of Co2+ concentration), meaning that the trace Co2+ in the Zn2+-free solution can be quantitatively determined by the PVP-AgNPs [26,31].
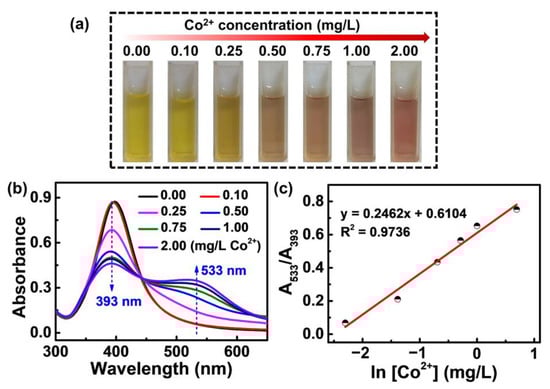
Figure 1.
(a) Photographic images of PVP-AgNPs sensing solutions with various Co2+ concentrations (0.00, 0.10, 0.25, 0.50, 0.75, 1.00, 2.00 mg/L). (b) The corresponding absorption spectra of (a). (c) Plot of A533/A393 for PVP-AgNPs experienced with different concentrations of Co2+.
Discouragingly, addition of Zn2+ leads to a shocking change in both the color and the UV-vis signals of the solution, meaning a devastating influence on the PVP-AgNPs in terms of sensing the trace Co2+. As shown in Figure 2a, addition of Co2+ into the PVP-AgNPs suspension turns the color from light yellow to light purple. However, co-addition of Co2+ and Zn2+ results in the disappearance of the purple color, being replaced with the orange (Co2Zn1K, namely the solution containing 2 mg/L Co2+ and 1 g/L Zn2+) or dark yellow (Co2Zn50K, namely the solution containing 2 mg/L Co2+ and 50 g/L Zn2+) images. The results indicate that the existence of Zn2+ in the solution can interfere with the sensing of trace Co2+. This deduction is also demonstrated in the UV-vis spectra. As show in Figure 2b, compared with single Co2+, co-existence of Co2+ and Zn2+ (Co2Zn1K and Co2Zn50K) leads to a dramatic change in the absorption spectrum shape, including peak intensity and position, which implies that Zn2+ in the solution influences the aggregation degree of particles to a large extent. Compared with single Zn2+ (Zn1K and Zn50K), Co2Zn1K and Co2Zn50K also showed a discernable change in absorption spectrum shape. This means that when the concentration of Zn2+ is significantly higher than that of Co2+ (the concentration ratio of Zn2+ to Co2+ is 500:1 and 25,000:1, respectively), the addition of Co2+ can still affect the aggregation state of particles.
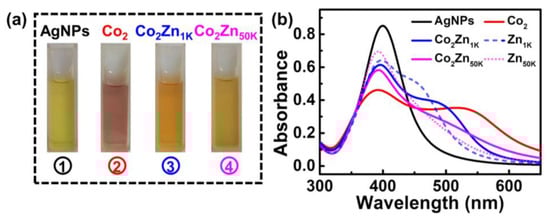
Figure 2.
(a) Photographic images of PVP-AgNPs sensing solutions: ① PVP-AgNPs; ② PVP-AgNPs + 2 mg/L Co2+; ③ PVP-AgNPs + 2 mg/L Co2+ + 1 g/L Zn2+; ④ PVP-AgNPs + 2 mg/L Co2+ + 50 g/L Zn2+ (from left to right). (b) Solid line (black, red, blue, and pink color): the corresponding absorption spectra of (a), short dash (blue): AgNPs + 1 g/L Zn2+, short dot (pink): AgNPs + 50 g/L Zn2+.
Therefore, the PVP-AgNPs present a strong ability in colorimetric sensing of the trace Co2+ in the Zn2+-free solution. Although the existence of high-concentration Zn2+ can severely interfere with the detection signals of Co2+, the trace amount of Co2+ can still affect the absorption spectrum shape and the aggregation state of particles.
2.2. Detection of Trace Co2+ in High-Concentration of Zn2+
The high-concentration Zn2+ induces a strong change in the signal of trace Co2+; nevertheless, a good linear relationship is still found between the peak intensity and the Co2+ concentration. As shown in Figure 3a, even in the solution with a Zn2+ concentration as high as 50 g/L (the concentration of industrial zinc electrolyte), an obvious shoulder peak in the trace Co2+ is still observed at about 533 nm, with an intensity that rises linearly with the increase of Co2+ concentration (Inset in Figure 3a). The results imply that the interaction between the superficial PVP chains and the trace Co2+ still exists, although the majority of active sites on the surface of PVP-AgNPs for sensing activity are consumed by the dominant Zn2+ in the solution.
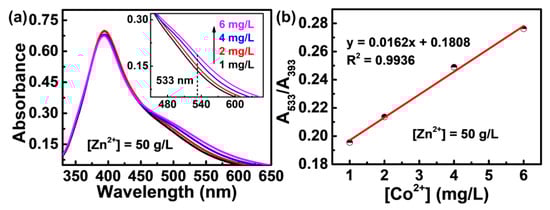
Figure 3.
(a) UV-vis absorption spectra of PVP-AgNPs mixed with fixed 50 g/L Zn2+ and different concentration of Co2+ (black line: 1 mg/L, red line: 2 mg/L, blue line: 4 mg/L, pink line: 6 mg/L). The inset shows the enlarged view of 450–650 nm wavelength range. (b) The dependence of the A533/A393 values of PVP-AgNPs on the increasing concentration of Co2+.
The absorption intensity ratio between the newly appeared peak (533 nm) caused by analytes and the initial PVP-AgNPs peak (393 nm) is commonly used for the quantitative determination of trace ions using the colorimetric method [26,33]. As shown in Figure 3b, a good linear relationship between A533/A393 and Co2+ concentration in the range of 1–6 mg/L is found (y = 0.0162x + 0.1808, R2 = 0.9936), which means that the concentration of trace Co2+ in the 50 g/L Zn2+ solution can be precisely determined. As has been documented, the maximum tolerable level of cobalt is 0.3–2 mg/L for typical zinc smelting plants across China [34], and 0.05–1 mg/L for zinc smelters in other countries [35]. Therefore, the detection range of 1–6 mg/L enables the fabricated PVP-AgNPs to monitor the Co2+ concentration during normal operation or alarming for exceeding limits of Co2+ concentration in zinc smelting plants.
Both the fluctuation of Zn2+ concentration and the typical trace impurities in the industrial zinc electrolyte have negligible influence on the detection of Co2+. For the industrial zinc electrolyte, the concentration of Zn2+ is commonly fixed at 50 g/L to enable a stable electrodeposition process. However, fluctuations in the industrial process is inevitable, therefore, the concentration of Zn2+ in real zinc electrolyte usually varies between 48–52 g/L. As shown in Figure 4a, variation of the Zn2+ concentration between 48–52 g/L leads to fluctuation of the Co2+ signal within 10%. Such a signal deviation ratio induced by zinc concentration fluctuation can still guide the process adjustment for zinc electrodeposition in the industry due to the following reasons: (1) Fluctuation in the zinc concentration is the result of accumulation over months, rather than an instant case, which means the influence of zinc fluctuation is very small within the testing periods. In this regard, Gong et al. have also pointed out that in the process of zinc electrolysis, the transition process of zinc concentration in the electrolyte is very slow [36]. (2) Once the Co2+ in the solution induces abnormal phenomenon for production, the Co2+ concentration commonly increases in multiples, greatly exceeding the signal deviation ratio of 10%. On the one hand, analytical detection methods usually allow a deviation of less than 10% [37]. On the other hand, under normal production conditions, the concentration of Co2+ in zinc sulfate electrolyte should not exceed 1 mg/L, but once the Co2+ in the solution induces abnormal phenomenon, the Co2+ concentration may reach 2 mg/L or even higher [34]. In addition to Co2+, other trace ions such as Cu2+, Ni2+, Ca2+, F−, Cd2+, Fe2+, and Pb2+ are also devastating in zinc electrolyte. As shown in Figure 4b, the interferences of these trace impurity ions on the detection of Co2+ are negligible. The concentrations of interfering ions are selected based on the upper limit or slightly below the upper limit concentration of possible impurity ion in zinc electrolyte [21,22,34]. Therefore, the PVP-AgNPs can be used for the detection of Co2+ in industrial zinc electrolyte, although this is faced with the challenges of both the fluctuation of Zn2+ concentration and the co-existence of other metal impurity ions.
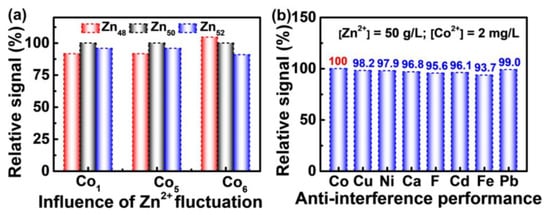
Figure 4.
(a) Effect of Zn2+ concentration fluctuation on Co2+ response signal. (b) The influence of interfering ions: [Zn2+] = 50 g/L, [Co2+] = 2 mg/L, [Cu2+] = 0.5 mg/L, [Ni2+] = 1 mg/L, [Ca2+] = 800 mg/L, [F−] = 50 mg/L, [Cd2+] = 0.1 mg/L, [Fe2+] = 2 mg/L, [Pb2+] = 0.05 mg/L. The Y-axis “Relative signal (%)” represents the relative values of absorbance ratio between reference and experimental values ((A533/A393)ref/(A533/A393)exp): (a) 50 g/L Zn2+ was set as reference, and 48 g/L and 52 g/L as the experimental group; (b) the mixture of 50 g/L Zn2+ and 2 mg/L Co2+ was set as reference, a third metal ion introduced into the Zn−Co mixture system was set as the experimental group.
High-concentration Zn2+ induces a strong change for the signal of trace Co2+, nevertheless, the precise detection of trace Co2+ can still be realized. More importantly, the concentration fluctuation of Zn2+ and other typical trace impurity ions in the zinc electrolyte have negligible influence on the detection of trace Co2+.
2.3. Mechanism Understanding for Co2+ Detection in High-Concentration Zn2+ Solution
Both the color change and the peak variation in UV-vis spectra of AgNPs suspension can be associated with the aggregation or dispersion states of particles and the characteristics of the surrounding medium [38,39]. According to the available evidence, the aggregation size is an important factor affecting the peak wavelength and intensity of UV-vis spectra. However, there is no evidence for the PVP structure changes caused by the effects of the surrounding dielectric effect, which is beyond the scope of this study. Nevertheless, observing the behavior of PVP-AgNPs in the solution can facilitate understanding of the colorimetric sensing mechanism for Co2+.
The TEM images reveal that PVP-AgNPs have an average diameter of 7.8 ± 1.6 nm and in different solutions present entirely different behaviors. As shown in Figure 5a,e, the PVP-AgNPs in high-purity water are highly dispersive, presenting a single characteristic peak at ~393 nm with strong intensity (Figure 1b). After introducing 2 mg/L Co2+, obvious aggregation of the particles is observed (Figure 5b,f), which form loose clumps with large cavities, resulting in the generation of a new peak at ~533 nm in UV-vis spectrum and attenuation of the peak at ~393 nm at the same time (Figure 1b). Startlingly, addition of 50 g/L Zn2+ leads to a more compact aggregation of PVP-AgNPs than that of 2 mg/L Co2+ (Figure 5c,g), which explains why the high-concentration Zn2+ has a strong interference in the detection of trace Co2+ by PVP-AgNPs. Compared with the PVP-AgNPs dispersion containing sole 50 g/L Zn2+, further addition of 2 mg/L Co2+ contributes to further gathering of aggregated PVP-AgNPs, resulting in more compact clusters (Figure 5d,h). Therefore, although existence of high-concentration Zn2+ alters the dispersion state of PVP-AgNPs, the further addition of trace Co2+ can still trigger the signal changes at ~533 nm (Figure 3a), enabling the efficient detection of trace Co2+ in high-concentration Zn2+ solution. The evolution of the particle dispersion state in various solutions is illustrated in Figure 5i.
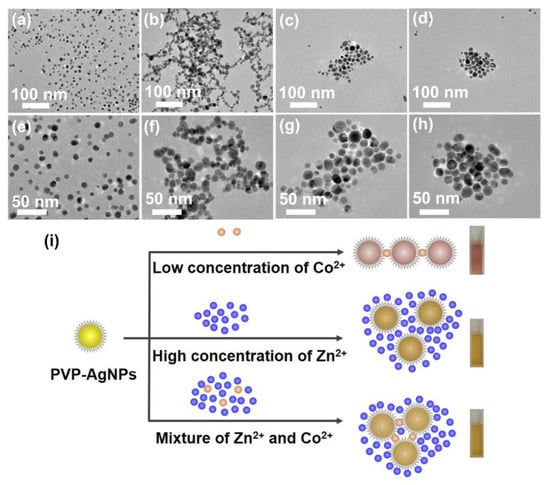
Figure 5.
TEM micrograph and size distributions: (a,e) PVP-AgNPs in pure water free of metal ions; (b,f) PVP-AgNPs in the presence of 2 mg/L Co2+; (c,g) PVP-AgNPs in the presence of 50 g/L Zn2+; (d,h) PVP-AgNPs in the co-existence of 2 mg/L Co2+ and 50 g/L Zn2+. (i) Illustration of the particle behaviors of PVP-AgNPs in various solutions.
The above phenomenon is also manifested by the elements distribution in the TEM results. As shown in Figure 6a–c, a homogeneous distribution of Co2+ on the surface of PVP-AgNPs is observed after addition of 2 mg/L Co2+, which implies that Co2+ is strongly grabbed by the PVP-AgNPs, thus resulting in the efficient detection of trace Co2+ [40]. Similarly, adhesion of Zn2+ on the surface of PVP-AgNPs is also observed (Figure 6d–f), indicating that Zn2+ can be also trapped by the PVP-AgNPs, which explains the strong interference of high-concentration Zn2+ for sensing trace Co2+ by PVP-AgNPs [41]. It should be mentioned that, for co-existed 50 g/L Zn2+ and 2 mg/L Co2+, the dominantly high-concentration Zn2+ (25,000 times that of Co2+) cannot repel the bonding of trace Co2+ with the PVP-AgNPs, as revealed by the element distributions in Figure 6g–j [42]. Therefore, signals can be still found in UV-vis spectra for trace Co2+ in high-concentration Zn2+ solutions.
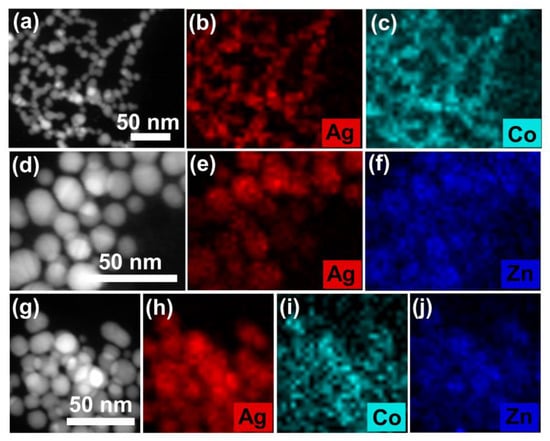
Figure 6.
Elemental mappings of PVP-AgNPs in the presence of (a–c) 2 mg/L Co2+, (d–f) 50 g/L Zn2+, (g–j) mixed solution of 2 mg/L Co2+ and 50 g/L Zn2+.
The above results imply that the sensing ability of PVP-AgNPs is highly relevant with its surface interactions toward metal ions, which is also demonstrated in the zeta potential results and DLS analysis. As shown in Figure 7a, the PVP-AgNPs dispersion presents a large negative value of zeta potential (−9.91 mV), which increases to −0.42 mV after adding 2 mg/L Co2+, again manifesting the adsorption of positive-charged Co2+ on the negative-charged surface of PVP-AgNPs. Additionally, adsorption of Zn2+ takes place after the addition of 50 g/L Zn2+, as revealed by the similar increase of zeta potential from −9.91 mV to 0.19 mV. Importantly, introducing 2 mg/L Co2+ into the 50 g/L Zn2+ solution induces the further increase of zeta potential from 0.19 mV to 0.3 mV, demonstrating that the adsorption of Co2+ in the high-concentration Zn2+ solution (50 g/L) can still proceed smoothly [32].
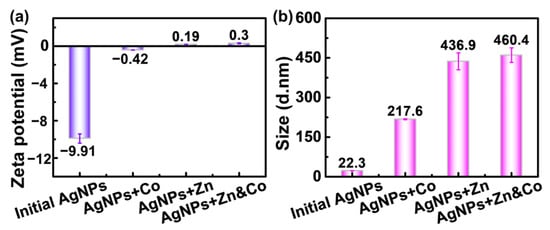
Figure 7.
Zeta potential (a) and dynamic light scattering (b) of PVP-AgNPs before and after the addition of Co2+, Zn2+, and mixed solution of Co2+ and Zn2+. [Co2+] = 2 mg/L, [Zn2+] = 50 g/L.
The adsorption of metal ions on the surfaces of PVP-AgNPs propels the aggregation of the nanoparticles. As shown in Figure 7b, the particle size of initial PVP-AgNPs is only 22.3 nm. The addition of 2 mg/L Co2+ triggers the aggregation of nanoparticles, largely increasing the size to 217.6 nm. Compared with the 2 mg/L Co2+, addition of 50 g/L results in a large size, 436.9 nm, due to a more compact aggregation state (Figure 6b and Figure 7b). Co-addition of 2 mg/L Co2+ and 50 g/L Zn2+ further increases the size to 460.4 nm. The size evolution trend is consistent with that of the zeta potential, proving that aggregation of the nanoparticles is highly dependent on the surface adsorption behaviors. The value discrepancy of particle size between the DLS results and TEM images is due to different measuring theories [43].
The surface interactions for enabling the sensing of trace Co2+ in high-concentration Zn2+ solution is again manifested by the XPS results. As shown in Figure 8a, the initial PVP-AgNPs solution only had a symmetric single peak at 399.79 eV, corresponding to the C–N bond of the coating agent PVP [44,45]. Addition of Co2+ induces the generation of a new Co–N peak at 400.24 eV (Figure 8a) [46], with the bonded nitrogen being increased from 6.7% for 2 mg/L Co2+ to 13.8% for 5 mg/L Co2+. The results indicate that the added Co2+ is bonded with the PVP on the surface of the AgNPs, inducing the aggregation of PVP-AgNPs [29]. Similarly, the added Zn2+ also bonded with the superficial PVP on AgNPs, as shown by the generation of a Zn–N bond at 401.43 eV (Figure 8b) [47]. The concentration of added Zn2+ (50 g/L) is much higher than that of Co2+ (2 mg/L), which provides more metal ions for bonding with the nitrogen in PVP for the former case, thus resulting in a much higher peak intensity of Zn–N than that of Co–N. Obviously, the competing bonding with nitrogen between Zn2+ and Co2+ means that the detection of trace Co2+ by PVP-AgNPs can be interfered with by the dominant Zn2+. Compared with solely adding 50 g/L Zn2+, further introducing 5 mg/L Co2+ again generates the Co–N peak (Figure 8c), which indicates that the smooth bonding of trace Co2+ with PVP-AgNPs in high-concentration Zn2+ solution can still proceed. Therefore, the sensing detection of Co2+ is still feasible in high-concentration Zn2+ solution. It should be mentioned that the bonded nitrogen by Co2+ decreases from 13.8% in 5 mg/L Co2+ solution (Figure 8a) to 10.1% in 5 mg/L Co2++ 50g/L Zn2+ solution (Figure 8c), again substantiating that occupation of the active nitrogen-containing sites in PVP by Zn2+ can mitigate the interaction between Co2+ and PVP-AgNPs.
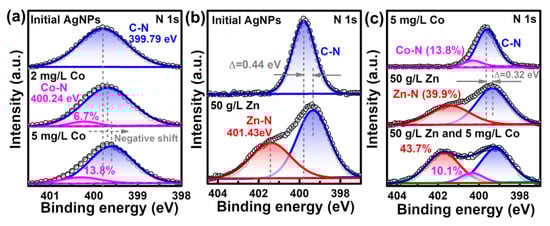
Figure 8.
High-resolution XPS spectra comparisons of N 1s: (a) PVP-AgNPs dispersions with or without Co2+; (b) PVP-AgNPs dispersions with or without Zn2+; (c) PVP-AgNPs dispersions containing Co2+, Zn2+, or Co2+–Zn2+ co-existed ions.
High-concentration Zn2+ in solution dominantly bonds with the nitrogen in PVP on the surface of AgNPs, which leads to the severe aggregation of PVP-AgNPs, posing an obvious interference on the colorimetric detection of trace Co2+. As reported by some researchers, Co2+ has a highly flexible bond length and geometry with a maximum coordination number of six (Figure 9a) [26,29,48], while Zn2+ is four-coordinated [49] with a relatively rigid coordination geometry (Figure 9b). Therefore, the nitrogen in PVP-AgNPs presents a stronger bonding ability for Co2+ than Zn2+, therefore retaining the ability for colorimetric detection of trace Co2+ even in solutions with high-concentration Zn2+. More specifically, the dominant Zn2+ and trace Co2+ compete for bonding with the active nitrogen-containing sites in PVP-AgNPs, mitigating the signal response of Co2+ for colorimetric detection. Although being highly affected by the high-concentration Zn2+, smooth bonding of trace Co2+ can still occur because of the high bonding ability of Co2+ toward nitrogen in PVP-AgNPs, thus still providing the PVP-AgNPs with the sensing ability for trace Co2+.
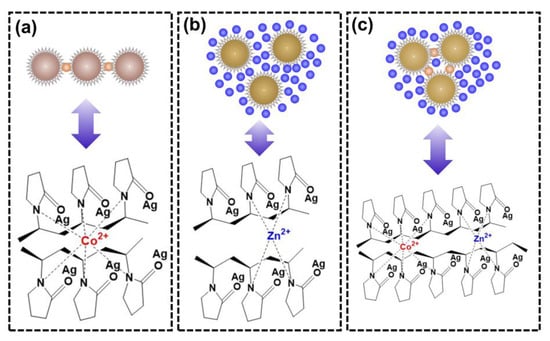
Figure 9.
The coordination modes of PVP-AgNPs with metal ions in various solutions: (a) Co2+; (b) Zn2+; (c) mixture of Co2+ and Zn2+.
3. Materials and Methods
3.1. Materials and Reagents
Silver nitrate (AgNO3, ≥99.8%) was purchased from Sinopharm Chemical Reagent Co., Ltd. (Shanghai, China). NaBH4 (≥98.0%), ZnSO4·7H2O (≥99.5%), Ca(NO3)2·4H2O (≥99.0%), and FeSO4·7H2O (≥99.0%) were acquired from Xilong Scientific Co., Ltd. (Shantou, China). PVP (Mw ≈ 40,000 g/mol) was purchased from Sigma-Aldrich (St. Louis, MO, USA). CoSO4·7H2O (≥99.0%), CuSO4·5H2O (≥99.0%), NiSO4·6H2O (≥99.0%), NaF (≥98.0%), CdSO4·8/3H2O (≥99.0%), and PbCl2 (≥99.0%) were obtained from Aladdin Biochemical Technology Co., Ltd. (Shanghai, China). Ultra-pure water was obtained by a Direct-Q 3 UV water purification system (Millipore, Burlington, MA, USA) and used throughout. All chemicals were used as received without further purification. All metal ion stock solutions were prepared in ultra-pure water.
3.2. Preparation of PVP-AgNPs
The AgNPs were produced by reducing AgNO3 in NaBH4 aqueous solution with PVP used as a capping agent. The 1% PVP (solution A) and 1 mmol/L AgNO3 (solution B) were prepared by adding accurately weighed solid-state PVP and AgNO3 powder into ultra-pure water and stirred moderately with a magnetic stirring apparatus. The 2 mmol/L NaBH4 (solution C) was prepared using fresh ice water and for immediate use. In a typical synthesis procedure, solution C was mixed with solution A in an ice-water bath with moderate magnetic stirring (500 rpm for 5 min). Subsequently, solution B was added into the mixture of solution A and C at the rate of 4 mL/min by injection pump. After all of the AgNO3 solution was added, the stirring was stopped and the solution was transferred into the refrigerator (4 °C). The color of the solution changed from pale yellow to dark yellow after 2 h.
3.3. Sensing Studies
The sensing of Co2+ was performed at room temperature. Briefly, 2.4 mL of Co2+-containing solution of different concentrations and 0.6 mL PVP-AgNPs dispersion were mixed in a colorimetric tube. After incubating for 2 min, the samples were analyzed using an optical spectrometer (UV2600i, Shimadzu, Kyoto, Japan). In the absorption spectroscopy, the peak intensity at 533 nm (A533 nm) and the peak intensity at 393 nm (A393 nm) represent the degree of aggregation and dispersion of nanoparticles, respectively. The absorbance ratio of A533 nm/A393 nm was used as the parameter for Co2+ detection [26,50].
3.4. Characterization
The morphologies of PVP-AgNPs in the absence and presence of Co2+ or Zn2+ were characterized using transmission electron microscopy (TEM, Tecnai G2 F20, FEI, Hillsboro, OR, USA). The elemental mapping images were analyzed using energy dispersive X-ray spectroscopy (EDS) attached to TEM apparatus. The surface chemistries were characterized using X-ray photoelectron spectra (XPS) (ESCALAB 250 Xi, Thermo Fisher Scientific, Waltham, MA, USA), with results being calibrated by C 1s at 284.8 eV. The dynamic light scattering (DLS) measurements and zeta potential were analyzed using the Malvern Zetasizer Nanoseries instrument (ZS90, Malvern, UK). The diameter of the 200 particles was calculated from the TEM images, with the aid of the Nano Measurer 1.2 software (Fudan University, Shanghai, China).
4. Conclusions
The possibility of using PVP-AgNPs for the colorimetric sensing of trace Co2+ in industrial zinc electrolyte with high Zn2+ concentration was systematically investigated. In the absence of Zn2+, Co2+ alone can induce obvious concentration-dependent color change in PVP-AgNPs, from yellow to purple. The addition of high-concentration Zn2+ leads to both the color variation and signal attenuation in UV-vis spectra for Co2+. Even so, the UV-vis spectra still promise a good linear relationship between the signal intensity and concentration of Co2+ in the high-concentration Zn2+ solution, namely 1–6 mg/L Co2+ in 50 g/L Zn2+ solution. Moreover, the fluctuation of Zn2+ concentration and the co-existence of other typical impurity ions show negligible influence on this plausible linear relationship for trace Co2+ detection. The morphology observation, surface chemistry, and particle size distribution together show that the dominant high-concentration Zn2+ competingly bonds with the active nitrogen-containing sites on PVP-AgNPs, therefore affecting the particle aggregation behavior and color variation as well as UV-vis response for the colorimetric detection of trace Co2+. However, the interference of dominant Zn2+ in the solution cannot stop the bonding of Co2+ with the nitrogen in PVP-AgNPs, which enables the smooth detection of trace Co2+ in high-concentration Zn2+ solution, although with a much weakened signal response. The results may provide new insights for trace Co2+ detection for industrial zinc electrolyte with an extremely high Zn2+ solution.
Author Contributions
Conceptualization, S.Z. and N.X.; methodology, N.X.; software, W.W.; validation, W.W. and J.K.; formal analysis, D.T.; investigation, N.X. and L.Z.; resources, X.C.; data curation, N.X. and Z.D.; writing—original draft preparation, N.X.; writing—review and editing, W.W. and W.T.; visualization, X.C.; supervision, S.Z.; project administration, W.W.; funding acquisition, S.Z. All authors have read and agreed to the published version of the manuscript.
Funding
This research was funded by the National Key Basic Research and Development Program (No. 2022YFC3900801), National Natural Science Foundation (No. 51874101, No. 52274349).
Institutional Review Board Statement
Not applicable.
Informed Consent Statement
Not applicable.
Data Availability Statement
The data presented in this study are available on reasonable request from the corresponding author.
Acknowledgments
We gratefully acknowledge the Test Center of Fuzhou University for its support in testing instruments.
Conflicts of Interest
The authors declare no conflict of interest.
Sample Availability
Samples of the PVP-AgNPs compounds are available from the authors.
References
- Mazur, F.; Liu, L.; Li, H.; Huang, J.; Chandrawati, R. Core-satellite gold nanoparticle biosensors for monitoring cobalt ions in biological samples. Sens. Actuat. B-Chem. 2018, 268, 182–187. [Google Scholar] [CrossRef]
- Chen, Z.; Zhang, Z.; Qi, J.; You, J.; Ma, J.; Chen, L. Colorimetric detection of heavy metal ions with various chromogenic materials: Strategies and applications. J. Hazard. Mater. 2022, 441, 129889. [Google Scholar] [CrossRef] [PubMed]
- Thakkar, S.; Dumee, L.F.; Gupta, M.; Singh, B.R.; Yang, W. Nano-enabled sensors for detection of arsenic in water. Water Res. 2021, 188, 116538. [Google Scholar] [CrossRef]
- Kerdkok, D.; Apiratikul, N.; Tongraung, P.; Jittangprasert, P. Functionalized silver nanoparticles as selective colorimetric sensors for Fe3+. Iran. J. Sci. Technol. Trans. Sci. 2022, 46, 395–403. [Google Scholar] [CrossRef]
- Monisha; Shrivas, K.; Kant, T.; Patel, S.; Devi, R.; Dahariya, N.S.; Pervez, S.; Deb, M.K.; Rai, M.K.; Rai, J. Inkjet-printed paper-based colorimetric sensor coupled with smartphone for determination of mercury (Hg2+). J. Hazard. Mater. 2021, 414, 125440. [Google Scholar] [CrossRef]
- Chaiyo, S.; Siangproh, W.; Apilux, A.; Chailapakul, O. Highly selective and sensitive paper-based colorimetric sensor using thiosulfate catalytic etching of silver nanoplates for trace determination of copper ions. Anal. Chim. Acta 2015, 866, 75–83. [Google Scholar] [CrossRef]
- Ramachandiran, D.; Rajesh, K. Selective colorimetric and fluorimertic sensor of Hg (II) ion from silver nanoparticles using Acacia chundra leaves extract. Mater. Chem. Phys. 2022, 287, 126284. [Google Scholar] [CrossRef]
- Wang, H.; Da, L.; Yang, L.; Chu, S.; Yang, F.; Yu, S.; Jiang, C. Colorimetric fluorescent paper strip with smartphone platform for quantitative detection of cadmium ions in real samples. J. Hazard. Mater. 2020, 392, 122506. [Google Scholar] [CrossRef]
- Guo, Y.; Zhang, Y.; Shao, H.; Wang, Z.; Wang, X.; Jiang, X. Label-free colorimetric detection of cadmium ions in rice samples using gold nanoparticles. Anal. Chem. 2014, 86, 8530–8534. [Google Scholar] [CrossRef]
- Wang, F.; Dai, J.; Shi, H.; Luo, X.; Xiao, L.; Zhou, C.; Guo, Y.; Xiao, D. A rapid and colorimetric biosensor based on GR-5 DNAzyme and self-replicating catalyzed hairpin assembly for lead detection. Anal. Methods-UK 2020, 12, 2215–2220. [Google Scholar] [CrossRef]
- Zhao, J.; Wang, W.; Cai, Q.; Wang, F.; Xie, R.; Ju, X.; Liu, Z.; Chu, L. Efficient detection of hyperkalemia with highly transparent and ion-recognizable hydrogel grating sensors. Ind. Eng.Chem. Res. 2022, 61, 2483–2493. [Google Scholar] [CrossRef]
- Kamnoet, P.; Aeungmaitrepirom, W.; Menger, R.F.; Henry, C.S. Highly selective simultaneous determination of Cu(II), Co(II), Ni(II), Hg(II), and Mn(II) in water samples using microfluidic paper-based analytical devices. Analyst 2021, 146, 2229–2239. [Google Scholar] [CrossRef] [PubMed]
- Xu, R.D.; Huang, L.P.; Zhou, J.F.; Zhan, P.; Guan, Y.; Kong, Y. Effects of tungsten carbide on electrochemical properties and microstructural features of Al/Pb-PANI-WC composite inert anodes used in zinc electrowinning. Hydrometallurgy 2012, 125, 8–15. [Google Scholar] [CrossRef]
- Nelson, A.; Wang, W.; Demopoulos, G.P.; Houlachi, G. The removal of cobalt from zinc electrolyte by cementation: A critical review. Miner. Process. Extr. Metall. 2000, 20, 325–356. [Google Scholar] [CrossRef]
- Zhu, H.Q.; Du, J.; Li, Y.G.; Zhang, T.M.; Cheng, F. Selective determination of trace cobalt in zinc electrolytes by second-derivative catalytic polarography. J. Cent. South Univ. 2019, 26, 207–218. [Google Scholar] [CrossRef]
- Bobrowski, A. Review of adsorptive stripping voltammetric methods for cobalt determination in the presence of a zinc matrix. Fresenius J. Anal. Chem. 1994, 349, 613–619. [Google Scholar] [CrossRef]
- Oleszczuk, N.; Castro, J.T.; da Silva, M.M.; Maria das Graças, A.K.; Welz, B.; Vale, M.G.R. Method development for the determination of manganese, cobalt and copper in green coffee comparing direct solid sampling electrothermal atomic absorption spectrometry and inductively coupled plasma optical emission spectrometry. Talanta 2007, 73, 862–869. [Google Scholar] [CrossRef]
- Ghasemi, J.; Shahabadi, N.; Seraji, H.R. Spectrophotometric simultaneous determination of cobalt, copper and nickel using nitroso-R-salt in alloys by partial least squares. Anal. Chim. Acta 2004, 510, 121–126. [Google Scholar] [CrossRef]
- Gauthama, B.; Narayana, B.; Sarojini, B.; Suresh, N.; Sangappa, Y.; Kudva, A.K.; Satyanarayana, G.; Raghu, S.V. Colorimetric “off–on” fluorescent probe for selective detection of toxic Hg2+ based on rhodamine and its application for in-vivo bioimaging. Microchem. J. 2021, 166, 106233. [Google Scholar] [CrossRef]
- Xu, X.; Niu, X.; Li, X.; Li, Z.; Du, D.; Lin, Y. Nanomaterial-based sensors and biosensors for enhanced inorganic arsenic detection: A functional perspective. Sens. Actuat. B-Chem. 2020, 315, 128100. [Google Scholar] [CrossRef]
- Da Maia, R. Determination of cobalt in the presence of high concentrations of zinc by differential pulse polarography. Fresenius’ Z. Anal. Chem. 1988, 330, 624–626. [Google Scholar]
- Mrzljak, R.I.; Bond, A.M.; Cardwell, T.J.; Cattrall, R.W.; Knight, R.W.; Newman, O.M.G.; Champion, B.R.; Hey, J.; Bobrowski, A. On-line monitoring of cobalt ion zinc plant electrolyte by differential pulse adsorptive stripping voltammetry. Anal. Chim. Acta 1993, 281, 281–290. [Google Scholar] [CrossRef]
- Zhang, M.H.; Liang, Y.Z. Rapid and simultaneous determination of copper, cadmium, nickel, and cobalt in zinc electrolyte solutions by complex adsorption wave polarography. J. Trace Microprobe Tech. 2007, 20, 1–14. [Google Scholar] [CrossRef]
- Korolczuk, M.; Grabarczyk, M.; Moroziewicz, A. Determination of traces of cobalt in zinc matrix by catalytic adsorptive stripping voltammetry at bismuth film electrode. Electroanalysis 2007, 19, 2155–2158. [Google Scholar] [CrossRef]
- Amirjani, A.; Haghshenas, D.F. Ag nanostructures as the surface plasmon resonance (SPR)˗based sensors: A mechanistic study with an emphasis on heavy metallic ions detection. Sens. Actuat. B-Chem. 2018, 273, 1768–1779. [Google Scholar] [CrossRef]
- Yao, Y.; Tian, D.; Li, H. Cooperative binding of bifunctionalized and click-synthesized silver nanoparticles for colorimetric Co2+ sensing. ACS Appl. Mater. Interfaces 2010, 2, 684–690. [Google Scholar] [CrossRef]
- Zafer, M.; Keskin, C.S.; Ozdemir, A. Highly sensitive determination of Co(II) ions in solutions by using modified silver nanoparticles. Spectrochim. Acta A 2020, 239, 118487. [Google Scholar] [CrossRef]
- Mochi, F.; Burratti, L.; Fratoddi, I.; Venditti, I.; Battocchio, C.; Carlini, L.; Iucci, G.; Casalboni, M.; De Matteis, F.; Casciardi, S.; et al. Plasmonic Sensor Based on Interaction between Silver Nanoparticles and Ni2+ or Co2+ in Water. Nanomaterials 2018, 8, 488. [Google Scholar] [CrossRef]
- Rajar, K.; Alveroglu, E.; Caglar, M.; Caglar, Y. Highly selective colorimetric onsite sensor for Co2+ ion detection by povidone capped silver nanoparticles. Mater. Chem. Phys. 2021, 273, 125082. [Google Scholar] [CrossRef]
- Slistan-Grijalva, A.; Herrera-Urbina, R.; Rivas-Silva, J.F.; Ávalos-Borja, M.; Castillón-Barraza, F.F.; Posada-Amarillas, A. Classical theoretical characterization of the surface plasmon absorption band for silver spherical nanoparticles suspended in water and ethylene glycol. Phys. E 2005, 27, 104–112. [Google Scholar] [CrossRef]
- Yousefi, S.; Saraji, M. Optical aptasensor based on silver nanoparticles for the colorimetric detection of adenosine. Spectrochim. Acta A 2019, 213, 1–5. [Google Scholar] [CrossRef] [PubMed]
- Shanmugaraj, K.; Sasikumar, T.; Campos, C.H.; Ilanchelian, M.; Mangalaraja, R.V.; Torres, C.C. Colorimetric determination of cysteamine based on the aggregation of polyvinylpyrrolidone-stabilized silver nanoparticles. Spectrochim. Acta A 2020, 236, 118281. [Google Scholar] [CrossRef] [PubMed]
- Boruah, B.S.; Daimari, N.K.; Biswas, R. Functionalized silver nanoparticles as an effective medium towards trace determination of arsenic (III) in aqueous solution. Results Phys. 2019, 12, 2061–2065. [Google Scholar] [CrossRef]
- Guanggui, M.; Runde, W.; Jingyuan, Z. Zinc Hydrometallurgy; Central South University Press: Changsha, China, 2001; pp. 277–278. [Google Scholar]
- Tozawa, K.; Nishimura, T.; Akahori, M.; Malaga, M.A. Comparison between purification processes for zinc leach solutions with arsenic and antimony trioxides. Hydrometallurgy 1992, 30, 445–461. [Google Scholar] [CrossRef]
- Gong, Y.; Zhang, W.; Xiong, Z. Zinc-ion concentration control based on mechanical model of zinc electrowinning process. CIESC J. 2013, 12, 019. [Google Scholar]
- Cinti, S.; Fiore, L.; Massoud, R.; Cortese, C.; Moscone, D.; Palleschi, G.; Arduini, F. Low-cost and reagent-free paper-based device to detect chloride ions in serum and sweat. Talanta 2018, 179, 186–192. [Google Scholar] [CrossRef]
- Doan, V.-D.; Phan, T.L.; Vasseghian, Y.; Evgenievna, L.O. Efficient and fast degradation of 4-nitrophenol and detection of Fe (III) ions by Poria cocos extract stabilized silver nanoparticles. Chemosphere 2022, 286, 131894. [Google Scholar] [CrossRef]
- Kazemi, E.; Dadfarnia, S.; Shabani, A.M.H.; Fattahi, M.R.; Khodaveisi, J. Indirect spectrophotometric determination of sulfadiazine based on localized surface plasmon resonance peak of silver nanoparticles after cloud point extraction. Spectrochim. Acta A 2017, 187, 30–35. [Google Scholar] [CrossRef]
- Weng, W.; Yang, J.; Zhou, J.; Gu, D.; Xiao, W. Template-free electrochemical formation of silicon nanotubes from silica. Adv. Sci. 2020, 7, 2001492. [Google Scholar] [CrossRef]
- Weng, W.; Zhou, J.; Gu, D.; Xiao, W. Thermoelectrochemical formation of Fe/Fe3C@hollow N-doped carbon in molten salts for enhanced catalysis. J. Mater. Chem. A 2020, 8, 4800–4806. [Google Scholar] [CrossRef]
- Weng, W.; Zeng, C.; Xiao, W. In situ pyrolysis concerted formation of Si/C hybrids during molten salt electrolysis of SiO2@polydopamine. ACS Appl. Mater. Inter. 2019, 11, 9156–9163. [Google Scholar] [CrossRef] [PubMed]
- Annadhasan, M.; Kasthuri, J.; Rajendiran, N. Green synthesis of gold nanoparticles under sunlight irradiation and their colorimetric detection of Ni2+ and Co2+ ions. RSC Adv. 2015, 5, 11458–11468. [Google Scholar] [CrossRef]
- Huang, W.Y.; Xu, G.C. Characterization of nano-Ag/PVP composites synthesized via ultra-violet irradiation. J. Coal Sci. Eng. 2010, 16, 188–192. [Google Scholar] [CrossRef]
- Weng, W.; Wang, S.; Xiao, W.; Lou, X.W. Direct conversion of rice husks to nanostructured SiC/C for CO2 photoreduction. Adv. Mater. 2020, 32, 2001560. [Google Scholar] [CrossRef]
- Qian, M.; Xu, M.; Guo, M.; Isimjan, T.T.; Shoko, E.; Shi, Z.; Yang, X. Synergistically catalytic enhanced of Zn–N/Co–N dual active sites as highly efficient and durable bifunctional electrocatalyst for rechargeable zinc-air battery. J. Power Sources 2021, 506, 230221. [Google Scholar] [CrossRef]
- Wang, W.; Shang, N.; Wang, J.; Nie, X.; Du, C.; Zhou, X.; Cheng, X.; Gao, W.; Liu, X.; Huang, J. A stable single-atom Zn catalyst synthesized by a ligand-stabilized pyrolysis strategy for selective oxidation of C–H bonds. Green Chem. 2022, 24, 6008–6015. [Google Scholar] [CrossRef]
- El-Safty, S.A. Functionalized hexagonal mesoporous silica monoliths with hydrophobic azo-chromophore for enhanced Co(II) ion monitoring. Adsorption 2009, 15, 227–239. [Google Scholar] [CrossRef]
- Atrian-Blasco, E.; Gonzalez, P.; Santoro, A.; Alies, B.; Faller, P.; Hureau, C. Cu and Zn coordination to amyloid peptides: From fascinating chemistry to debated pathological relevance. Coordin. Chem. Rev. 2018, 375, 38–55. [Google Scholar] [CrossRef]
- Satheeshkumar, E.; Yang, J.; Srinivasadesikan, V.; Lin, M.C. Simultaneous production and surface functionalization of silver nanoparticles for label-free colorimetric detection of copper ion. Anal. Sci. 2017, 33, 1115–1121. [Google Scholar] [CrossRef]
Disclaimer/Publisher’s Note: The statements, opinions and data contained in all publications are solely those of the individual author(s) and contributor(s) and not of MDPI and/or the editor(s). MDPI and/or the editor(s) disclaim responsibility for any injury to people or property resulting from any ideas, methods, instructions or products referred to in the content. |
© 2023 by the authors. Licensee MDPI, Basel, Switzerland. This article is an open access article distributed under the terms and conditions of the Creative Commons Attribution (CC BY) license (https://creativecommons.org/licenses/by/4.0/).