Article

Hall Effect Anisotropy in the Paramagnetic Phase of Ho0.8Lu0.2B12 Induced by Dynamic Charge Stripes

by
Artem L. Khoroshilov
1,*,
Kirill M. Krasikov
1,*,
Andrey N. Azarevich
1,2,
Alexey V. Bogach
1,
Vladimir V. Glushkov
1,
Vladimir N. Krasnorussky
1,3,
Valery V. Voronov
1,
Natalya Y. Shitsevalova
4,
Volodymyr B. Filipov
4,
Slavomir Gabáni
5,
Karol Flachbart
5 and
Nikolay E. Sluchanko
1,*
1
Prokhorov General Physics Institute of the Russian Academy of Sciences, 38, Vavilov Str., 119991 Moscow, Russia
2
Moscow Institute of Physics and Technology (State University), 141700 Moscow, Russia
3
Vereshchagin Institute for High Pressure Physics of RAS, 14 Kaluzhskoe Shosse, 142190 Troitsk, Russia
4
Institute for Problems of Materials Science, NASU, Krzhizhanovsky Str., 3, 03142 Kyiv, Ukraine
5
Institute of Experimental Physics SAS, 47, Watsonova, 04001 Košice, Slovakia
*
Authors to whom correspondence should be addressed.
Molecules 2023, 28(2), 676; https://doi.org/10.3390/molecules28020676
Submission received: 7 November 2022 / Revised: 22 December 2022 / Accepted: 31 December 2022 / Published: 9 January 2023
(This article belongs to the Special Issue New Science of Boron Allotropes, Compounds, and Nanomaterials)

Abstract

:
A detailed study of charge transport in the paramagnetic phase of the cage-cluster dodecaboride Ho0.8Lu0.2B12 with an instability both of the fcc lattice (cooperative Jahn–Teller effect) and the electronic structure (dynamic charge stripes) was carried out at temperatures 1.9–300 K in magnetic fields up to 80 kOe. Four mono-domain single crystals of Ho0.8Lu0.2B12 samples with different crystal axis orientation were investigated in order to establish the singularities of Hall effect, which develop due to (i) the electronic phase separation (stripes) and (ii) formation of the disordered cage-glass state below T*~60 K. It was demonstrated that a considerable intrinsic anisotropic positive component ρanxy appears at low temperatures in addition to the ordinary negative Hall resistivity contribution in magnetic fields above 40 kOe applied along the [001] and [110] axes. A relation between anomalous components of the resistivity tensor ρanxyanxx1.7 was found for H||[001] below T*~60 K, and a power law ρanxyanxx0.83 for the orientation H||[110] at temperatures T < TS~15 K. It is argued that below characteristic temperature TS~15 K the anomalous odd ρanxy(T) and even ρanxx(T) parts of the resistivity tensor may be interpreted in terms of formation of long chains in the filamentary structure of fluctuating charges (stripes). We assume that these ρanxy(H||[001]) and ρanxy(H||[110]) components represent the intrinsic (Berry phase contribution) and extrinsic (skew scattering) mechanism, respectively. Apart from them, an additional ferromagnetic contribution to both isotropic and anisotropic components in the Hall signal was registered and attributed to the effect of magnetic polarization of 5d states (ferromagnetic nano-domains) in the conduction band of Ho0.8Lu0.2B12.

1. Introduction

Numerous fundamental studies on strongly correlated electron systems (SCES) such as manganites [1,2,3,4], high-temperature superconducting (HTSC) cuprates [5,6,7,8], iron-based superconductors [9,10,11,12,13], chalcogenides [14], etc., have allowed for the discovery of a diversity of physical phenomena universal to SCES. Indeed, all these systems are characterized by a complexity of phase diagrams induced by strong phase separation due to structural or electronic instability [15]. The spatial electronic/magnetic inhomogeneity turns out to be directly related to simultaneously active spin, charge, orbital, and lattice degrees of freedom, which are considered as factors responsible for the appearance of high-temperature superconductivity in cuprates, as well as for the emergence of colossal magnetoresistance in manganites [5,16,17,18]. In particular, there are two possible mechanisms of the formation of spatially inhomogeneous ground states in SCES [19]: (i) disorder resulting from phase separation near a first-order metal–insulator transition caused by an external factor [19,20] and (ii) frozen disorder in the glass phase with short-range order formed by nanoscale clusters [21,22,23]. In the second case, one more and among the most significant mechanisms leading to an inhomogeneous glass state in HTSC oxides is the formation of static and dynamic charge stripes [24]. Such structures have been repeatedly observed in HTSC cuprates and nickelates by both direct and indirect techniques [25,26,27,28,29].
Studying the effect of spatial charge inhomogeneity on the scattering of charge carriers in HTSC cuprates, manganites, and other SCES is rather difficult due to their complex composition, low symmetry crystal structure, and high sensitivity to external conditions (pressure, magnetic field, etc., see, e.g., [4]). In this respect, it looks promising to use another model SCES—rare-earth dodecaborides (RB12). The RB12 (R—Tb, Dy, Ho, Er, Tm, Yb and Lu) attract considerable attention due to the unique combination of their physical properties, such as high melting point, microhardness, and high chemical resistance, which create prospects for practical applications [30,31,32,33]. These materials are also extremely interesting for fundamental studies. Indeed, both electronic (dynamic charge stripes) and structural (cooperative dynamic Jahn–Teller (JT) effect of the boron sub-lattice) instabilities take place in these high-boron borides with a simple fcc lattice (space group F m 3 ¯ m , see Figure 1a), in which stoichiometry can be reliably controlled during crystal growth [34].
Let us name the main factors that determine the appearance of spatial inhomogeneity, leading to symmetry lowering in fcc rare earth (RE) dodecaborides. Firstly, the cooperative dynamic Jahn–Teller effect in the rigid boron sub-lattice with covalent bonds that leads to lifting of degeneracy of the highest occupied molecular orbitals (HOMO) in B12 octahedrons and produces static structural distortions with related splitting EJT~500–1500 K (~50–150 meV) of HOMO [36]. Secondly, reaching the Ioffe–Regel limit near TE~150 K (~15 meV) causes a development of vibrational instability, which leads to an increase in the density of phonon states at T~TE [37]. Thirdly, order–disorder transition to the cage-glass state at T*~60 K (~5–6 meV) causes random displacements of RE ions from central symmetric positions in B24 cuboctahedra, which form a rigid covalent boron framework [37]. Fourthly, well below T* large amplitude vibrations of neighbored RE ions in trigonal planes (transverse to the axis of the ferrodistortive JT effect [36]) produce periodic changes of hybridization between the 5d(RE) and 2p(B) states in the conduction band. This leads to the emergence of high-frequency charge density fluctuations with frequencies νS~240 GHz [38] (denoted also as dynamic charge stripes, see Figure 1a) along one of the <110> direction in the fcc structure [39,40,41,42]. Stripe patterns are formed at characteristic temperature TS~hνS/kB~15 K (~1 meV). These structural and electronic instabilities initiate nanoscale phase separation and inevitably cause strong charge transport anisotropy in external magnetic field both in the nonmagnetic reference LuB12 [37] and in magnetic RB12 [41,42,43,44,45,46]. In particular, the above features of the crystal and electronic structure of RB12 have a decisive effect on the characteristics of charge transport when Lu ions (with a filled f-shell, 4f14 configuration) are partially replaced by magnetic Ho (4f10) ions in HoxLu1-xB12 compounds.
The spatial inhomogeneity of fluctuating electron density is the origin for the strong anisotropy of magnetic phase diagrams in these systems (see, e.g., Figure 1b–d for the best quality single-domain crystals of Ho0.8Lu0.2B12 and [35,43,44,45,46]). Indeed, strong magnetic anisotropy is observed, for instance, in HoxLu1-xB12 with a high concentration of magnetic ions both in the paramagnetic (P) state (see the color plot in Figure 1e demonstrating the anisotropy of magnetoresistance) and on the angular antiferromagnetic (AF) phase diagrams, which reveal a Maltese cross-symmetry (see Figure 1f,g, [35,43,44] and also [46] for TmB12). It is worth noting that, like in the nonmagnetic reference compound LuB12, strong charge transport anisotropy is observed in the paramagnetic state of HoxLu1-xB12, ErB12 [45], and TmB12 [46] (see, for example, Figure 1e and [47]) and attributed to interaction of electron density fluctuations (stripes) with external steady magnetic field (for recent review see [48] and references therein).
Until now, studies of electron transport in HoxLu1-xB12 have mainly focused on transverse magnetoresistance (see, e.g., [35,43,47]). Nevertheless, the recent study of LuB12 [49] and the initial short research on Ho0.8Lu0.2B12 (Ref. [50]) have demonstrated a significant anisotropy of the Hall effect due to an anomalous positive anisotropic contribution that appeared below T*~60 K. Thus, it is of great interest to study in detail the effect of electronic phase separation on the off-diagonal component of the resistivity tensor in model magnetic compound Ho0.8Lu0.2B12 with dynamic charge stripes. As a continuation of the short study conducted in [50], this work presents results and detailed analyses of the normal and anomalous contributions to the Hall effect in the paramagnetic phase of Ho0.8Lu0.2B12. We investigated both the angular and magnetic field dependences of Hall resistivity in detail and determined the anisotropic component of the resistivity tensor for this model system with electronic phase separation (dynamic charge stripes). The observed complex angular behavior of the anisotropic Hall resistivity is attributed to interaction of the filamentary structure of fluctuating charges with the external magnetic field. The arguments presented here favor both intrinsic and extrinsic mechanisms of the anomalous Hall effect formation.

2. Experimental Results and Data Analysis

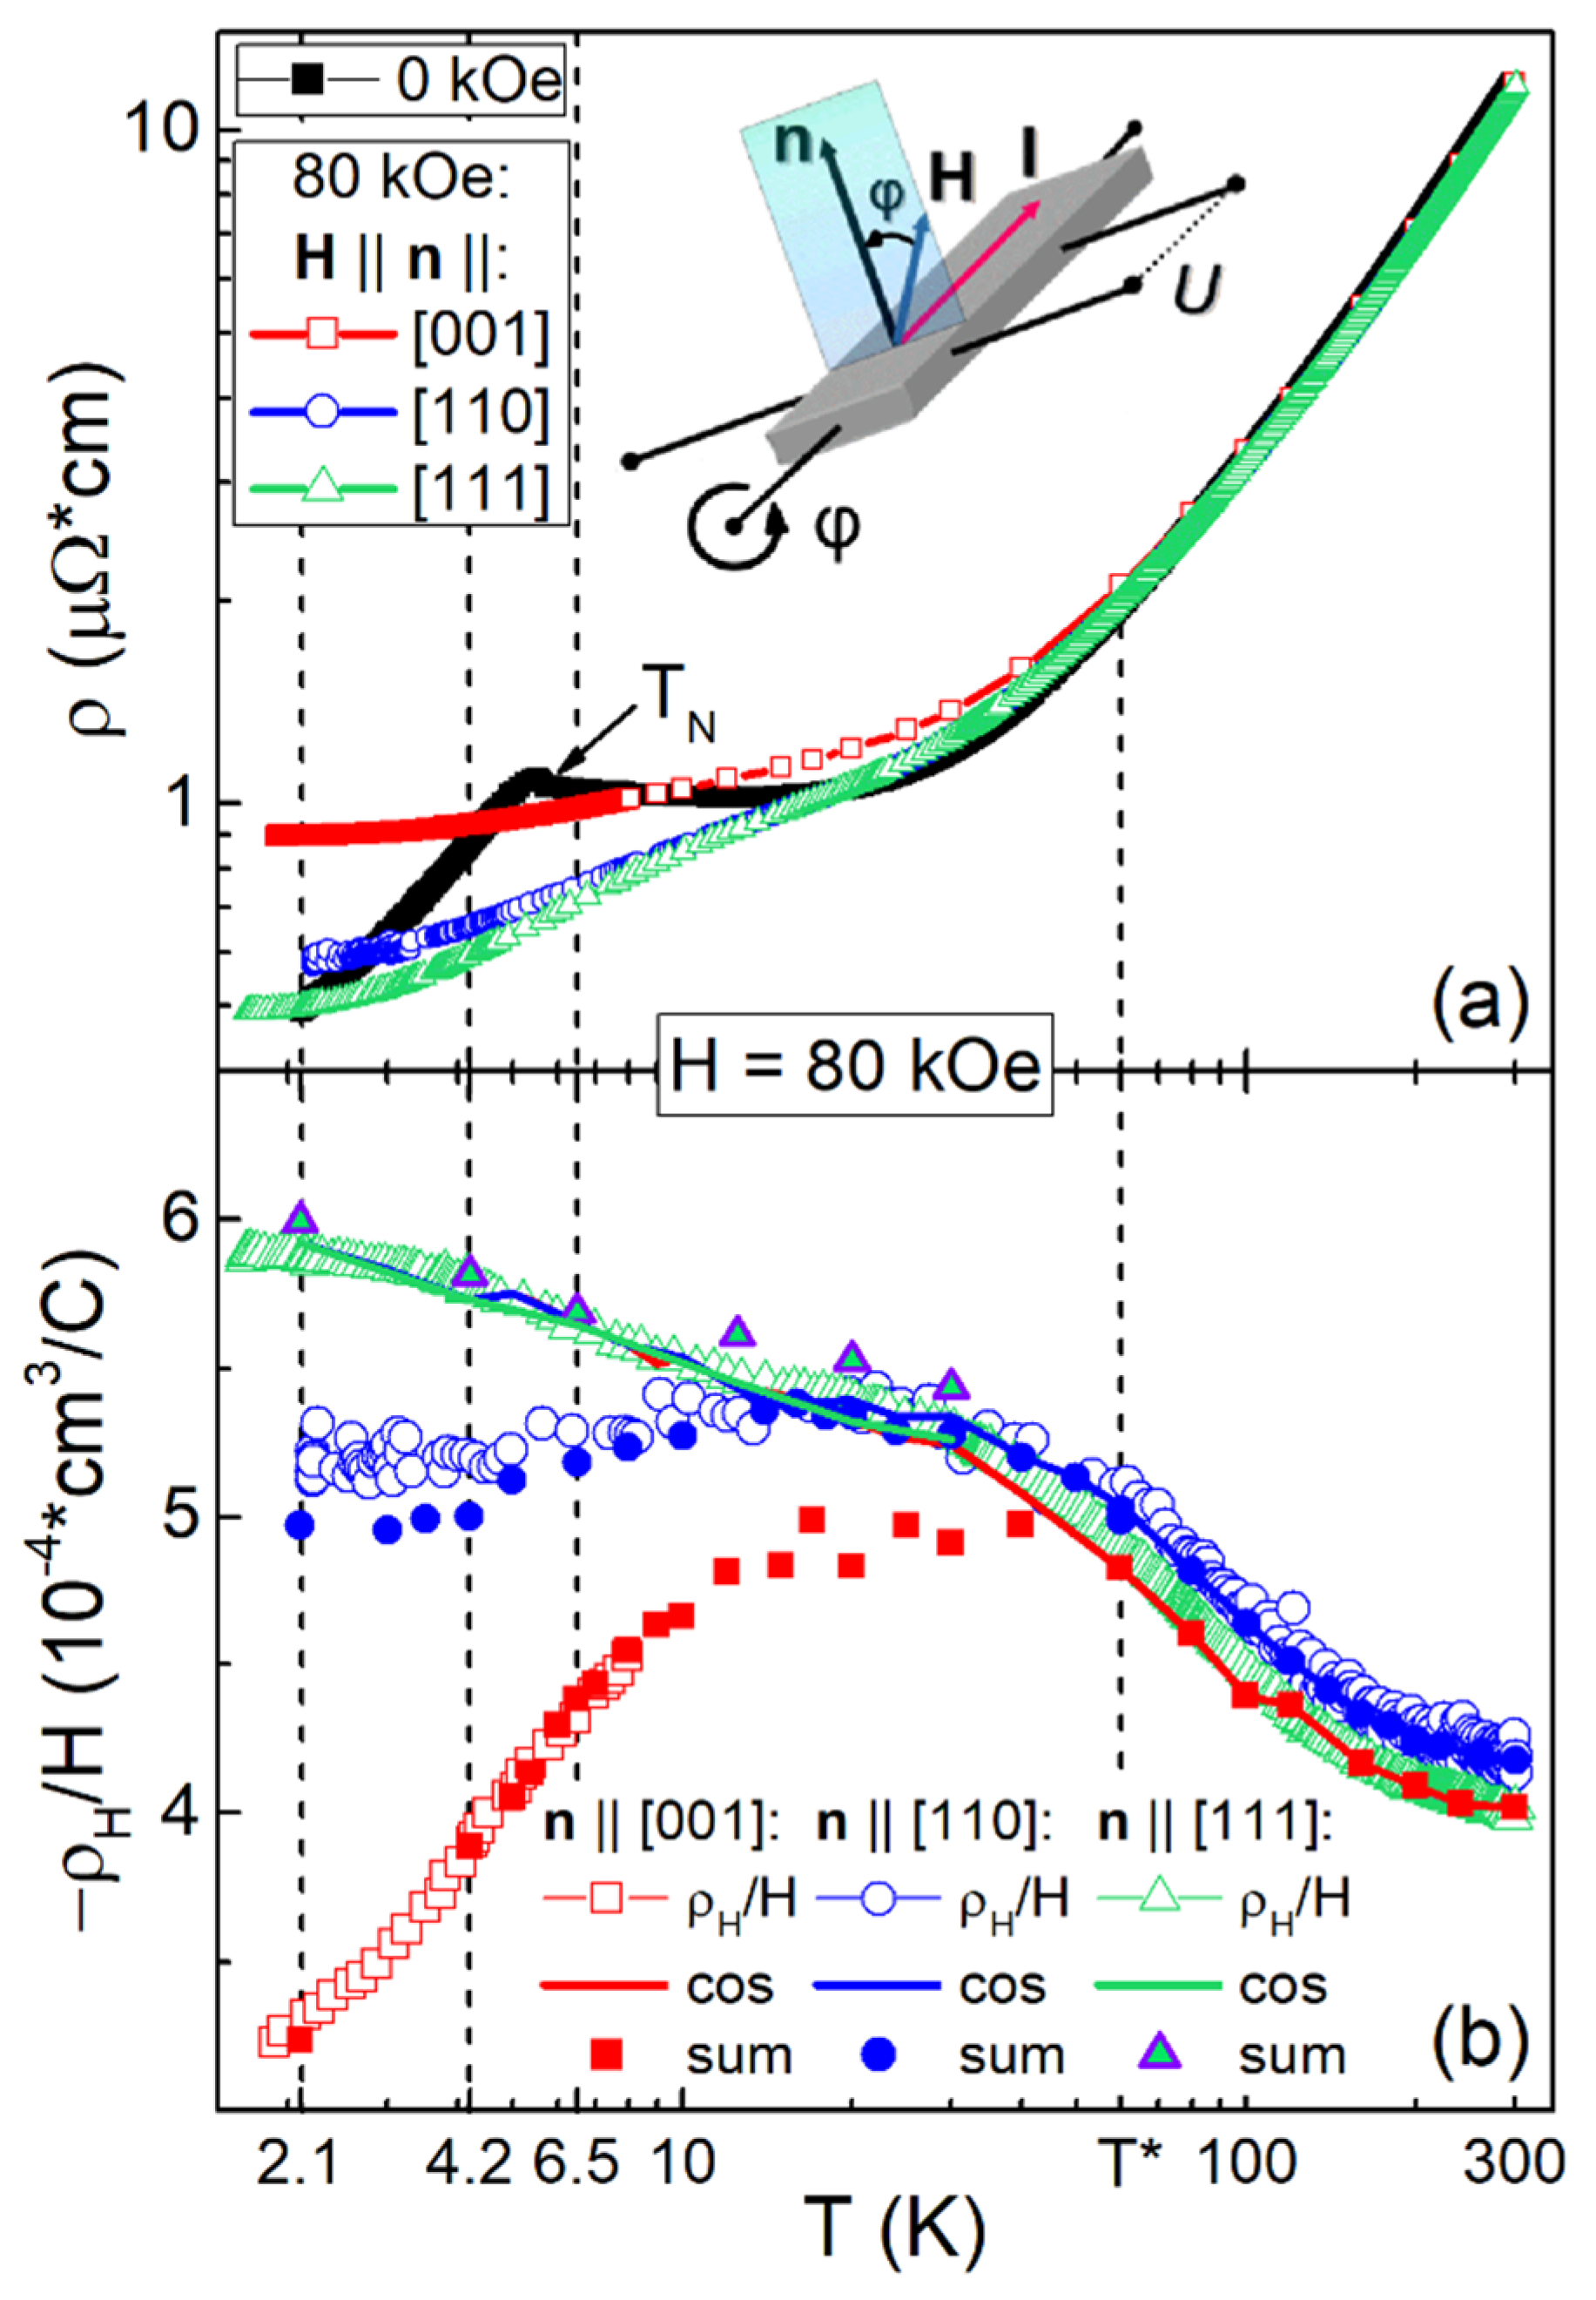
2.1. Temperature Dependences of Resistivity and Hall Resistivity

In conventional Hall effect experiments the Hall coefficient is calculated as RH = ρH/H = ((VH(+H) − VH(–H))/(2I))·d/H, where d is the sample thickness, I the excitation current and VH(±H) the voltage measured on Hall probes in two opposite directions of external magnetic field. Taking into account the complex field dependence of Hall effect in parent compound LuB12 [49], and the different origin of the detected anomalous contributions to Hall resistivity [51], the term “reduced Hall resistivity” for ρH/H is used below in the present study instead of the Hall coefficient RH.
Figure 2 shows the temperature dependences of resistivity ρ(T) at H = 0 and 80 kOe, as well as the reduced Hall resistivity ρH(T)/H in Ho0.8Lu0.2B12 calculated from experimental results recorded for three different crystals with principal directions H||n||[001], H||n||[110], and H||n||[111], and identical DC current direction I || [ 110 ¯ ]. Vertical solid lines point to the transition to the cage-glass state at T*~60 K [37] and to the formation of stripes at TS~15 K (see also discussion below). In the zero-magnetic field, the ρ(T) curves measured for all three Ho0.8Lu0.2B12 samples correspond to metallic conductivity with the same RRR value ρ(300 K)/ρ(4.2 K) = 13.47 (Figure 2a). The data for H = 0 kOe and 80 kOe are clearly separated below T*~ 60 K, indicating a pronounced sign-alternating magnetoresistance. Note that the ρ(T, H = 80 kOe) curves for crystals with n||[110] and n||[111] match together above the characteristic temperature TS~15 K and differ noticeably at lower temperatures. On the contrary, at T < T*~60 K, the ρ(T, H = 80 kOe) dependence for field direction H||n||[001] lies well above those for H||n||[110] and H||n||[111], so the MR anisotropy reaches values ρ(n||[001])/ρ(n||[111]) ≈ 1.8 (MR~80%) at T = 2.1 K. Open symbols in Figure 2b show the results of ρH/H(T) measurements in the scheme with two opposite orientations of H. Significant differences between the ρH/H(T) dependences for different field directions appear below T*~60 K, while the curves for samples with H||n||[110] and H||n||[111] start to diverge below 15 K. In this case, the lowest negative values of ρH/H(T) are detected for the n||[001] sample, while the highest values are observed for H||n||[111]. The maximal anisotropy of the reduced Hall resistivity at T = 2.1 K and H = 80 kOe equals to ρH/H(n||[111])/ρH/H(n||[001]) ≈ 1.8 (~80%), which is very similar to resistivity anisotropy. Thus, the temperature dependences of ρH/H(T) allow to identify some anisotropic positive component of the Hall signal, which appears in Ho0.8Lu0.2B12 in strong magnetic fields. It is worth noting that temperature-lowering results in the increase in anisotropy for both Hall resistivity and MR components (Figure 2).

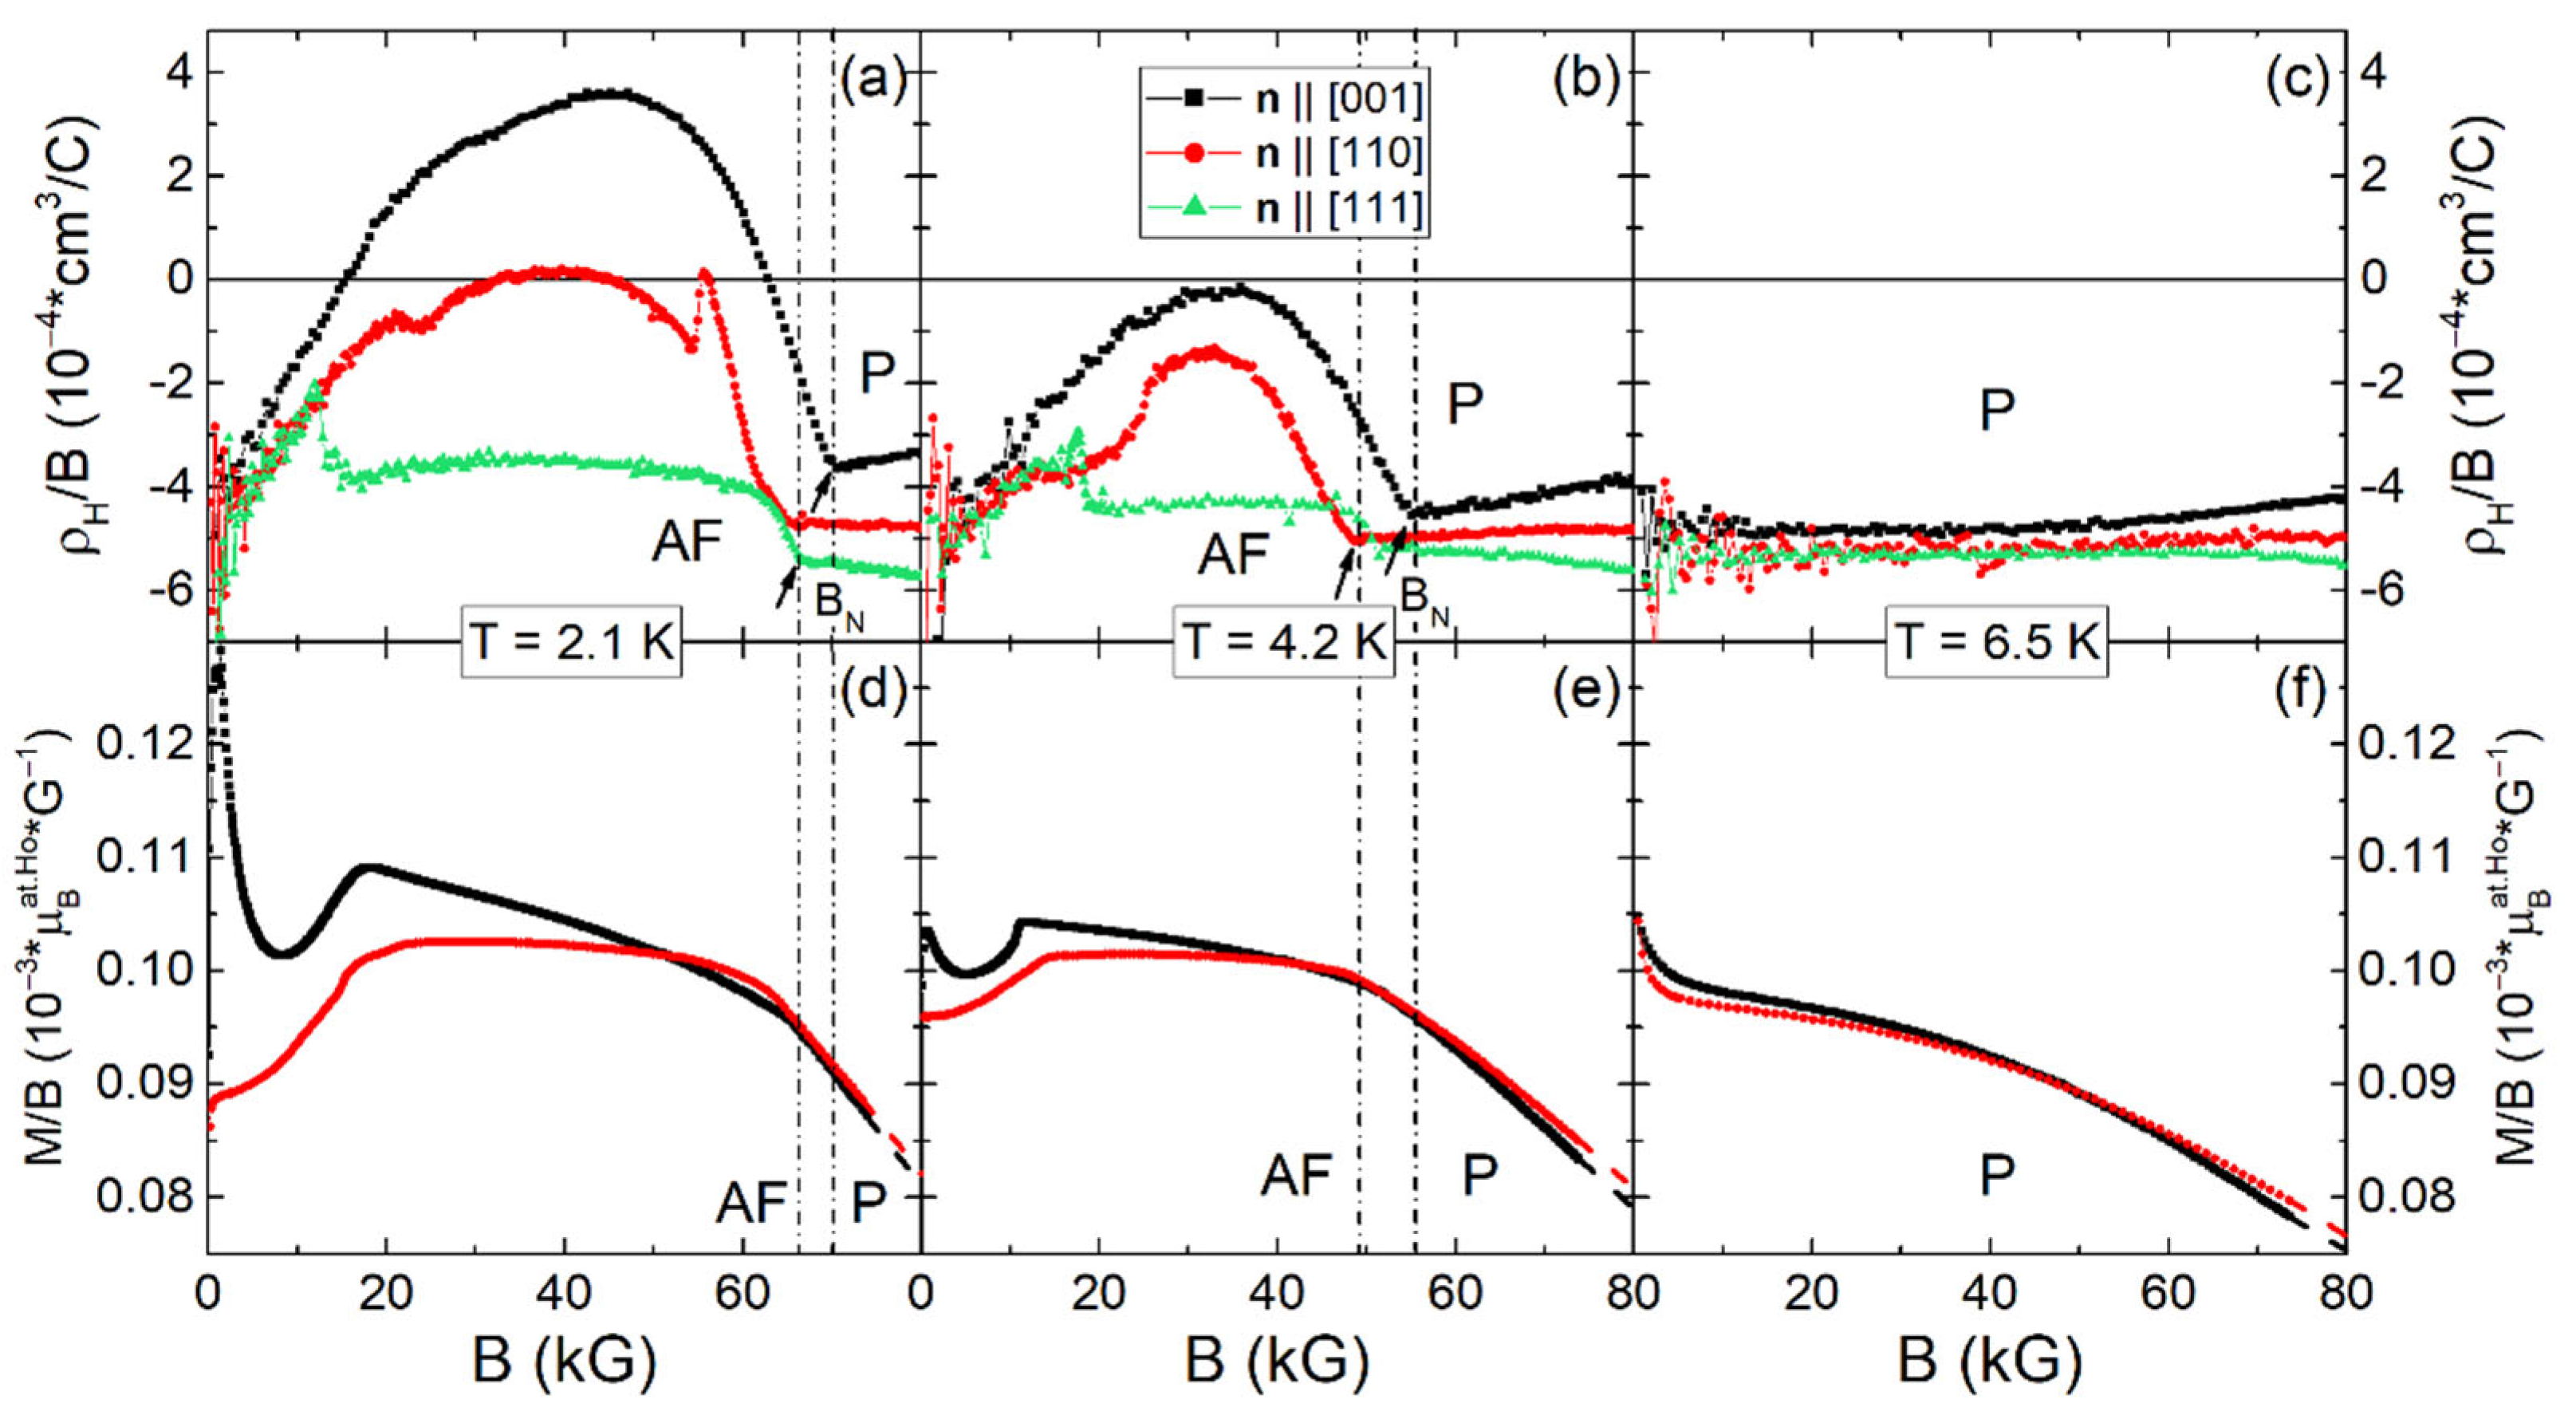
2.2. Field Dependences of Hall Resistivity and Magnetization

Figure 3a–c show the reduced Hall resistivity ρH/B(B) vs magnetic induction B at temperatures of 2.1, 4.2, and 6.5 K measured in the conventional scheme on three different samples with magnetic field H applied along their normal vectors- n||[001], n||[110], and n||[111], correspondingly. The related magnetic susceptibility M/B(B) is shown in Figure 3d–f and Figure 4 shows the temperature dependence of magnetic susceptibility M/B(T) ≡ χ(T) measured in magnetic field H = 100 Oe. The data were corrected by demagnetizing fields. It is seen from Figure 3d–f, that M/B(B) decreases with increasing both field and temperature in the paramagnetic phase, indicating a trend towards saturation of magnetization in strong magnetic fields. It can be discerned from Figure 3e,f that in the paramagnetic state, these M/B(B) curves are very similar, and the magnetic anisotropy at H~70 kOe does not exceed 1.4% even at lowest available temperature 2.1 K. Therefore, below we analyze the Hall effect using the same dependence M/B(n||[001]) for all three orientations of applied magnetic field.
The AF-P phase transition at TN = 5.75 K can be clearly recognized on the temperature dependence of magnetic susceptibility measured at H = 100 Oe (see Figure 4). Above TN, the low field magnetic susceptibility χ(T) may be described approximately by a Curie–Weiss type dependence
χ = M / H = N Ho   μ eff 2 / ( 3 k B   ( T θ p ) ) + χ 0
where NHo = 0.95·x(Ho)·1022 cm−3, and μeff~10 µB are the concentration and the effective magnetic moment of Ho-ions, correspondingly (µB and kB denote Bohr magneton and Boltzmann constant), θp ≈ −14 K is the paramagnetic Curie temperature corresponding to AF exchange between magnetic dipoles. χ0 ≈ −1.78·10−3 µB/mole/Oe is the temperature-independent additive combination of (i) diamagnetic susceptibility of the boron cage and (ii) Pauli paramagnetism and Landau diamagnetism of conduction electrons.
Fitting of χ(T) by Equation (1) with temperature-dependent μeff(T) indicates that within experimental accuracy the susceptibility follows the Curie–Weiss dependence with magnetic moment, which is only slightly below the total moment μeff ≈ 10.6 µB of Ho3+ 4f-shell in the range 80–300 K. As the population of excited magnetic states of the Ho3+ 5I8 multiplet (that is split by crystalline electric field (CEF) [52]) declines significantly in the range 8–80 K, μeff decreases moderately (to 9.5 µB; see Figure 4, right scale). Thus, even at TN, the value of μeff noticeably exceeds the magnetic moment of the Γ51 ground state triplet μeff51) ≈ 8 µB (solid line in Figure 4, right scale). The difference (∆μeff~1.5 µB, Figure 4) may be related to ferromagnetic correlations, which develop in this SCES below T*~60 K. Note that below 25 K, various short-range ordering features including ferromagnetic components were previously observed in magnetic RB12 [53,54,55].
As can be seen from Figure 3a–c, the behavior of reduced Hall resistivity ρH/B(B) differs significantly depending on B direction. Indeed, in the paramagnetic region for B||n||[001] the value of ρH/B(B) turns out to decrease, for B||n||[110] the curve is practically field independent, and for B||n||[111], an increase of negative ρH/B(B) values is observed. These trends persist in temperature range 2.1–6.5 K in the paramagnetic phase (above Neel field, B > BN in Figure 3a–c), and the anisotropy of ρH/B(n||[001])/ρH/B(n||[111]) reaches values of ~80% at 2.1 K for B = 80 kG in accordance with the results of Figure 2b. Such strong anisotropy is very unusual for the paramagnetic state of fcc metals (as HoxLu1-xB12) with intense charge carrier scattering in the disordered cage-glass phase.

2.3. Angular Dependences of Hall Resistivity in the Paramagnetic State of Ho0.8Lu0.2B12

To reveal the nature of the strong anisotropy of ρH/H Hall resistivity (Figure 2b and Figure 3a–c) as well as to separate different contributions to Hall effect, it is of interest to study the angular dependencies of Hall resistivity ρH(φ) in Ho0.8Lu0.2B12 for different configurations of magnetic field with respect to principal crystallographic directions. Here we present precision measurements of Hall resistivity ρH(φ,T0,H0,n) angular dependencies performed at 2.1–300 K in magnetic field up to 80 kOe for four crystals of Ho0.8Lu0.2B12 with different orientations of normal vector n to sample surface: n||[001], n||[110], n||[111], and n||[112] (see inset in Figure 2a). In these cases, each sample was rotated around current axis I||[1,2,3,4,5,6,7,8,9,10]. Thus, both fixed vector H and rotating vector n were lying in the same plane (1–10). For clarity, Figure S1 in Supplementary Materials demonstrates a direct correlation between the results of two different measurements of the Hall effect: (i) in the conventional field-sweep scheme with two opposite directions of ±H||n and (ii) in the step-by-step rotation of the sample around I||[1,2,3,4,5,6,7,8,9,10] with a fixed H vector in the plane perpendicular to the rotation axis (see the inset in Figure 2a).
Figure 5 shows the results of angular ρH(φ) measurements at H = 80 kOe for samples with normal directions n||[001] and n||[110] in temperature ranges 40–300 K (Figure 5a,c) and 2.1–25 K (Figure 5b,d). The experimental results were fitted by formula.
ρH(φ) = ρHconst + ρH0·cos(φ + φsh) + ρHan(φ)
where ρHconst is an angle independent component, ρH0 is the amplitude of the isotropic cosine-like contribution to Hall resistivity fcos(φ) = ρH0·cos(φ + φsh), φsh is the phase shift, and ρHan(φ) = ρH0an·g(φ) the anisotropic contribution to Hall resistivity (see Figure 5). The approximation of ρH(φ) within the framework of Equation (2) for two crystals with normal directions n||[001] and n||[110] was carried out in two intervals Δφ = 90 ± 35° and Δφ = 270 ± 35° where the cosine-type behavior is almost perfect. By analogy, ρH(φ) curves for samples with n||[111] and n||[112] were approximated in same intervals Δφ = 90 ± 35° and Δφ = 270 ± 35° (near the zeros of angular dependencies), but without reference to certain crystallographic directions (see Figure S2 in Supplementary Materials). As a result, the ρH0(T, H, n) and φsh(T, H, n) parameters of the isotropic contribution fcos(φ) in (2) were found directly from this approximation. The anisotropic contribution ρHan(T, H, n) at fixed direction H||n was determined as an average of the sum of absolute ρHan(φ) values found for n at φ = 0°, φ = 180°, and φ = 360° in the rotation experiment. As can be seen from the analysis of angular ρHan(φ) dependencies undertaken below, the proposed approach reveals significant limitations and inaccuracies inherent in Hall effect measurements according to the conventional field-sweep scheme. Taking into account that ρHconst and φsh ≈ 3–5° lead only to small corrections in determining the ρH0 = ρH0(T, H, n) and ρHan = ρHan(T, H, n) amplitudes in Equation (2), the experimentally measured Hall resistivity is discussed below as a sum of isotropic and anisotropic contributions ρH(φ) ≈ ρH0·cos(φ) + ρHan cos(φ)·g(φ).
In the range 40–300 K at H = 80 kOe the experimental data for n||[001] and n||[110] samples (Figure 5a,c) are well fitted by a cosine dependence, indicating the absence of anisotropic contribution—ρHan(φ)~0. On the contrary, below 40 K, the ρHan(φ) curves for n||[001] exhibit a broad feature in a wide range of angles around <001> (between nearest <111> axes (see Figure 5b)) with a step-like singularity just at <001>. Several peaks of relatively small amplitude may be identified on ρHan(φ) dependence for the n||[110] sample (Figure 5d). The ρHan(φ) curves for samples with n||[111] and n||[112] in the range 2.1–30 K and at H = 80 kOe are presented in Supplementary Materials (see Figure S2). Note that the ρH(φ) dependences for n||[111] and n||[112] being similar to each other differ from curves recorded for n||[001] and n||[110] samples, and deviate significantly from cosine dependence in a wide range of angles. The anisotropic contribution of ρHan(φ) extracted for n||[111] and n||[112] samples is close to zero near their normal directions n (for more details see Figure S2 in Supplementary Materials).
Figure 6 shows the result of approximation by Equation (2) of the measured Hall resistivity ρH(φ) at T = 6.5 K in fixed fields up to 80 kOe for the studied four crystals. It is seen that the anisotropic contribution ρHan(φ) appears just above 40 kOe having the largest amplitude for sample n||[001], it decreases by a factor of 2 for n||[110] and goes to zero for n||[111] and n||[112] samples (Figure 6). Indeed, below 40 kOe the experimental data (shown by symbols) and the cosine fits (thin solid lines) coincide with a good accuracy indicating the absence of an anisotropic component ρHan(φ) in the low field region (see also Figure S3 in Supplementary Materials for the n||[111] at T = 20 K).
It is worth noting that in the range T > T*~60 K, the temperature dependences of reduced Hall resistivity ρH/H(T) at H = 80 kOe for samples with n||[001], n||[110], and n||[111] coincide within the experimental accuracy (Figure 2b). Angular ρH(φ) curves can be fitted well by cosine (Figure 5a,c), and they are close to each other. Note also that for n||[110] and n||[111] samples, the amplitudes ρH0 of ρH(φ) coincide in an even wider temperature range of 15–60 K (Figure 2b). Below TS~15 K and in the range H > 40 kOe, a significant deviation of the ρH/H(T) curves from cosine-type behavior is observed for crystals with n||[110], n||[111], and n||[112] in intervals Δφ = 90 ± 35° and Δφ = 270 ± 35° (see, e.g., Figure 6). This can lead to large errors in determining the amplitude ρH0 of the main contribution from conventional ±H field-sweep measurements. In our opinion, this finding allows us to explain the different behavior of reduced Hall resistivity ρH(T)/H for various field directions (see Figure 2) and shed light on the shortcoming of conventional ±H field-sweep scheme commonly used for the Hall effect studies. Thus, avoiding incorrect conclusions, at low temperatures and in magnetic fields H > 40 kOe, an isotropic ordinary contribution to the Hall effect is assumed, and one common ρH0 value found from the analysis of Equation (2) for n||[001], which was used for these four studied crystals with different n directions. At the same time, in fields H ≤ 40 kOe at T < TS~15 K, the ρH/H(T) curves in intervals φ = 90 ± 35° and φ = 270 ± 35° differ only slightly from cosine curves (Figure 6); therefore, approximation by Equation (2) was carried out with individual parameters of the harmonic contribution for each of the four samples.

2.4. Analysis of Contributions to Hall Resistivity

Figure 7 shows the fitting parameters obtained from the approximation by Equation (2) (Figure 5 and Figure 6 and Supplementary Materials) of ρH(φ) dependences in the paramagnetic (P) phase of Ho0.8Lu0.2B12. Different symbols correspond to isotropic ρH0/H(T0,H) and anisotropic ρHan/H(T0,H) components estimated at T0 = 2.1, 4.2, and 6.5 K (vertical dashed lines in Figure 2 denote the T0 values). The data for different samples with n||[001], n||[110], n||[111], and n||[112] in Figure 7 are indicated by different colors. It is seen in Figure 7a that at T0 = 6.5 K for the sample with n||[001], the value of ρH0/H is about field independent below 40 kOe, while in the range H > 40 kOe, the negative values of ρH0/H(T0,H) increase linearly. For n||[110], n||[111], and n||[112] samples, the negative values of ρH0/H(T0,H) decrease moderately with increasing magnetic field below 40 kOe. Note that in P-phase, the variation of the isotropic ρH0/H(T0,H) component may be attributed to significant (~14%) and non-monotonous change of the concentration of conduction electrons if we assume one type of charge carrier with relation ρH0/H = RH(T)~1/nee (e is the electron charge, and ne the concentration of charge carriers). For convenience, the reduced Hall concentration ne/nR = (H/ρH0)/enR is shown on right axis of Figure 7a, where nR = 0.95*1022 cm−3 is the concentration of Ho and Lu atoms. Note also that the amplitude of anisotropic contribution ρHan/H(T0,H) turns out to be almost zero below 40 kOe. In a stronger magnetic field H > 40 kOe, the anisotropic component increases for samples with n||[001] and n||[110] (Figure 7b), with the amplitude ρHan/H(H) for n||[001] being more than two times higher than the corresponding values for n||[110]. For n||[111] and n||[112] directions, the small negative values turn out to be close to zero (see also Figures S2 and S5 in Supplementary Materials).
The experimental temperature dependences ρH/H(T,H0 = 80 kOe) obtained in the conventional, commonly used the field-sweep technique with two opposite orientations of applied magnetic field ±H||n from one side, and the isotropic component deduced from the angular dependences of Hall resistivity ρH0/H(T,H0) from the other, are compared in Figure 2b. It can be seen that for the sample with n||[111], the ρH0/H(T,H0) data coincide with good accuracy with the ρH/H values detected by conventional field-sweep measurements in a wide range of temperatures 1.9–300 K. For the sample with n||[110], ρH0/H starts to deviate from ρH/H(T,H0) at T < TS~15 K, and for n||[001], noticeable differences arise already upon the transition to the cage-glass state at T*~60 K (Figure 2b). This observation allows to attribute the appearance below T* of the strong anisotropy of the Hall effect in Ho0.8Lu0.2B12 to the contribution ρHan/H, which increases additionally below TS. Figure 2b shows a comparison of the parameter sum = ρH0/H + ρHan/H, which corresponds to Hall effect amplitude detected from ρH/H angular dependences from one side, and the reduced Hall resistivity measured in the conventional ±H||n field-sweep experiment from the other. It can be seen that the temperature behavior of the sum detected by angular measurements is in good agreement with the results of conventional ±H||n field-sweep dependences of ρH/H(H) for all crystals under investigation (Figure 2b, H||n||[001], H||n||[110], and H||n||[111]) approving the validity of the proposed Hall effect separation. Then, using the simple relation ρH0/H(T) = RH(T)~1/nee, we roughly estimate from the temperature dependences presented in Figure 2b and the charge carrier concentration ne in the conduction band. Figure 8a shows the strong field (H = 80 kOe) Arrhenius plot lg(ne/nR)~1/T for H||n||[001] and H||n||[110] directions, similar to Figure 7a (right axis), demonstrating the field dependence of the ratio ne/nR.
It can be seen in Figure 8a that the Arrhenius-type dependence 1/RH(T)~e·n0·exp(−Ta/T) is valid above the cage-glass transition at T*~60 K, and that the estimated activation temperatures Ta = 14.4 ± 0.6 K and Ta = 16.7 ± 0.3 K detected for H||n||[001] and H||n||[110], correspondingly, are close to TS~15 K. As the detected initial concentration n0 = (1.61–1.64)·1022 cm−3 coincides within experimental accuracy for these two field directions, the reduced Hall concentration changes in the range ne/nR = 1.2–1.6 (Figure 8a) in accordance with the results of previous Hall effect measurements in RB12 (R = Lu, Tm, Ho, Er) [56].
Figure 8b shows the temperature dependences of Hall mobility µH(T) ≈ ρH0(T)/[H·ρ(T)] (left scale) and the related parameter ωcτµH·H (right scale, where ωc is the cyclotron frequency and τ the carrier relaxation time) in magnetic field H = 80 kOe for samples with n||[001], n||[110], and n||[111]. At low temperatures T < TS~15 K the obtained µH(T) data tend to constant values µH~600–700 cm2/(V·s) (Figure 8b), and in the range T > T*~60 K Hall mobility follows the power law µH~Tα with a single exponent being estimated as α ≈ 5/4 both for H||n||[001] and H||n||[110].
Similar behavior of Hall mobility was observed in the range 80–300 K previously for various LuB12 crystals; an α ≈ 7/4 exponent was detected for crystals with large values of RRR ≡ ρ(300 K)/ρ(6 K) = 40–70 and α ≈ 3/2 was estimated for LuB12 with a small RRR~12 [49]. The α = 3/2 exponent is typical for scattering of conduction electrons by acoustic phonons (deformation potential). The increase of α values up to 7/4 in best LuB12 crystals was interpreted [49] in terms of charge carriers scattering both by quasi-local vibrations of RE ions and by boron optical phonons [57] in the presence of JT distortions and rattling modes of RE ions [58,59,60]. In the case of Ho0.8Lu0.2B12 crystals with RRR~10 the further decrease of α value from 3/2 to 5/4 could be attributed to the emergence of strong magnetic scattering in dodecaboride with Ho3+ magnetic ions. Note that the inequality ωcτ < 1 (see Figure 8b), which is fulfilled in the entire temperature range 1.9–300 K in fields up to 80 kOe, corresponds to the low field regime of charge carriers in Ho0.8Lu0.2B12. This indicates that the results of Hall effect measurements should be insensitive to the topology of the Fermi surface and depending mainly on the features of disorder and inhomogeneity of the crystals studied.
Obviously, the Hall effect in Ho0.8Lu0.2B12 is strongly modified by the positive anisotropic contribution ρHan/H. Figure 9a,b show the angular dependencies of ρHan(φ)/H at H = 80 kOe for samples with n||[001] and n||[110]. The same contributions for n||[111] and n||[112] are shown in Figure 10. As can be seen from Figure 9 and Figure 10, the ρHan(φ)/H curves differ in both the amplitude and shape of angular dependence. Since very small changes of ρHan(φ)/H with temperature are detected for samples with H||n||[111] and H||n||[112] in the field along normal directions (φ = 180° in Figure 10), the temperature dependences of the anomalous component below are analyzed only for n||[001] and n||[110].
The amplitude ρHan/H variation with temperature is shown in Figure 9c,d in the logarithmic plot. It is worth noting that two phenomenological relations
ρHan/H ≈ C*·(1/T − 1/TE)
ρHan/H ≈ (ρHan/H)0 −AH·T−1·exp(−TaH/T)
were used in [49,55,61] for the Hall effect analysis in strongly correlated electron systems with a filamentary structure of conducting channels. Among these, a hyperbolic dependence (3) of Hall resistivity was observed previously in SCES CeCu6-xAux [55] and Tm1-xYbxB12 [61]. The authors of [55,61] argued in favor of a transverse even component of the Hall signal associated with the formation of stripes (see also [38]) on the surface and in the bulk of the crystal, similar to the chains of nanoscale stripes detected in the normal phase of HTSC [62]. Equation (4a) was applied to discuss the temperature induced destruction of the coherent state of stripes in LuB12 [49]. Below, we use the analysis based on Equations (3) and (4a) to highlight quantitatively the changes caused by various orientations of the external magnetic field.
Indeed, the approximation by Equation (3) in the range 5–40 K results in values TE ≈ 132 K and C* ≈ 8.9·10−4 cm3/C for the sample with n||[001], while for n||[110], the parameter TE ≈ 135 K is almost the same and C* ≈ 4.3·10−4 cm3/C turns out to be about half the size (see green curves in Figure 9c,d). Then, the analysis based on Equation (4a) provides very similar values TaH ≈ 13.7–13.8 K for these two field directions (see Figure 9c,d, red curves). Note that the estimation of TaH agrees both with the characteristic temperature of stripe chains formation TS~15 K [48] from one side, and with the activation energy Ea/kB =Ta~14–16 K detected above in the Arrhenius type approximation of the main contribution to the Hall effect (see Figure 8a) from the other. It can be seen from Figure 9c,d that for the case n||[001] and n||[110], Equation (4a) provides a good description of the experimental ρHan/H(T) curves at temperatures up to 10 K. Above 10 K, these fits (see red curves in Figure 9c,d) differ sharply from experiment, indicating the restriction of the phenomenological approach applied. The AH coefficients in Equation (4a) differ for these two field directions by more than two times (AH = 73.8·10−4 cm3/C for n||[001] and AH = 32.3·10−4 cm3/C for n||[110]), being in good agreement with the amplitude ratio for ρHan/H (Figure 9c,d). Furthermore, similar to the approach developed in [43] for LuB12, an analysis of the anisotropic positive contribution to magnetoresistance in Figure 9e,f for Ho0.8Lu0.2B12 is carried out within the relation
ρxxan(n,T0,H = 80 kOe) ≈ (ρxxan)0 − Axx·T−1·exp(−Taρ/T)
For each of the samples with H||n||[001] and H||n||[110], the anisotropic component ρxxan(n,T0,H = 80 kOe) was determined by subtracting from the experimental resistivity data (e.g, ρ(n||[001],T0,H = 80 kOe) for H||n||[001]) and the dependence ρ(n||[111],T0,H = 80 kOe) for H||n||[111], where the magnetoresistance is minimal. Parameters Taρ = 13.3–14.8 K found from this approximation in the same range T ≤ 10 K turn out to be close to TaH ≈ 13.3–13.8 K values and also to TS~15 K [48], as well as to the activation temperature Ta~14–16 K (see Figure 8a).

3. Discussion

3.1. Multicomponent Analysis of the Contributions to Anomalous Hal Effect (AHE) in the Regime of Ferromagnetic Fluctuations

Previous measurements of the Hall effect in Ho0.5Lu0.5B12 in P-phase (T > TN ≈ 3.5 K) were carried out in the conventional field-sweep scheme with two opposite field directions ±H||n [63]. Ordinary and anomalous components of the Hall effect observed in [63] were described by the general relation
ρH/B = RH0 + RS·4πM/B,
which is usually applied to AHE in ferromagnetic metals [51,64], where RH0 and RS = const(T) are the ordinary and anomalous Hall coefficients, respectively. According to [51], the ferromagnetic AHE regime represented by Equation (5) corresponds to the intrinsic scattering mechanism. Since short-range order effects are observed in the paramagnetic phase of magnetic RB12 in the temperature range at least up to 3TN [53,60,65] (see also Figure 4), and that a ferromagnetic component was detected in the magnetically ordered state of HoB12 in magnetic fields above 20 kOe, it is of interest to perform the analysis within the framework of Equation (5) of the ordinary and AHE components in the vicinity of TN. In this case, relying on the above results of angular measurements of Ho0.8Lu0.2B12 (Figure 5, Figure 6, Figure 7, Figure 9 and Figure 10), one should use isotropic ρH0(T, H, n) and anisotropic ρHan(φ, T, H, n) components of the Hall signal separated within the framework of Equation (2) (see Figure 2, Figure 3, Figure 4, Figure 5, Figure 6, Figure 7, Figure 8, Figure 9 and Figure 10). It is worth noting that the analysis performed in [43] within the framework of Equation (5) is applied to the field dependences of Hall resistivity ρH(H) obtained in the conventional field-sweep ±H || n scheme, leading obviously to mixing of contributions ρH0(H) and ρHan(H). As a result, the coefficients RH0 and RS were determined in [43] for the total averaged Hall resistivity, which contains both the isotropic ρH0(T, H, n) and anisotropic ρHan(φ, T, H, n) components. Actually, each of the angular contributions ρH0 and ρHan(φ) is characterized by two independent coefficients R0 and RS, which generally differ in sign. Below, we develop the analysis, considering two ferromagnetic components included in the AHE. To keep generality, we analyze our Hall effect data for all three principal directions of external magnetic field (H||[001], H||[110], and H||[111]), despite the fact that for H||[111], the intrinsic AHE is found to be practically negligible (see Figure 7 and Figure 10).
Thus, for a full description of the Hall effect in Ho0.8Lu0.2B12, we used the following relations:
ρ H 0 / B = R H 0 + R M 0 4 π M / B ρ H an / B = R H an + R M an 4 π M / B
where ρH0/B = ρH0/B(H, T0, n) and ρHan/B = ρHan/B(H, T0, n) are the reduced amplitudes of contributions ρH0 and ρHan(φ) (see Figure 7), which depend on temperature and direction of the normal vector n to the sample surface; RH0 and RHan are components of the ordinary Hall effect, connected with magnetic induction B, and RM0, RMan are the coefficients of anomalous Hall effect determined by magnetization M and related to the ferromagnetic component (see Figure 3d–f). Obviously, there are two independent ordinary contributions to Hall resistivity RH0·B and RHan·B, as well as two independent anomalous (ferromagnetic) components RM0·4πM and RMan·4πM, which differ for various H directions. Note that the last two components RHan·B and RMan·4πM are responsible for the observed Hall effect anisotropy.
Figure 11 shows the linear approximation within the framework of Equation (6) of the reduced amplitudes ρH0/B and ρHan/B vs 4πM/B in the range T0 = 2.1–6.5 K for Ho0.8Lu0.2B12 crystals with n||[001], n||[110], and n||[111]. Linear fits are acceptable for directions n||[001] and n||[110] at temperatures of 2.1 K and 4.2 K for both the isotropic ρH0/B and anisotropic ρHan/B contributions. This approximation was found to be valid at T = 6.5 K in the interval of small 4πM/B values (i.e., in high magnetic fields, in more detail see Figure S4 in Supplementary Materials), where the estimated parameters RH0 and RHan are extracted as cutoffs, and RM0 and RMan are the slopes of corresponding straight lines in Figure 11. Since the parameters RH0, RHan, RM0, RMan depend weakly on temperature (see Figure S4 in Supplementary Materials), the temperature-averaged values of these coefficients are summarized in Table 1.
The analysis based on Equation (6) allows us to conclude that the values of coefficients RHan and RMan, which are characteristics of the anisotropic component, turn out to be practically equal to zero for H||[111] (Figure 11f). It can be seen that the Hall coefficient RH0~−7.5·10−4 cm3/C remains practically invariant for any H direction (see Table 1 and Figure S4 in Supplementary Materials), confirming that this ordinary negative component of Hall signal is isotropic. On the contrary, the value of anisotropic positive contribution RHan changes significantly from ~6.8·10−4 cm3/C for H||[001] to 2.3·10−4 cm3/C in H||[110] passing through zero for H||[111] (Table 1). As a result, in Ho0.8Lu0.2B12 for strong field H||[001], the anisotropic positive component RHan B·g(φ,n), which is proportional to magnetic induction, turns out to be comparable in absolute value with the negative isotropic component RH0 B of the ordinary Hall effect. Note that the values of coefficients RM0, RMan of the anomalous (ferromagnetic) contributions, which are proportional to magnetization, dramatically exceed the ordinary parameters RH0, RHan that agrees with the result [63] for Ho0.5Lu0.5B12.
It is very unusual that a significant isotropic anomalous positive contribution RM0 ~25:27·10−4 cm3/C appears in the paramagnetic phase of Ho0.8Lu0.2B12, and it may be attributed to the isotropic ferromagnetic component in the Hall signal. We propose that the RM0 term depends on the regime of ferromagnetic fluctuations detected in low field magnetic susceptibility above TN (Figure 4). On the contrary, the anomalous negative contribution RMan varies strongly in the range (−)(21:65)·10−4 cm3/C depending on M direction (see Table 1), and this component appears in strong magnetic field and at low temperatures (Figure 11). To summarize, AHE in the paramagnetic state of Ho0.8Lu0.2B12 is proportional to magnetization and is determined both by the positive contribution RM0 ·4πM·cos(φ) and by the strongly anisotropic negative component RMan·4πM·g(φ). These two contributions compensate each other in the vicinity of n||[110] (dynamic charge stripe direction [35,48]).
When discussing the nature of multicomponent Hall effect in Ho0.8Lu0.2B12, it is worth noting the complicated multi-q incommensurate magnetic structure in the Neel state. Magnetic ordering is characterized by propagation vector q = (1/2±δ, 1/2±δ, 1/2±δ) with δ = 0.035 and detected in [53,66,67] for Ho11B12 in the neutron diffraction experiments at low temperatures in low (H < 20 kOe) magnetic field. It was also found for HoB12 [53,66,67] that as the strength of external magnetic field increases above 20 kOe, the 4q-magnetic structure transforms into a more complex one, in which, apart from the coexistence of two AF 4q and 2q components, there additionally arises some ferromagnetic order parameter. Then, a strong modulation of the diffuse neutron-scattering patterns was observed in HoB12 well above TN [53,67] with broad peaks at positions of former magnetic reflections, e.g., at (3/2, 3/2, 3/2), pointing to strong correlations between the magnetic moments of Ho3+ ions. These diffuse scattering patterns in the paramagnetic state were explained in [53,67] by the appearance of correlated 1D spin chains (short chains of Ho3 + -ion moments placed on space diagonals <111> of the elementary unit), similar to those detected in low dimensional magnets [68]. It was found that these patterns can be resolved both well above (up to 70 K) and below TN, where the 1D chains seem to condense into an ordered antiferromagnetic modulated (AFM) structure [53,67,69]. The authors [53] discussed the following scenario for the occurrence of long-range order in HoB12: Far above TN, strong interactions lead to correlations along [111], they are essentially one-dimensional and would not lead to long-range order at finite temperature. As TN is approached, the 1D-correlated regions grow in the perpendicular directions, possibly due to other interactions. Cigar-shaped AFM-correlated regions were proposed in [53] that become more spherical when TN is approached. Within this picture, the ordering temperature is located in the point where spherical symmetry is reached. Only then 3D behavior sets in, and HoB12 exhibits long-range AFM order [53]. The refinement of Ho11B12 crystal structure was done with high accuracy in the space group F m 3 ¯ m , but also small static Jahn–Teller distortions were found in RB12 compounds [36,41]. However, the most important factor of symmetry breaking is the dynamic one [36,41], which includes the formation both of vibrationally coupled Ho–Ho dimers and dynamic charge stripes (see [36,48,52] for more details). As a result, twofold symmetry in the (110) plane is conserved as expected for cubic crystal, but the charge stripes and Ho–Ho-coupled vibrations suppress the exchange between nearest neighbored Ho-ions. This result in the emergence of complicated phase diagrams in the AF state with a number of different magnetic phases separated by radial and circular boundaries (Maltese Cross type of angular diagrams in RB12 [35,42,44,46]). In this scenario AF magnetic fluctuations develop well above TN in HoB12 along trigonal axis [111], and dynamic charge stripes along <110> suppress dramatically the RKKY indirect exchange between Ho magnetic moments [44] provoking the formation of cigar-shaped AFM-correlated regions proposed in [53]. In our opinion, these effects are responsible both for the emergence of filamentary structures of fluctuating charges in these nonequilibrium metals and for the formation of spin polarization in the conduction band. This also results in the appearance of a complicated multicomponent Hall effect including two (isotropic and anisotropic) anomalous contributions.

3.2. Mechanisms of AHE in Ho0.8Lu0.2B12

Returning to commonly used classification [51,70], it is necessary to distinguish between the intrinsic and extrinsic AHE. Intrinsic AHE is related to the transverse velocity addition due to Berry phase contribution in systems with strong spin–orbit interaction (SOI), while the extrinsic AHE associated with scattering of charge carriers by impurity centers. However, AHE also arises in noncollinear ferromagnets, in which a nonzero scalar chirality Si(Sj × Sk) ≠ 0 leads to the appearance of an effective magnetic field even in the absence of SOI [71], and in magnetic metals with a nontrivial topology of spin structures in real space [72,73,74,75,76]. When interpreting experimental data, a problem of identifying the actual mechanisms of AHE arises [51]. Among the extrinsic AHE, skew scattering, for which the scattering angularly depends on the mutual orientation of the charge carrier spin and the magnetic moment of the impurity, predicts a linear relationship between the anomalous component of the resistivity tensor ρanHxx and usually corresponds to the case of pure metals (ρxx < 1 µOhm·cm) [77]. In the range of resistances ρxx = 1–100 µOhm·cm the intrinsic AHE dominates, which is due to the effect of the Berry phase (ρanHxx2) [78]. The contribution to scattering due to another extrinsic AHE, side jumping [79] with a similar scaling (ρanH2xx0, where ρxx0 is the residual resistivity of the metal) is usually neglected [51]. In the “dirty limit” (ρxx > 100 µOhm*cm), an intermediate behavior is observed with a dependence of the form ρanHxxβ and with an exponent β = 1.6–1.8, which is associated usually with the transition to hopping conductivity [51].
When identifying the AHE mechanism in Ho0.8Lu0.2B12 with a small residual resistivity (ρxx0~1 μOhm·cm, Figure 2a), it is not possible to follow the traditional classification as no presence of the itinerant AHE with an asymptotic ρanxyxx2, or a skew scattering regime (ρanHxx) was found here. However, in order to correctly compare these diagonal and off-diagonal components of the resistivity tensor, it is possible to extract the corresponding anomalous contributions. As can be seen from Figure 2, for H||n||[111], the anisotropic anomalous component of Hall signal is negligible and, as a result, the reduced Hall resistivity measured in angular experiments in direction H||n consists of the isotropic contribution only. In addition, according to conclusions made in [43,47], at low temperatures in paramagnetic state the magnetoresistance of Ho0.8Lu0.2B12 consists of isotropic negative and anisotropic positive contributions, the latter being close to zero in the direction H||n||[111].
In this situation, for estimating the anisotropic components ρanH and ρanxx, e.g., for the n||[001] sample, it suffices to find the difference ρanH(n||[001]) = ρH(n||[001])-ρH(n||[111]) (see Figure 2b) and ρanxx(n||[001]) = ρ(n||[001])-ρ(n||[111]) (see Figure 2a). Figure 12 demonstrates the scaling relation between these anisotropic components of ρanH and ρanxx for H||[001] and H||[110] directions, which leads to the following conclusions: (i) For H||[001] a ρanHanxx1.7 dependence is observed over the entire temperature range T ≤ T*~60 K. This regime does not correspond to intrinsic AHE (β < 2), while an onset of hopping conductivity (β = 1.6–1.8) [51] seems to be an unreal scenario in this good metal (ρxx~1 μOhm·cm, Figure 2a). (ii) On the contrary, for H||[110], two anisotropic components of the resistivity tensor appear in the interval T < TS~15 K and turn out to be related to each other as ρanHanxx0.83 (Figure 12), which does not favor skew scattering (β~1) [77]. Note that the exponent β for H||[110] is twice as small as that for H||[100] in Ho0.8Lu0.2B12, and these regimes are observed in adjacent ρanxx intervals changing one to another at ρanxx~0.1 µOhm·cm (Figure 12). Such a different behavior in charge transport parameters for two different magnetic field directions suggests that the AHE is caused by another scattering mechanism, which, in particular, may result from the influence of external magnetic field on dynamic charge stripes directed along <110> (see Figure 1a).
In this scenario the appearance of two types of AHE in Ho0.8Lu0.2B12 may be interpreted as follows. The first mode of AHE associated with charge scattering in the interval T < TS~15 K is detected when magnetic field is applied along charge stripes (H||[110]), and the regime appears due to the formation of a large size cluster (long chains) in the filamentary structure of fluctuating charges. The second mode of AHE is induced by the order–disorder transition at T*~60 K and corresponds to the magnetic field applied transverse to vibrationally coupled dimers of rare-earth ions (H||[001] ⊥ <110>). In the latter case, when the carrier moves in transverse magnetic field along a complex path, the intrinsic AHE is expected to be influenced by the Berry phase in real space [51,78], but instead, the ρanHanxx1.7 scaling is observed. This unusual behavior seems to be a challenge to the contemporary AHE theory and has to be clarified in future studies.

3.3. AHE Anisotropy and Dynamic Charge Stripes

The above analysis of Hall effect contributions in Ho0.8Lu0.2B12, based (i) on measurements in the conventional field-sweep ±H||n scheme (Figure 2, Figure 3a–c and Figure S1a in Supplementary Materials), and (ii) on studies of angular dependences with vector H rotating in the (110) plane (Figure 5, Figure 6, Figures S1b, S2 and S3 in Supplementary Materials), allows to obtain a set of AHE coefficients, which characterize the ordinary and anomalous contributions along three principal directions of the magnetic field (H||n||[001], H||n||[110], and H||n||[111]).
In this case, the methodological feature of the performed angular measurements of Hall resistivity shows a cosine modulation of the projection of transverse Hall electric field on the direction that connects two Hall probes and is perpendicular to any of the specific normal vectors: n||[001], n||[110] n||[111], or n||[211]. In this situation, it is more convenient to control the projection of the external field H onto the normal vector Hn = (H·n) = H0·cosφ, which is used to determine the amplitude of contributions in the corresponding n direction (see inset in Figure 2a). As can be seen from Figure 10, vanishing of the AHE for H directed precisely along n||[111] and n||[112] does not mean zero values of ρHan(φ)/H for these crystals in the entire range of angles. In this case, it is obvious that for H in the plane of the sample, near-zero values of Hn = H0·cos occur.
For φ = 0, one should also expect zero values of anomalous contributions to the Hall signal.
In [44,47,48,49,58], it was found that the angular dependence of magnetoresistance (MR) in RB12 is determined by scattering of carriers on dynamic charge stripes. As a result, the maximum positive values of MR are observed for H||[001] perpendicular to the direction of these electron density fluctuations, while the minimum MR is observed for H||[111] (see Figure 13b). To clarify the nature of these anomalies in angular AHE curves, one can restore the angular dependence of the AHE in the entire range of 0–360º and compare the obtained curve with the related MR data. This analysis can be performed by relying on experimental ρH/B(φ) curves measured at T = 2.1 K in magnetic field H = 80 kOe for four different crystals when H is rotated in the same plane (110). Since both the ordinary and anomalous components of Hall signal can be described by cosine dependence ρH(φ) = ρH0·cos(φ − φ1) + ρHan·g(φ), the representation of experimental data shown in Figure 13a in the form of ρH(φ)/(H·cos(φ − φ1)) allows us to separate the isotropic and anisotropic contributions from Hall experiments.
The averaged envelope (indicated by yellow shading in Figure 13a) was obtained after removing the particular portions of the related angular dependences with singularities associated with division by small values (zeros of cosine), and then averaging the data of these four angular Hall signal dependences. In this case, in accordance with the data in Figure 2b, in H||<111> directions on the resulting envelope curve ρH(φ)/(H·cos(φ − φ1)), the maximum negative values of about −6 × 10⁻⁴ cm3/C correspond to isotropic ordinary component ρH0/H of Hall effect, which is independent on magnetic field direction. The positive anisotropic component reconstructed from the data of four measurements (the yellow shading in Figure 13a) provide changes of the ρH(φ)/(H·cos(φ − φ1)) in the range (3.2:6)·10−4 cm3/C. Despite the fact that the initial ρHan(φ) dependence is an odd function (see Figure 5, Figure 6, Figure 9 and Figure 10), the result of its division by the odd cos(φ − φ1) allows one to obtain the real anisotropic even amplitude of Hall effect and compare it with MR. The location of its extrema coincides with the positions of anomalies on the MR curve (Figure 13b). Indeed, the maximum positive contribution to AHE appears synchronously with the MR peak along <001>, while for <110>, a small (if compared with the anomaly along <001>) positive AHE component is recorded (Figure 13b) simultaneously with a small amplitude singularity of MR. We also note that two spatial diagonals <111> on the anisotropic contribution ρHang(φ)/(H·cos(φ − φ1)) seem to be equivalent and show no hysteretic features. The observed behavior of the Hall effect in Ho0.8Lu0.2B12 agrees very well with symmetry lowering of the fcc structure of Ho0.8Lu0.2B12 due to static and dynamic Jahn–Teller distortions [36].
Finally, the comparison of the angular dependences of MR and Hall effect in Ho0.8Lu0.2B12 (Figure 13) shows that, along with the normal isotropic contributions to the diagonal (negative MR) and off-diagonal (the ordinary Hall coefficient of negative sign) components of the resistivity tensor, anomalous anisotropic positive components appear both in the MR and in Hall effect at low temperatures. These components reach (i) maximal values in the direction of magnetic field transverse to dynamic charge stripes (H||[001]) and (ii) zero values for H||[111]. This anisotropy arises simultaneously with the transition to the cage glass state at T*~60 K and seems to be related to the formation of vibrationally coupled pairs of rare-earth ions displaced from their centrosymmetric positions in B24 cavities of the boron sublattice [48]. A significant increase of this anisotropy is detected at temperatures T < TS~15 K upon the formation of large size clusters (long chains) in the filamentary structure of fluctuating electron density (stripes). Taking into account that, according to the results of room temperature measurements of the dynamic conductivity of LuB12, about 70% of charge carriers participate in the formation of the collective mode (hot electrons) [80], a redistribution of carriers between the nonequilibrium and Drude components should be expected with decreasing temperature.
Apparently, the activation behavior of the Hall concentration of charge carriers observed in the range 60–300 K (Ta~14–17 K, Figure 8a) may be attributed to the involvement of additional conduction electrons in the collective mode. When vibrationally coupled dimers of rare-earth ions are formed below T*~60 K, short and disordered chains of stripes oriented along <110> appear in magnetic field, initiating the emergence of intrinsic AHE (Figure 12). We propose that the AHE in Ho0.8Lu0.2B12 is caused by a transverse addition to velocity due to the Berry phase contribution [51], which arises for carriers moving in a complex filamentary structure of the electron density in magnetic field applied transverse to dynamic stripes. During the formation of large size clusters in the structure of stripes (interval T < TS~15 K) in field orientation along the stripes H||[110], no intrinsic AHE is expected. A skew scattering contribution, for which the scattering angle depends on the mutual orientation of the charge carriers spin and the magnetic moment of the impurity, may become noticeable with a linear relationship ρanHanxx between these components of the resistivity tensor (Figure 12). We propose that some geometric factors are responsible for the reduction of β exponent in these two AHE regimes. Approaching the AF transition above TN, on-site 4f-5d spin fluctuations in the vicinity of Ho3+ ions lead to magnetic polarization of the 5d states of the conduction band, which gives rise to ferromagnetic fluctuations in Ho0.8Lu0.2B12 (Figure 4). These produce ferromagnetic nanoscale domains (ferrons), and, as a result, initiate the appearance of the ferromagnetic contribution to AHE (Figure 11 and Table 1). We emphasize that such a complex multicomponent AHE in model Ho0.8Lu0.2B12 metal with a simple fcc lattice turns out to be due to the inhomogeneity and complex filamentary structures of the electron density in the matrix of this SCES with dynamic Jahn–Teller lattice instability and electron phase separation.

4. Experimental Details

Ho0.8Lu0.2B12 single-domain crystals were grown by crucible-free induction zone melting in an inert argon gas atmosphere (see, e.g., [34]). Magnetization was measured with the help of a SQUID magnetometer MPMS Quantum Design in fields up to 70 kOe in the temperature range 1.9–10 K. The external magnetic field was applied along the principal crystallographic axes- H||[001], H||[110], and H||[111]. Resistivity, magnetoresistance, and Hall effect were studied on an original setup using the standard DC five-probe technique with excitation current commutation. The angular dependences of transverse magnetoresistance and Hall resistivity were obtained using a sample holder of original design, which enables the rotation of the vector H located in the plane perpendicular to fixed current direction I||[ 1 1 ¯ 0 ] H with a minimum step φstep = 0.4° (see the schematic view on the inset of Figure 2a). Measurements were carried out in a wide temperature range 1.9–300 K in magnetic fields up to 80 kOe, the angle φ = n^H (n-normal vector to the lateral sample surface) varied in the range φ = 0–360°. The measuring setup was equipped with a stepper motor, which enabled an automatic control of sample rotation, similar to that one used in [35]. High accuracy of temperature control (ΔT ≈ 0.002 K in the range 1.9–7 K) and magnetic field stabilization (ΔH ≈ 2 Oe) was ensured, respectively, by LLC Cryotel, (Moscow, Russia) TC 1.5/300 temperature controller and Cryotel SMPS 100 superconducting magnet power supply in combination with a CERNOX 1050 thermometer and n-InSb Hall sensors.

5. Conclusions

In the paramagnetic phase of the cage-cluster high-boron boride Ho0.8Lu0.2B12 with a cage-glass state below T*~60 K and electronic phase separation (dynamic charge stripes), magnetotransport was studied at temperatures 1.9–300 K in magnetic fields up to 80 kOe. Field and angular measurements of resistivity and Hall resistivity were performed on single-domain crystals of the Ho0.8Lu0.2B12 model metal allowed to separate and analyze several different contributions to the Hall effect. It was shown that, along with the negative ordinary isotropic component of Hall resistivity, an intrinsic AHE of a positive sign arises in the cage-glass state in field direction H||[001], which is perpendicular to the charge stripe chains. This AHE corresponds through the relation ρanHanxx1.7 to the anomalous components of the resistivity tensor. It was also found that at temperatures T < TS~15 K, where long chains prevail in the filamentary structure of fluctuating charges (stripes), a contribution to AHE of the form ρanHanxx0.83 becomes dominant when H||[110]. We propose that these two components are intrinsic (a transverse addition to velocity due to the contribution of the Berry phase) and extrinsic (from the skew scattering mechanism) [51], respectively, and exhibit some decrease of exponents from integers due to the geometric factor. In the paramagnetic phase near Neel temperature, on-site 4f-5d spin fluctuations in the vicinity of Ho3+ ions were found to induce spin-polarized 5d states (ferromagnetic nanoscale domains–ferrons) in the conduction band, which result in the appearance of an additional ferromagnetic contribution to AHE, as observed both in the isotropic and anisotropic components of Hall effect. Detailed measurements of the angular dependences of Hall resistivity and MR with vector H rotation in the (110) plane, perpendicular to the direction of stripes, made it possible to separate the negative isotropic and positive anisotropic contributions to AHE and MR, and to explain them in terms of charge carriers scattering by dynamic charge stripes.

Supplementary Materials

The following supporting information can be downloaded at: https://www.mdpi.com/article/10.3390/molecules28020676/s1, Figure S1: The direct match between (a) the data obtained in the conventional field-sweep scheme of Hall effect measurements with two opposite directions of ±H||n and (b) the data extracted in the experiment with step-by-step rotation of the sample around I||[1–10] with a fixed H direction in the transverse plane; Figures S2 and S3: The approximation of the angular dependences of Hall resistivity ρH(φ) for H = 80 kOe in the temperature range 2.1–30 K for n||[111] and n||[112] by Equation (2); Figure S4: Coefficients RH0, RHan of the ordinary and RM0, RMan of the anomalous Hall effect (Equation (6)) depending on temperature for three vectors n||[001], n||[110], and n||[111]; Figure S5: The X-ray powder analysis; Figure S6: Typical X-ray Laue back reflection patterns; Figures S7–S9: Verification of the single-domain crystals by the rocking curve control; Figure S10: The results of the microprobe analysis of the Ho0.8Lu0.2B12 single crystals; Table S1: The corrections due to demagnetizing factors and values of the demagnetization factor, depending on the type of experiment; Table S2: The results of the microprobe analysis of the Ho0.8Lu0.2B12 single crystals.

Author Contributions

Conceptualization, N.E.S. and V.V.G.; software, A.V.B.; validation, V.V.V.; investigation, A.L.K., K.M.K., A.N.A. and V.N.K.; resources, N.Y.S. and V.B.F.; writing—original draft preparation, A.L.K.; writing—review and editing, N.Y.S.; visualization, A.L.K. and K.M.K.; supervision, S.G. and K.F. All authors have read and agreed to the published version of the manuscript.

Funding

The work in Prokhorov General Physics Institute of RAS was supported by the Russian Science Foundation, Project No. 22-22-00243, and partly performed using the equipment of the Institute of Experimental Physics, Slovak Academy of Sciences. K.F. and S.G. were supported by the Slovak Research and Development Agency under the contract No. APVV-17-0020, and by the projects VEGA 2/0032/20, and VA SR ITMS2014 + 313011W856.

Institutional Review Board Statement

Not applicable.

Informed Consent Statement

Not applicable.

Data Availability Statement

The data presented in this study are available on request from the corresponding author.

Conflicts of Interest

The authors declare no conflict of interest.

References

  1. Loudon, J.C.; Mathur, N.D.; Midgley, P.A. Charge-ordered ferromagnetic phase in La0.5Ca0.5MnO3. Nature 2002, 420, 797. [Google Scholar] [CrossRef] [PubMed] [Green Version]
  2. Moreo, A.; Yunoki, S.; Dagotto, E. Phase separation scenario for manganese oxides and related materials. Science 1999, 283, 2034. [Google Scholar] [CrossRef] [PubMed] [Green Version]
  3. Salamon, M.B.; Jaime, M. Phase separation scenario for manganese oxides and related materials. Rev. Mod. Phys. 2001, 73, 583. [Google Scholar] [CrossRef]
  4. Bebenin, N.G.; Loshkareva, N.N.; Makhnev, A.A.; Mostovshchikova, E.V.; Nomerovannaya, L.V.; Gan’Shina, E.A.; Vinogradov, A.N.; Mukovskii, Y.M. Optical and magneto-optical properties of ferromagnetic La1−xBaxMnO3 single crystals. J. Phys. Condens. Matter 2010, 22, 096003. [Google Scholar] [CrossRef] [PubMed]
  5. Rho, H.; Snow, C.S.; Cooper, S.L.; Fisk, Z.; Comment, A.; Ansermet, J.P. Evolution of magnetic polarons and spin-carrier interactions through the metal-insulator transition in Eu1−xGdxO. Phys. Rev. Lett. 2002, 88, 4. [Google Scholar] [CrossRef] [Green Version]
  6. Hayden, S.M.; Lander, G.H.; Zarestky, J.; Brown, P.J.; Stassis, C.; Metcalf, P.; Honig, J.M. Incommensurate magnetic correlations in La1.8Sr0.2NiO4. Phys. Rev. Lett. 1992, 68, 1061. [Google Scholar] [CrossRef]
  7. Cheong, S.W.; Aeppli, G.; Mason, T.E.; Mook, H.; Hayden, S.M.; Canfield, P.C.; Fisk, Z.; Clausen, K.N.; Martinez, J.L. Incommensurate magnetic fluctuations in La2−xSrxCuO4. Phys. Rev. Lett. 1991, 67, 1791. [Google Scholar] [CrossRef]
  8. Tranquada, J.M.; Woo, H.; Perring, T.G.; Goka, H.; Gu, G.D.; Xu, G.; Fujita, M.; Yamada, K. Quantum magnetic excitations from stripes in copper oxide superconductors. Nature 2004, 429, 534. [Google Scholar] [CrossRef] [Green Version]
  9. Fernandes, R.M.; Chubukov, A.V.; Schmalian, J. What drives nematic order in iron-based superconductors? Nat. Phys. 2014, 10, 97. [Google Scholar] [CrossRef] [Green Version]
  10. Lee, J.J.; Schmitt, F.T.; Moore, R.G.; Johnston, S.; Cui, Y.T.; Li, W.; Yi, M.; Liu, Z.K.; Hashimoto, M.; Zhang, Y.; et al. Interfacial mode coupling as the origin of the enhancement of Tc in FeSe films on SrTiO3. Nature 2014, 515, 245. [Google Scholar] [CrossRef]
  11. Ge, J.F.; Liu, Z.L.; Liu, C.; Gao, C.L.; Qian, D.; Xue, Q.K.; Liu, Y.; Jia, J.F. Superconductivity above 100 K in single-layer FeSe films on doped SrTiO3. Nat. Mater. 2015, 14, 285. [Google Scholar] [CrossRef] [PubMed]
  12. Wang, Q.; Shen, Y.; Pan, B.; Hao, Y.; Ma, M.; Zhou, F.; Steffens, P.; Schmalzl, K.; Forrest, T.R.; Abdel-Hafiez, M.; et al. Strong interplay between stripe spin fluctuations, nematicity and superconductivity in FeSe. Nat. Mater. 2016, 15, 159. [Google Scholar] [CrossRef] [PubMed] [Green Version]
  13. Si, Q.; Yu, R.; Abrahams, E. High-temperature superconductivity in iron pnictides and chalcogenides. Nat. Rev. Mater. 2016, 1, 1. [Google Scholar] [CrossRef] [Green Version]
  14. Sachdev, S.; Keimer, B. Quantum criticality. Phys. Today 2011, 64, 29. [Google Scholar] [CrossRef] [Green Version]
  15. Dagotto, E.; Hotta, T.; Moreo, A. Colossal magnetoresistant materials: The key role of phase separation. Phys. Rep. 2001, 344, 1. [Google Scholar] [CrossRef] [Green Version]
  16. Ahn, K.H.; Lookman, T.; Bishop, A.R. Strain-induced metal–insulator phase coexistence in perovskite manganites. Nature 2004, 428, 401. [Google Scholar] [CrossRef]
  17. Uehara, M.; Mori, S.; Chen, C.H.; Cheong, S.W. Percolative phase separation underlies colossal magnetoresistance in mixed-valent manganites. Nature 1999, 399, 560. [Google Scholar] [CrossRef]
  18. Alvarez, G.; Mayr, M.; Moreo, A.; Dagotto, E. Areas of superconductivity and giant proximity effects in underdoped cuprates. Phys. Rev. B 2005, 71, 014514. [Google Scholar] [CrossRef] [Green Version]
  19. Aliaga, H.; Magnoux, D.; Moreo, A.; Poilblanc, D.; Yunoki, S.; Dagotto, E. Theoretical study of half-doped models for manganites: Fragility of CE phase with disorder, two types of colossal magnetoresistance, and charge-ordered states for electron-doped materials. Phys. Rev. B 2003, 68, 104405. [Google Scholar] [CrossRef] [Green Version]
  20. Tokura, Y.; Kuwahara, H.; Moritomo, Y.; Tomioka, Y.; Asamitsu, A. Competing Instabilities and Metastable States in (N d, S m)1/2Sr1/2MnO3. Phys. Rev. Lett. 1996, 76, 3184. [Google Scholar] [CrossRef]
  21. Akahoshi, D.; Uchida, M.; Tomioka, Y.; Arima, T.; Matsui, Y.; Tokura, Y. Random potential effect near the bicritical region in perovskite manganites as revealed by comparison with the ordered perovskite analogs. Phys. Rev. Lett. 2003, 90, 4. [Google Scholar] [CrossRef]
  22. Tomioka, Y.; Tokura, Y. Global phase diagram of perovskite manganites in the plane of quenched disorder versus one-electron bandwidth. Phys. Rev. B 2004, 70, 014432. [Google Scholar] [CrossRef]
  23. Milward, G.C.; Calderón, M.J.; Littlewood, P.B. Electronically soft phases in manganites. Nature 2005, 433, 607. [Google Scholar] [CrossRef] [PubMed] [Green Version]
  24. Tranquada, J.M. Spins, Stripes, and Superconductivity in Hole-Doped Cuprates. In AIP Conference Proceedings; American Institute of Physics AIP: College Park, ML, USA, 2013; Volume 1550, pp. 114–187. [Google Scholar]
  25. Thampy, V.; Chen, X.M.; Cao, Y.; Mazzoli, C.; Barbour, A.M.; Hu, W.; Miao, H.; Fabbris, G.; Zhong, R.D.; Gu, G.D.; et al. Static charge-density-wave order in the superconducting state of La2−xBaxCuO4. Phys. Rev. B 2017, 95, 241111. [Google Scholar] [CrossRef] [Green Version]
  26. Jacobsen, H.; Holm, S.L.; Lăcătuşu, M.E.; Rømer, A.T.; Bertelsen, M.; Boehm, M.; Toft-Petersen, R.; Grivel, J.C.; Emery, S.B.; Udby, L.; et al. Distinct nature of static and dynamic magnetic stripes in cuprate superconductors. Phys. Rev. Lett. 2018, 120, 037003. [Google Scholar] [CrossRef] [Green Version]
  27. Anissimova, S.; Parshall, D.; Gu, G.D.; Marty, K.; Lumsden, M.D.; Chi, S.; Fernandez-Baca, J.A.; Abernathy, D.L.; Lamago, D.; Tranquada, J.M.; et al. Direct observation of dynamic charge stripes in La2–xSrxNiO4. Nat. Commun. 2014, 5, 1. [Google Scholar] [CrossRef] [Green Version]
  28. Abeykoon, A.M.M.; Božin, E.S.; Yin, W.G.; Gu, G.; Hill, J.P.; Tranquada, J.M.; Billinge, S.J.L. Evidence for short-range-ordered charge stripes far above the charge-ordering transition in La1.67Sr0.33NiO4. Phys. Rev. Lett. 2013, 111, 096404. [Google Scholar] [CrossRef] [Green Version]
  29. Kohsaka, Y.; Taylor, C.; Fujita, K.; Schmidt, A.; Lupien, C.; Hanaguri, T.; Azuma, M.; Takano, M.; Eisaki, H.; Takagi, H.; et al. An intrinsic bond-centered electronic glass with unidirectional domains in underdoped cuprates. Science 2007, 315, 1380. [Google Scholar] [CrossRef] [Green Version]
  30. Gabani, S.; Flachbart, K.; Siemensmeyer, K.; Mori, T. Magnetism and superconductivity of rare earth borides. J. Alloys Compd. 2020, 821, 153201. [Google Scholar] [CrossRef]
  31. Paderno, Y.; Shitsevalova, N.; Batko, I.; Flahbart, K.; Misiorek, H.; Mucha, J.; Jeżowski, A. Transition and rare earth element dodecaborides. Transition and rare earth element dodecaborides. J. Alloys Compd. 1995, 219, 215. [Google Scholar] [CrossRef]
  32. Inosov, D.S. (Ed.) Rare-Earth Borides, 1st ed.; Jenny Stanford Publishing: Singapore, 2021. [Google Scholar]
  33. Mori, T. Rare Earth Higher Borides. In Handbook on the Physics and Chemistry of Rare-Earths; Bunzli, C., Pecharsky, V., Eds.; Elsevier: Amsterdam, The Netherlands, 2008; pp. 39–154. [Google Scholar]
  34. Werheit, H.; Filipov, V.; Shirai, K.; Dekura, H.; Shitsevalova, N.; Schwarz, U.; Armbrüster, M. Raman scattering and isotopic phonon effects in dodecaborides. J. Phys. Condens. Matter 2011, 23, 065403. [Google Scholar] [CrossRef] [PubMed]
  35. Khoroshilov, A.L.; Krasnorussky, V.N.; Krasikov, K.M.; Bogach, A.V.; Glushkov, V.V.; Demishev, S.V.; Samarin, N.A.; Voronov, V.V.; Shitsevalova, N.Y.; Filipov, V.B.; et al. Maltese cross anisotropy in Ho0.8Lu0.2B12 antiferromagnetic metal with dynamic charge stripes. Phys. Rev. B 2019, 99, 174430. [Google Scholar] [CrossRef] [Green Version]
  36. Bolotina, N.B.; Dudka, A.P.; Khrykina, O.N.; Mironov, V.S. Crystal Structures of Dodecaborides: Complexity in Simplicity. In Rare-Earth Borides, 1st ed.; Inosov, D.S., Ed.; Jenny Stanford Publishing: New York, NY, USA, 2021; Chapter 3; pp. 293–330. [Google Scholar]
  37. Sluchanko, N.E.; Azarevich, A.N.; Bogach, A.V.; Vlasov, I.I.; Glushkov, V.V.; Demishev, S.V.; Maksimov, A.A.; Tartakovskii, I.I.; Filatov, E.V.; Flachbart, K.; et al. Effects of disorder and isotopic substitution in the specific heat and Raman scattering in LuB12. J. Exp. Theor. Phys. 2011, 113, 468. [Google Scholar] [CrossRef]
  38. Sluchanko, N.E.; Azarevich, A.N.; Bogach, A.V.; Bolotina, N.B.; Glushkov, V.V.; Demishev, S.V.; Dudka, A.P.; Khrykina, O.N.; Filipov, V.B.; Shitsevalova, N.Y.; et al. Observation of dynamic charge stripes in Tm0.19Yb0.81B12 at the metal–insulator transition. J. Phys. Condens. Matter 2019, 31, 065604. [Google Scholar] [CrossRef] [Green Version]
  39. Zhukova, E.S.; Gorshunov, B.P.; Komandin, G.A.; Alyabyeva, L.N.; Muratov, A.V.; Aleshchenko, Y.A.; Anisimov, M.A.; Shitsevalova, N.Y.; Polovets, S.E.; Filipov, V.B.; et al. Collective infrared excitation in rare-earth GdxLa 1−xB6 hexaborides. Phys. Rev. B 2019, 100, 104302. [Google Scholar] [CrossRef] [Green Version]
  40. Krasikov, K.M.; Bogach, A.V.; Bozhko, A.D.; Glushkov, V.V.; Demishev, S.V.; Khoroshilov, A.L.; Shitsevalova, N.Y.; Filipov, V.; Gabáni, S.; Flachbart, K.; et al. Anisotropy of the charge transport in Ho11B12 antiferromagnet with dynamic charge stripes. Solid State Sci. 2020, 104, 106253. [Google Scholar] [CrossRef]
  41. Khrykina, O.N.; Dudka, A.P.; Bolotina, N.B.; Sluchanko, N.E.; Shitsevalova, N.Y. Structural instability and poorly defined phase transitions in rare-earth dodecaborides RB12 (R = Ho-Lu) at intermediate temperatures. Solid State Sci. 2020, 107, 106273. [Google Scholar] [CrossRef]
  42. Sluchanko, N.; Khoroshilov, A.; Krasnorussky, V.; Krasikov, K. Maltese Cross Anisotropy in Antiferromagnetic State of Metallic Ho0.5Lu0.5B12 with Dynamic Charge Stripes. Acta Phys. Pol. A 2020, 137, 756. [Google Scholar] [CrossRef]
  43. Krasikov, K.M.; Azarevich, A.N.; Glushkov, V.V.; Demishev, S.V.; Khoroshilov, A.L.; Bogach, A.V.; Shitsevalova, N.Y.; Filippov, V.B.; Sluchanko, N.E. Breaking of cubic symmetry in rare-earth dodecaborides with dynamic charge stripes. JETP Lett. 2020, 112, 413. [Google Scholar] [CrossRef]
  44. Krasikov, K.; Glushkov, V.; Demishev, S.; Khoroshilov, A.; Bogach, A.; Voronov, V.; Shitsevalova, N.; Filipov, V.; Gabáni, S.; Flachbart, K. Suppression of indirect exchange and symmetry breaking in the antiferromagnetic metal HoB12 with dynamic charge stripes. Phys. Rev. B 2020, 102, 214435. [Google Scholar] [CrossRef]
  45. Krasikov, K.M.; Bogach, A.V.; Demishev, S.V.; Voronov, V.V.; Shitsevalova, N.Y.; Filipov, V.B.; Sluchanko, N.E. Magnetoresistance anisotropy in ErB12 antiferromagnetic metal: The evidence for dynamic charge stripes. J. Magn. Magn. Mater. 2022, 545, 168796. [Google Scholar] [CrossRef]
  46. Azarevich, A.; Glushkov, V.; Demishev, S.; Bogach, A.; Voronov, V.; Gavrilkin, S.; Shitsevalova, N.; Filipov, V.; Gabáni, S.; Kačmarčík, J.; et al. Evidence of symmetry lowering in antiferromagnetic metal TmB12 with dynamic charge stripes. J. Phys. Condens. Matter 2022, 34, 065602. [Google Scholar] [CrossRef] [PubMed]
  47. Sluchanko, N.E.; Khoroshilov, A.L.; Bogach, A.V.; Voronov, V.V.; Glushkov, V.V.; Demishev, S.V.; Krasnorussky, V.N.; Krasikov, K.M.; Shitsevalova, N.Y.; Filippov, V.B. Magnetoresistance scaling and the anisotropy of charge carrier scattering in the paramagnetic phase of Ho0.8Lu0.2B12 cage glass. JETP Lett. 2018, 107, 30. [Google Scholar] [CrossRef]
  48. Sluchanko, N.E. Magnetism, Quantum Criticality, and Metal–Insulator Transitions in RB12. In Rare-Earth Borides, 1st ed.; Jenny Stanford Publishing: New York, NY, USA, 2021; Chapter 4; pp. 331–441. [Google Scholar]
  49. Sluchanko, N.; Azarevich, A.; Bogach, A.; Demishev, S.; Krasikov, K.; Voronov, V.; Filipov, V.; Shitsevalova, N.; Glushkov, V. Hall effect and symmetry breaking in the nonmagnetic metal LuB12 with dynamic charge stripes. Phys. Rev. B 2021, 103, 35117. [Google Scholar] [CrossRef]
  50. Khoroshilov, A.L.; Azarevich, A.N.; Bogach, A.V.; Glushkov, V.V.; Demishev, S.V.; Krasnorussky, V.N.; Krasikov, K.M.; Kuznetsov, A.V.; Shitsevalova, N.Y.; Filipov, V.B.; et al. Anisotropy of the Hall Effect in the Paramagnetic Phase of Ho0.8Lu0.2B12 Cage Glass. JETP Lett. 2021, 113, 526. [Google Scholar] [CrossRef]
  51. Nagaosa, N.; Sinova, J.; Onoda, S.; MacDonald, A.H.; Ong, N.P. Anomalous hall effect. Rev. Mod. Phys. 2010, 82, 1539. [Google Scholar] [CrossRef] [Green Version]
  52. Malkin, B.Z.; Goremychkin, E.A.; Siemensmeyer, K.; Gabáni, S.; Flachbart, K.; Rajňák, M.; Khoroshilov, A.L.; Krasikov, K.M.; Shitsevalova, N.Y.; Filipov, V.B.; et al. Crystal-field potential and short-range order effects in inelastic neutron scattering, magnetization, and heat capacity of the cage-glass compound HoB12. Phys. Rev. B 2021, 104, 134436. [Google Scholar] [CrossRef]
  53. Siemensmeyer, K.; Habicht, K.; Lonkai, T.; Mat’aš, S.; Gabáni, S.; Shitsevalova, N.; Wulf, E.; Flachbart, K. Magnetic properties of the frustrated fcc–antiferromagnet HoB12 above and below TN. J. Low Temp. Phys. 2007, 146, 581. [Google Scholar] [CrossRef]
  54. Kalvius, G.M.; Noakes, D.R.; Marcano, N.; Wäppling, R.; Iga, F.; Takabatake, T. Dynamics of the internal field in RB12(R = Er, Yb, Lu). Phys. B Condens. Matter 2003, 326, 398. [Google Scholar] [CrossRef]
  55. Sluchanko, N.E.; Sluchanko, D.N.; Samarin, N.A.; Glushkov, V.V.; Demishev, S.V.; Kuznetsov, A.V.; Burkhanov, G.S.; Chistyakov, O.D. Hall-effect anomalies near the quantum critical point in Ce Cu6−xAux. Low Temp. Phys. 2009, 35, 544. [Google Scholar] [CrossRef]
  56. Baranovskiy, A.E.; Grechnev, G.E.; Shitsevalova, N.Y.; Sluchanko, D.N.; Glushkov, V.V.; Demishev, S.V.; Sluchanko, N.E. Hall effect and magnetic ordering in RB12. Low Temp. Phys. 2009, 35, 565. [Google Scholar] [CrossRef] [Green Version]
  57. Rybina, A.V.; Nemkovski, K.S.; Alekseev, P.A.; Mignot, J.M.; Clementyev, E.S.; Johnson, M.; Capogna, L.; Dukhnenko, A.V.; Lyashenko, A.B.; Filippov, V.B. Lattice dynamics in ZrB12 and LuB12: Ab initio calculations and inelastic neutron scattering measurements. Phys. Rev. B 2010, 82, 4. [Google Scholar] [CrossRef]
  58. Bolotina, N.B.; Dudka, A.P.; Khrykina, O.N.; Krasnorussky, V.N.; Shitsevalova, N.Y.; Filipov, V.B.; Sluchanko, N.E. The lower symmetry electron-density distribution and the charge transport anisotropy in cubic dodecaboride LuB12. J. Phys. Condens. Matter 2018, 30, 265402. [Google Scholar] [CrossRef] [PubMed] [Green Version]
  59. Bolotina, N.B.; Dudka, A.P.; Khrykina, O.N.; Glushkov, V.V.; Azarevich, A.N.; Krasnorussky, V.N.; Gabani, S.; Shitsevalova, N.Y.; Dukhnenko, A.V.; Filipov, V.B.; et al. On the role of isotopic composition in crystal structure, thermal and charge-transport characteristics of dodecaborides LuNB12 with the Jahn-Teller instability. J. Phys. Chem. Solids 2019, 129, 434. [Google Scholar] [CrossRef]
  60. Sluchanko, N.E.; Bogach, A.V.; Glushkov, V.V.; Demishev, S.V.; Samarin, N.A.; Sluchanko, D.N.; Dukhnenko, A.V.; Levchenko, A.V. Anomalies of magnetoresistance of compounds with atomic clusters RB12 (R = Ho, Er, Tm, Lu). J. Exp. Theor. Phys. 2009, 108, 668. [Google Scholar] [CrossRef]
  61. Sluchanko, N.E.; Azarevich, A.N.; Bogach, A.V.; Glushkov, V.V.; Demishev, S.V.; Anisimov, M.A.; Levchenko, A.V.; Filipov, V.B.; Shitsevalova, N.Y. Hall and transverse even effects in the vicinity of a quantum critical point in Tm1−xYbxB12. J. Exp. Theor. Phys. 2012, 115, 509. [Google Scholar] [CrossRef] [Green Version]
  62. Koblischka, M.R.; Hewener, B.; Hartmann, U.; Wienss, A.; Christoffer, B.; Persch-Schuy, G. Magnetic force microscopy applied in magnetic data storage technology. Appl. Phys. A 2003, 76, 879. [Google Scholar] [CrossRef]
  63. Krasnorussky, V.; Bogach, A.; Sluchanko, N.; Demishev, S.; Shitsevalova, N.; Filipov, V.; Pristas, G.; Gabani, S.; Flachbart, K.; Glushkov, V.V. Anomalous Magnetic Contributions to Hall Effect in Ho0.5Lu0.5B12. Acta Phys. Pol. A 2020, 137, 767. [Google Scholar] [CrossRef]
  64. Karplus, R.; Luttinger, J.M. Hall effect in ferromagnetics. Phys. Rev. 1954, 95, 1154. [Google Scholar] [CrossRef]
  65. Sluchanko, N.E.; Sluchanko, D.N.; Glushkov, V.V.; Demishev, S.V.; Samarin, N.A.; Shitsevalova, N.Y. Anomalous hall effect in HoB12. JETP Lett. 2008, 86, 604. [Google Scholar] [CrossRef]
  66. Kohout, A.; Batko, I.; Czopnik, A.; Flachbart, K.; Matas, S.; Meissner, M.; Paderno, Y.; Shitsevalova, N.; Siemensmeyer, K. Phase diagram and magnetic structure investigation of the fcc antiferromagnet HoB12. Phys. Rev. B 2004, 70, 224416. [Google Scholar] [CrossRef]
  67. Siemensmeyer, K.; Flachbart, K.; Gabáni, S.; Maťaš, S.; Paderno, Y.; Shitsevalova, N. Magnetic structure of rare-earth dodecaborides. J. Solid State Chem. 2006, 179, 2748. [Google Scholar] [CrossRef]
  68. Tennant, D.A.; Nagler, S.E.; Garrett, A.W.; Barnes, T.; Torardi, C.C. Excitation Spectrum and Superexchange Pathways in the Spin Dimer VODPO4˙1/2D2O. Phys. Rev. Lett. 1997, 78, 4998. [Google Scholar] [CrossRef] [Green Version]
  69. Flachbart, K.; Bauer, E.; Gabáni, S.; Kaldarar, H.; Lonkai, T.; Maťaš, S.; Pavlík, V.; Priputen, P.; Shitsevalova, N.; Siemensmeyer, K.; et al. Magnetic ordering in HoB12 below and above TN. J. Magn. Magn. Mater. 2007, 310, 1727. [Google Scholar] [CrossRef]
  70. Dyakonov, M. Basics of semiconductor and spin physics. In Spin Physics in Semiconductors; Springer: Berlin/Heidelberg, Germany, 2008. [Google Scholar]
  71. Batista, C.D.; Lin, S.-Z.; Hayami, S.; Kamiya, Y. Frustration and chiral orderings in correlated electron systems. Rep. Prog. Phys. 2016, 79, 084504. [Google Scholar] [CrossRef]
  72. Taguchi, Y.; Oohara, Y.; Yoshizawa, H.; Nagaosa, N.; Tokura, Y. Spin chirality, Berry phase, and anomalous Hall effect in a frustrated ferromagnet. Science 2001, 291, 2573. [Google Scholar] [CrossRef]
  73. Neubauer, A.; Pfleiderer, C.; Binz, B.; Rosch, A.; Ritz, R.; Niklowitz, P.G.; Böni, P. Topological Hall effect in the A phase of MnSi. Phys. Rev. Lett. 2009, 102, 186602. [Google Scholar] [CrossRef] [Green Version]
  74. Pureur, P.; Fabris, F.W.; Schaf, J.; Campbell, I.A. Chiral susceptibility in canonical spin glass and re-entrant alloys from Hall effect measurements. Europhys. Lett. 2004, 67, 123. [Google Scholar] [CrossRef] [Green Version]
  75. Machida, Y.; Nakatsuji, S.; Onoda, S.; Tayama, T.; Sakakibara, T. Time-reversal symmetry breaking and spontaneous Hall effect without magnetic dipole order. Nature 2010, 463, 210. [Google Scholar] [CrossRef]
  76. Liu, Z.H.; Zhang, Y.J.; Liu, G.D.; Ding, B.; Liu, E.K.; Jafri, H.M.; Hou, Z.P.; Wang, W.H.; Ma, X.Q.; Wu, G.H. Transition from anomalous Hall effect to topological Hall effect in hexagonal non-collinear magnet Mn3Ga. Sci. Rep. 2017, 7, 515. [Google Scholar] [CrossRef]
  77. Smit, J. The spontaneous Hall effect in ferromagnetics II. Physica 1958, 24, 39. [Google Scholar] [CrossRef]
  78. Jungwirth, T.; Niu, Q.; MacDonald, A.H. Anomalous Hall effect in ferromagnetic semiconductors. Phys. Rev. Lett. 2002, 88, 207208. [Google Scholar] [CrossRef] [PubMed] [Green Version]
  79. Berger, L. Side-jump mechanism for the Hall effect of ferromagnets. Phys. Rev. B 1970, 2, 4559. [Google Scholar] [CrossRef]
  80. Gorshunov, B.P.; Zhukova, E.S.; Komandin, G.A.; Torgashev, V.I.; Muratov, A.V.; Aleshchenko, Y.A.; Demishev, S.V.; Shitsevalova, N.Y.; Filipov, V.B.; Sluchanko, N.E. Collective infrared excitation in LuB12 cage-glass. JETP Lett. 2018, 107, 100. [Google Scholar] [CrossRef]
Figure 1. (a) Sketch of charge stripes arrangement (green lines) in the RB12 crystal structure, (bd) H-T magnetic phase diagrams of the AF state of Ho0.8Lu0.2B12 in different field directions, (e) polar plot of the field-angular magnetoresistance dependence in the paramagnetic state and (f,g) angular H-φ magnetic phase diagrams (color shows the magnetoresistance amplitude) of the AF state of Ho0.8Lu0.2B12 at low temperatures (reproduced from [35]).
Molecules 28 00676 g001
Figure 2. Temperature dependences (a) of resistivity ρ(T) at H = 0 and H = 80 kOe, as well as (b) the absolute value of reduced Hall resistivity –ρH(T)/H in Ho0.8Lu0.2B12 for samples with H||n||[001], H||n||[110], and H||n||[111] (see inset). On panel (b) open and closed symbols show the experimental data for -ρH/H and the sum of isotropic and anisotropic contributions to Hall effect sum = ρH0/H + ρHan/H, correspondingly. Thick solid lines show the reduced amplitudes of the isotropic component cos = ρH0/H (see Section 2.3 for details). Vertical dashed lines point to the transition to the cage-glass state at T*~60 K [37] and to the formation of stripes at TS~15 K (see discussion below), and denote the temperatures 2.1 K, 4.2 K, and 6.5 K at which Hall resistivity was studied in more detail.
Molecules 28 00676 g002
Figure 3. (ac) Field dependences of the reduced Hall resistivity ρH/B vs magnetic induction B at T = 2.1, 4.2, and 6.5 K for samples with H||n||[001], n||[110], and n||[111], respectively. Arrows at BN indicate the AF-P transitions. (df) Corresponding curves of magnetic susceptibility M/B(B). Dashed lines show the approximation in the interval 7–8 T (see text).
Molecules 28 00676 g003
Figure 4. Temperature dependences of magnetic susceptibility (left scale) and of the effective moment (right scale) at H = 100 Oe for different samples with H||n||[001], n||[110], and n||[111] (see text). Solid line indicates the changes of the magnetic moment of Ho 5I8-multiplet splitting by CEF in HoB12 (see [52]).
Molecules 28 00676 g004
Figure 5. (ad) Angular dependencies of Hall resistivity ρH(φ) measured in H = 80 kOe for samples with n||[001] and n||[110] in the temperature range 2–300 K. Symbols show the experimental ρH(φ) data, thin and thick curves demonstrate the isotropic fcos(φ) ≈ ρH0·cos(φ) and anisotropic ρHan(φ) = ρH(φ) − fcos(φ) contributions, correspondingly.
Molecules 28 00676 g005
Figure 6. (ad) Angular dependences of Hall resistivity ρH(φ) at T = 6.5 K in fixed magnetic field up to 80 kOe for samples with n||[001], n||[110], n||[111], and n||[112]. Symbols show the experimental ρH(φ) curves, thin and thick lines indicate isotropic fcos(φ) ≈ ρH0·cos(φ) and anisotropic ρHan(φ) = ρH(φ) − fcos(φ) contributions, correspondingly.
Molecules 28 00676 g006
Figure 7. Reduced amplitudes of (a) isotropic ρH0/H and (b) anisotropic ρHan/H contributions vs external magnetic field H at temperatures of 2.1, 4.2, and 6.5 K for samples with n||[001], n||[110], n||[111], and n||[112]. Different temperatures are indicated by different shapes of symbols, while samples with different n directions are indicated by different colors of the symbols. Right axis on panel (a) shows the reduced Hall concentration n/nR for comparison (see text).
Molecules 28 00676 g007
Figure 8. (a) Arrhenius plot lg(n/nR) = f(1/T) of the reduced Hall concentration for n||[001] and n||[110] at H = 80 kOe. (b) Temperature dependences of the Hall mobility µH and the parameter ωcτ ≈ µH·H for three directions n||[001], n||[110], and n|[111]. Thick dashed lines show the (a) activation behavior and (b) power law.
Molecules 28 00676 g008
Figure 9. (a,b) Anisotropic positive contribution ρHan(φ)/H for samples with n||[001] and n||[110] at H = 80 kOe. (c,d) Temperature dependencies of ρHan/H amplitudes for n||[001] and n||[110] in the logarithmic scale. Panels (e,f) show the temperature dependencies of the anisotropic contribution to resistivity ρxxan = ρ(n||[001], T0, H = 80 kOe)-ρ(n||[111], T0, H = 80 kOe) and ρxxan= ρ(n||[110], T0, H = 80 kOe) − ρ(n||[111], T0, H = 80 kOe), respectively. Green and red solid lines on panels (cf) show the approximation by Equations (3) and (4) (see text).
Molecules 28 00676 g009
Figure 10. (a,b) Anisotropic contributions ρHan(φ)/H in magnetic field H = 80 kOe for the samples with n||[111] and n||[112], respectively.
Molecules 28 00676 g010
Figure 11. Linear approximation of the isotropic ρH0/B (a,c,e) and anisotropic ρHan/B (b,d,f) contributions vs 4πM/B within the Equation (6) approximation at 2.1–7 K for three principal directions H||[001], H||[110], and H||[111] (see text).
Molecules 28 00676 g011
Figure 12. Anisotropic AHE components for directions H||[001] and H||[110] in magnetic field H = 80 kOe scaled in double logarithmic plot. Solid lines display the linear approximations and β denotes the exponent in ρanHanxxβ.
Molecules 28 00676 g012
Figure 13. (a) Normalized angular Hall resistivity ρH(φ)/(H·cos(φ − φ1)) and (b) magnetoresistance curves in field 80 kOe at temperature 2.1 K for four samples with n||[001], n||[110], n||[111], and n||[112]. Yellow shading indicates the common envelope for all four Hall effect measurements (see text).
Molecules 28 00676 g013
Table 1. Parameters RH0, RHan of the ordinary and anomalous RM0, RMan contributions to Hall effect in Ho0.8Lu0.2B12 averaged over temperatures 2.1–7 K.
RH, 10−4 × cm3/CH||n||[001]H||n||[110]H||n||[111]
RH0−7.3−7.7−7.7
RHan6.82.30
RM025.226.926.5
RMan−64.9−20.90
Disclaimer/Publisher’s Note: The statements, opinions and data contained in all publications are solely those of the individual author(s) and contributor(s) and not of MDPI and/or the editor(s). MDPI and/or the editor(s) disclaim responsibility for any injury to people or property resulting from any ideas, methods, instructions or products referred to in the content.

