2.2. Crystal Structure and Formation Energy
In this study, we selected the highly crystalline CaTiO
3 perovskite (space group Pm-3m), which comprises a twelve-coordinated Ca atom, a four-coordinated Ti atom, and a two-coordinated O atom. To introduce rare earth elements (specifically lanthanum and cesium), we substituted the calcium atom in the bulk structure at a doping ratio of 0.125. In addition, oxygen atoms in the lattice were replaced with low electronegativity atoms as part of a common doping approach. As a result of the hybridization of the electron orbitals of the dopant elements with those of the O 2p states, new molecular orbitals were formed that had a lower energy than it. Consequently, the VBM derived from these new molecular orbitals was higher than that of the O 2p states. To assess the impact of co-doping, we selected two elements with low electronegativity (nitrogen and sulfur). We constructed a 2 × 2 × 2 supercell, consisting of 40 atoms, to investigate the effects of rare earth element co-doping and the microscopic influence of doping concentration on the structural phase and electronic structure of CaTiO
3 (see
Figure 1). As the majority of perovskite materials employ this model structure in their calculations to maintain precision [
8,
47,
51], our choice of this model enhances the reasonableness and reliability of our subsequent calculations. Moreover, the doping effect was initiated at different positions during co-doping by replacing oxygen atoms proximally and distally (1-proximally and 2-disrally), depending on the position of doped rare earth elements.
The optimized lattice parameters of pure CaTiO
3 (a = b = c = 3.899 Å) were in agreement with both experimental findings (a = b = c = 3.897 Å) [
52] and theoretical data (a = b = c = 3.931 Å) [
53]. The calculated Ti–O bond length was determined to be 1.950 Å, while the closest interatomic separation between Ca and O was computed at 2.758 Å. These values closely aligned with experimental measurements of 1.952 Å for Ti–O and 2.760 Å for Ca–O, respectively [
54]. In this regard, the calculation method and parameters used for modeling calcium titanate were appropriate. Given the comparable ionic radii of N
3− and O
2−, the incorporation of N dopant into the lattice induced subtle deviations in the lattice parameters; nevertheless, the observed alterations were deemed negligible in magnitude. Conversely, due to the larger radius of S
2− compared to O
2−, the lattice volume significantly increased, regardless of whether the doping occurred at the proximal or distal end. By comparing the formation energy and binding energy of co-doping, the validity of the calculation can be determined.
The formation energy (
) was employed to assess the feasibility of dopant integration and the stability of the doped system within the lattice, as described by Equation (1) [
46]:
where
and
are the total energy of doped and pure CaTiO
3 systems, respectively.
and
represent the number of doped and superseded elements.
and
refer to the chemical potential of doped and superseded elements.
For metal elements,
,
,
, and
are defined as the total energy of metal divided by the number of atoms in bulk. For non-metallic elements,
,
, and
are obtained by putting the most stable element in a 10 Å × 10 Å × 10 Å cube box, respectively. For fluctuating chemical potential during dopant production, computations were undertaken in O-rich and O-poor environments, according to Equation (2) [
47]:
where
represents the total energy of pure CaTiO
3. The superior and inferior boundaries of
are classified as O-rich and O-poor environments, respectively. The formation energy for O-rich (
) and O-poor (
) cases can be calculated by plugging the appropriate
into Equation (1). The formation energy of co-doped CaTiO
3 in O-rich and O-poor conditions was summarized in
Table 1.
As defined by the definition of formation energy, structures with smaller formation energies would be more stable and the process of doping would be easier. As shown in
Table 1, the formation energy was more negative in an O-poor environment than in an O-rich environment, indicating thermodynamic stability. The difference in formation energy led to the easiest doping site. Also, regardless of changes in rare earth elements (La and Ce), N was more predisposed to a remote site (N2), whereas S was more appropriate for doping close to rare earth elements (S1). In addition to the analysis of doping formation, calculating the binding energy (
) of the doping model was essential to determine whether the system was more tightly bound (Equation (3)) [
55]:
where
represents single doping energy and
refers to the co-doped energy. The binding energy of co-doped CaTiO
3 is summarized in
Table 2. It is evident that higher positive binding energies correspond to more well-defined doping models. Therefore, both binding energy and formation energy had similar trends when both rare earth elements (La or Ce) and low-electronegativity elements (N or S) were simultaneously incorporated (
Table 2). Specifically, the S atom is more likely to preferentially occupy the proximal position, while the N atom is expected to predominantly reside in the distal position.
Therefore, four typical co-doping systems (LCON2, LCOS1, CCON2, and CCOS1) were selected for subsequent investigations. A comparison between N and S doping revealed that the introduction of S atoms favored the formation of the rare earth co-doping model even though it may have a larger lattice constant. Therefore, we examined the LCOS1 and CCOS1 models, focusing on the effects of the rare earth element concentration. The formation energy of Ca
xLa
1−xTiO
2.95S
0.05 (x = 0.25, 0.375) and Ca
xCe
1−xTiO
2.95S
0.05 (x = 0.25, 0.375) are displayed in
Table 3. For comparison, the energies of La/Ce single doping were calculated under the same conditions. Increasing the doping ratio results in favorable formation energies for the La/Ce single-doped models, whereas adding S in an oxygen-deficient environment generates more negative formation energies for the co-doped systems. This supports the notion that the co-doped systems are more thermodynamically favorable.
2.3. Electronic Structure
To reveal the changes in the electronic structure of CaTiO
3 after co-doping, DFT calculations were performed on pure CaTiO
3, four typical co-doping systems, and four co-doping systems with different rare earth concentrations. The band structure of CaTiO
3 is depicted in
Figure 2.
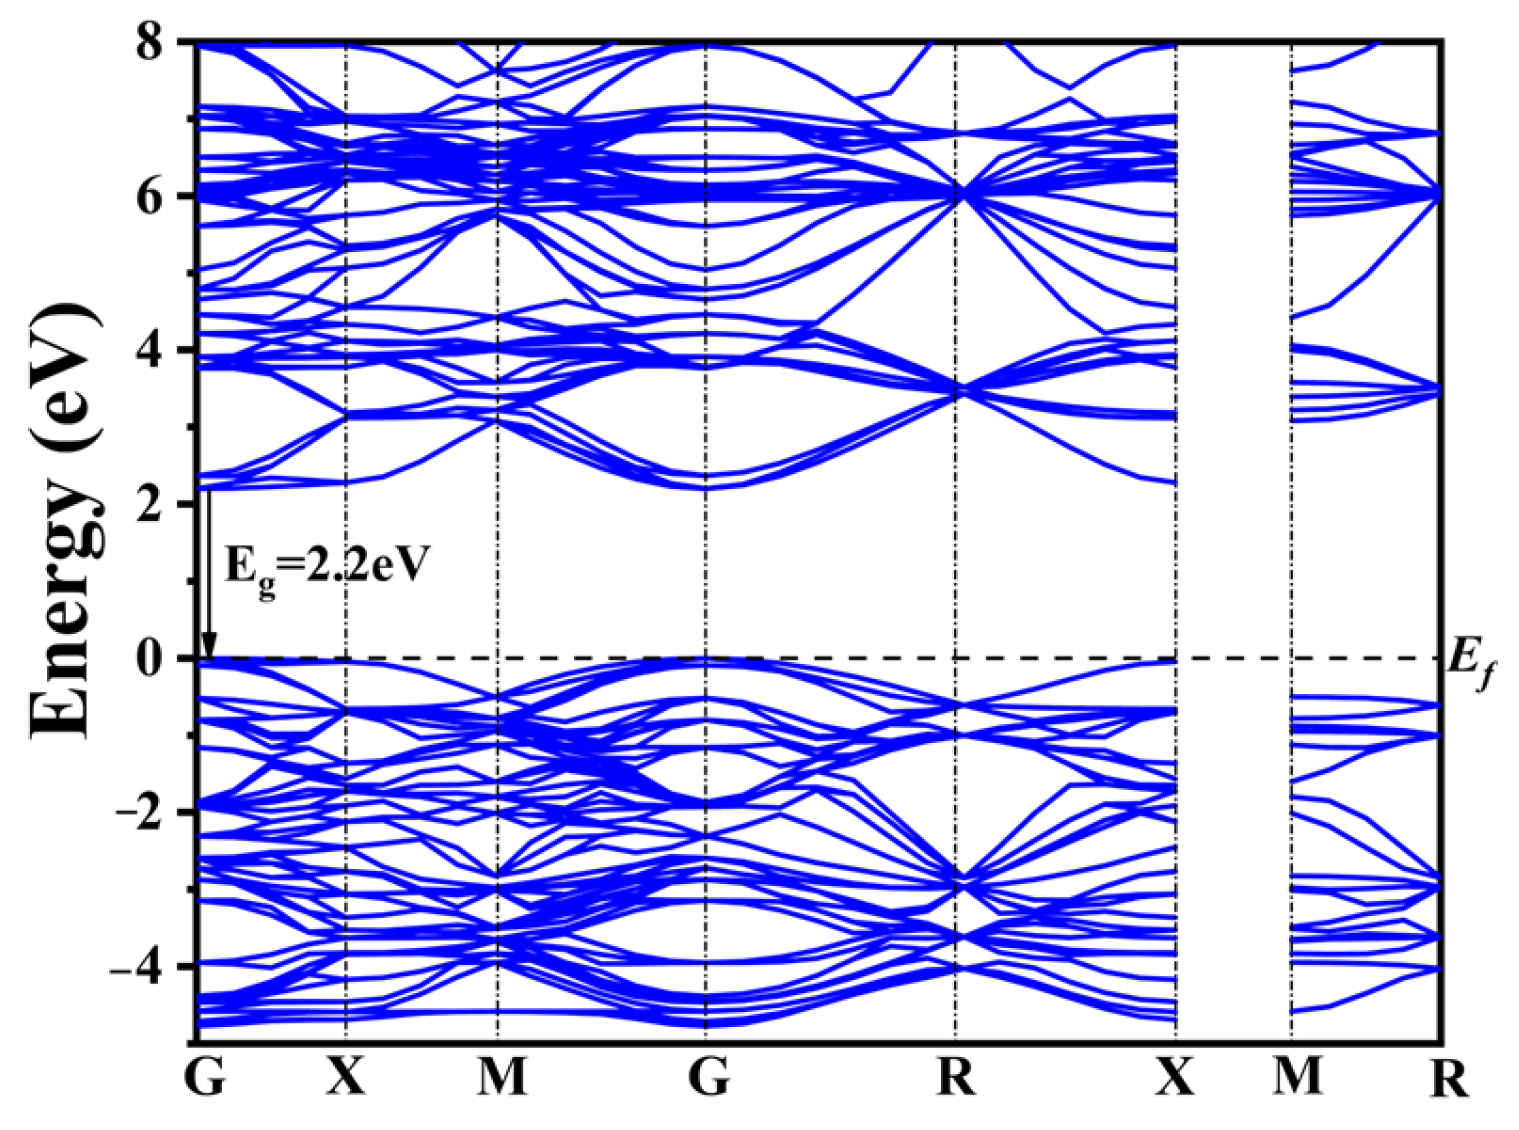
The widely recognized band gap inaccuracies inherent in DFT computations yielded a calculated band gap of 2.2 eV for pure CaTiO
3 employing the GGA+U approach (
Figure 2). This value remains 1.3 eV lower than the experimentally determined band gap width of CaTiO
3. Nonetheless, the band structure characteristics and the shift in the band gap remain consistent and reliable when compared to prior calculations [
56,
57,
58].
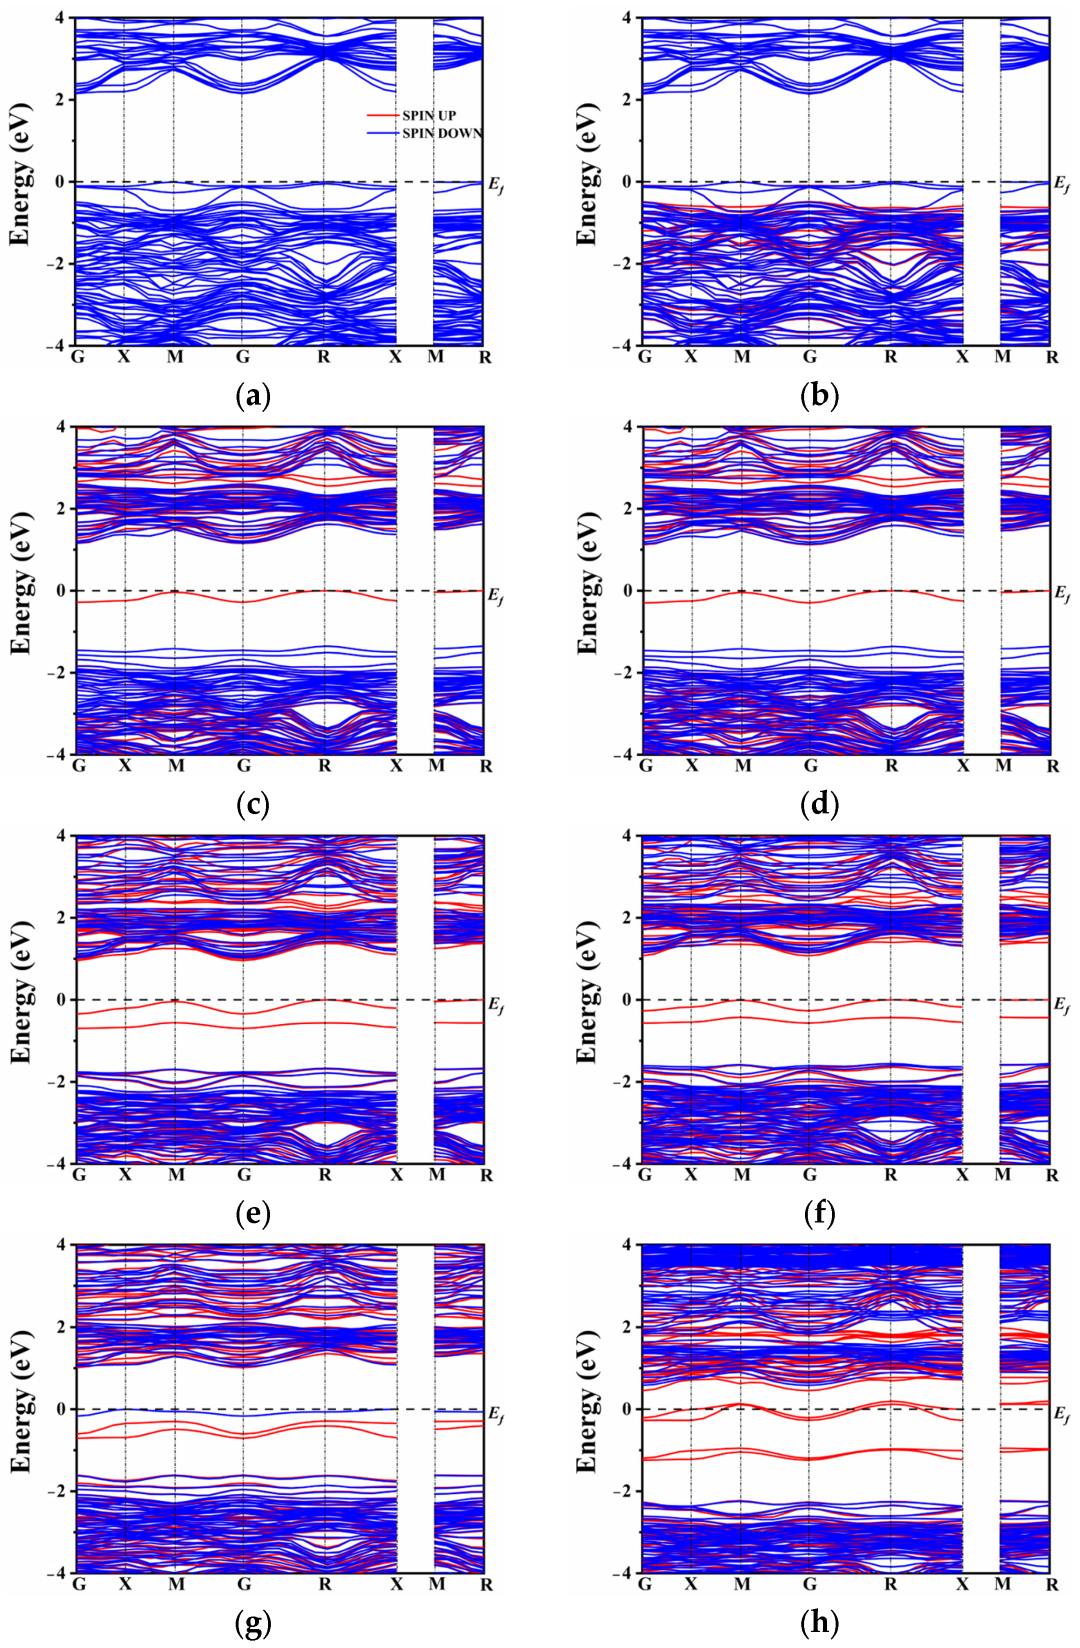
In the case of N atom doping, a modest shift in the band gap was observed, as depicted in
Figure 3a,b. In general, doping elements with lower electronegativity than oxygen tend to maintain the conduction band minimum (CBM) while elevating the top of the valence band. However, the introduction of rare earth elements (La and Ce) had only a marginal impact on the band gap position, which decreased to 2.15 eV and 2.14 eV, respectively, as the co-doped system approached equilibrium. By contrast to the co-doping of N and rare earth elements, the co-doping of S with La or Ce introduced a distinct intermediate band near the Fermi level (
Figure 3c,d). It is worth noting that the presence of S alone may not be the sole reason for the formation of the intermediate band (IB). The origin of the IB can be attributed to the introduction of La
3+ and Ce
3+ ions. Since the superseded ion is Ca
2+, the excess electrons lead to the formation of donor energy levels. Conversely, the co-doping of N
3− compensates for the electron states, resulting in the absence of intermediate energy levels in the band gap. On the other hand, the co-doping of S, which belongs to the same main group as oxygen, exhibits the presence of an intermediate energy band. The hybridization between the S orbital and O orbital seemed very insufficient due to the lower electronegativity of S. As a result, the S atomic orbital did not significantly contribute to the formation of the valence band and the upward shift of its maximum. It effectively conveys the conclusion that the intermediate band is not solely attributed to the presence of non-metallic elements or rare earth elements alone, but rather to the change in energy level induced by their co-doping.
Figure 3e,h compares the changes in the band gap of the co-doped model at different doping concentrations. In the presence of La and Ce ions, there is an increase in impurity energy levels, which alters the model of the unit cell. To comprehensively compare the influence of various proportions of rare earth elements, the band structure was also calculated for single doping of 0.25 and 0.375 La/Ce, as shown in
Figure S1. From
Figure S1, it is evident that a high doping concentration results in a significant number of intermediate band gaps. This N-type doping facilitates the excitation of electrons from the intermediate band gap to the conduction band, enhancing the separation of photogenerated carriers. This finding further confirms that the formation of intermediate levels is not solely attributed to the single doping of rare earth or non-metallic elements.
Additionally, at a doping concentration of 0.25, the model exhibits the narrowest band gap, indicating that proper doping of rare earth elements can regulate the band gap width of CaTiO
3 and enhance its visible light absorption and carrier migration. On the other hand, combining rare earth metal elements with non-metals (S) results in a widening of the intermediate band gap with increasing concentration. However, unlike single doping, co-doping causes only a modest increase in the band gap, which may lead to electron-hole recombination issues. Under Ce doping, a high concentration of 0.375 causes the impurity energy level to cross the Fermi level, slightly lowering the bottom of the conduction band, and possibly resulting in half-filled impurity energy band electrons. In contrast, spin-up and spin-down impurity energy levels under a high concentration of La doping appear close to the Fermi level. The impurity levels shift below the Fermi energy level, occupying filled states, which is beneficial for reducing complex centers [
59]. Based on the combination of single doping and co-doping, it can be concluded that a high concentration of Ce and S co-doping causes the intermediate level to cross the Fermi level and leads to a half-filled state, exacerbating electron-hole recombination and subsequently affecting the efficiency of photocatalytic water splitting. To further analyze the distribution of orbital energy levels, the density of states (DOS) of multiple atoms with different orbitals was investigated.
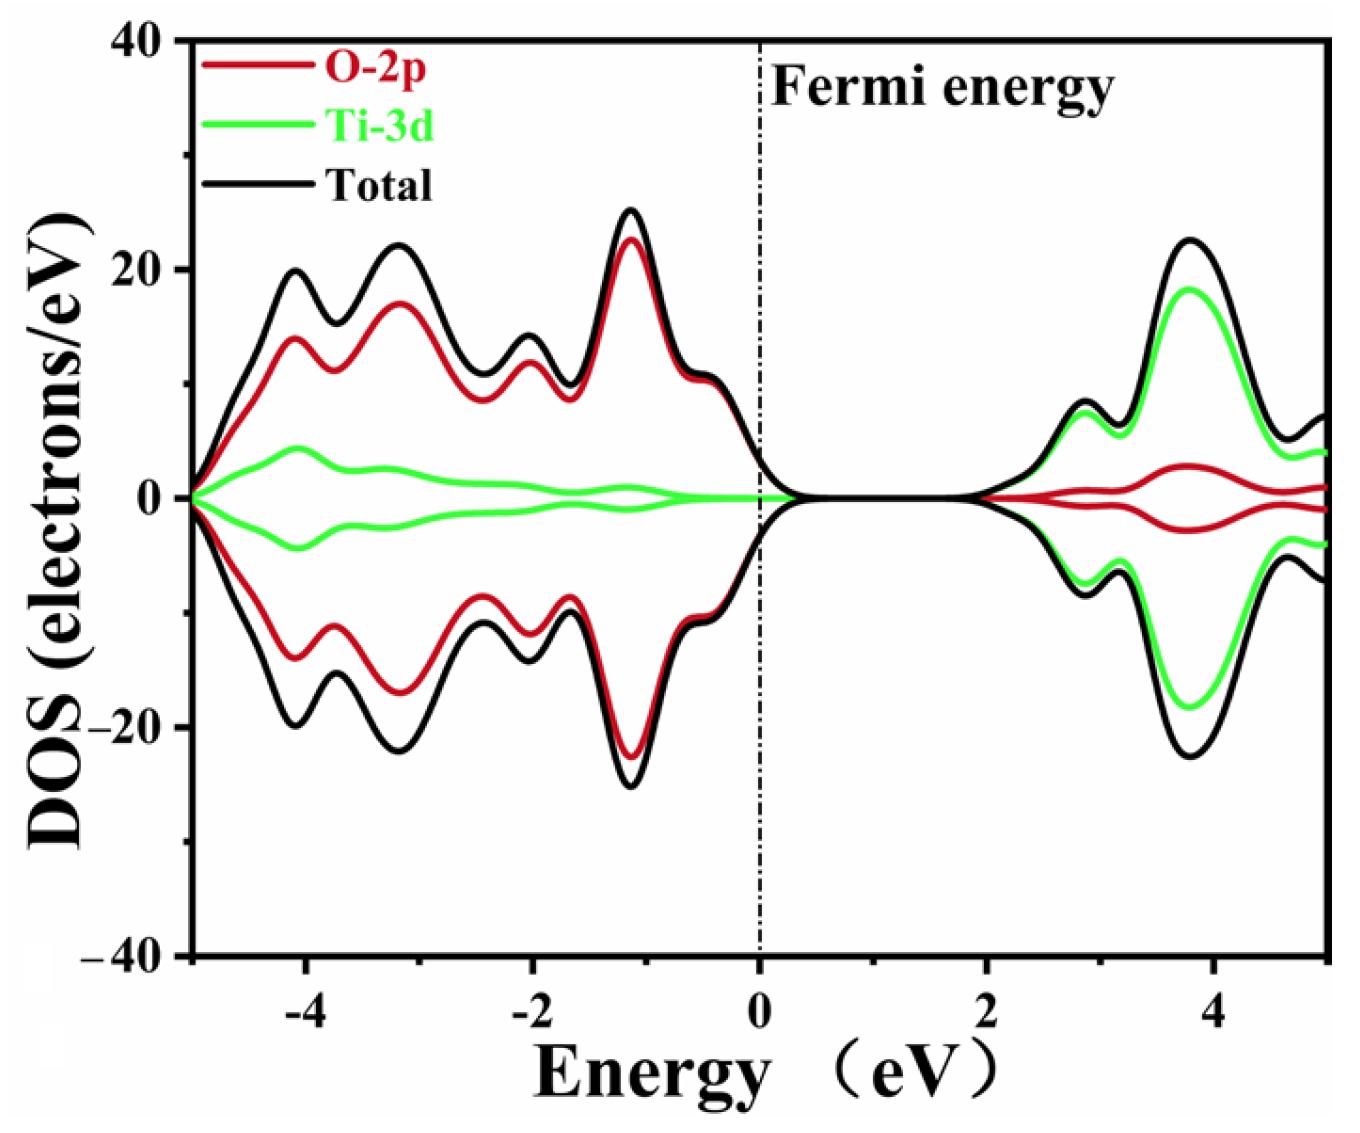
The DOS data of pure CaTiO
3 are depicted in
Figure 4. The Ti 3d and O 2p states composed the conduction band and valence band of pure CaTiO
3, respectively. These data agreed well with the previous simulations [
53,
58]. A minor tail was created at the Fermi level due to the smearing of the calculation settings, without an actual impact.
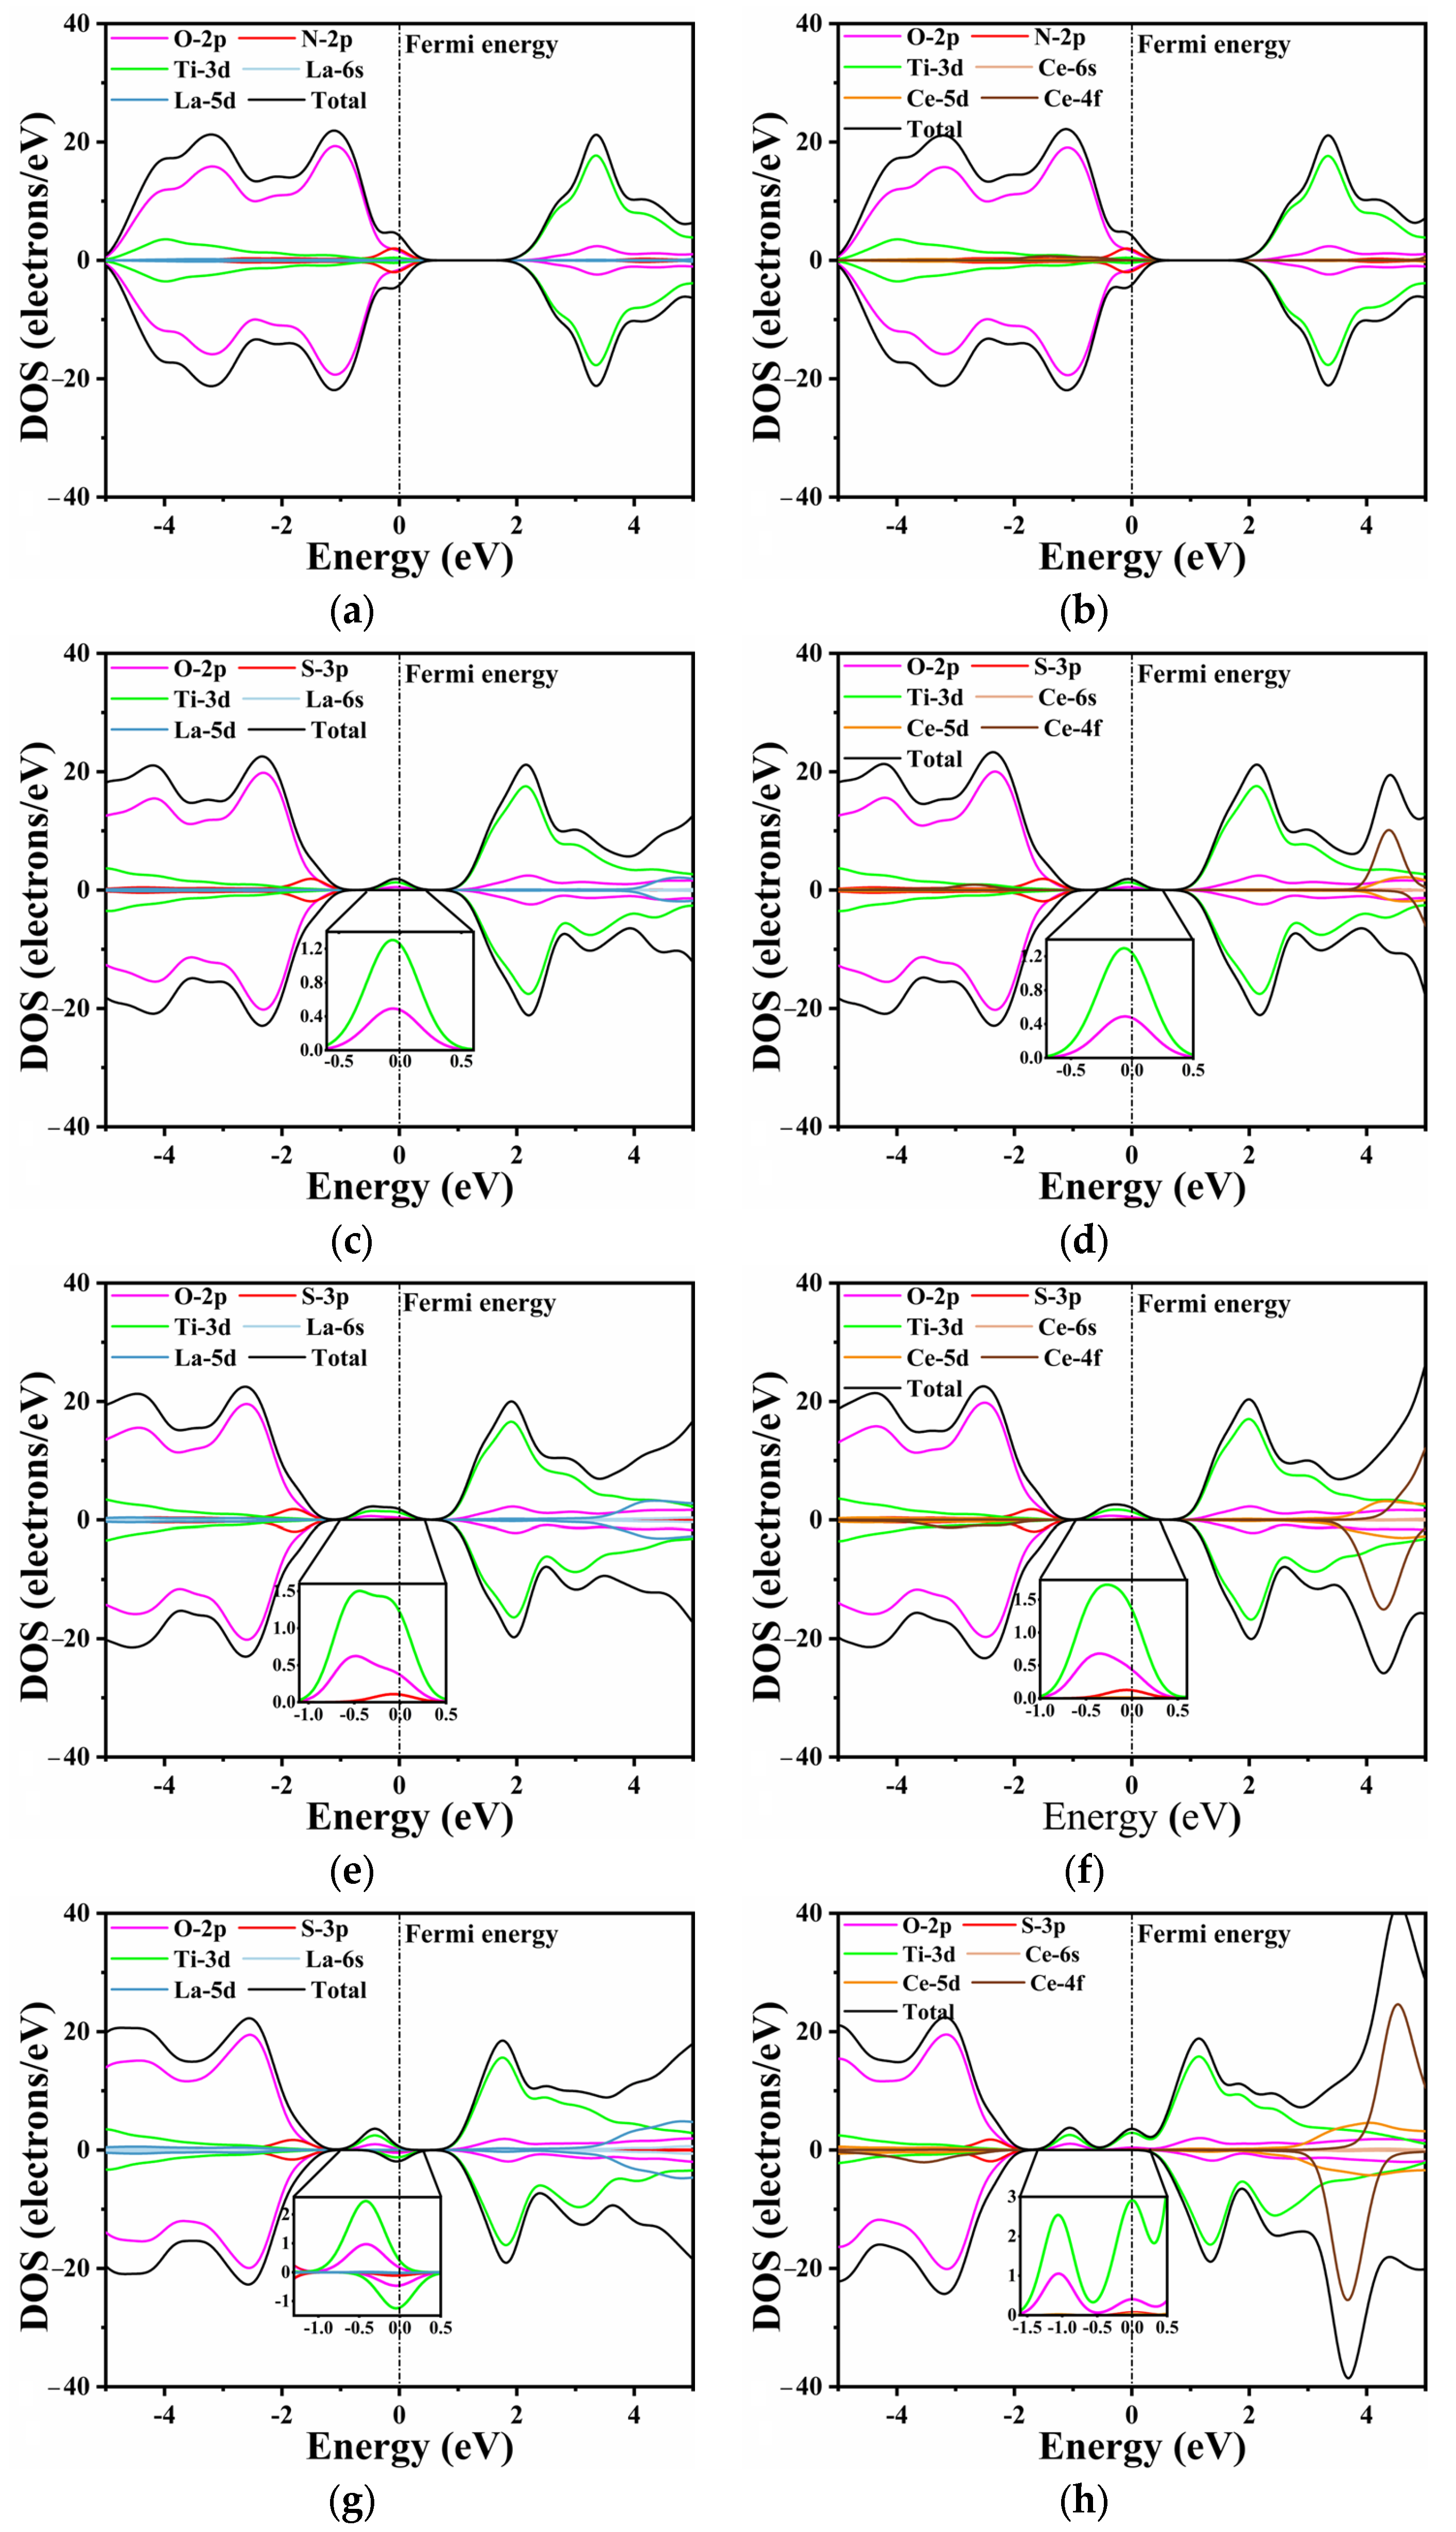
Unlike pure CTO, the introduction of La/Ce and N/S elements influences the band distribution to varying degrees, as shown in
Figure 5. This effect is particularly evident in O 2p states and Ti 3d states. In
Figure 5a,b, the substitutional doping of La and Ce does not exhibit a discernible effect near the Fermi level. The N 2p and O 2p states show a slight hybridization at the top of the valence band, with the O 2p states remaining as the dominant contributors. In
Figure 5c,d, a minor peak is observed at the Fermi level, primarily composed of Ti 3d states and O 2p states, as confirmed by the inset. This indicates that S does not directly contribute to the generation of impurity energy levels during doping, which aligns with the findings in the energy bands.
Furthermore, an increase in the doping concentration of rare earth elements leads to changes in the composition and intensity of impurity energy levels. Similarly to the previous conclusion, higher doping concentrations of La/Ce have a minimal direct impact on the energy band, as the substitutional Ca atoms do not participate in the formation of the conduction and valence bands. However, higher doping concentrations result in impurity levels appearing closer to the Fermi level (
Figure 5e–h). This phenomenon can be attributed to the lattice distortion caused by rare earth and S elements, which in turn influences the Ti 3d states and O 2p states [
60]. A comparable trend is observed in the single doping of rare earth elements, as depicted in
Figure S2. The intermediate band gap near the Fermi level is composed of Ti 3d states and O 2p states, with the predominance of Ti 3d states varying with the doping concentration. Moreover, the increase in impurity levels filled with electrons facilitates the movement of electrons from the valence band to the conduction band, thereby enabling transitions to the bottom of the conduction band at lower energy through the intermediate band. Consequently, this phenomenon holds the potential to enhance the efficiency of photocatalytic water splitting.
When the doping concentration is 0.25, the S 3p state slightly emerges in the component of the impurity level. At a concentration of 0.375, the dominant contribution to the energy level is still accounted for by the O 2p and Ti 3d states. The La/S-doped model depicted in
Figure 5g exhibits both spin-up and spin-down energy levels. The magnetic moment analysis indicates that the magnetic moments of all co-doped models near the Fermi level are predominantly contributed by Ti, which aligns with the PDOS results. In contrast, Ce doping results in a partial magnetic moment, with the total magnetic moment of the model reaching a maximum value of 7 μ
b at a concentration of 0.375. The impurity energy level crosses the Fermi energy level, resulting in a no longer full band energy level [
47].
Consequently, this significantly reduces the light absorption capacity and promotes the formation of recombination centers. Combining the band structure and PDOS analysis, it can be concluded that the introduction of impurity energy levels into the model through co-doping facilitates the migration of photogenerated carriers and improves catalytic activity. With the increasing La/Ce doping concentration, the impurity level also increases; however, the Ce-doped impurity level no longer constitutes a full-electrical band [
59].
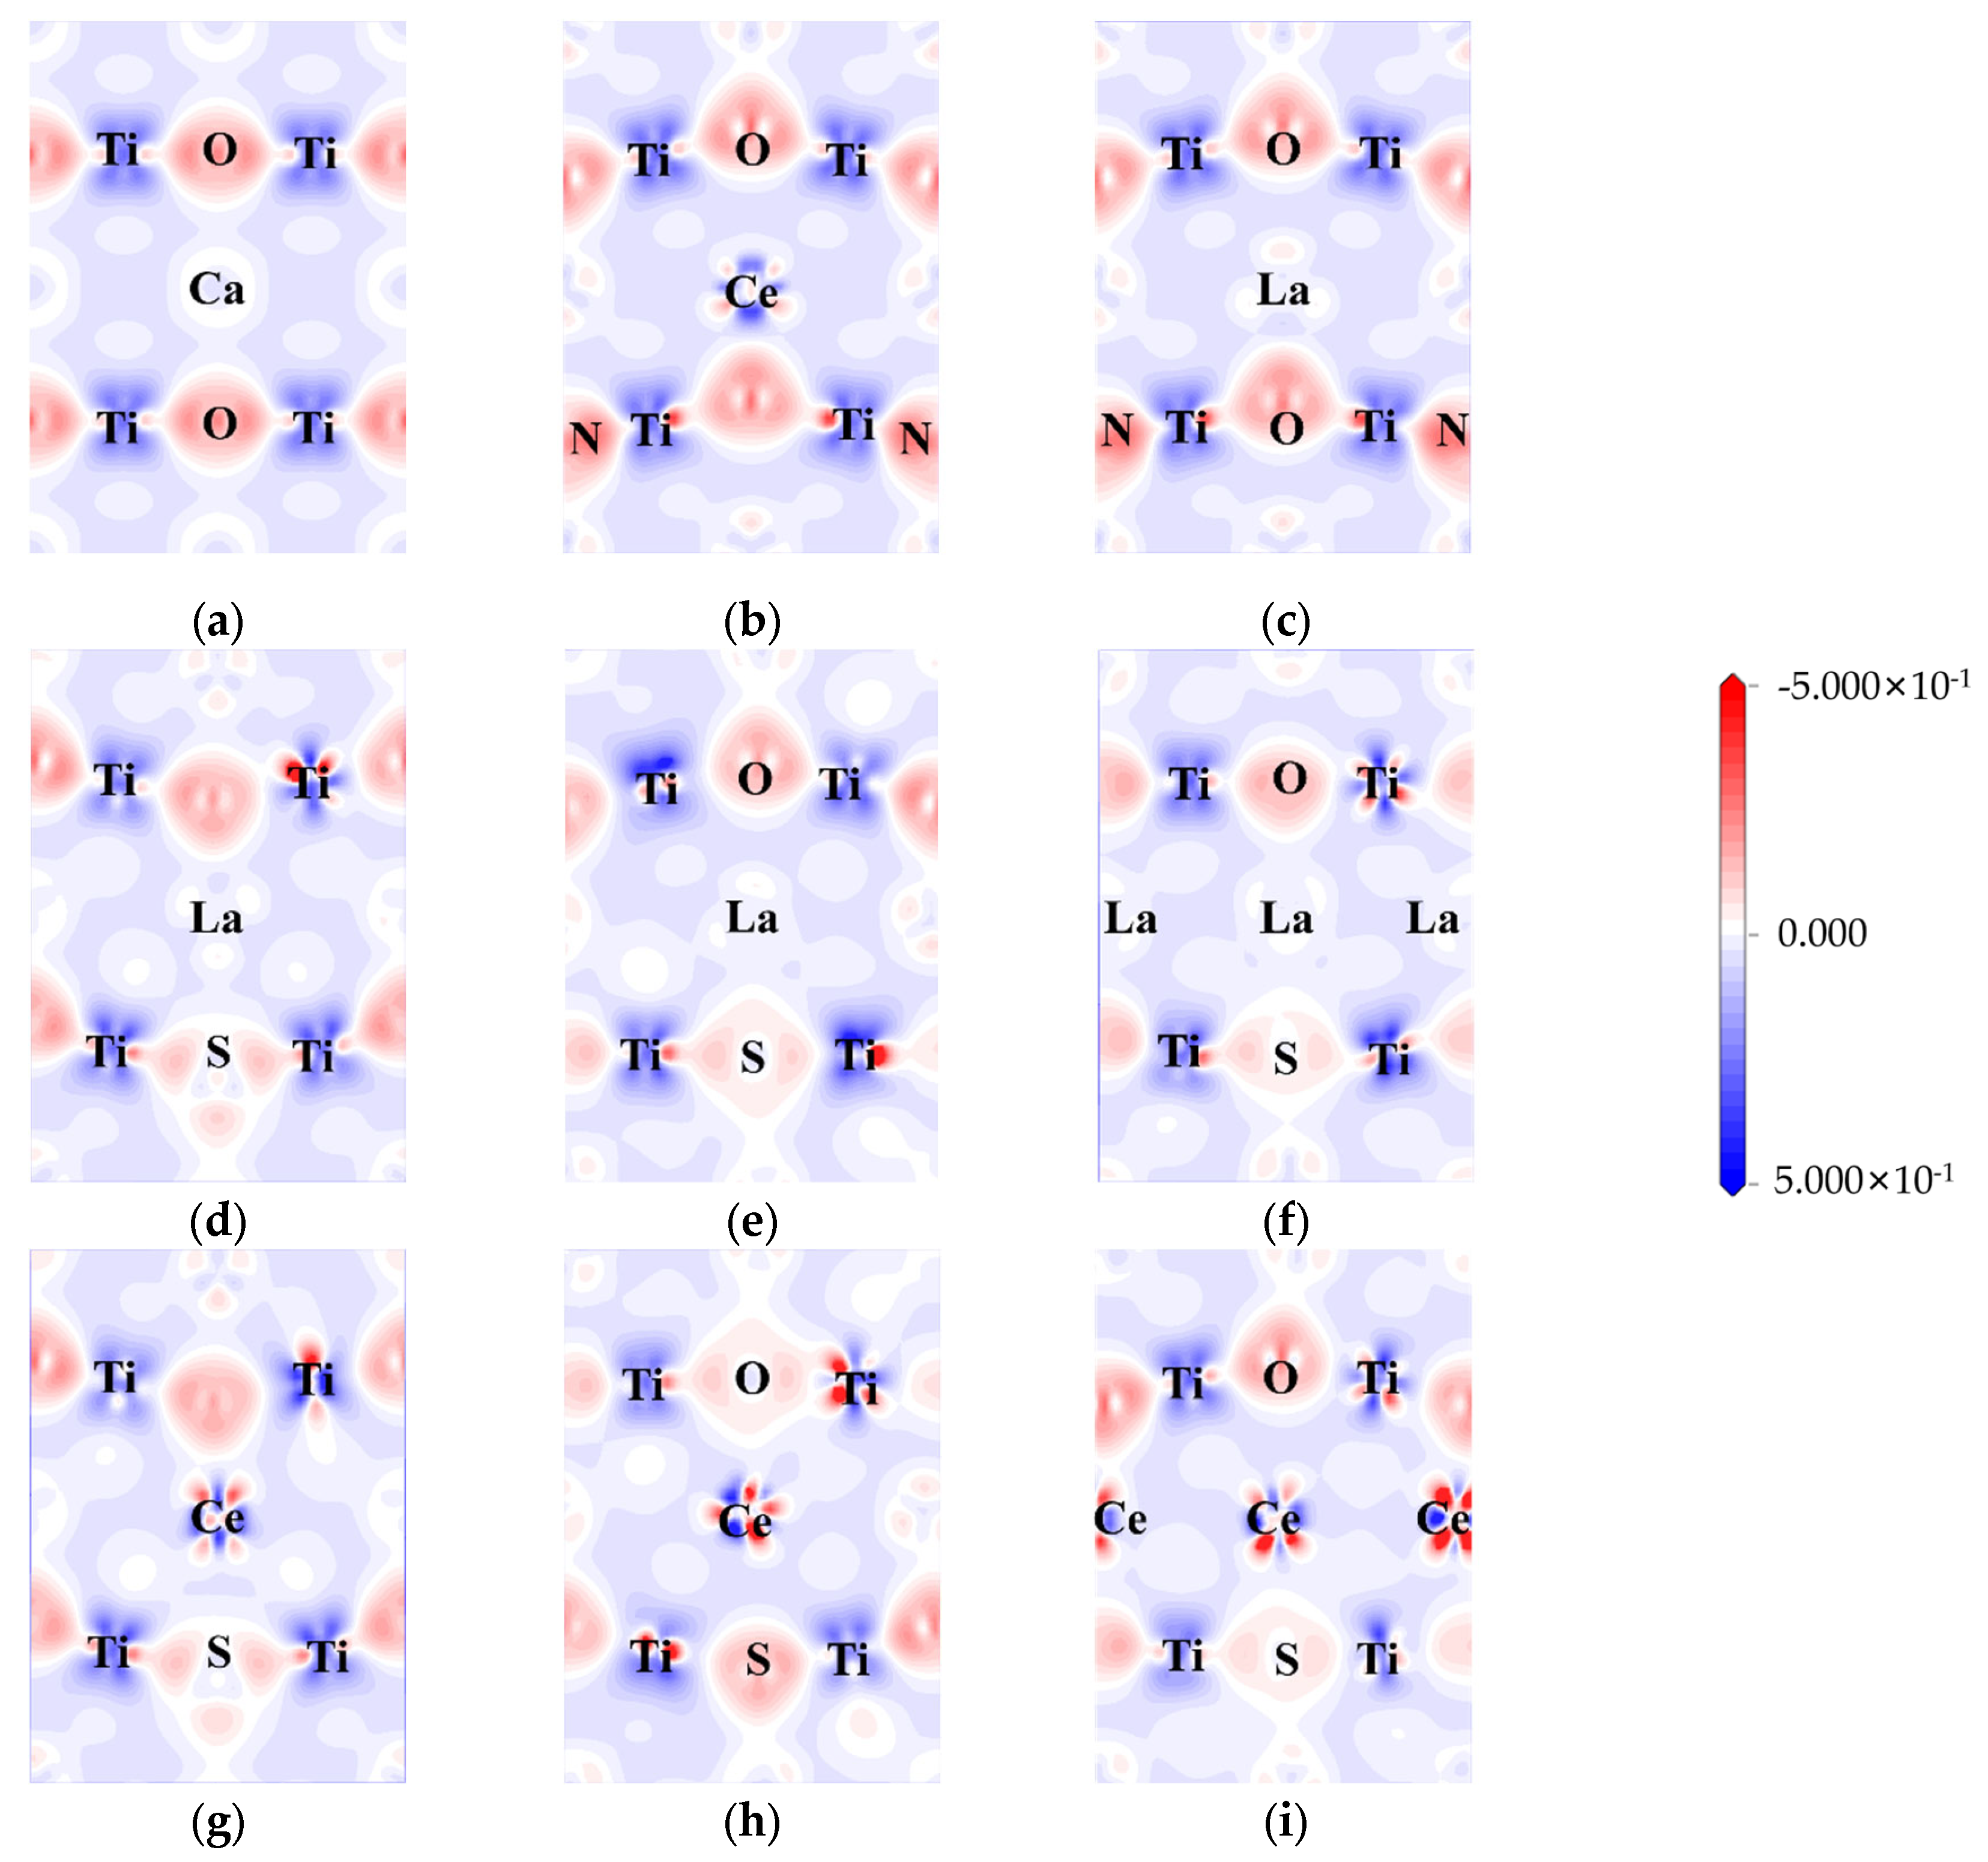
The electron density differences were calculated to explore the influence of doping on charge transfer and interaction. The difference in electron density between pure CTO, co-doped perovskite, and heavily doped perovskite is represented in
Figure 6.
Here, the (0, −1, 1) crystal plane is utilized to demonstrate the charge transfer of doping elements in greater detail. In the CTO crystal lattice, there is a significant charge density between Ti and O, indicating a strong interaction between Ti and O. On the other hand, the interaction between Ca and O appears to be less pronounced, suggesting a weaker contact between Ca and O. The bonding between Ca and O tends to be ionic, while the Ti-O bonds exhibit more covalent characteristics [
8]. In the case of N doping (
Figure 6b,c), noticeable covalent bonding features are displayed. This can be attributed to the hybridization between the N 2p and O 2p states, resulting in the formation of the top of the valence band as observed in the above calculations.
Similar to N-doping, S-doping also leads to the formation of covalent bonds to a certain extent. However, due to the lower electronegativity of S compared to O and N, the bonding effect is diminished, resulting in minimal hybridization between the S 3p state and the O 2p state at the top of the valence band. La/Ce doping yields two distinct outcomes. In the case of Ce doping, there is a higher electron concentration around Ce, causing electrons around O to be closer to the Ce atom regardless of the changes in doping concentration [
51]. On the other hand, La doping did not participate in the transfer of electrons. As illustrated in
Figure 6d–i, both rare earth elements and co-doping affect the aggregation of electrons around Ti, indirectly influencing the energy level changes in the model. The Ti 3d state predominantly contributes to the generation of impurity energy levels at the center of the band gap, consistent with
Figure 5c–h.
We also conducted a comprehensive Bader charge analysis [
61] on all models in order to determine an atom’s charge state quantitatively by comparing its calculated charge with its own valence charge (
Table 4,
Tables S1–S3 and Figure S5). In the pristine model, the results align well with the electron density difference shown in
Figure 6, where Ca and Ti exhibit electron loss, establishing ionic and covalent bonds with O. The addition of S to the O site in the LCOS1-0.25 model results in Ti distortion due to its lower electronegativity and larger atomic size. Ti atoms adjacent to S atoms exhibit varying degrees of electron loss as compared to pure CTO. Despite the fact that this distortion affects the charge transfer process between neighboring atoms, it remains relatively stable. Similarly, in the pristine CTO model, electrons appear to be uniformly distributed at each type of atom. The average Bader net atomic charge for Ca, O, and Ti is 1.33, −1.04, and 1.80, respectively. The Bader net charge distribution is significantly imbalanced following the introduction of 0.25 concentrations of La and S doping, with that of Ca, O, and Ti varying from 0.48 to 1.47, −1.52 to −0.25, and 1.47 to 1.90, respectively. In addition, the average Bader net atomic charge for Ca and Ti decreases to 0.90 and 1.70, respectively, while the average Bader net atomic charge for O increases to −0.92. This non-uniform charge distribution leads to structural distortions within the model, which can potentially result in the formation of impurity levels [
62]. Our findings are in line with our earlier calculations, which indicated that La and S co-doping resulted in impurity energy levels below the Fermi level. These impurity energy levels act as energy steps within the band gap, facilitating the transition of photogenerated carriers.
It should be noted that Bader net atomic charges for S-doped sites are considerably lower than those for O-doped sites, which confirms that hybridization is limited for their contributions to VBM and impurity levels [
63]. This is consistent with our DOS analysis in
Figure 5 and the electron density difference in
Figure 6. Consequently, the co-doped model alters the electron density around Ti as the concentration of rare earth elements increases, and higher concentrations of La have little effect on the lattice, thus promoting the stability and photocatalytic efficiency of the CaTiO
3 perovskite.
2.4. Effective Masses of Charge Carriers
Light excitation below the Fermi level results in the generation of excited electrons at the bottom of the conduction band and holes at the top of the valence band, which are crucial for desired chemical processes. To determine whether doping affects the separation of electrons and holes, many works have focused on the mobility of photogenerated carriers. However, accurately calculating their mobility is challenging as it requires considering various scattering mechanisms, including intrinsic factors like electron-phonon scattering and extrinsic factors like impurity scattering [
64]. Hence, estimating the effective mass of electrons and holes can offer valuable insights into the migration of photogenerated carriers.
When electrons and holes possess a low effective mass, they exhibit greater activity in their excited state and can more swiftly migrate to active sites [
65]. To explore the transfer properties of photogenerated carriers, the effective masses of electrons (m
e*) and holes (m
h*) in pure CaTiO
3, La/Ce-doped CaTiO
3, and (La/Ce + N/S)-codopedCaTiO
3 were estimated by performing a parabolic fit to the CBM and VBM using the following equation [
41,
66].
where
m* represents the effective masses of carriers,
ħ is the Planck constant and d
2E/d
k2 is the coefficient fitting the second-order term of the E(
k) curve for the base of the conduction band and the top of the valence band. The effective masses of electrons and holes, determined along the most dispersive direction in the Brillouin zone, and their corresponding k-paths are provided in
Table 4. It should be noted that the CCOS1-0.375 model could not be calculated due to its half-filled intermediate band (IB) crossing the Fermi level, resulting in the semiconductor transitioning into a conductor. As presented in
Table 5, the computed effective masses of electrons and holes in pure CTO are 0.069 m
e and 0.084 m
e, respectively. Notably, the electron in the conduction band exhibits a smaller effective mass compared to the hole in the valence band. Upon single doping with varying proportions of rare earth elements, it becomes evident that the masses of electrons and holes at a concentration of 0.25 are considerably smaller than those at a concentration of 0.375. This indicates enhanced mobility of electrons and holes, facilitating the rapid movement of carriers to the catalytic surface during the photoexcitation process.
Moreover, similar observations can be made regarding the intermediate band. Since the intermediate band gap is fully occupied below the Fermi level, its likelihood of acting as a recombination center is substantially reduced. Nevertheless, the effective mass of carriers within the intermediate band also plays a crucial role in determining photocatalytic efficiency. As the intermediate band gap serves as a “springboard”, it is essential for electrons to possess high mobility to enable swift transitions into the conduction band. Additionally, when both rare earth and non-metallic elements are doped, the effective mass of electron-hole pairs increases, particularly in the case of S doping. This can be attributed to the dominance of the O/S state, which is susceptible to disorder at the chalcogen site at the top of the valence band [
64]. Notably, when the concentration of rare earth elements is raised to 0.25, the effective mass of electrons and intermediate band holes decreases. For instance, the effective mass of electrons and intermediate band carriers in the LCOS1-0.25 model are 0.050 m
e and 0.087 m
e, respectively. These findings align with the conclusions drawn from the single doping of rare earth elements. Co-doping rare earth and non-metal elements at a concentration of 0.25 promotes the mobility of photogenerated carriers, thus enhancing photocatalytic efficiency.
2.5. Optical Properties and Water Redox Potential
The photocatalytic properties of materials are greatly influenced by their optical absorption range. Therefore, the optical absorption spectra of different models, including pure CaTiO
3 and co-doped variants with various mass fractions, were examined. To assess the light absorption properties, the dielectric function was converted into a bit-light absorption coefficient using Equation (5) [
67].
where
ω represents the phonon angular frequency, and ε
1(
ω) and ε
2(
ω) are the real and imaginary parts of the complex of dielectric constants, respectively. Furthermore, the imaginary part characterizes light absorption capability, while the real part signifies electron excitation energy. Despite employing the GGA+U method for electronic structure correction, it does not impact systematic bandgap width investigation. Consequently, underestimating the bandgap leads to significant errors in optical property predictions during light absorption.
To address this, we adopted the “scissors” operator, a widely recognized strategy for rectifying such inaccuracies [
34]. In this calculation, the scissors operator was set at 1.3 eV, determined by the Band Gap Correction method, which is a commonly used method for calculating the value of the scissors operator by contrasting experimental and theoretical bandgap values, thereby increasing prediction accuracy for the optical property. To be more precise, the value of the scissors operator is obtained by subtracting the experimental value (~3.5 eV) [
68,
69,
70] from its theoretical value (2.2 eV). The calculated optical absorption curves are provided in
Figure 7 and
Figure S3. The modified absorption range of pure CTO correlated well with previous experiments [
37,
71]. Moreover, the fact that pure CTO can only absorb ultraviolet light within a narrow range severely limits the photocatalytic activity.
Moreover, we can analyze the differences in light absorption of different doping models in conjunction with the electron density difference in
Figure 6 and the effective mass of electrons and holes in
Table 4. As a result of the hybridization between the O 2p and Ti 3d states [
72], the bonding between Ca and [TiO
6] can be described as ionic, whereas the bonding between Ti and O can be described as covalent. This is also in accord with our calculated PDOS results. In the presence of increased doping concentrations, the charge transfer at Ti atoms undergoes significant changes, resulting in distortions of the crystal structure as well as conversions between [TiO
6] and [TiO
5] [
73]. The band gap and the edges of the light absorption spectrum may be affected by these changes [
74]. These results can be attributed to electron excitations and transitions [
75], where electrons move from the valence band to the impurity energy levels and then subsequently to the conduction band of CaTiO
3, which also aligns well with our earlier calculations. The impurity energy levels occur for those co-doping models with 0.25 concentration, along with a more substantial reduction in the band gap and the lowest electron-hole effective mass. A leftward shift of the light absorption peak can be observed as the doping concentration increases.
Figure 7 illustrates that the introduction of a single rare earth element through doping substantially enhanced the visible light absorption range of CTO. At a concentration approaching 0.25, the strongest visible light absorption peak (464 nm), corresponding to the smallest band gap value, was observed. This shift is primarily due to the increased band gap and the introduction of more intermediate band gap states by La/Ce [
76]. Consequently, electrons tend to be more localized at the impurity levels, impeding the material’s light absorption properties.
In the low-wavelength phase (150–300 nm), as shown in
Figure S4a, we can clearly observe a decreasing trend in light absorption within our model framework, whereas pure CTO exhibits an increase at around 200 nm [
77]. Conversely, in the high-wavelength stage (700–900 nm), the absorption spectrum of pristine CTO is entirely absent [
78]. In spite of the gradual decrease in absorption intensity, the rare earth doping model at 0.25 concentration still maintains its light absorption capability. The above statement provides valuable theoretical guidance regarding the study of light absorption at various doping concentrations of rare elements in CTO perovskite.
Further, the light absorption edge of CCOS1-0.375 was extended to 800 nm, due to its crystal structure distortions caused by high doping concentrations. The strong optical absorption in this region is primarily due to the transition of electrons from the valence band to the conduction band of the models. As predicted by our previous calculations, the high-concentration model showed an increased presence of impurity levels and a comparatively smaller band gap. However, impurity energy levels intersecting the Fermi level would act as recombination centers for photogenerated carriers, thereby reducing its photocatalytic efficiency. In spite of the substantial expansion of the light absorption range at high concentrations, the large electron-hole mass and the fully occupied impurity levels below the Fermi level continue to restrain the photocatalytic performance of the model.
As compared to pure and low-concentration systems, the photoabsorption spectrum of highly concentrated doped CaTiO
3 exhibits a noticeable redshift, with new absorption peaks at 406 nm for LCOS1-0.375. It’s worth noting that the robust optical absorption in the visible region primarily arises from electron transitions from their VBM to CBM [
75]. As previously calculated, the high-concentration model showed an increase in impurity levels and a comparatively reduced band gap. The results were attributed to the emergence of full-filled impurity levels below the Fermi level, which allowed more electrons to be excited to the conduction band. Despite the minor enhancement in light absorption intensity, similar to single doping, we contend that the LCOS1-0.25 model is more effective at absorbing and transporting visible light-excited electrons to the sample surface due to its band gap and electron-hole mass analysis as previously discussed. Although the visible light absorption intensity of co-doping was lower than that of single doping, it is much higher than that of pure CTO, thereby improving the photocatalytic efficiency.
The position of the semiconductor band edge is a crucial signal for determining the water-splitting capability and performance of semiconductor photocatalysts. This factor is necessary for CBM of the semiconductor photocatalysts to become more negative than the reduction potential of H
+/H
2 (0 eV vs. normal hydrogen electrode (NHE)), as well as for VBM to become more positive than the oxidation potential of O
2/H
2O (1.23 eV) [
26]. Therefore, by correcting the scissors operator, the CBM and VBM were calculated empirically according to Equation (6) [
60]:
where
represents the bottom level of the conduction band,
X is the absolute electronegativity of the perovskite oxide catalyst,
refers to the corrected band gap, and
is the energy of free electrons on the hydrogen scale (4.5 eV). Further calculations for the VBM can be performed using the corrected band gap and CBM from Equation (5). The obtained data are visualized in
Figure 8.
As depicted in
Figure 8, photoexcitation caused electrons to transition from the valence band to the conduction band, and the presence of impurity levels reduced the transition energy, which is advantageous for enhancing photocatalytic performance. Furthermore, the VBM and CBM positions of calcium titanate (CTO) spanned the water redox potential level, meeting the thermodynamic requirements for hydrogen synthesis in sunlight-driven water splitting. However, a wide bandgap of 3.50 eV hindered the movement of photogenerated carriers in pure CTO. In the case of single doping, the system exhibited energy bands and visible light absorption intensity that satisfied the requirements of the hydrolyzed band edge, particularly at a concentration of 0.25. However, the presence of impurity levels at this concentration may act as carrier recombination centers. The calculation of the effective mass of electrons and holes indicated that LCTO-0.25 exhibited high mobility.
In contrast to N doping, co-doping of S and rare earth elements introduced impurity energy levels that fulfilled the water redox potential with a smaller band gap, corresponding to the previously estimated energy band and DOS (
Figure S3). This phenomenon can be attributed to the presence of impurity bands at the Fermi level originating from the Ti 3d and O 2p states, where Ti attracted more electrons based on charge density analysis. Furthermore, with an increase in the concentration of rare earth doping, the bandgap initially decreased and then increased. LCOS1-0.375 exhibited better performance in the visible light spectrum due to its VBM being closer to the water splitting potential and having a higher density of impurity levels compared to the narrowest bandgap observed with a La doping ratio of 0.25 (estimated to be 2.26 eV). For Ce doping, the bandgap was also significantly reduced by high-concentration doping, reaching 2.37 eV at a doping concentration of 0.25. However, further increasing the doping concentration seemed to impact the semiconductor properties (
Figure 6). More electrons surrounded Ce, potentially affecting the photocatalytic performance.
Regarding the co-doped system, the energy required for the transition from the valence band to the impurity level was lower, facilitating electron transition. Considering the effective mass of the photogenerated carrier, LCOS1-0.25 exhibited higher carrier mobility and satisfied the minimum hydrolyzed band edge energy, thereby improving the photocatalytic efficiency of CTO. Therefore, the co-doping of La/Ce and S effectively narrowed the bandgap and adjusted the positions of the VBM and CBM by introducing impurity levels. Notably, with increasing La doping proportion, La/S enhanced the photocatalytic performance of CaTiO
3 photocatalysts, aligning with the conclusions drawn from single doping. Combining the energy bands, carrier mobility, and visible light absorption, LCTO-0.25 and LCOS1-0.25 exhibited the strongest photocatalytic performances. According to the calculations in
Table 6, a systematic comparison of different doping strategies on photocatalytic properties of different perovskite-based photocatalysts was listed. Despite having a reduced band gap and an extended visible light absorption range, Pd-doped models still suffer from recombination of photogenerated carriers owing to a relatively smaller effective mass for electrons and holes compared to the La-S co-doped model. Furthermore, the simultaneous introduction of La and S into CaTiO
3 created more intermixed impurity energy levels within the band gap, which has also increased its photocatalytic effectiveness. The systematic theoretical analysis of the different doping strategies summarized in
Table 6 offers valuable insight into future research on CTO perovskites, particularly in terms of assessing their overall photocatalytic performance.

 ,
, 


