Abstract
Efficient compositions for the selective detection of ethanol gas and the removal of organic contaminants were realized by codoping of (Gd, Nb) and (Gd, Mo) ions into TiO2. TiO2, Ti0.96Gd0.01Nb0.03O2, and Ti0.96Gd0.01Mo0.03O2 samples were prepared by a coprecipitation method. For all compositions, a crystalline anatase phase of TiO2 was detected. Compared to pure TiO2, the absorption edges of Ti0.96Gd0.01Nb0.03O2 and Ti0.96Gd0.01Mo0.03O2 samples were red-shifted, further broadening towards visible light. The morphological studies demonstrate that the grains of TiO2 were more refined after (Gd, Nb) and (Gd, Mo) codoping. The photocatalytic efficiency of the Ti0.96Gd0.01Mo0.03O2 catalyst for degrading 20 mg/L reactive yellow 145, brilliant green, and amoxicillin was 98, 95, and 93% in 90 min, respectively. The reusability experiments indicate that the Ti0.96Gd0.01Mo0.03O2 catalyst had high stability during reuse. The high photocatalytic activity of the Ti0.96Gd0.01Mo0.03O2 catalyst was correlated to the broad visible-light absorption and effective separation of electron–hole pairs by Gd3+ and Mo6+ cations. The gas sensing characteristic is reflected by the high sensitivity of the Ti0.96Gd0.01Nb0.03O2 sensor to ethanol gas in the presence of different gases at 275 °C. The obtained results indicated that the (Gd, Mo) mixture could more effectively induce the photocatalytic properties of TiO2 while (Gd, Nb) dopants were the best for reinforcing its sensing characteristics.
1. Introduction
In recent years, the monitoring of harmful gases and the treatment of waste organic dyes and antibiotics compounds by green sustainable techniques have emerged as important issues for the scientific community [1,2,3,4]. Organic dyes are compounds used to color a substrate like cloth, leather, paper, plastic, wool, polymers, nylon, and many others [5]. Technically, organic dyes improve the visual value of these products, which has broadened their use in almost all basic products. Unfortunately, colored organic dyes have strong adverse effects on the environment and human, animals, birds, plants, and aquatic life, even at low concentrations [5,6]. These colored organic dyes are soluble in water and many other organic solvents, chemically stable, and non-biodegradable; in addition, they are biologically active with carcinogenic and mutagenic characteristics [5,6,7]. Every year, 7 × 10⁵ tons of organic dyes are produced and nearly 200,000 tons of them, as textile dyes, are lost annually in effluent as wastewater [8]. Additionally, the remaining antibiotic pollutants in the aquatic system area a dangerous health issue owing to the emergence of antibiotic-resistant bacteria and their disruption of environmental stability [9].
Photocatalysis based on sunlight energy is a promising and green approach to eliminating these pollutants and realizing a clean and health environment [10,11]. Solar energy contains approximately 52% infrared (700–2500 nm), 43% visible light (400–700 nm), and 5% ultraviolet (280–400 nm) radiation [12]. The photocatalytic degradation of organic contaminants has many benefits over traditional techniques, including less energy consumption, better reusability, economic potential, and the non-harmful products [13]. There is a great demand for innovative, operative, inexpensive, and wide-responsive photocatalysts for wastewater treatment [14,15]. Numerous metal oxides, such as TiO2 [16], ZnO [17], CuO [18], and SnO2 [19], have been investigated for the photocatalytic degradation of organic pollutants. Among these metal oxides, titanium dioxide (TiO2) has emerged as a potential photocatalyst for degradation of various organic dyes [20,21]. Enhancing the photocatalytic properties of the TiO2 semiconductor is mainly achieved through two points: reducing the recombination of the charge carriers and prolonging its absorption in the visible light spectrum [22,23]. Many strategies have been used for this purpose: nanocomposite or heterostructures formation [23], doping [22], and codoping [24]. Chobba et al. [25] studied the photocatalytic activity of Gd-doped TiO2 for 25 mg/L methylene blue degradation under UV and visible light radiation. They found that 1% Gd-doped TiO2 has a degradation efficiency of 80% but only after 5 h of UV irradiation. Gd-doped TiO2 nanotubes displayed a photocatalytic activity of 95.8% for methyl orange (MO) dye in an irradiation time of 120 min [26]. Xu et al. [27] reported that Gd-doped TiO2 catalyst synthesized by the sol–gel method had a photodegradation efficiency of 65.6% and 54.2% for Reactive Brilliant Red X-3B and rhodamine B after an irradiation time of 80 min, respectively. Under UV irradiation, 0.5% Gd-doped TiO2 catalyst (hydrothermal route) exhibited a photodegradation activity of 92% for Acriflavine dye after 120 min [28]. Thus, using the sunlight as a source of radiation to increase the photocatalytic efficiency as well as reduce the reaction time is highly required for practical applications.
The detection, discrimination, controlling, and measuring of different types of gases are very important in numerous fields, such as food industry production [29], medical diagnosis applications [30], chemical warfare [31], detection of explosive, toxic, and flammable compounds [32,33,34], and traffic accidents [35]. Various industries and laboratories activities release many volatile organic compounds (VOCs), like acetone, butanol, ethanol, benzene, methanol, propanol, xylene, and toluene, to the environment and these gases are dangerous to human health and can cause deaths [36,37]. Among the volatile organic compounds (VOCs), ethanol is one of the vital industrial chemical reagents owing to its regular use in numerous areas such as alcoholic beverages, cosmetics, pharmaceuticals, food, paints, and chemical products [38,39]. The direct and constant contact with ethanol vapor, especially at high concentrations, can prompt the irritation of the mucous membranes, nose, and eyes, and can lead to nausea, headaches, and vertigo [39]. Moreover, many traffic accidents can be correlated to the high consumption of alcoholic beverages before driving [40]. As a result, the design of low-cost ethanol gas sensors with effective and selective performance is a critical issue. In recent decades, several kinds of ethanol gas sensors have been studied, like resistive sensors [41] and surface acoustic wave sensors [42]. Metal oxides semiconductors such as ZnO, SnO2, and TiO2 have garnered much interest as resistive gas sensing materials due to their low cost, easy synthesis, high sensitivity, and simplicity of use. Nechita et al. [43] investigated the gas sensing properties of Nb-doped TiO2 porous thin films for ethanol and methanol detection and found that the maximum sensitivity was realized at 367 °C. W/TiO2 thin films synthesized by a modified sol–gel technique displayed a high sensitivity to ethanol gas at 350 °C [44]. Phanichphant et al. [45] reported that flame-generated Nb-Doped TiO2 had a high sensitivity to ethanol gas at an operating temperature of 400 °C.
Based on our search, there is no available work on the impact of (Gd, Nb) and (Gd, Mo) codoping on the photodegradation of TiO2 for reactive yellow 145, brilliant green, and amoxicillin contaminants, as well as for sensing volatile organic compounds. Gd, Nb, and Mo dopants have an electronic configuration including d- and f-orbitals, and can also adopt variable oxidation states that can improve the optical, photocatalytic, and sensing properties of TiO2. In this study, new compositions composed of Ti0.96Gd0.01Nb0.03O2 and Ti0.96Gd0.01Mo0.03O2 plus pure TiO2 were synthesized for the depollution of reactive yellow 145, brilliant green, and amoxicillin contaminants under visible light irradiation. These samples were also tested for selective detection of ethanol gas.
2. Results and Discussion
2.1. X-ray Diffraction (XRD)
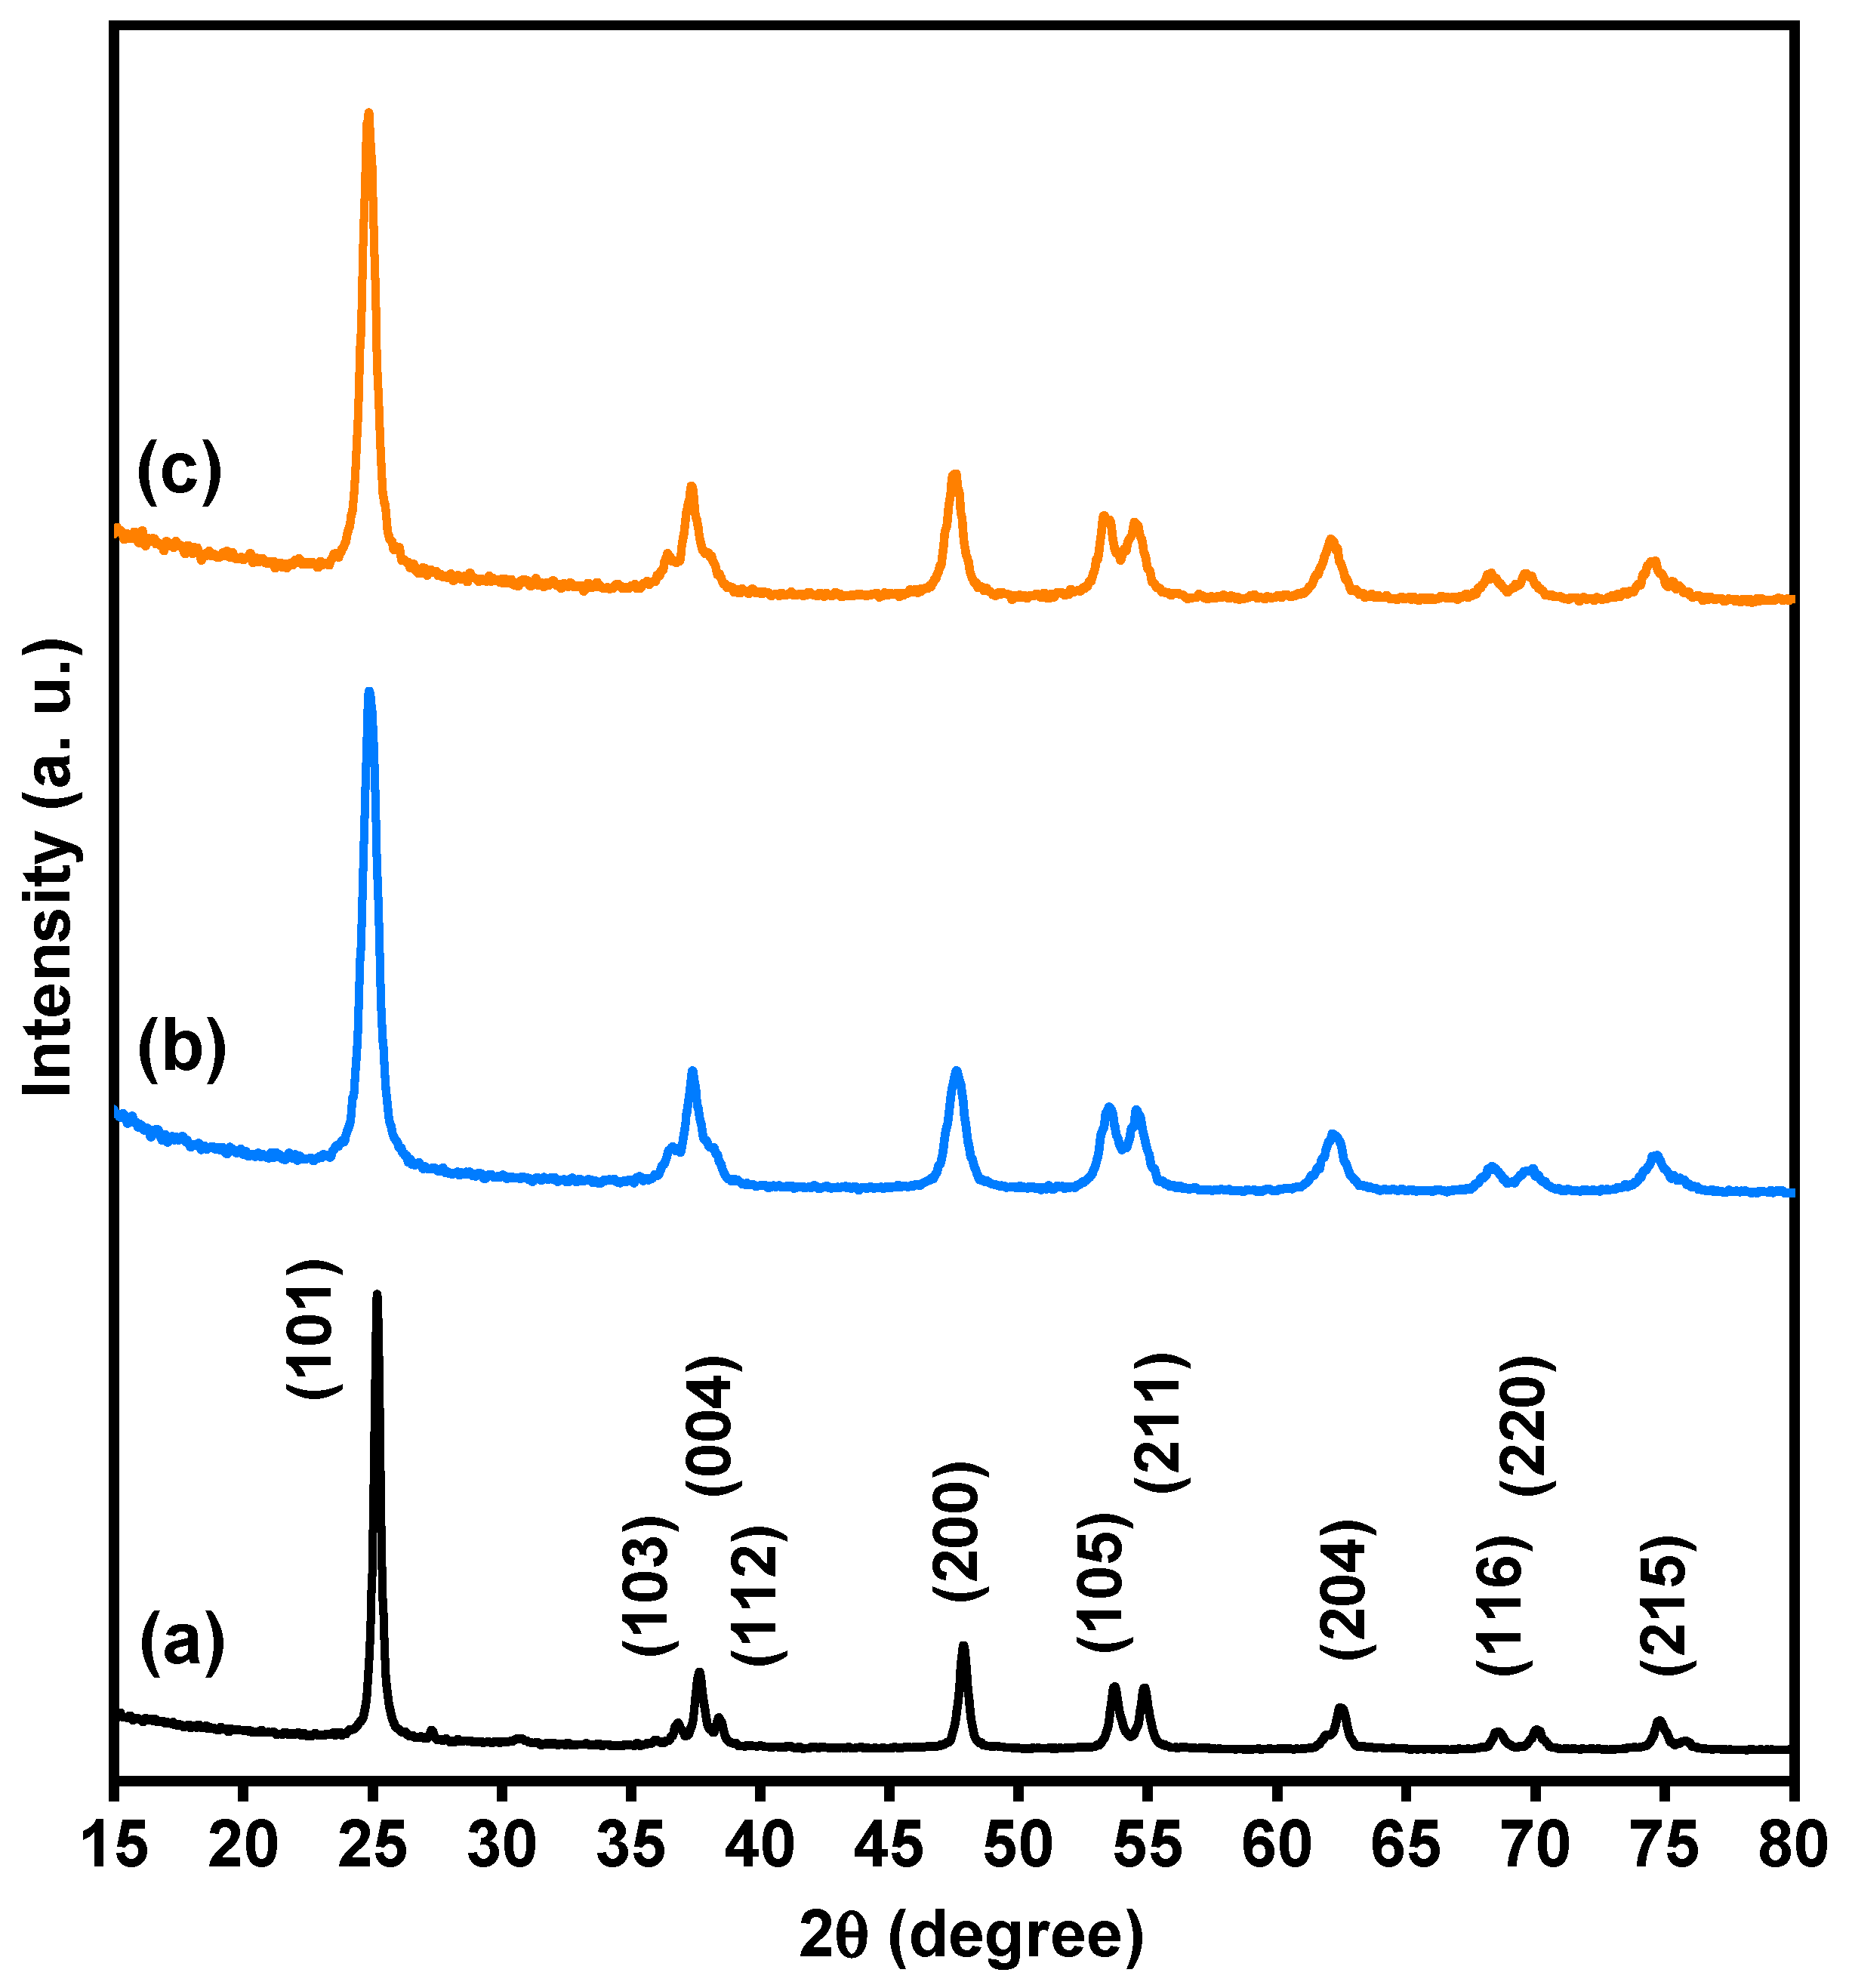
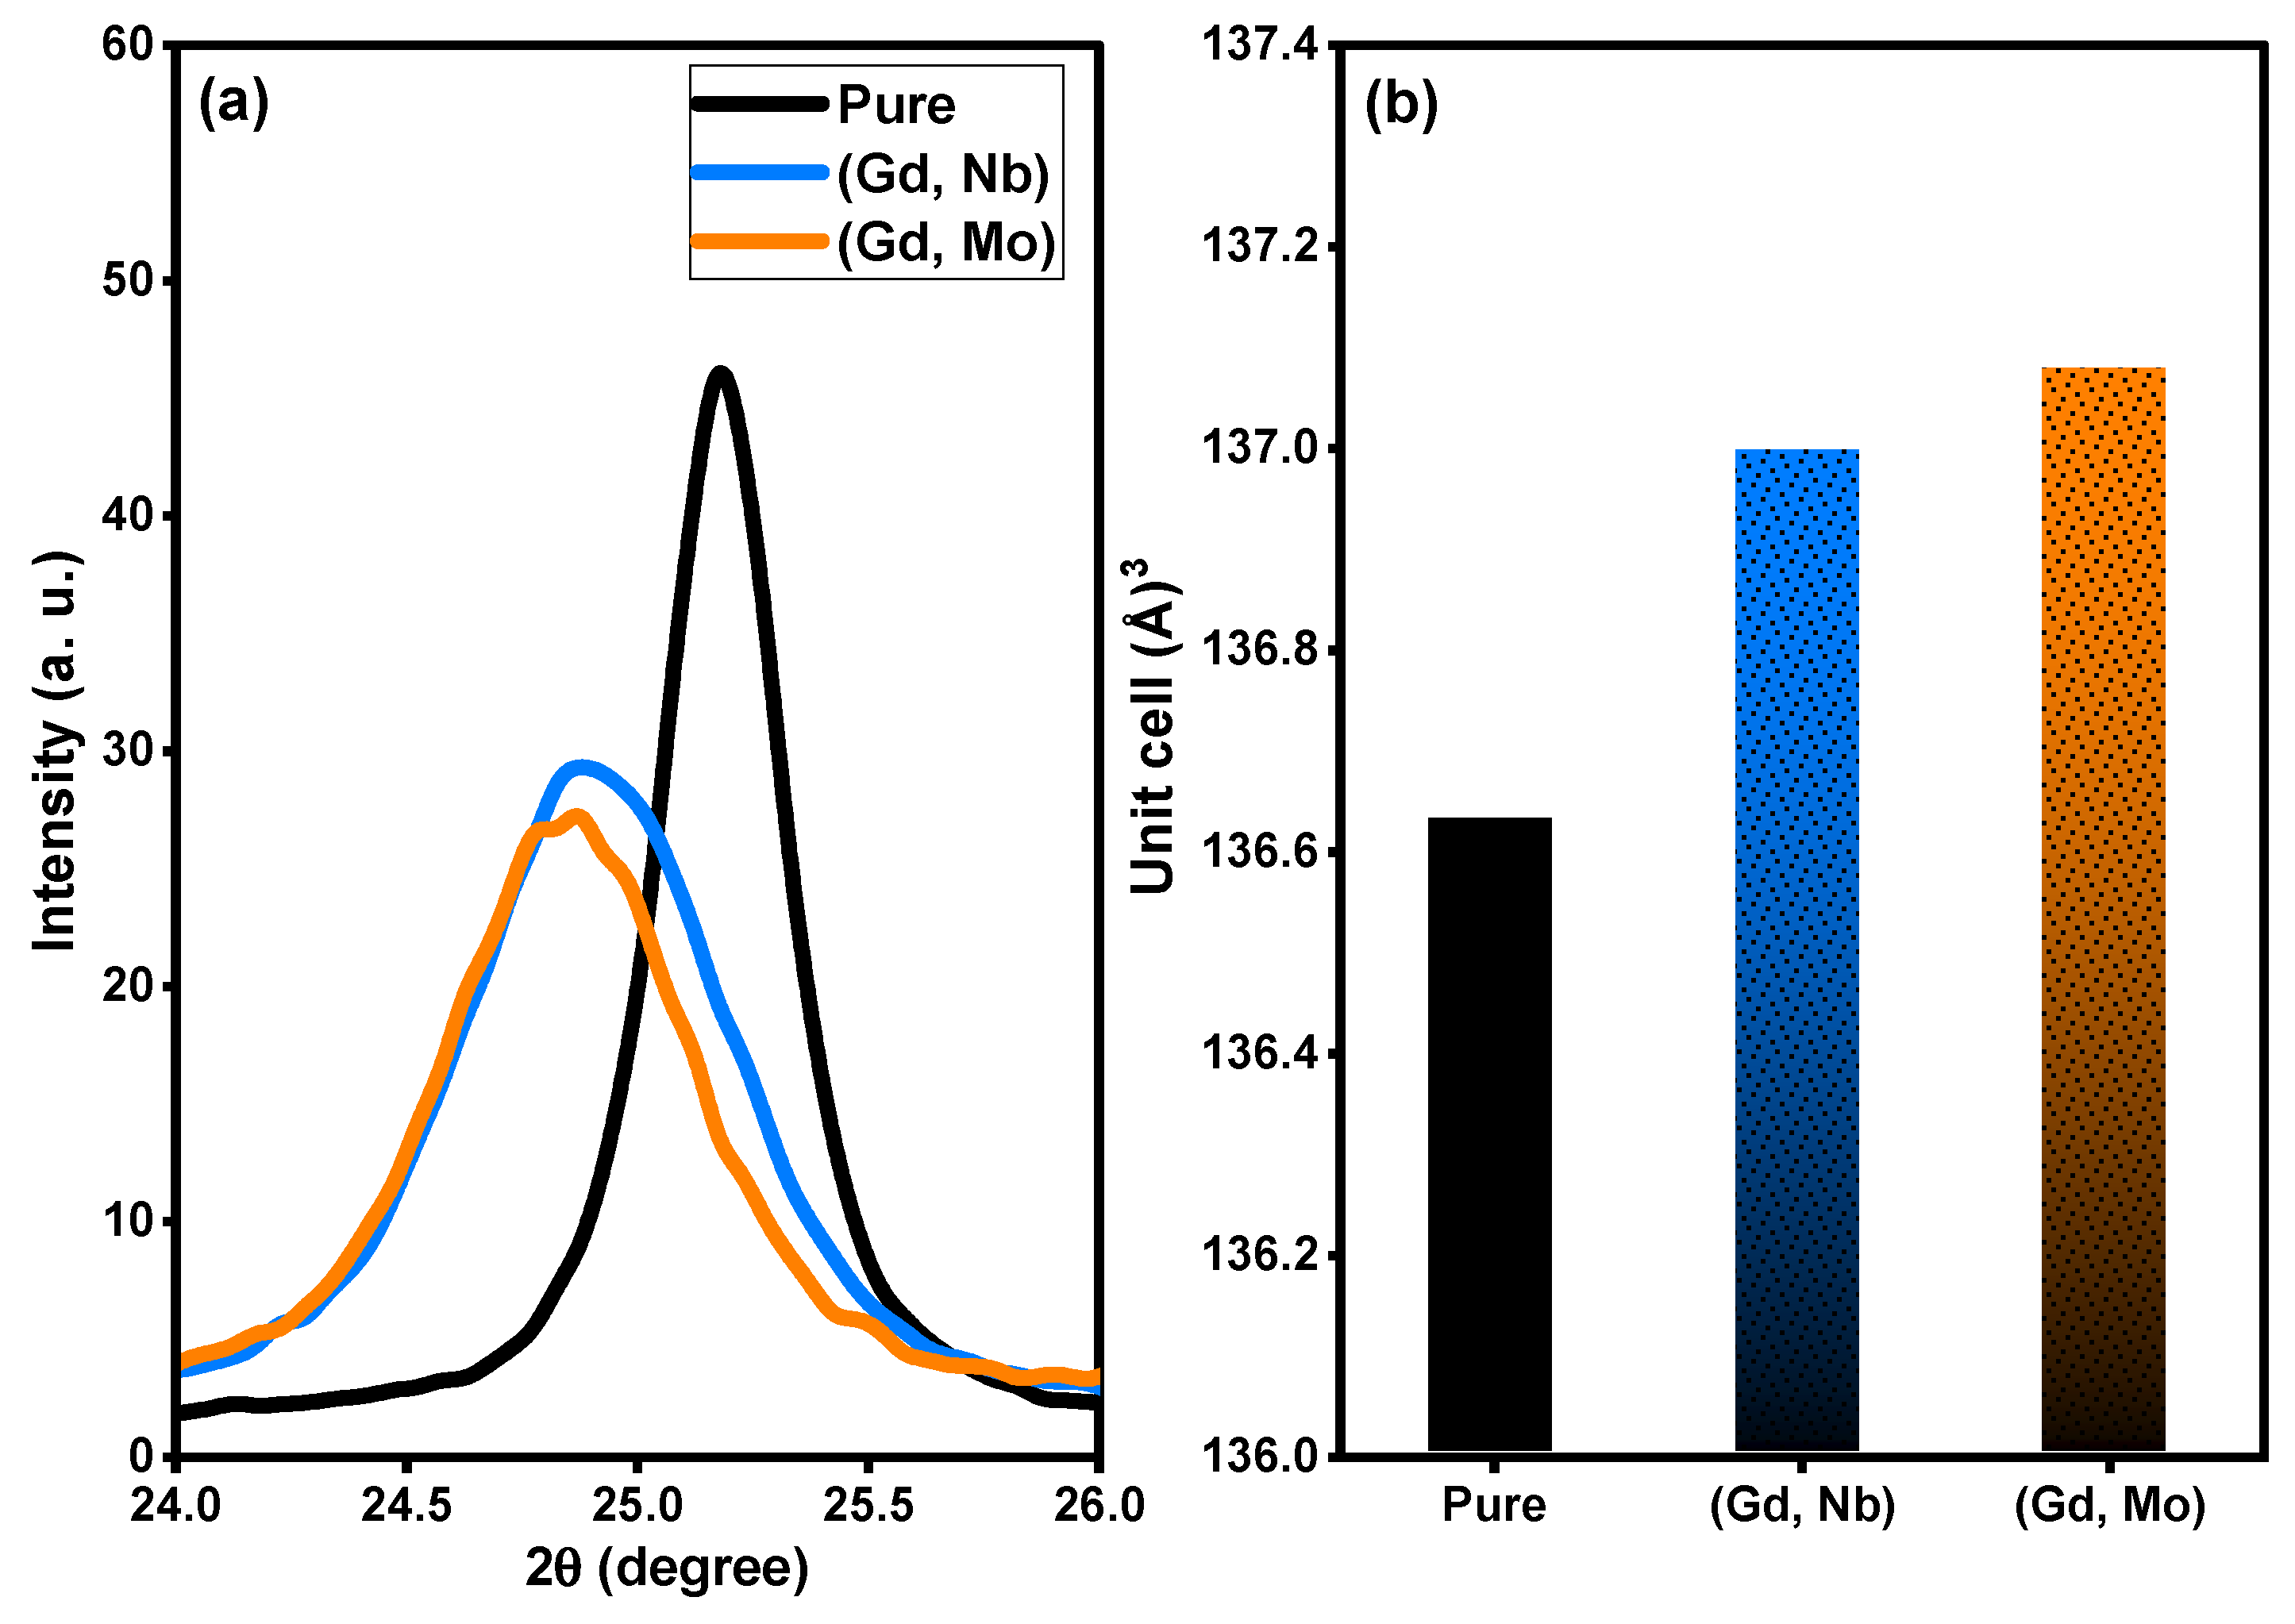
Based on XRD analysis, the purity, phases, and crystalline structure of TiO2, Ti0.96Gd0.01Nb0.03O2 and Ti0.96Gd0.01Mo0.03O2 powders were analyzed and are presented in Figure 1. With respect to pure TiO2, 11 X-ray diffraction peaks at 2-theta angles of 25.171°, 36.811°, 37.652°, 38.399°, 47.901°, 53.699°, 54.859°, 62.512°, 68.498°, 70.042°, and 74.902° were identified. These diffraction peaks were indexed to the (101), (103), (004), (112), (200), (105), (211), (204), (116), (220), and (215) planes of titanium oxide structure with anatase phase (JCPDS, No. 21-1272). In addition, the two codoped samples had diffraction patterns similar to that of pure TiO2, proving the formation of anatase phase. As depicted in Figure 2a, the enlargement pattern of the main XRD peak (101) of TiO2 shows shifts to low 2-theta angles after codoping with (Gd, Nb) or (Gd, Mo) ions. These shifts can be attributed to the replacement of Ti4+ sites, which have an ionic radius of 0.605 Å (VI), by Gd3+ (0.938 Å), Nb5+ (0.64 Å) or Mo6+ (0.59 Å, VI) ions with a higher ionic radius. In the same context, the unit cell volume of pure TiO2 structure was expanded after insertion of (Gd, Nb) and (Gd, Mo) ions into TiO2, indicating the actual codoping process as shown in Figure 2b, which was in agreement with many previous studies on Gd, Nb, or Mo-doped TiO2 [46,47,48]. The crystallite size of TiO2, Ti0.96Gd0.01Nb0.03O2 and Ti0.96Gd0.01Mo0.03O2 catalysts were considered according to Scherrer-equation [10]:
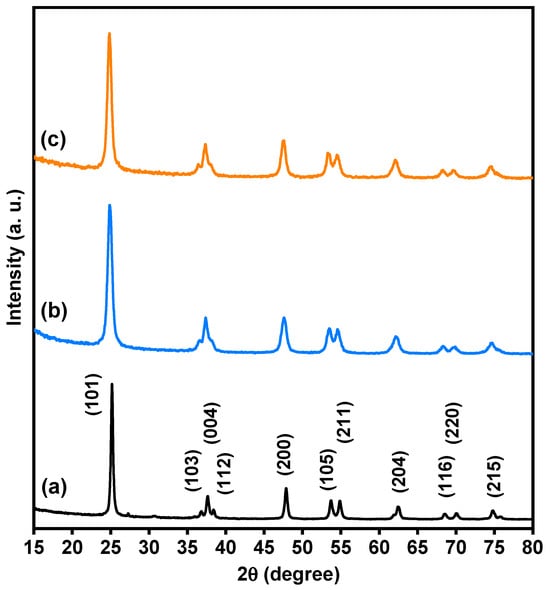
Figure 1.
XRD patterns of (a) pure TiO2, (b) Ti0.96Gd0.01Nb0.03O2, and (c) Ti0.96Gd0.01Mo0.03O2 powders.
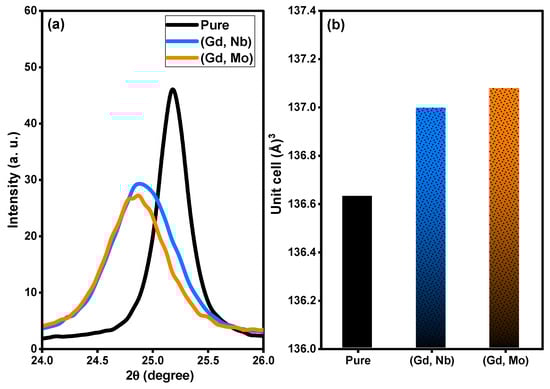
Figure 2.
Depicts (a) enlargement pattern of (101) plane and (b) unit cell volume of pure, (Gd, Nb), and (Gd, Mo) codoped TiO2.
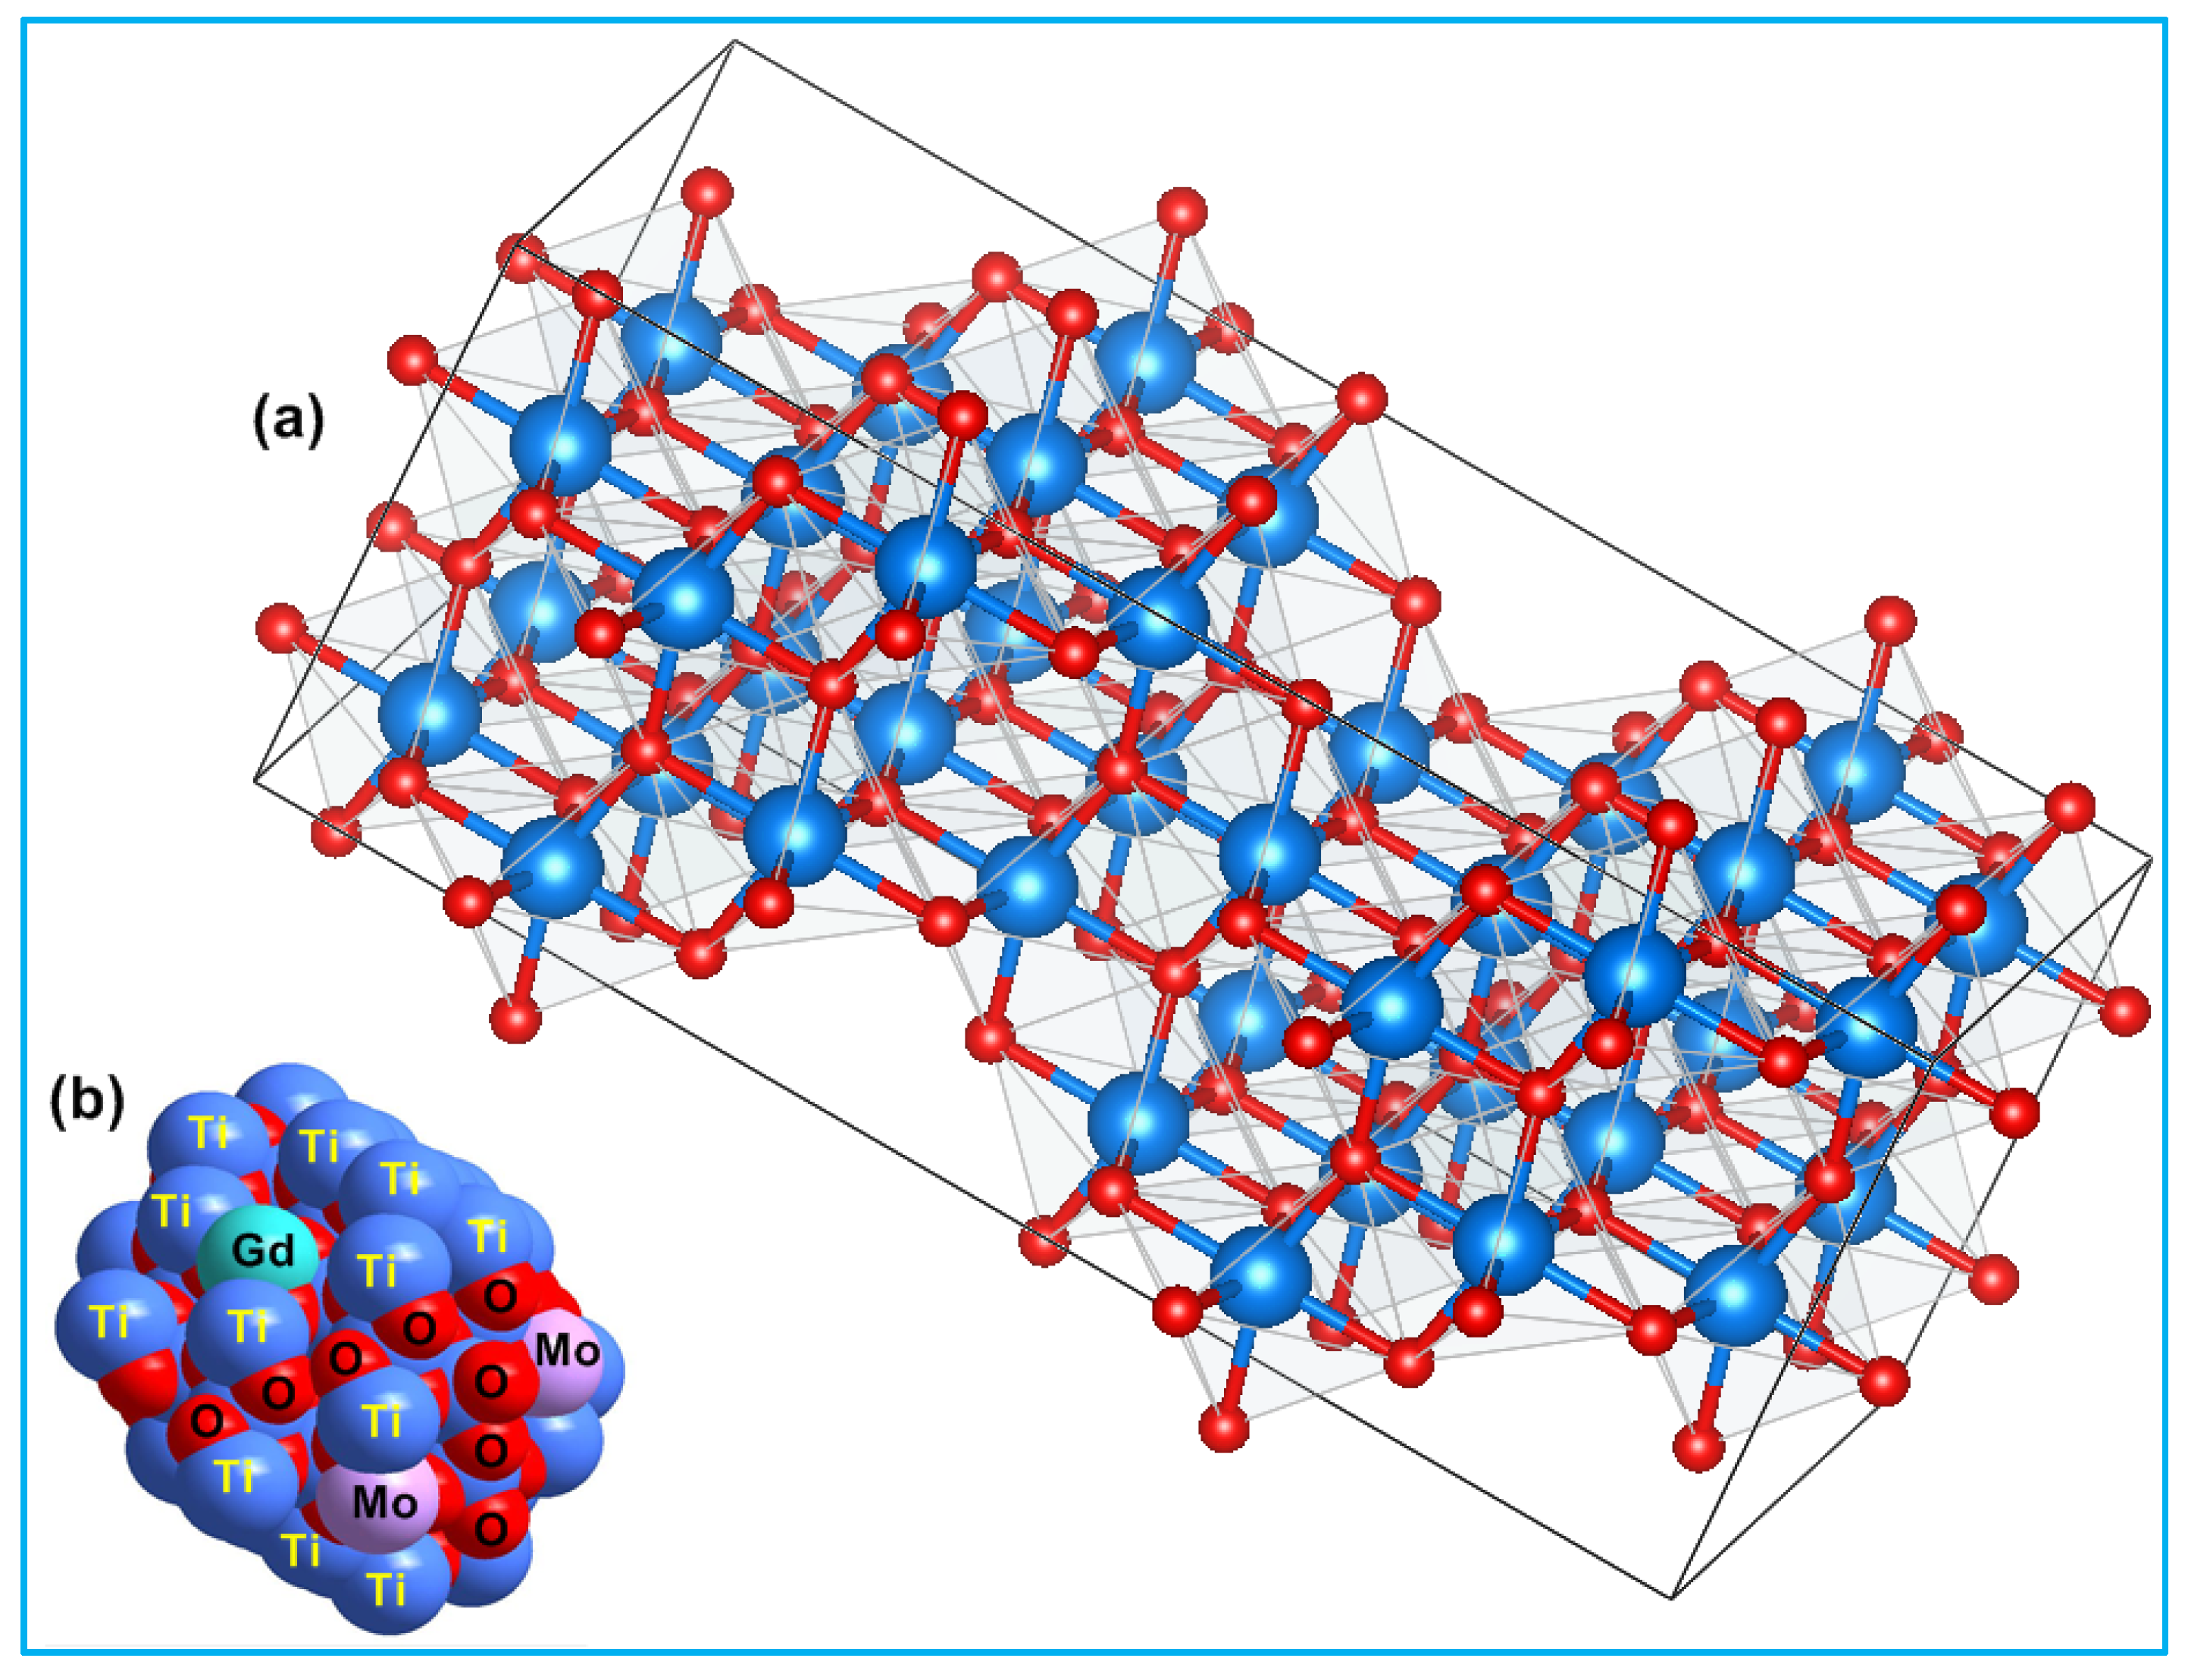
The average crystallite size of TiO2, Ti0.96Gd0.01Nb0.03O2, and Ti0.96Gd0.01Mo0.03O2 powders was 27, 14, and 15 nm, respectively. Figure 3 displays the geometrical structure of the primitive unit cell and the space-filling model of anatase TiO2 with substitutions by Gd3+ and Mo6+ ions, illustrating the coordination of the cations and anions.
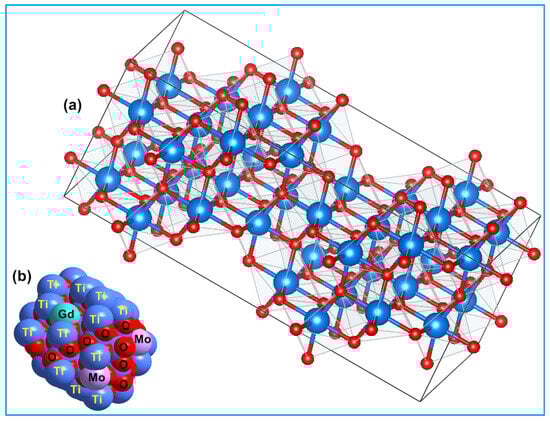
Figure 3.
Depicts (a) 2 × 2 × 2 primitive cell of anatase TiO2 and (b) space-filling model of (Gd, Mo) codoped TiO2 structure.
2.2. Band Gap and Optical Features
The detailed optical properties of pure TiO2, Ti0.96Gd0.01Nb0.03O2, and Ti0.96Gd0.01Mo0.03O2 samples were identified by diffuse reflectance (DR), analysis as demonstrated in Figure 4. The diffuse reflectance spectrum of the pure TiO2 sample shows a large and sharp decrease in intensity below 400 nm (ultraviolet region), corresponding to the band gap energy. After the insertion of (Gd, Nb) and (Gd, Mo) ions into the TiO2 semiconductor, the absorption edge was strongly red-shifted (to a lower energy), implying that the electronic structure of the pure anatase TiO2 was altered by codoping with (Gd, Nb) and (Gd, Mo) ions. The Tauc equation and Kubelka–Munk formula were applied to estimate the value of the band gap energy of pure TiO2, Ti0.96Gd0.01Nb0.03O2, and Ti0.96Gd0.01Mo0.03O2, as indicated below [49]:
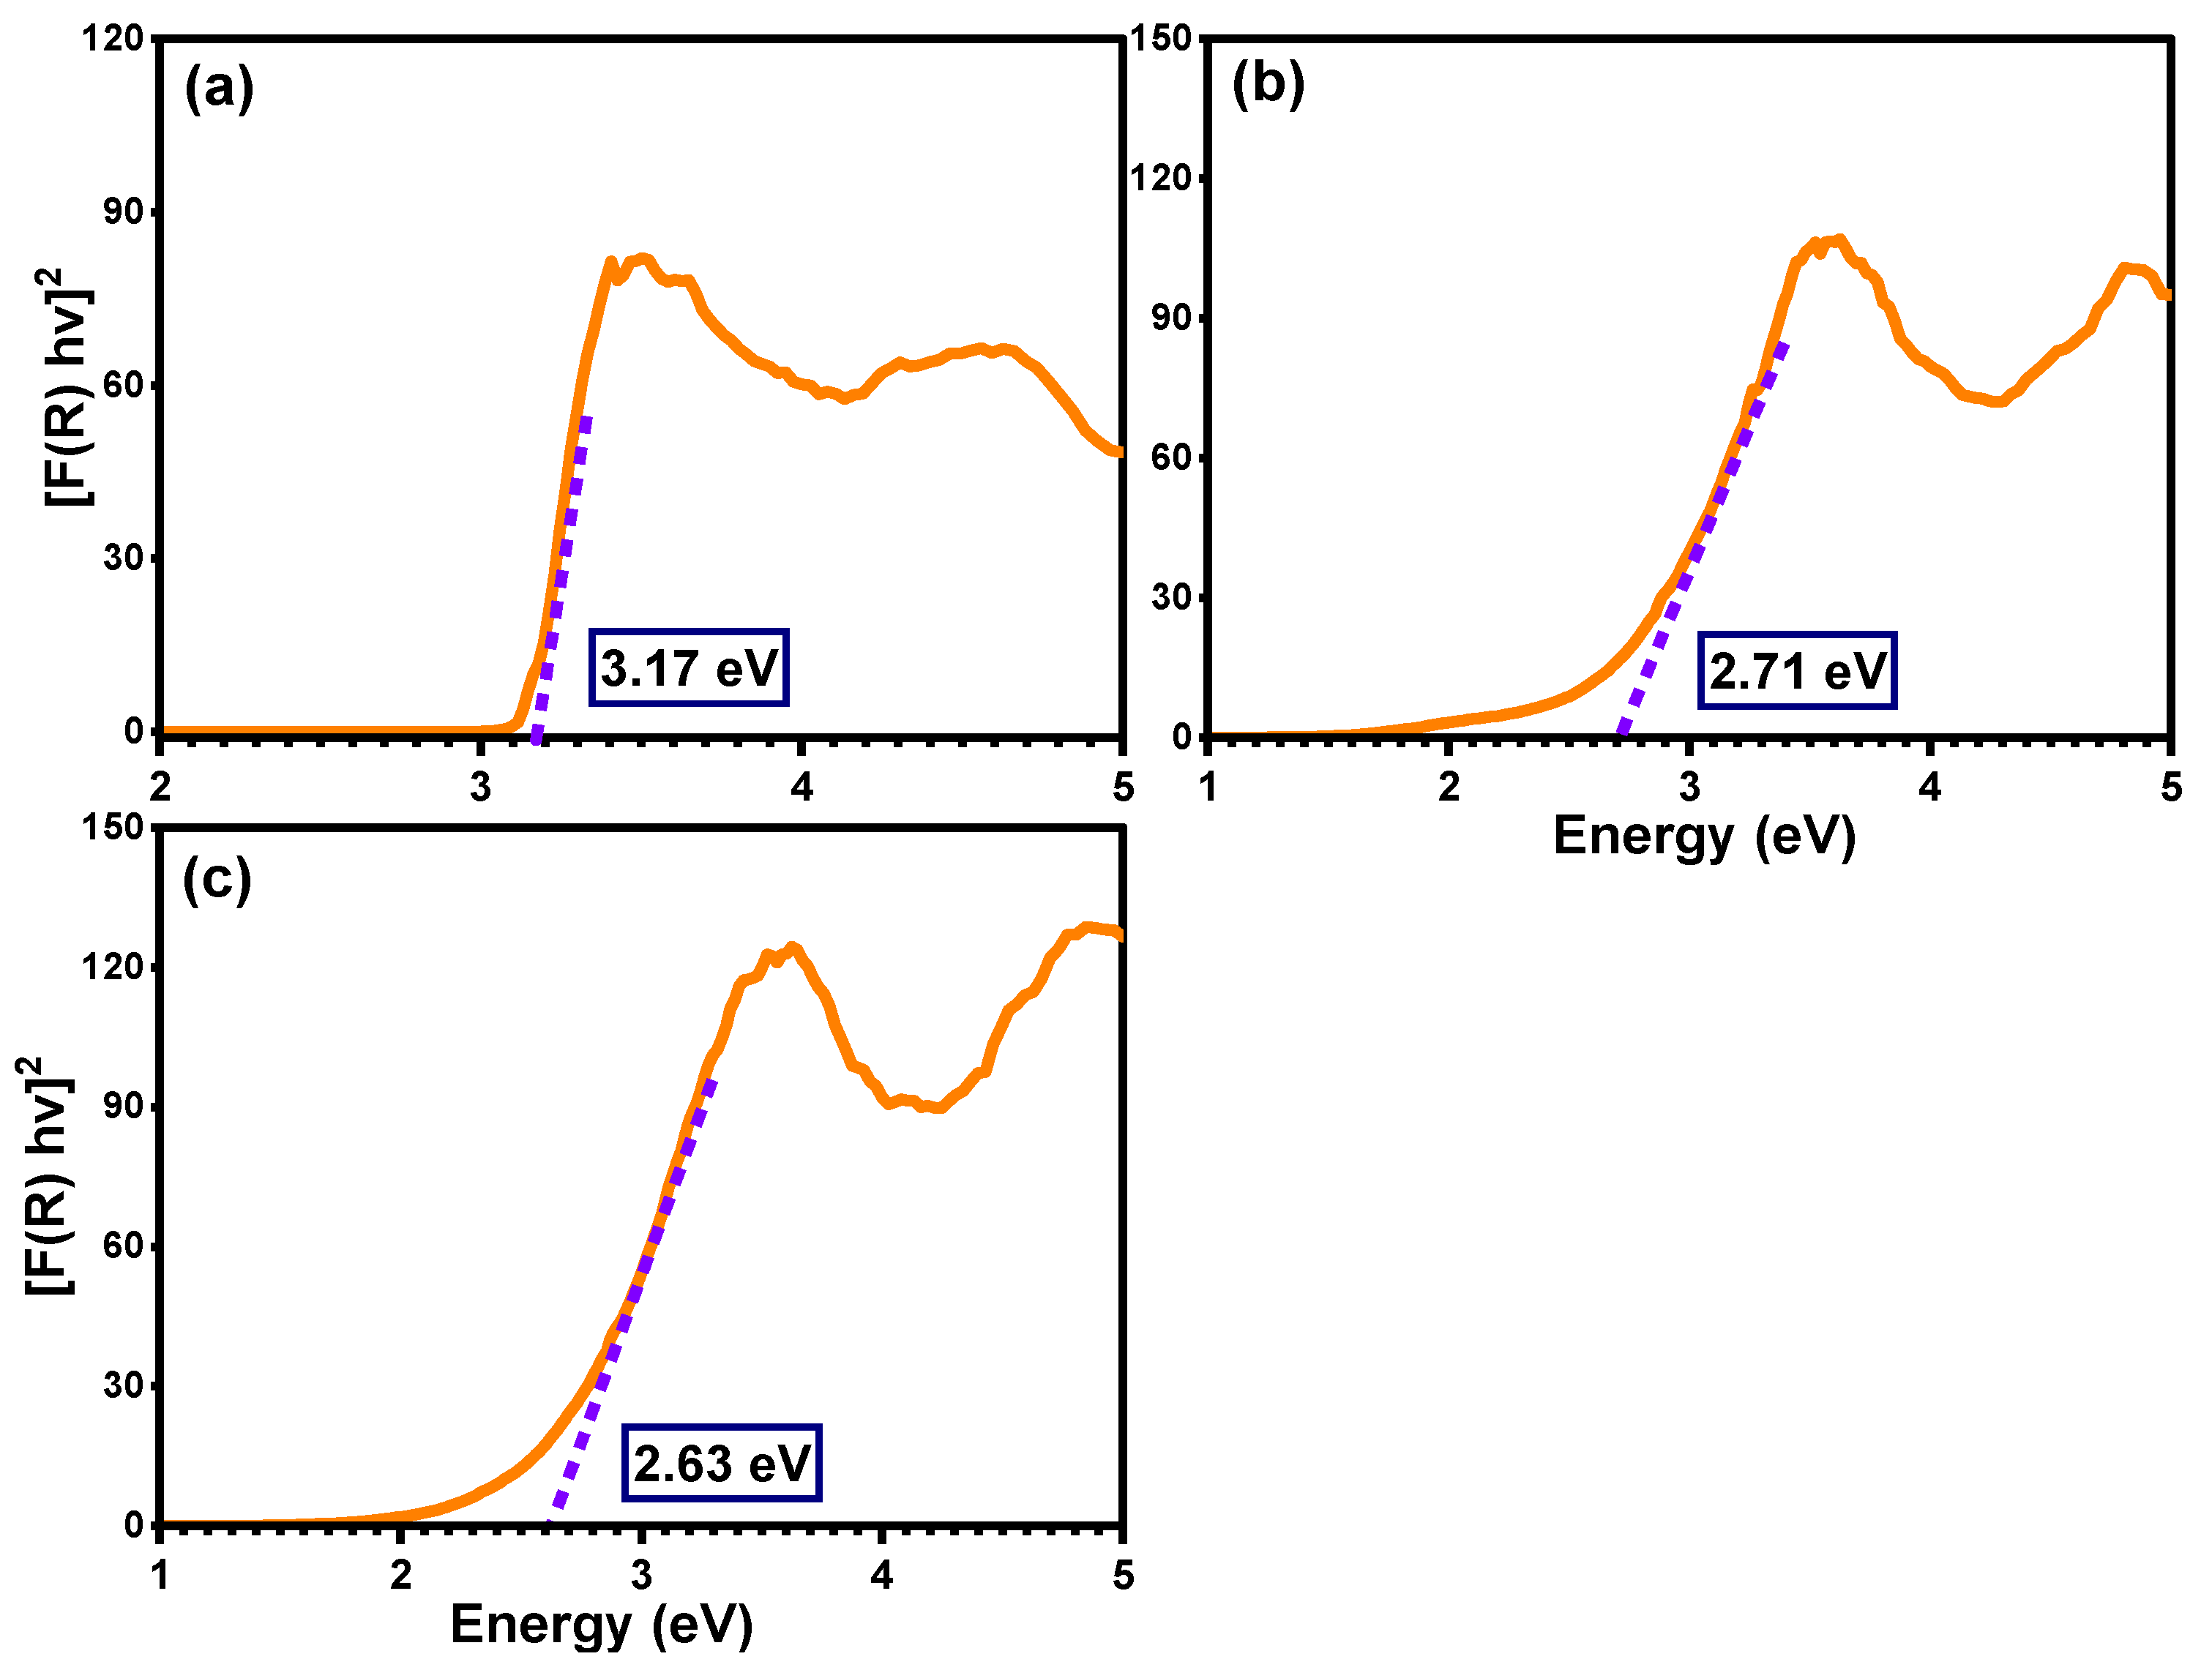
where α symbolizes the absorption coefficient, hν represents the energy of the photon, Eg means the band gap energy, F(R) indicates the Kubelka–Munk function, R designates the reflectance, and S represents the scattering coefficient. As demonstrated in Figure 5, the plot of [F(R) hν]2 on the Y-axis with the photon energy on the X-axis reveals an accurate value for the band gap energy. The detected value of the band gap energy of the pure TiO2 semiconductor was 3.17 eV, which was agreement with many previously published studies [50,51]. The band gap energies of the Ti0.96Gd0.01Nb0.03O2 and Ti0.96Gd0.01Mo0.03O2 compositions were found to be 2.71 and 2.63 eV, respectively. These reductions (red-shifts) of the band gap of the anatase TiO2 structure can be correlated to the introduction of impurity states within the band gap structure, as well as the formation of oxygen vacancies for charge neutrality [48,52,53].
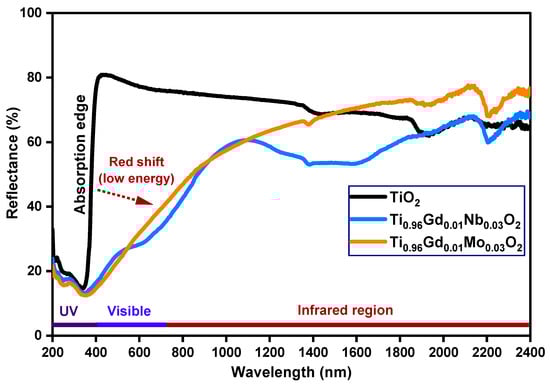
Figure 4.
Diffuse reflectance (%) spectra of TiO2, Ti0.96Gd0.01Nb0.03O2, and Ti0.96Gd0.01Mo0.03O2 samples.
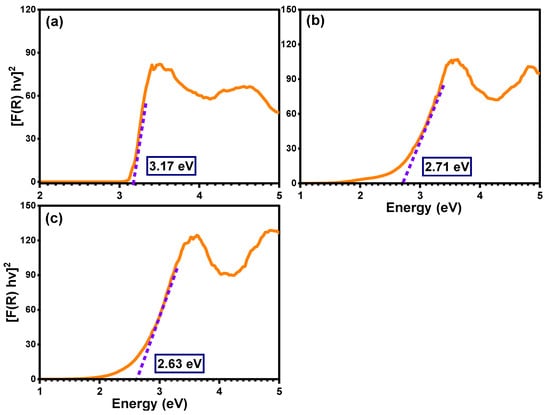
Figure 5.
Band gap estimation for (a) pure TiO2, (b) Ti0.96Gd0.01Nb0.03O2, and (c) Ti0.96Gd0.01Mo0.03O2 samples.
2.3. Scanning Electron Microscope (SEM)
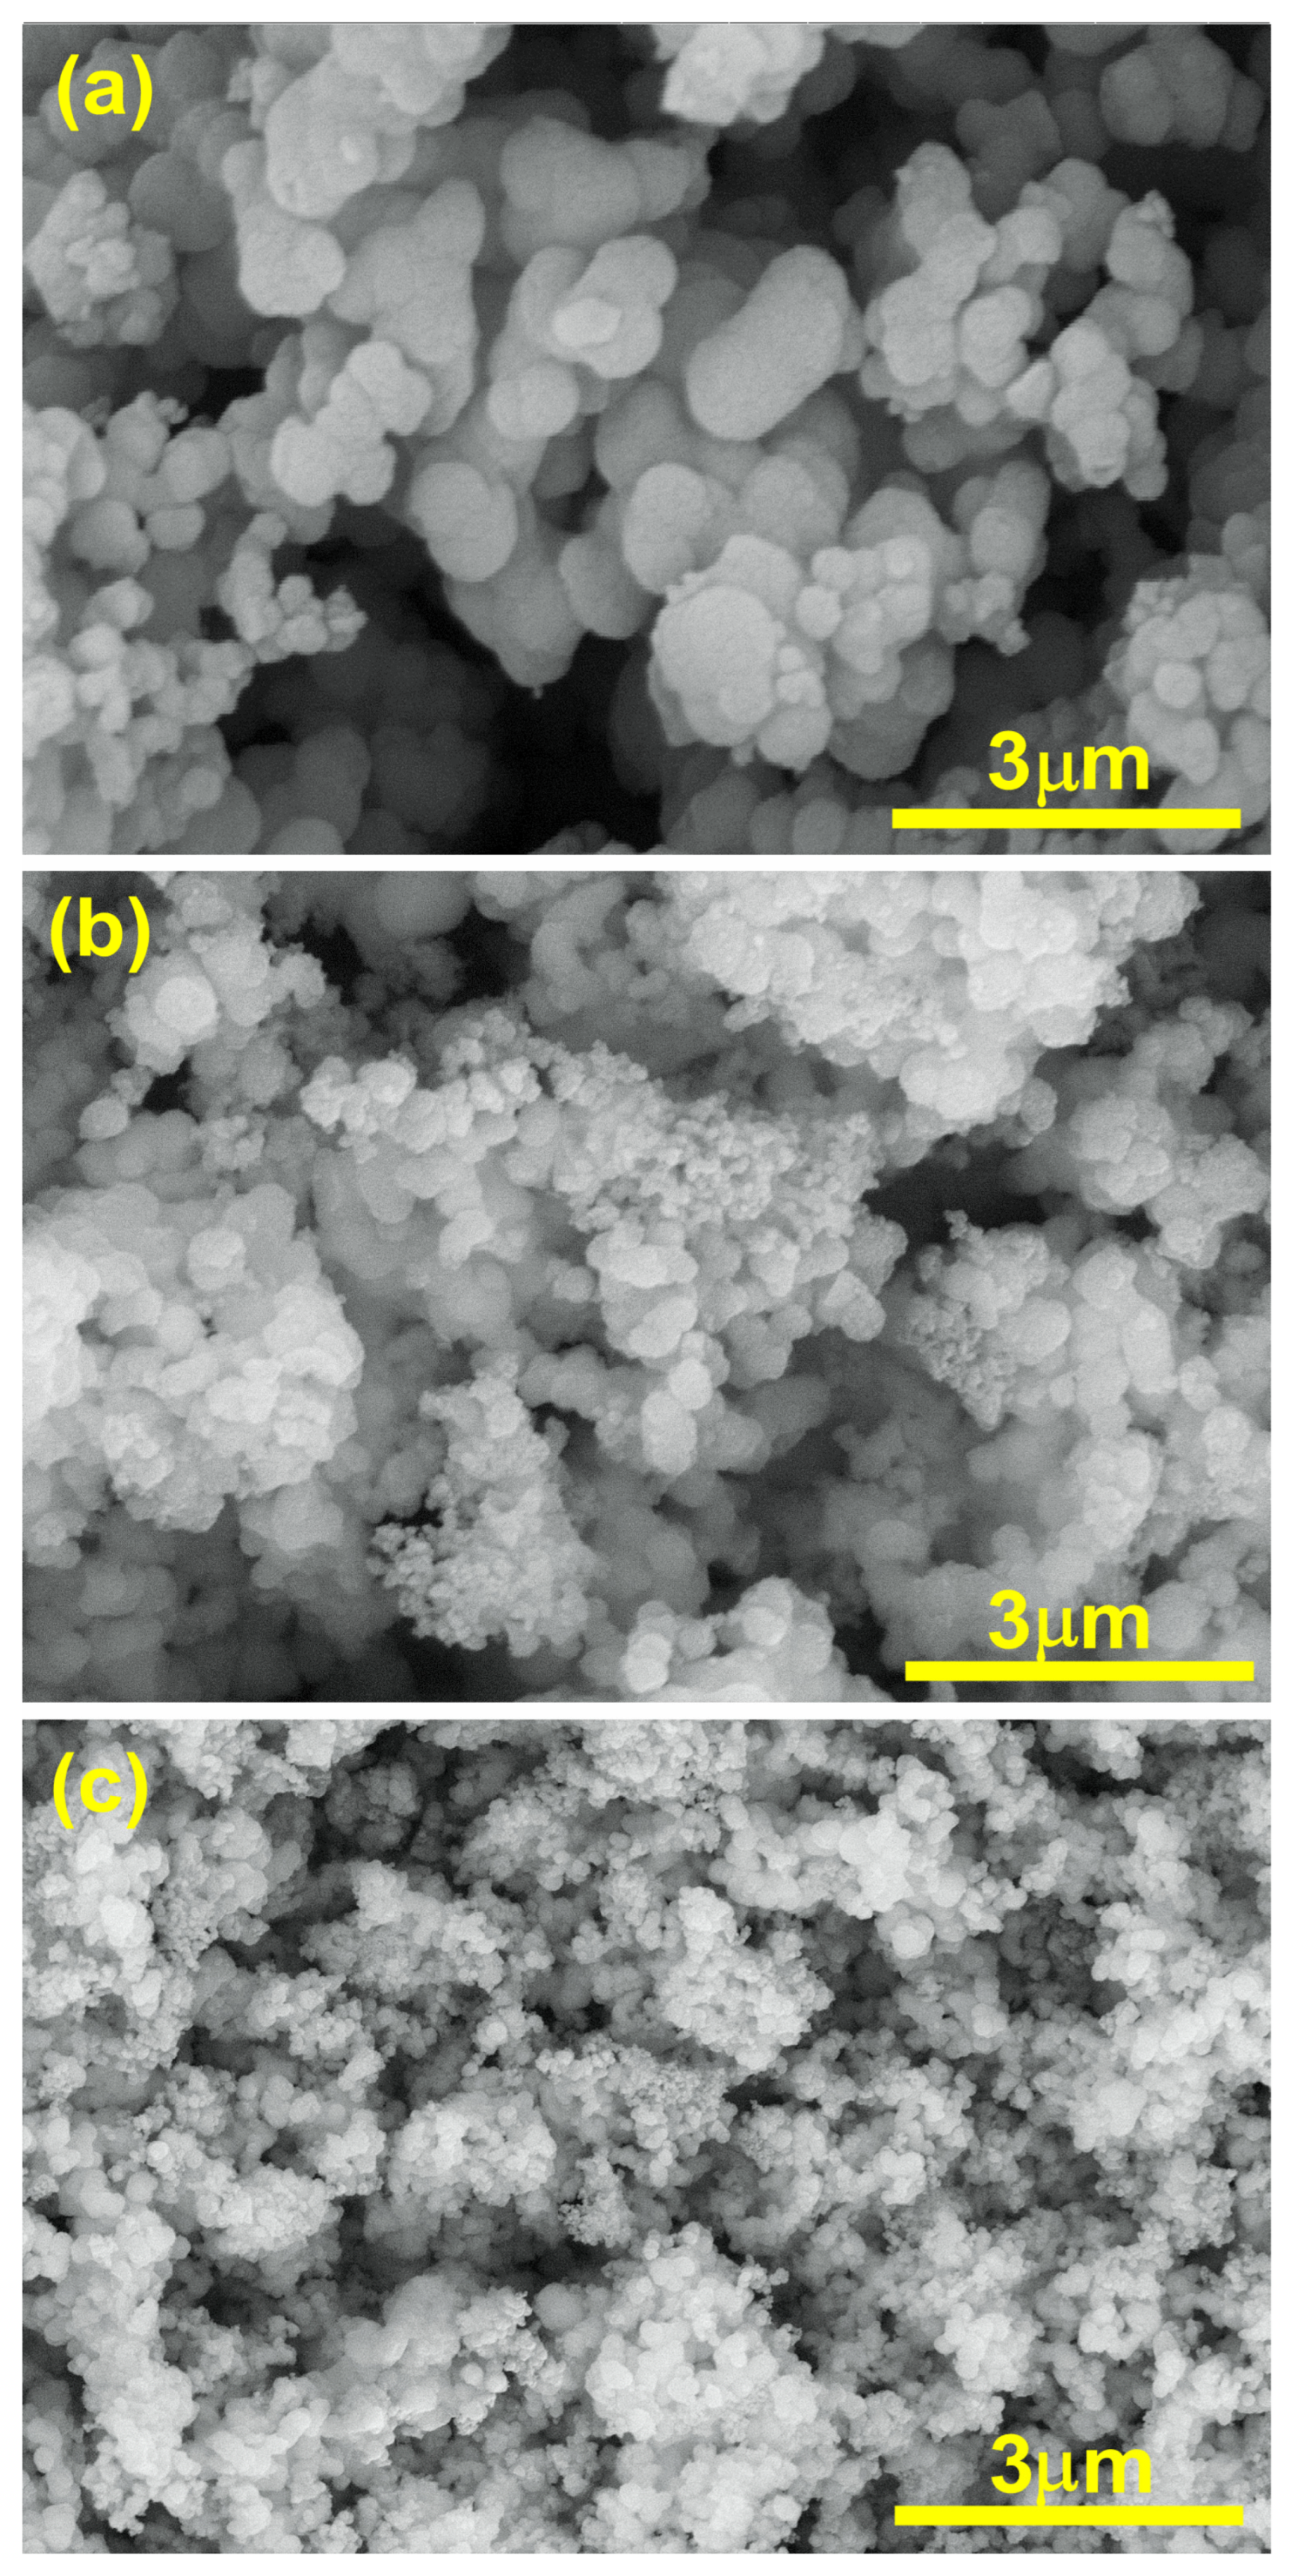
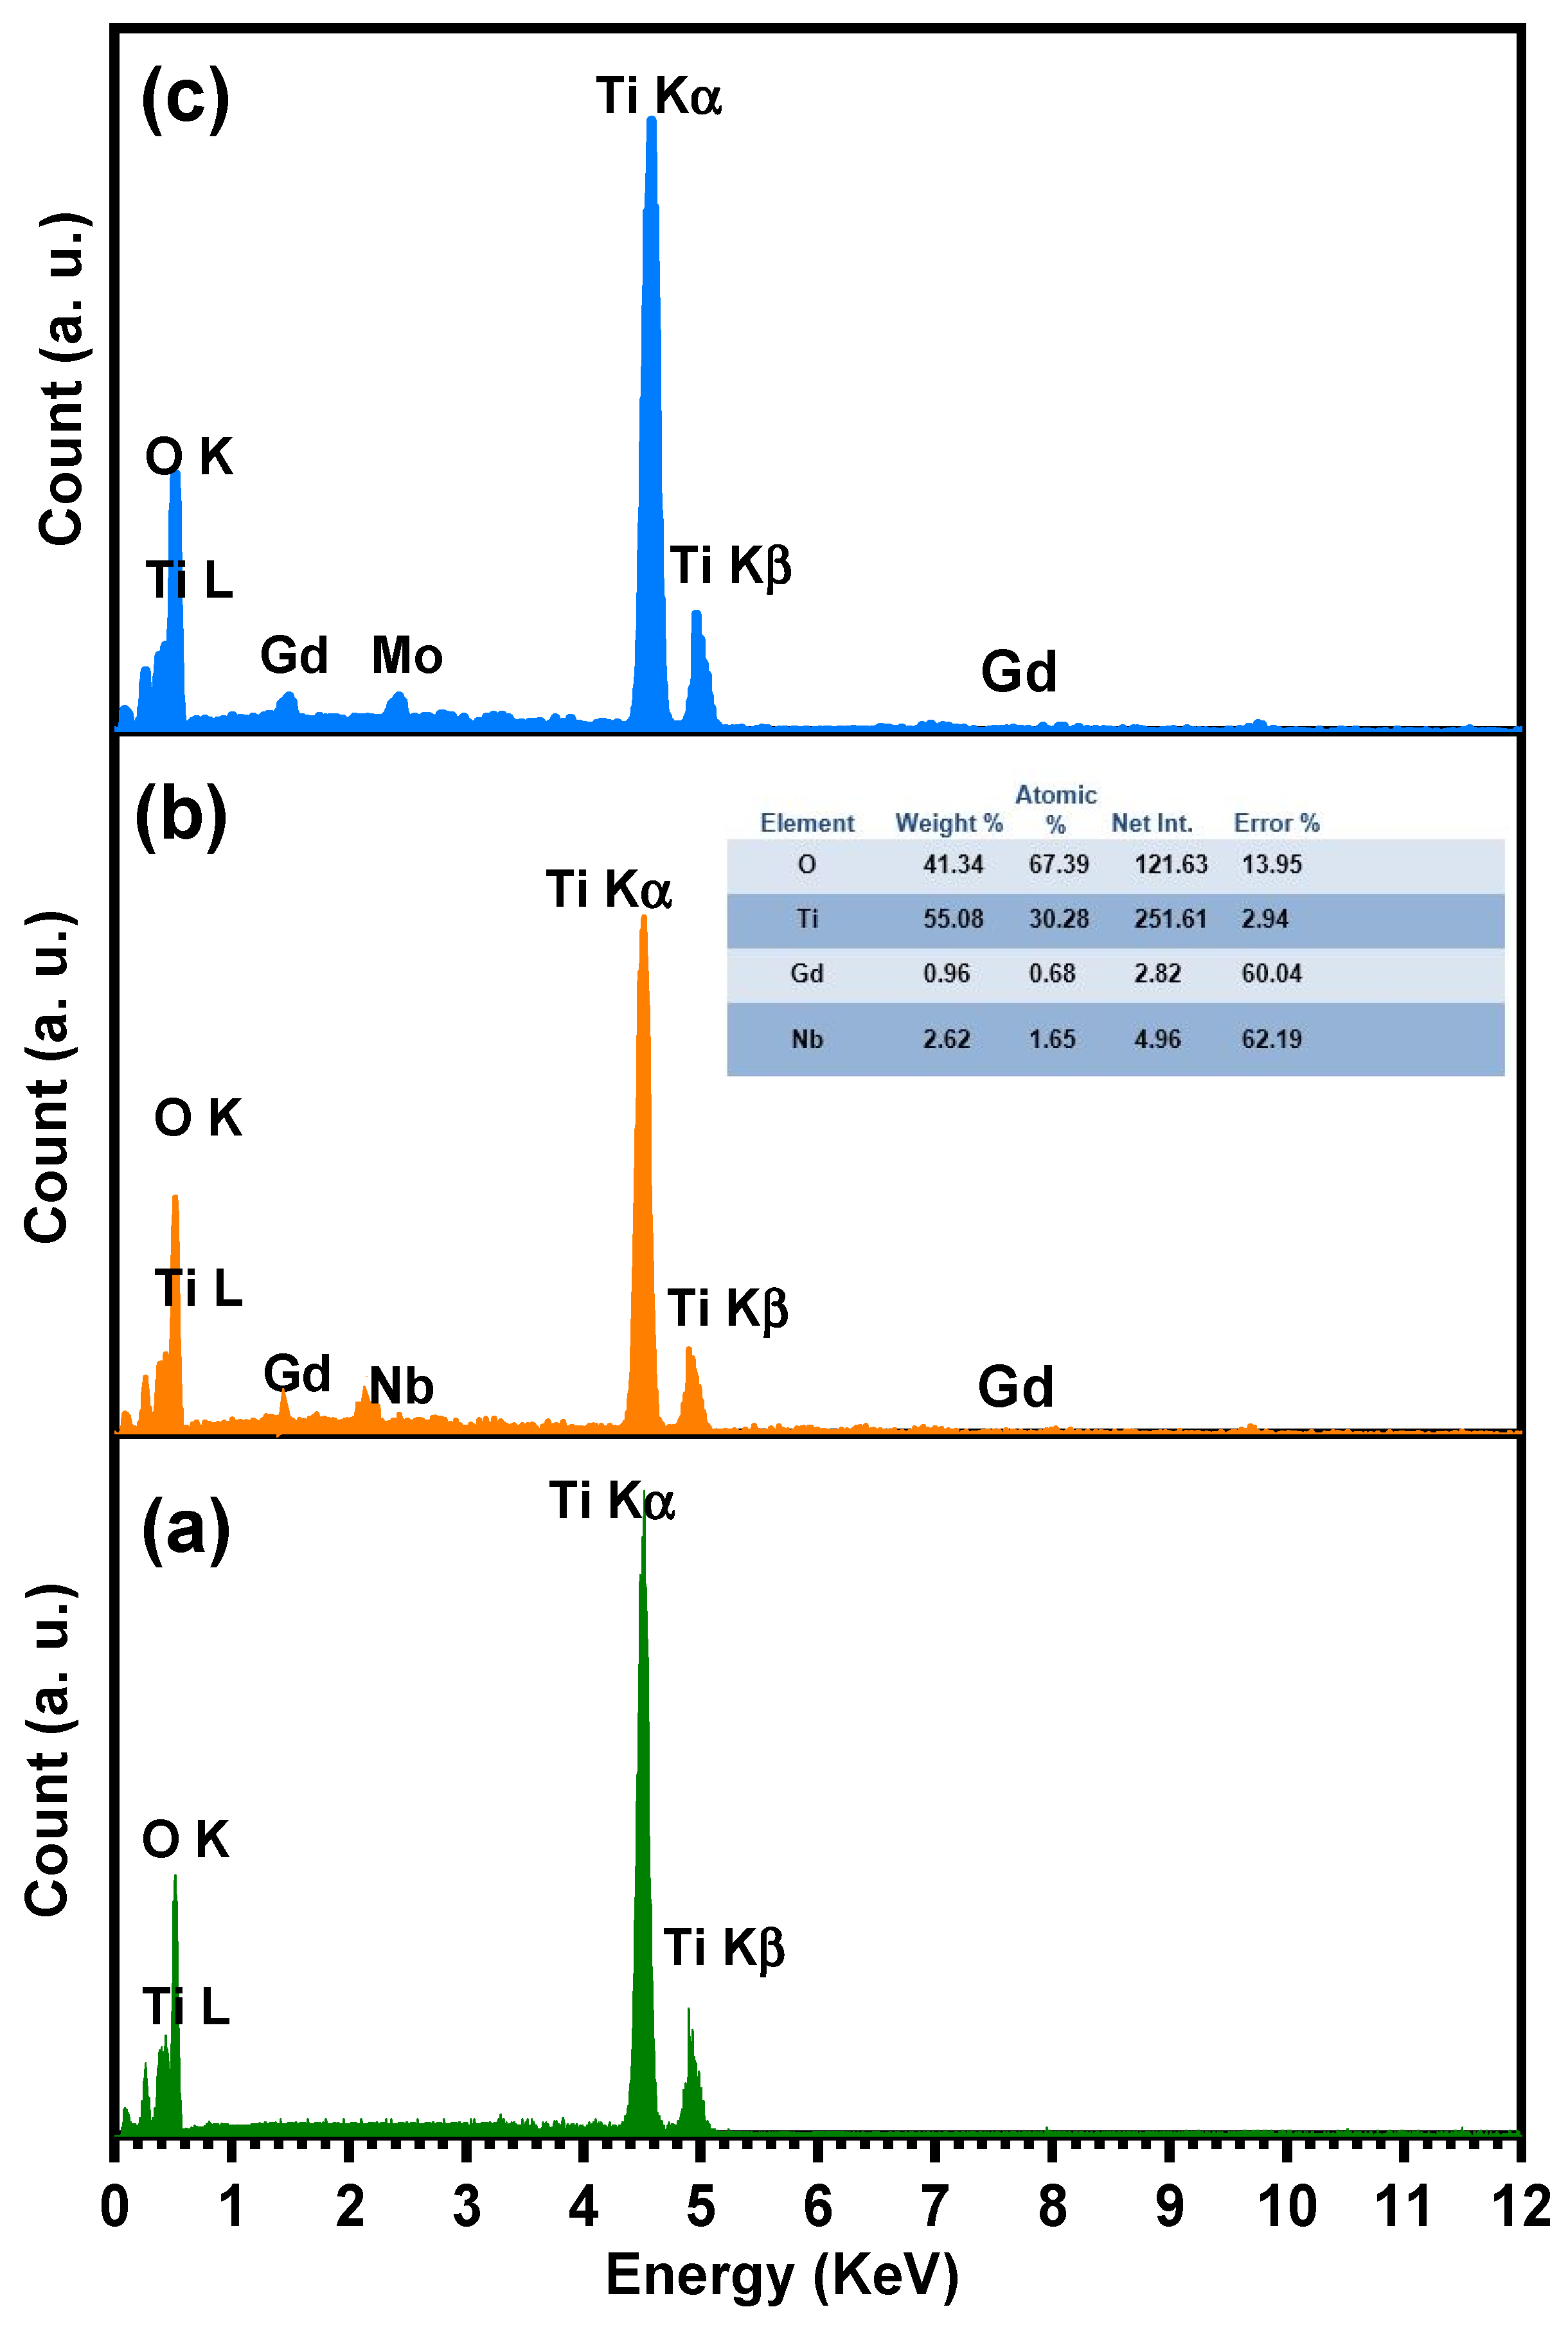
The SEM analysis of TiO2, Ti0.96Gd0.01Nb0.03O2, and Ti0.96Gd0.01Mo0.03O2 was performed as illustrated in Figure 6. The SEM micrograph of pure TiO2 powder reflects the formation of agglomerated grains with nearly spherical structure. The insertion of (Gd, Nb) and (Gd, Mo) ions reduces the grains size of TiO2, with the formation of fine particles. The presence of Gd3+, Nb5+, and Mo6+ ions during the calcination step limit the grain growth of TiO2 particles. The reduction in grain size has a useful effect on the photocatalytic and gas sensing properties as it offers more surface area and active sites for the reactions. For TiO2, Ti0.96Gd0.01Nb0.03O2, and Ti0.96Gd0.01Mo0.03O2, energy-dispersive X-ray (EDX) examinations were performed to detect the elements present in the samples, as revealed in Figure 7. The spectrum of the EDX analysis of TiO2, Ti0.96Gd0.01Nb0.03O2, and Ti0.96Gd0.01Mo0.03O2 confirms the presence of Ti, O, Gd, Nb, and Mo elements and ruled out the presence of any other contamination. The wt% of the Gd, Nb, and Mo dopants is close to the added weight during the synthesis process.
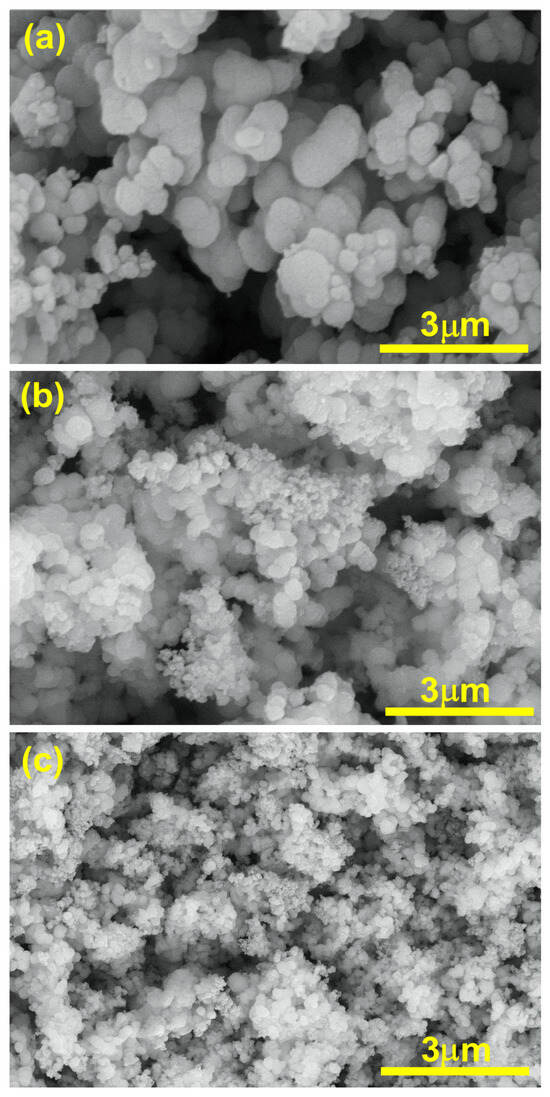
Figure 6.
SEM images of (a) pure TiO2, (b) Ti0.96Gd0.01Nb0.03O2, and (c) Ti0.96Gd0.01Mo0.03O2 samples.
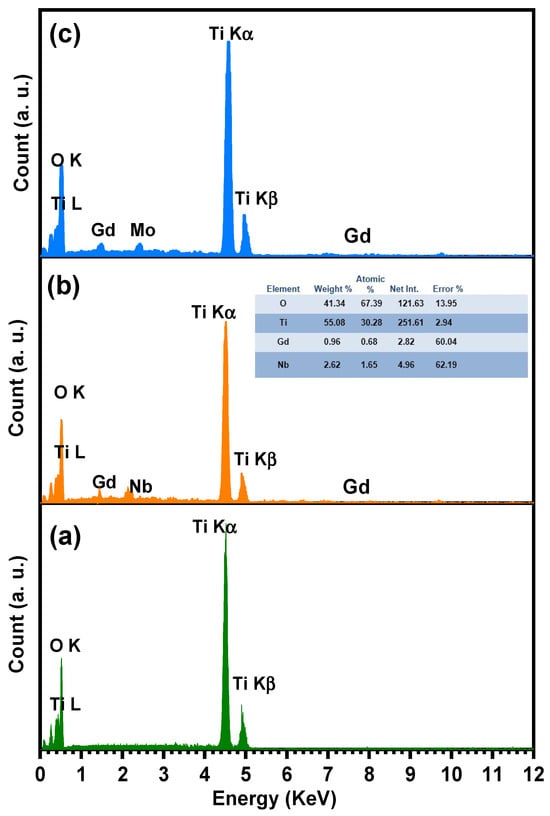
Figure 7.
Energy-dispersive X-ray (EDX) spectrum of (a) pure TiO2, (b) Ti0.96Gd0.01Nb0.03O2, and (c) Ti0.96Gd0.01Mo0.03O2 samples.
2.4. Depollution of Organic Pollutants
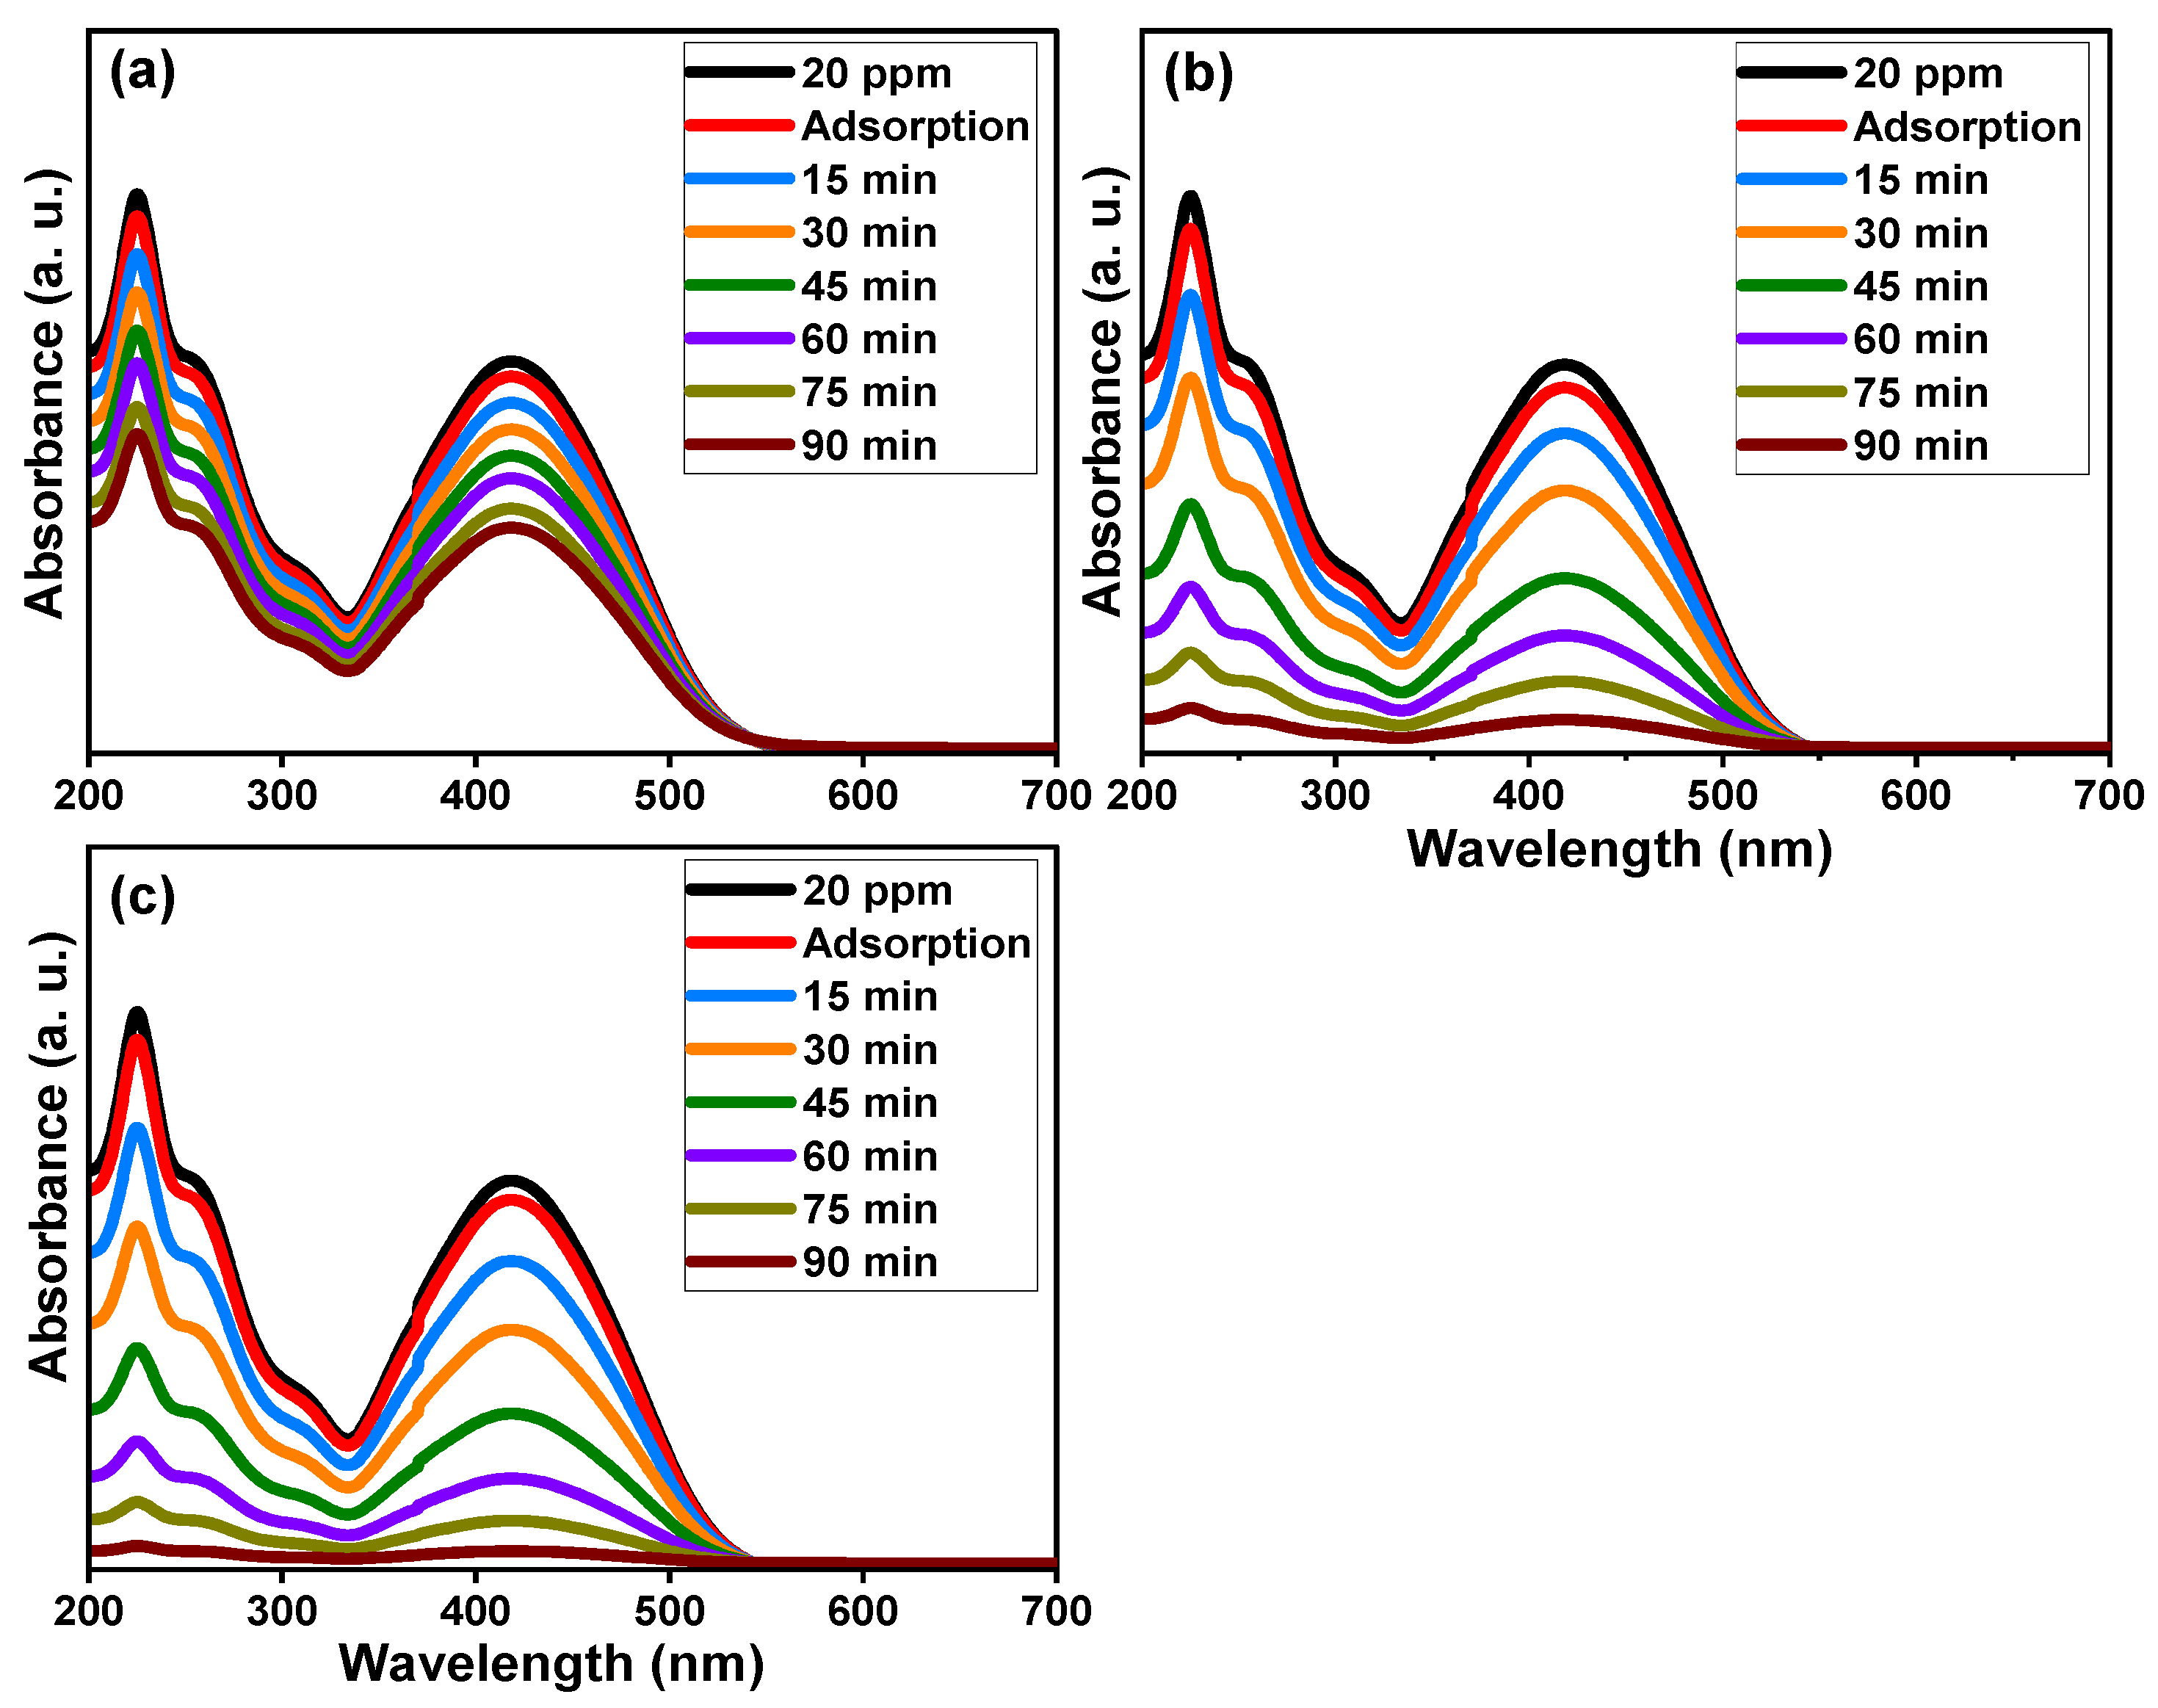
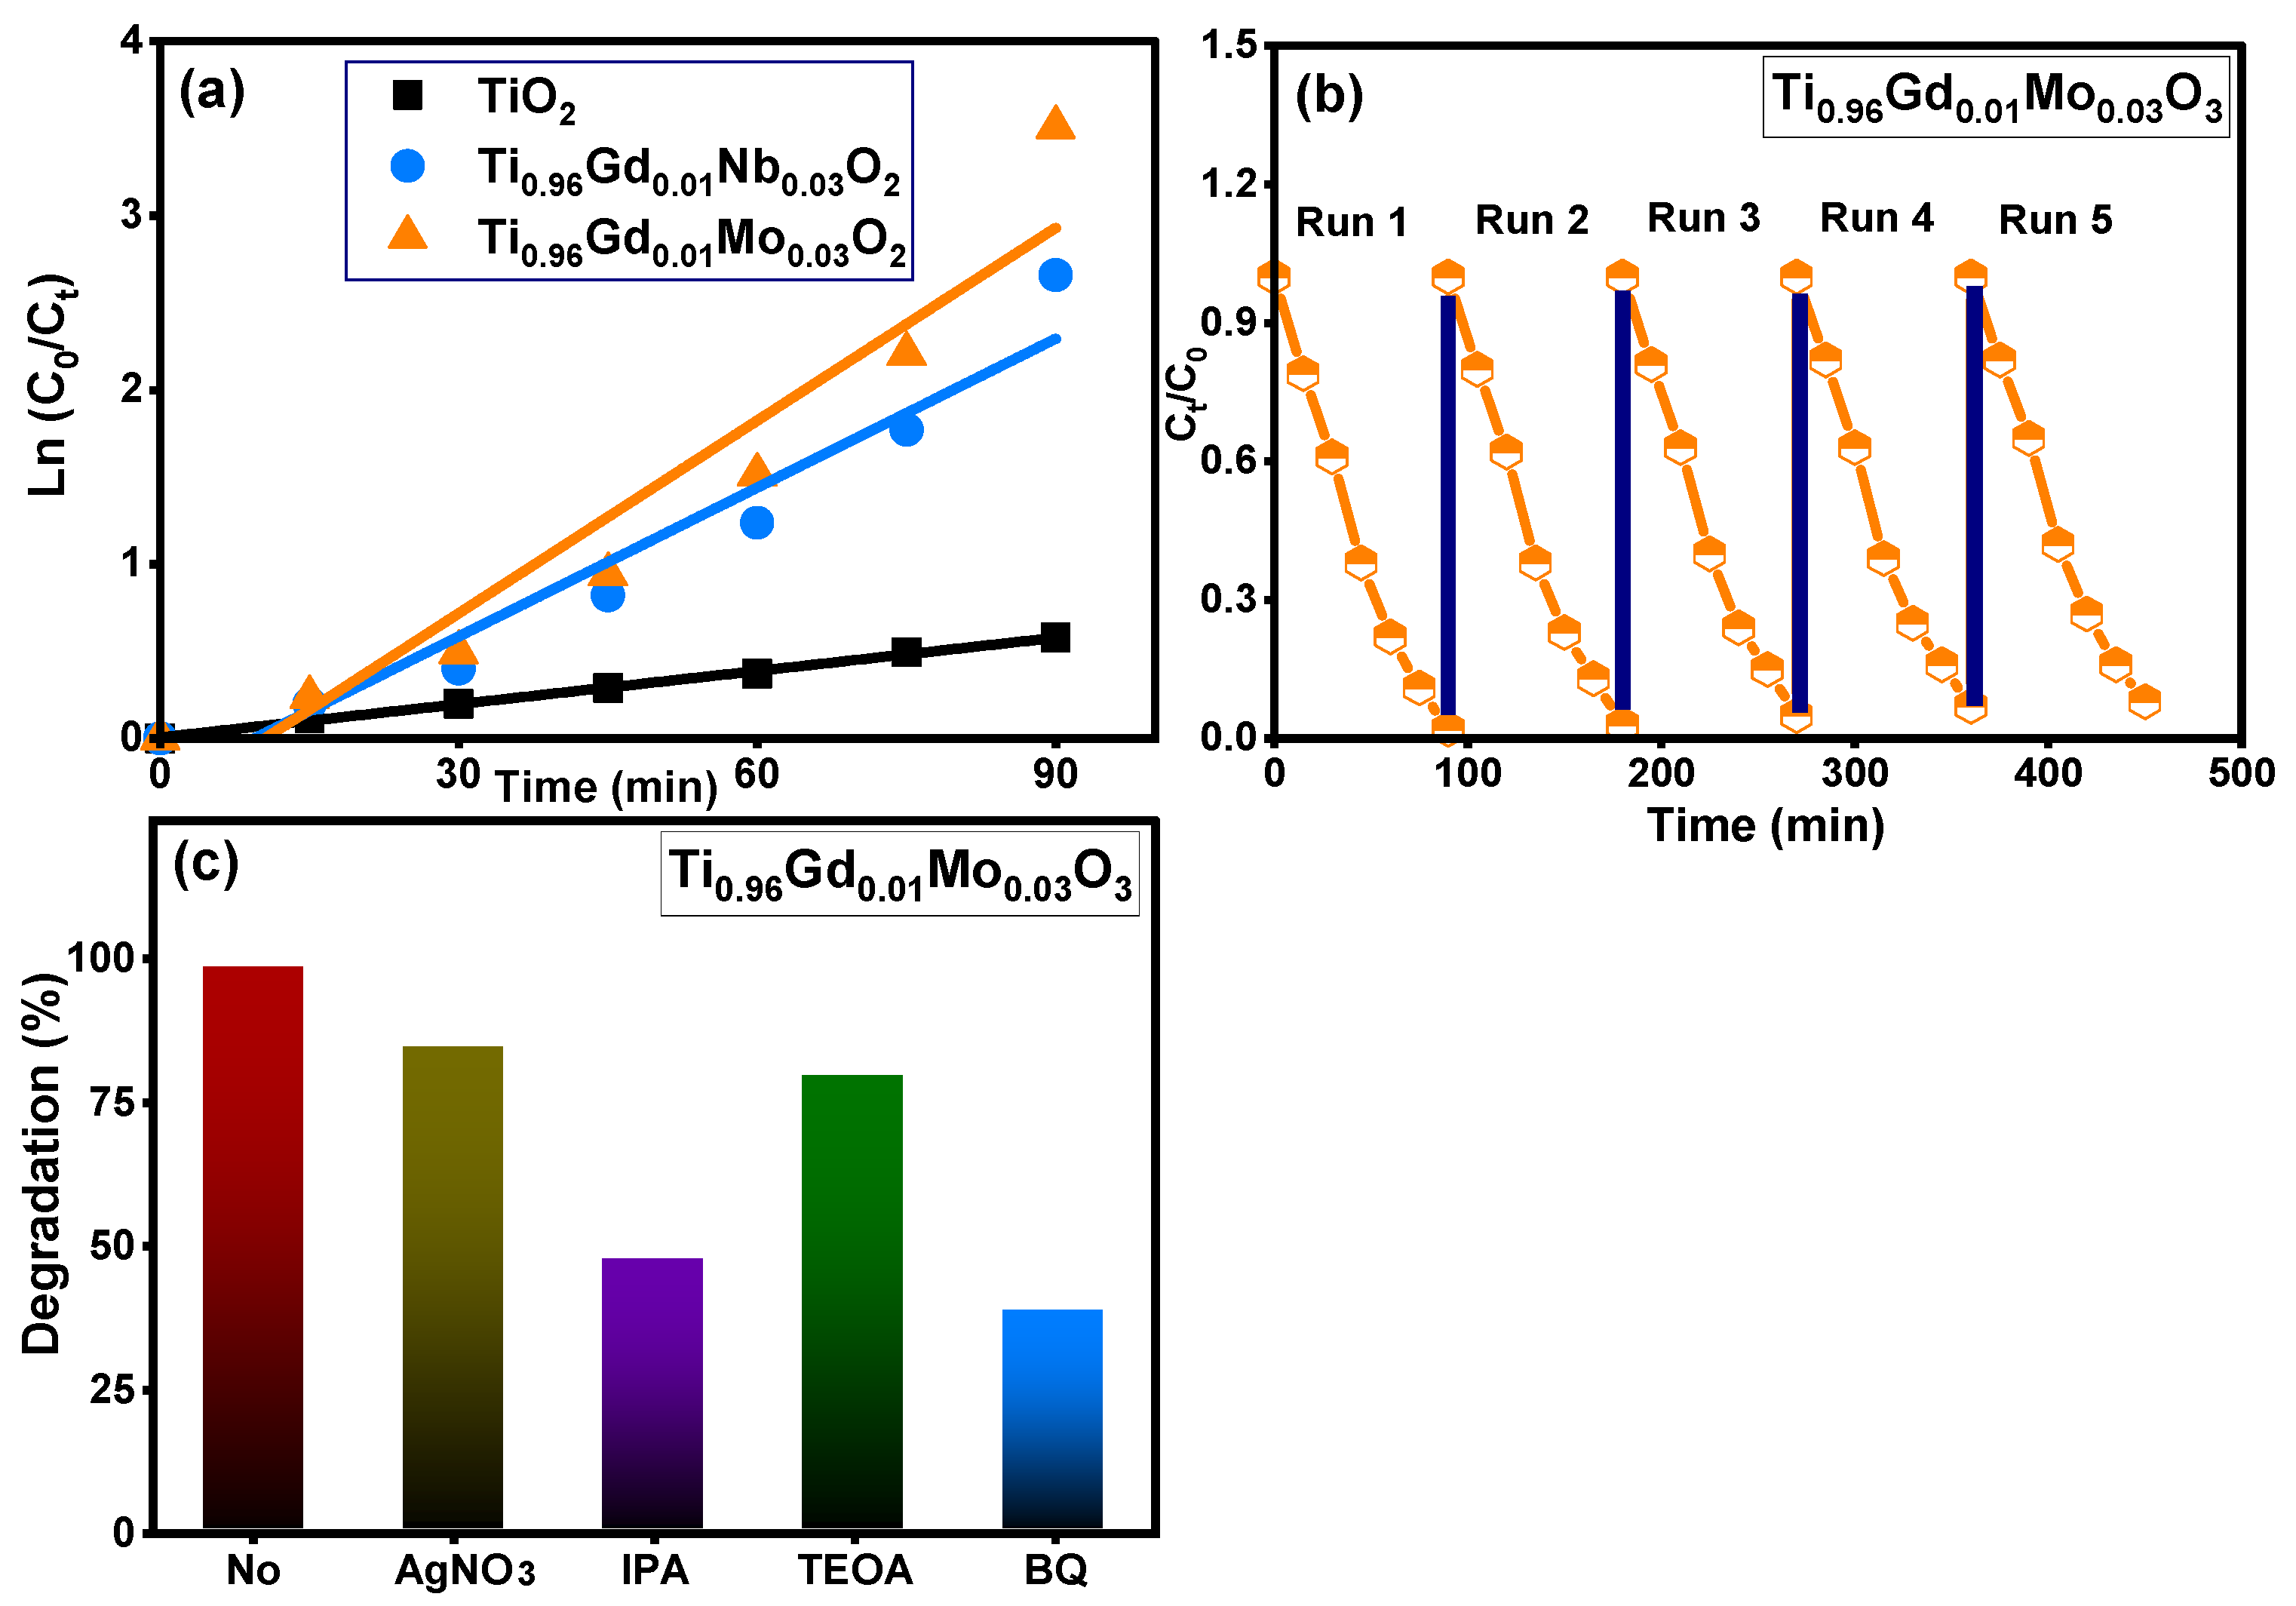
Figure 8 demonstrates the absorbance performance of 20 mg/L reactive yellow 145 solution in the presence of pure TiO2, Ti0.96Gd0.01Nb0.03O2, and Ti0.96Gd0.01Mo0.03O2 catalysts over an irradiation time of 90 min under sunlight energy. Initial adsorption measurements under dark conditions for all samples for 40 min confirm their insignificant effects (3–5%) on the elimination of the reactive yellow dye. Under irradiation, the absorbance curve shows a low decrease in the case of the pure TiO2 catalyst, with maximum efficiency of 44% after 90 min. The performance was significantly better for the Ti0.96Gd0.01Nb0.03O2 and Ti0.96Gd0.01Mo0.03O2 catalysts, with total measured efficacies of 93% and 98% after 90 min of sunlight illumination, respectively. These high activities can be correlated to the broad absorption of visible light. In addition, the Gd3+, Nb5+, and Mo6+ ions can behave as active sites for trapping the electrons, which effectively inhibits charge carrier recombination (electron–hole pairing). As illustrated in Figure 9a, the kinetic plots of the reactive yellow 145 dye in the presence of TiO2, Ti0.96Gd0.01Nb0.03O2, and Ti0.96Gd0.01Mo0.03O2 verify that the reactions follow a linear pseudo-first order with R2 values of 0.99, 0.93, and 0.91, with an estimated rate constant equal to 0.0063, 0.028, and 0.037 min−1, respectively. The reusability performance was explored for the Ti0.96Gd0.01Mo0.03O2 catalyst, as the sample with the best sample activity toward 20 mg/L reactive yellow dye over five cycles, as shown in Figure 9b. After the degradation test, the catalyst was collected by centrifugation and dried at 80 °C to be used for the next degradation experiment. The estimated degradation efficacy was 98, 97, 95, 93, and 92% for five cycles, indicating the effective reuse properties of the Ti0.96Gd0.01Mo0.03O2 catalyst. The mechanism of the photodegradation process is mainly related to the active radicals; to detect these radicals, four different chemical agents [54] involving triethanolamine (TEOA), benzoquinone (BQ), AgNO3 and isopropyl alcohol (IPA) were used to attack the holes (h+), superoxide (O2−), electrons (e−), and hydroxyl (˙OH) species, respectively. The obtained results, presented in Figure 9c, show that the photocatalytic activity of Ti0.96Gd0.01Mo0.03O2 catalyst towards reactive yellow 145 dye was noticeably reduced after the addition of BQ and IPA, which confirmed that the O2− and ˙OH species were the fundamentals radicals in the depollution process.
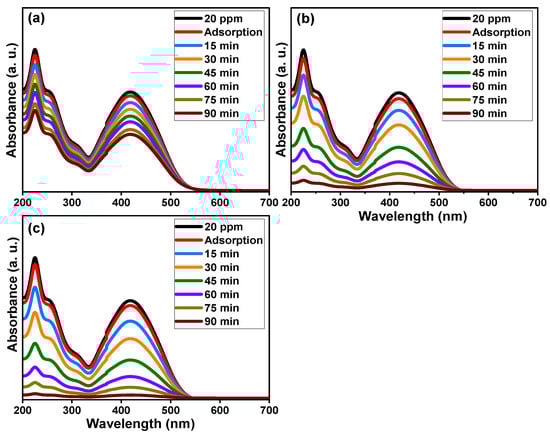
Figure 8.
Absorbance performance of reactive yellow 145 dye of (a) pure TiO2, (b) Ti0.96Gd0.01Nb0.03O2, and (c) Ti0.96Gd0.01Mo0.03O2 catalysts under sunlight.
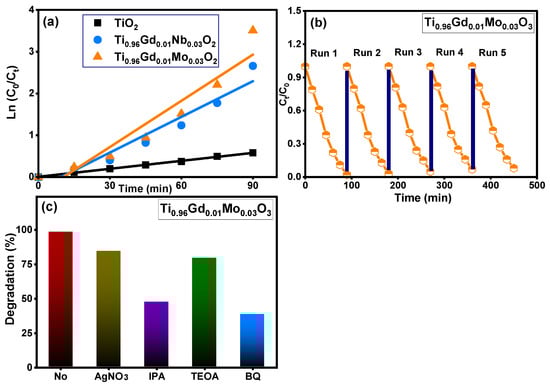
Figure 9.
Depicts (a): ln (C0/Ct) with time for all samples, (b): reusability (c): effective radicals test for Ti0.96Gd0.01Mo0.03O2 catalyst.
The relation between the concentration of the reactive yellow 145 dye and the photodegradation efficiency of Ti0.96Gd0.01Mo0.03O2 catalyst was shown in Figure 10a. At dye concentration of 10 mg/L, Ti0.96Gd0.01Mo0.03O2 catalyst reveals a photodegradation activity of ~100 after 40 min of sunlight irradiation while at 20 mg/L it exhibits a photodegradation efficiency of 98% after 90 min. In case concentration of 30, 40 and 50 mg/L, this catalyst has photodegradation efficiencies of 87, 76 and 63% after 90 min, respectively. Figure 10b shows the outcomes of the total organic carbon (TOC) study of reactive yellow 145 dye for Ti0.96Gd0.01Mo0.03O2 catalyst. The TOC examination was performed to study the mineralization performance of reactive yellow 145 dye via the photocatalytic process. The achieved findings verify that the rate of TOC removal increased with the irradiation time, reaching 95% after 105 min, indicating the full photodegradation of reactive yellow 145 dye by the Ti0.96Gd0.01Mo0.03O2 catalyst.
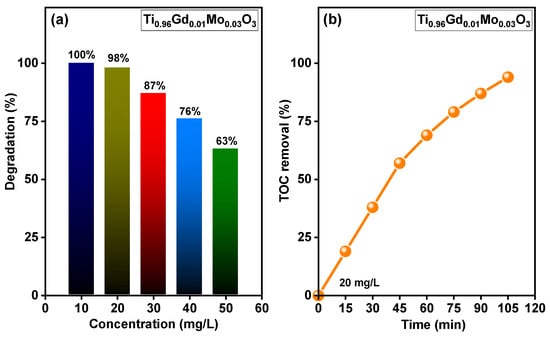
Figure 10.
Displays (a) effect of concentration of reactive yellow 145 on the photodegradation efficiency of Ti0.96Gd0.01Mo0.03O2 catalyst and (b) TOC removal rate of reactive yellow 145 over time for Ti0.96Gd0.01Mo0.03O2 catalyst.
The photocatalytic activity of the Ti0.96Gd0.01Mo0.03O2 catalyst was tested for another organic pollutant, brilliant green dye at concentration of 20 mg/L under sunlight irradiation. As demonstrated in Figure 11a, the maximum absorbance peak of brilliant green dye at 624 nm was efficiently decreased over time, with a final efficiency of 95% after 90 min. The kinetic plot of brilliant green dye degradation, Figure 11b, confirms the pseudo-first-order behavior (R2 = 0.97) with a measured rate constant of 0.0343 min−1. As demonstrated in Figure 11c, the Ti0.96Gd0.01Mo0.03O2 catalyst exhibited a high reusability for brilliant green dye, with efficiency of 95, 94, 91, 88, and 86% for five repeated tests, respectively. The scavenger tests reveal that O2˙− and ˙OH radicals were essential for the degradation reaction of brilliant green dye, as shown in Figure 11d.
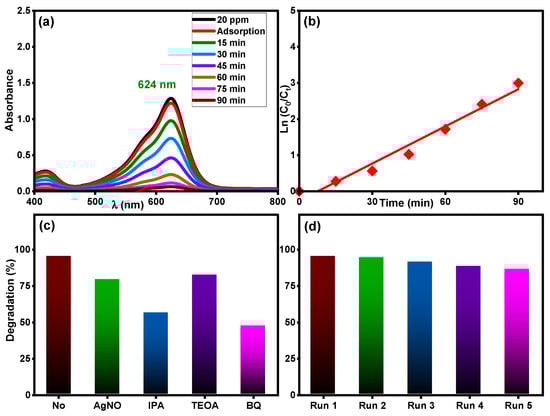
Figure 11.
(a) Absorbance performance of 20 mg/L brilliant green dye, (b) ln (C0/Ct) over time, (c) effective radicals test, and (d) reusability of Ti0.96Gd0.01Mo0.03O2 catalyst.
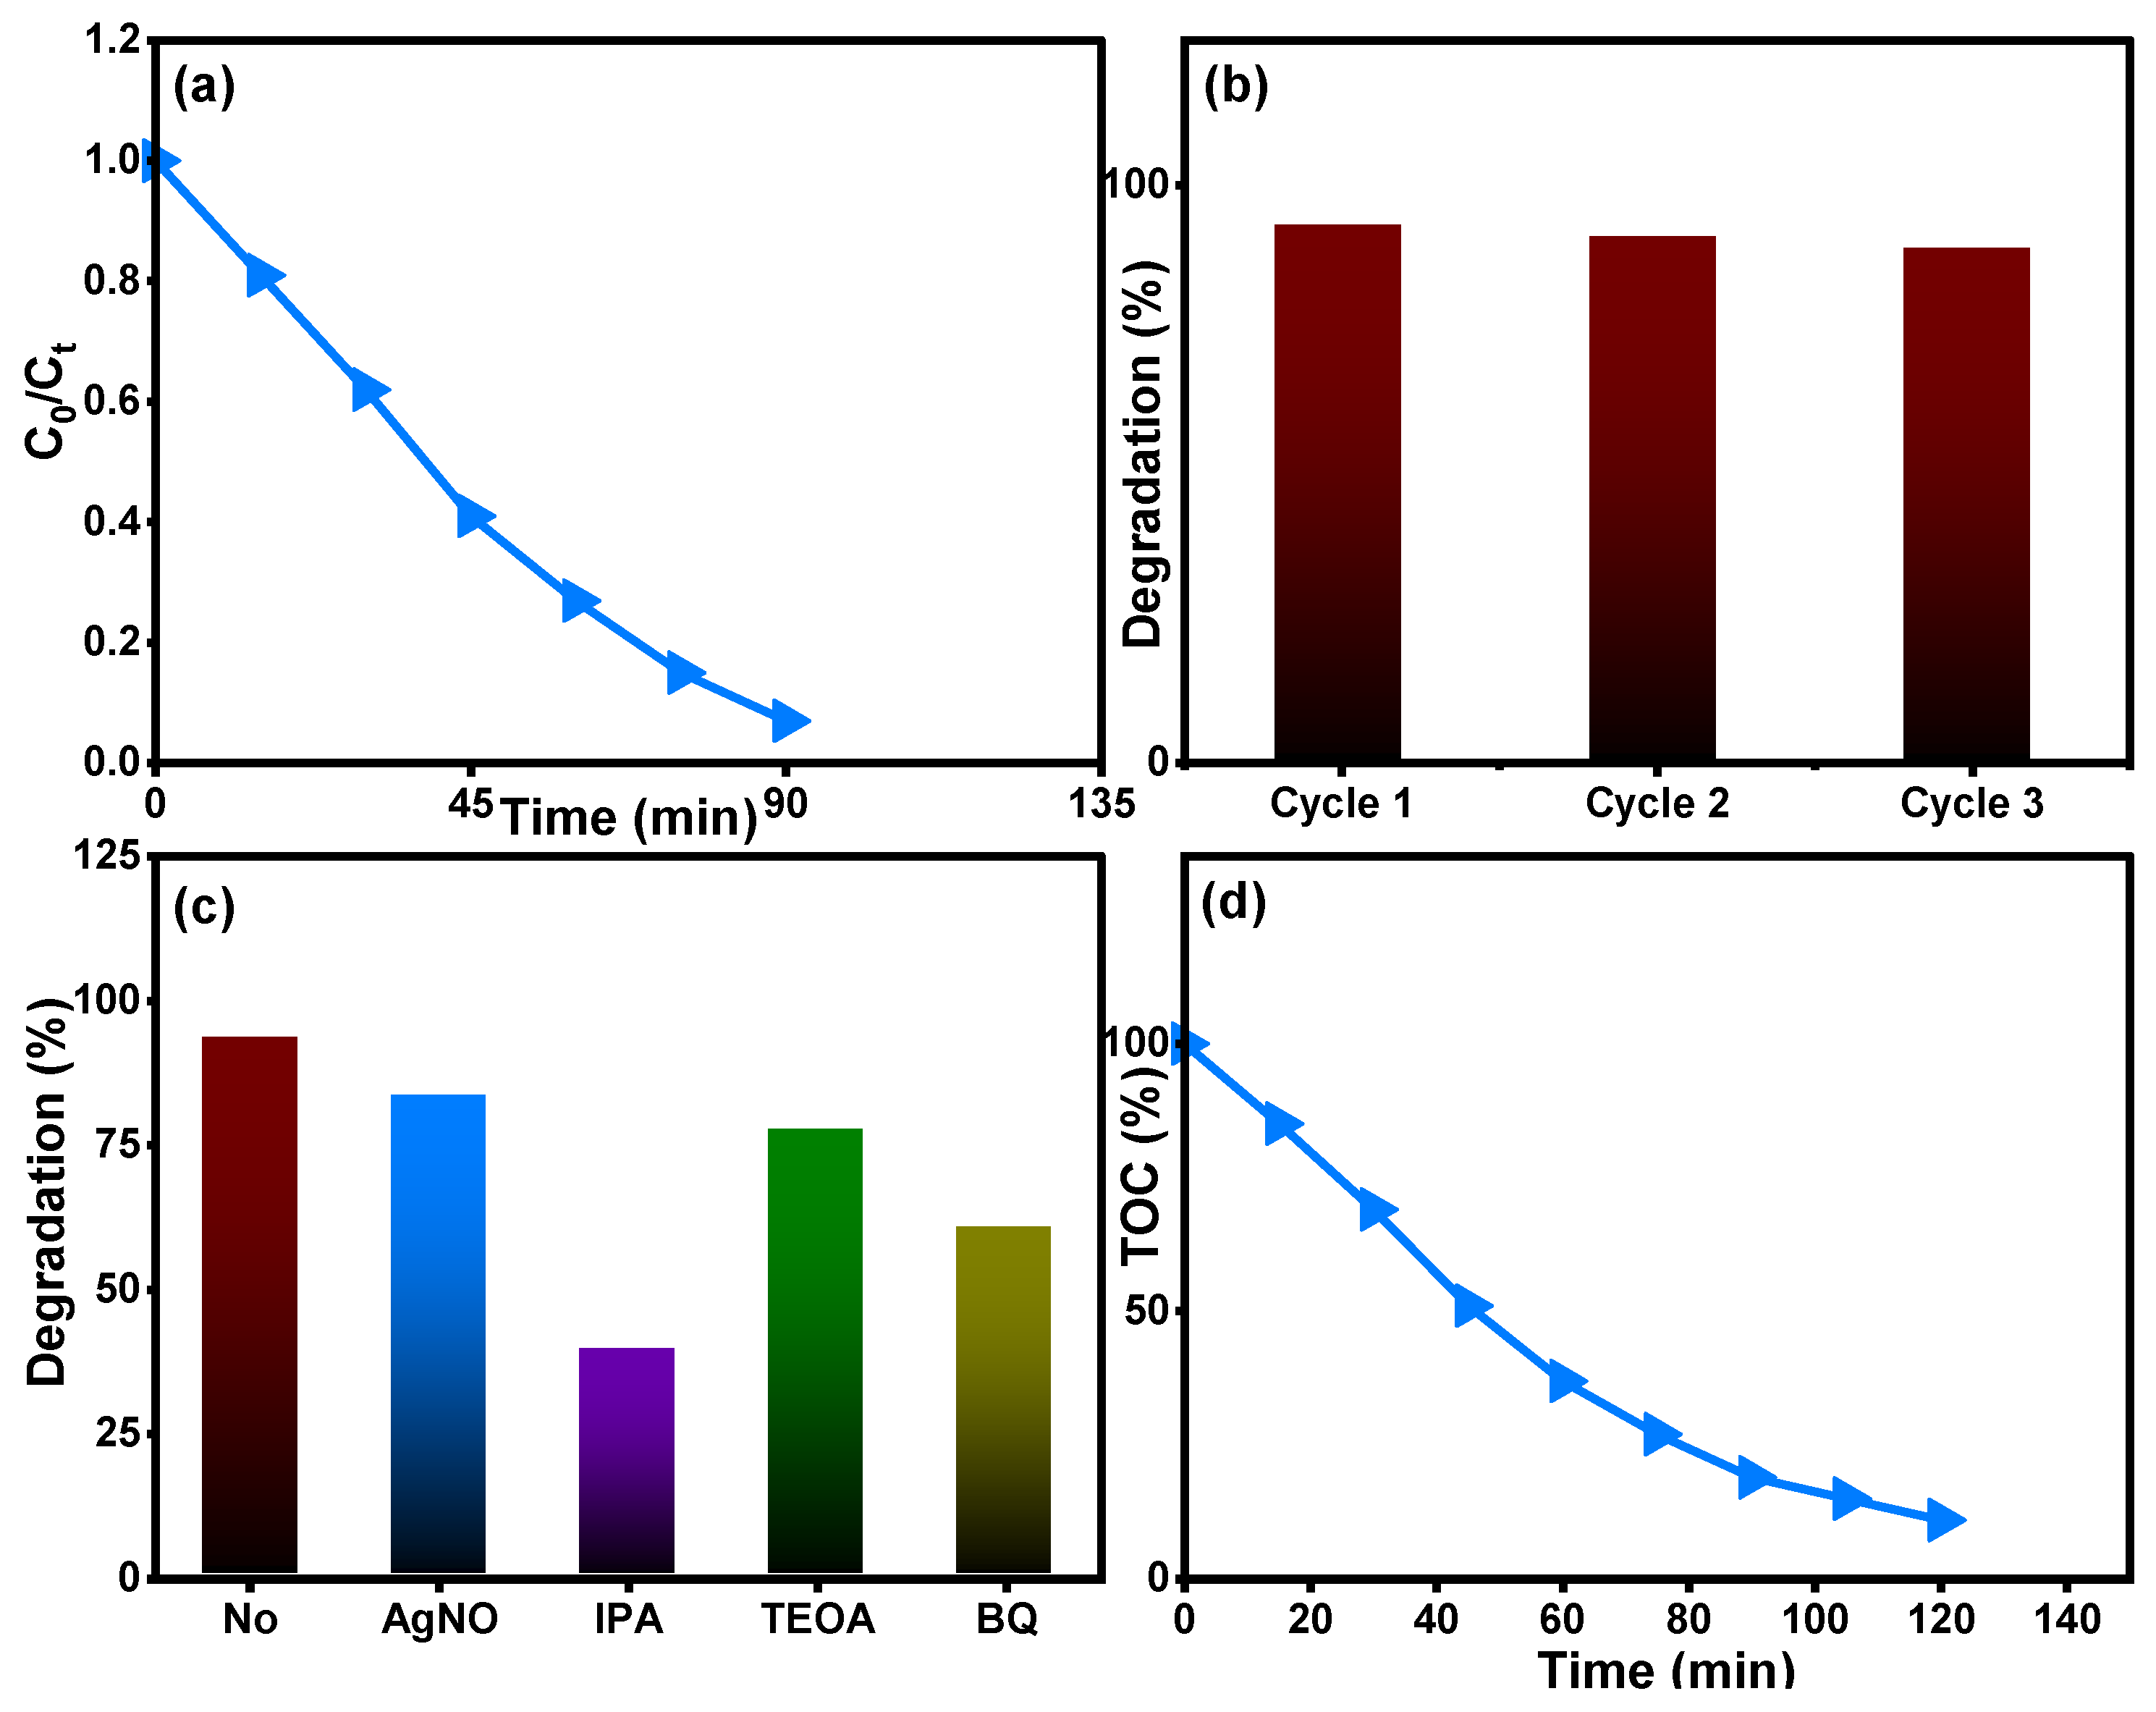
Figure 12 depicts the removal properties of the Ti0.96Gd0.01Mo0.03O2 catalyst for 20 mg/L amoxicillin antibiotic. The relation between C0/Ct over time shows that the Ti0.96Gd0.01Mo0.03O2 catalyst has a photocatalytic activity of 93% with an irradiation time of 90 min (Figure 12a). The recyclability experiment for the Ti0.96Gd0.01Mo0.03O2 catalyst with 20 mg/L amoxicillin confirmed its high degradation efficiency over three cycles (Figure 12b). The scavenger experiments revealed that ˙OH was the main radicals in the degradation reaction, followed by a moderate effect of O2˙− species, as depicted in Figure 12c. The total organic carbon analysis, Figure 12d, shows the effective mineralization of amoxicillin to CO2 and H2O with an efficiency of 87% after 120 min. The photodegradation or mineralization reaction for the used organic pollutants is basically related to the photo-generation of electrons from the valence band (VB) to the conduction band (CB) by light photons. These excited electrons can attack the oxygen molecules present in the waste solution to produce the O2˙− species while the holes (h+) connect to the water molecules to produce the ˙OH species. The active reaction occurring between mainly ˙OH and O2˙− radicals and reactive yellow 145, brilliant green, and amoxicillin contaminants yields CO2 and H2O, as shown below [22,25,28]:
Ti0.96Gd0.01Mo0.03O2 → visible light–UV photons → e− + h+ pairs
Gd3+ + e− → Gd2+
Mo6+ + e− → Mo5+
Gd2+, Mo5+ or e− + O2 → O2−
h+ + H2O → ˙OH + H+
(OH˙, O2˙−) → Reactive yellow 145, brilliant green, and amoxicillin → CO2 and H2O
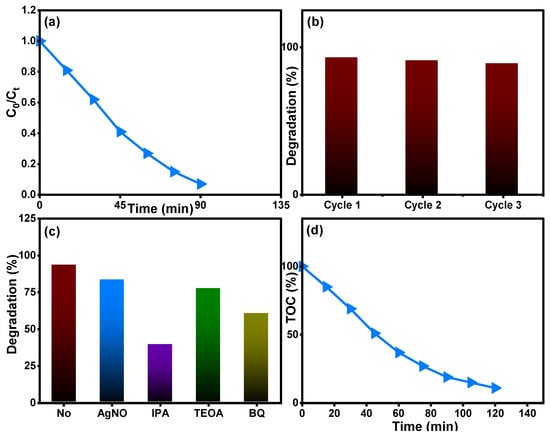
Figure 12.
Describes (a) (Ct/C0) over time, (b) reusability, (c) scavenger tests, and (d) TOC analysis of Ti0.96Gd0.01Mo0.03O2 catalyst for degradation of the antiobiotic amoxicillin.
2.5. Gas Sensing Properties
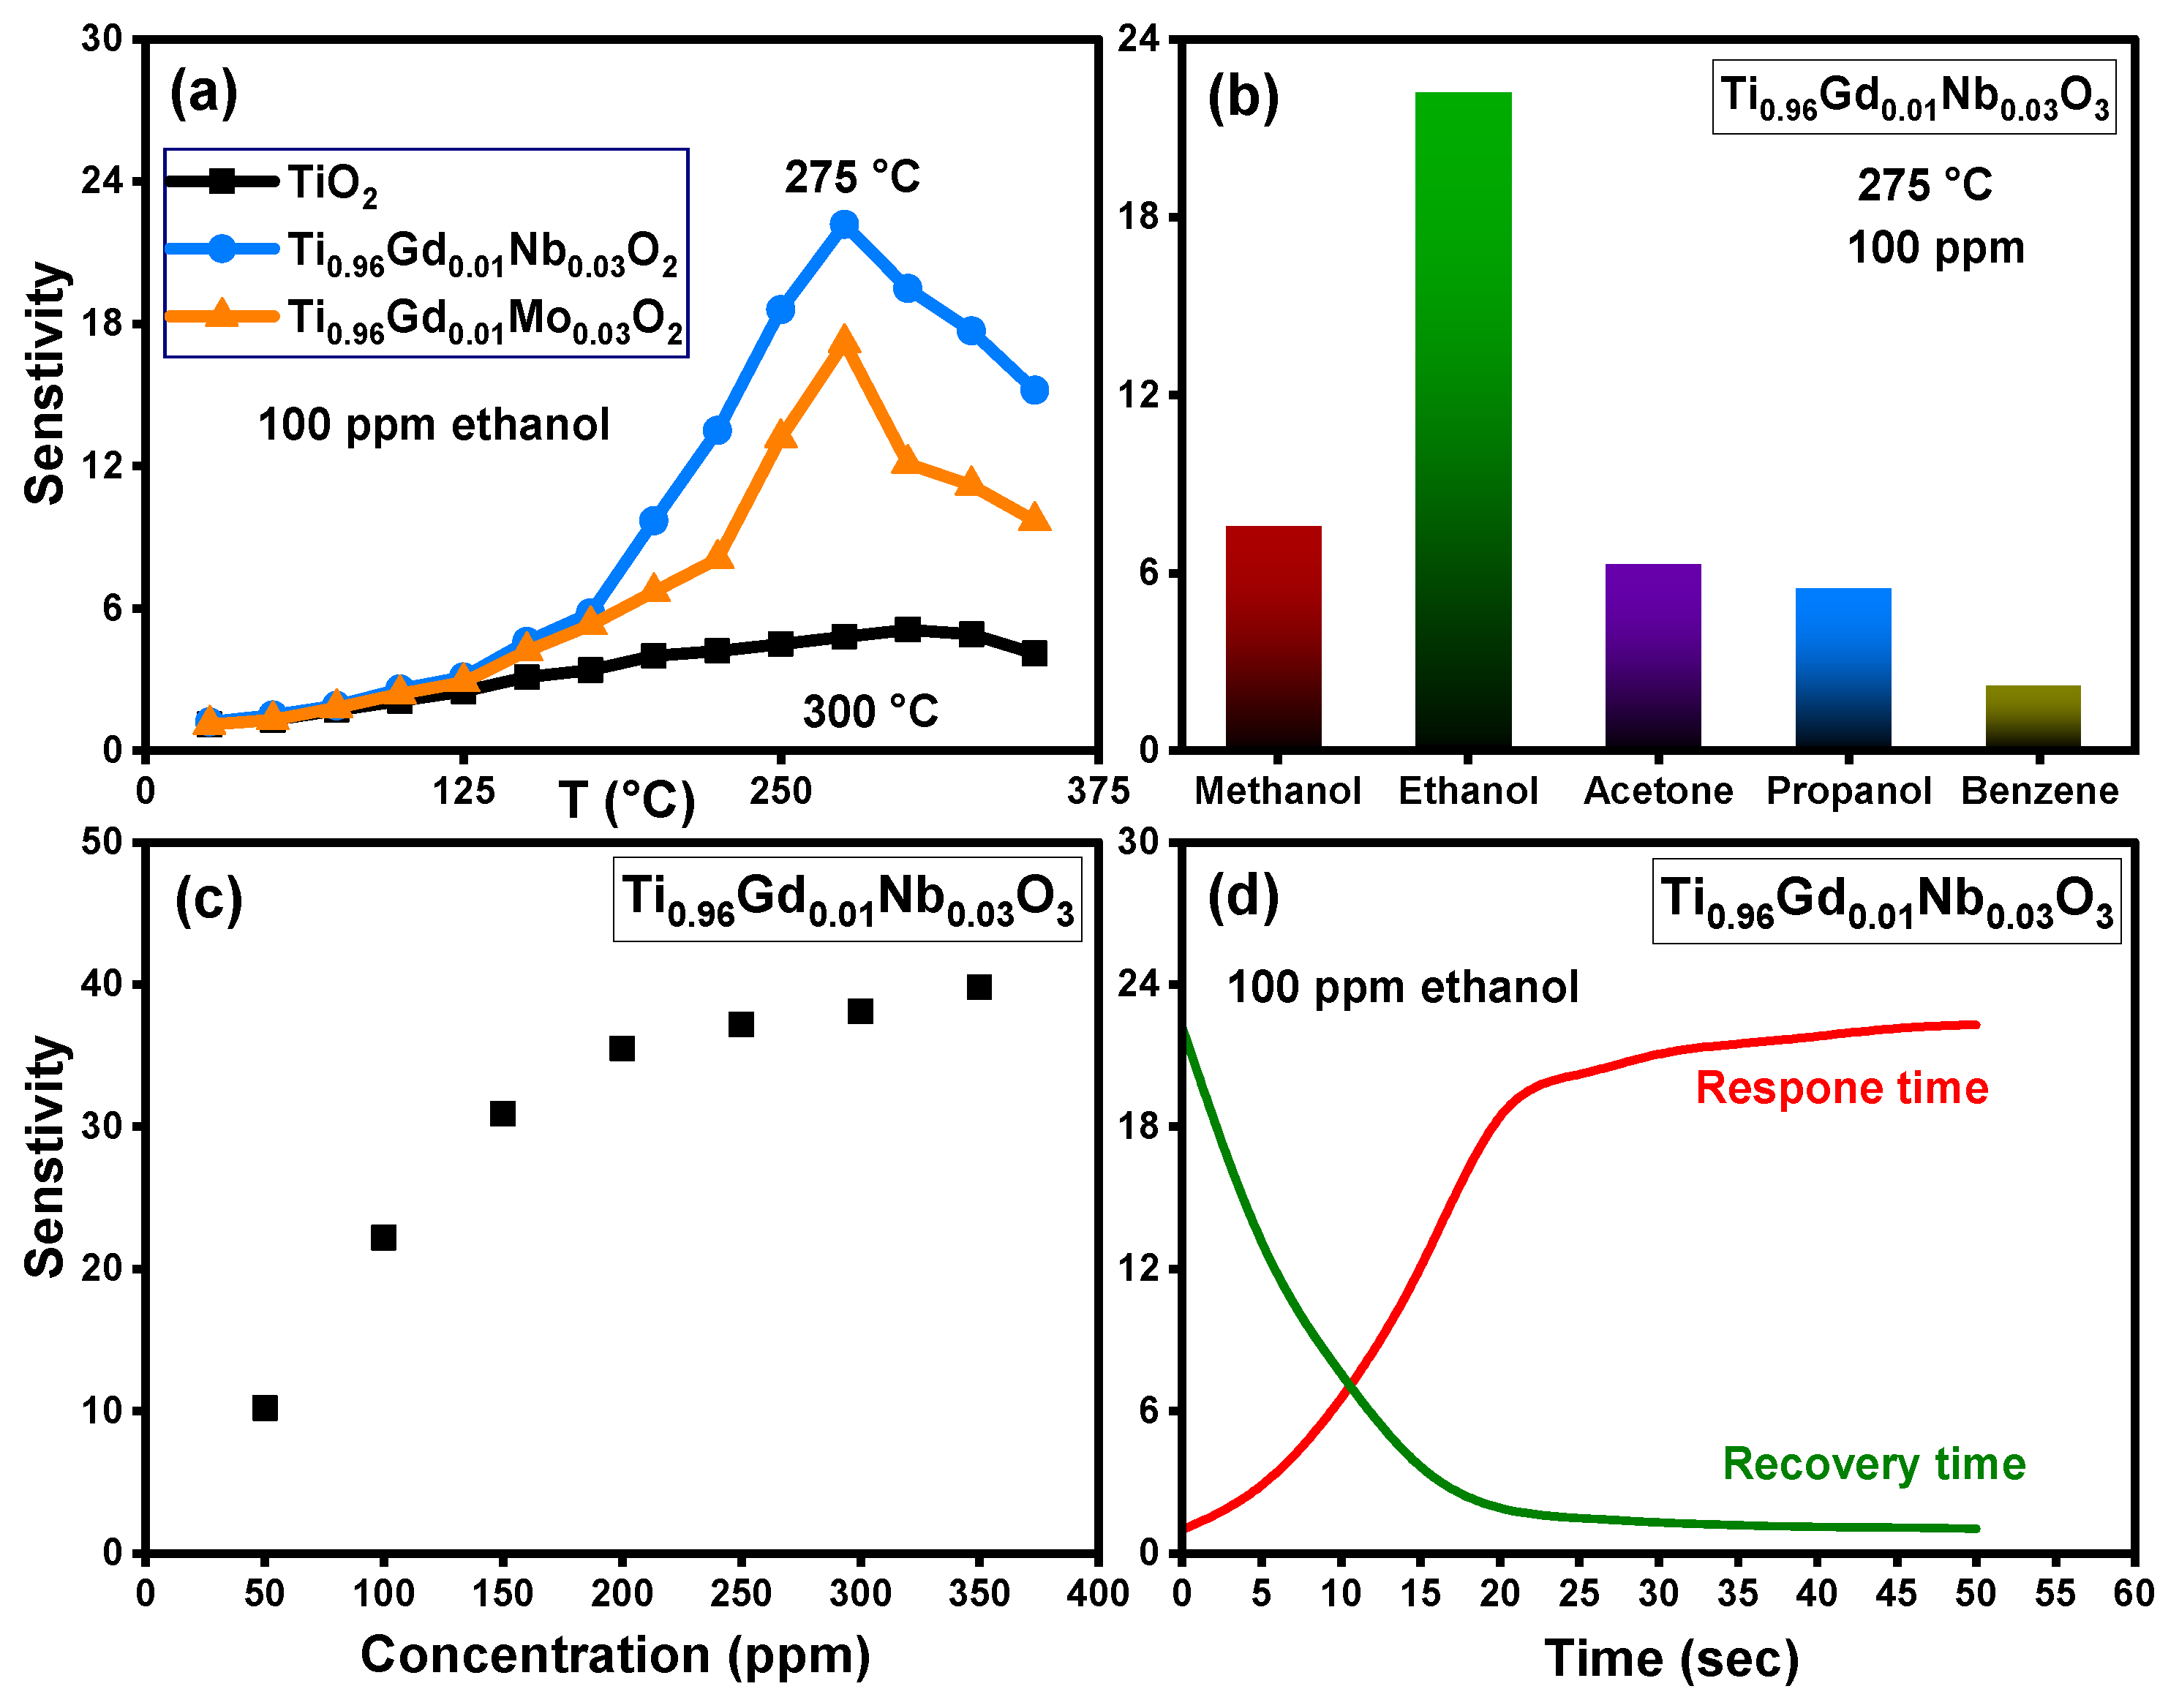
The sensing response of pure TiO2, Ti0.96Gd0.01Nb0.03O2, and Ti0.96Gd0.01Mo0.03O2 sensors toward different volatile organic compounds was tested at different temperatures. Figure 13a shows the relation between the sensitivity and temperature of pure TiO2, Ti0.96Gd0.01Nb0.03O2, and Ti0.96Gd0.01Mo0.03O2 sensors for ethanol gas at a concentration of 100 ppm. The temperature-sensitive performance of these samples clearly show that the sensitivity slowly increased with temperature for pure TiO2 and attained the maximum response of 5.1 at 300 °C. The gas sensing performance of Ti0.96Gd0.01Nb0.03O2 and Ti0.96Gd0.01Mo0.03O2 sensors presented enhanced response to ethanol gas, with a recorded maximum sensitivity value of 22.2 and 17.2 at an operating temperature of 275 °C, respectively. The addition of (Gd, Nb) ions enhances both the response value and the operating temperature. It appears that the existence of (Gd, Nb) ions enhances the reaction between the sensor surface and ethanol gas by improving the active sites and activation energy due to the reduced grain size. The selectivity of the Ti0.96Gd0.01Mo0.03O2 sensor was examined for different volatile organic compounds at a temperature of 275 °C and with equivalent concentrations of 100 ppm for all gases, as shown in Figure 13b. The results of this measurement indicate that the response values were 7.5, 22.2, 6.2, 5.4, and 2.1 for methanol, ethanol, acetone, propanol, and benzene, respectively. As a result, the Ti0.96Gd0.01Mo0.03O2 sensor possesses a good and selective response performance at 275 °C for ethanol gas. Figure 13c depicts the relation between the sensitivity and ethanol gas concentration detected by the Ti0.96Gd0.01Mo0.03O2 sensor at a working temperature of 275 °C. Linear performance of the sensitivity can be seen within the concentration range of 50–200 ppm; above this value, the sensitivity increased slowly. The response and recovery times of the sensor are essential parameters for practical use [55,56]. As demonstrated in Figure 13d, the Ti0.96Gd0.01Mo0.03O2 sensor has a response time nearly equal to 20 s and a recovery time of 15 s for 100 ppm ethanol gas. The mechanism of response to ethanol gas for the Ti0.96Gd0.01Mo0.03O2 sensor is principally related to the reaction between the adsorbed oxygen ions on sensor surface (O–, O2−) and the target gas (ethanol). At higher temperatures the adsorbed oxygen (O2) on the Ti0.96Gd0.01Mo0.03O2 sensor material changes to O– or O2− ions by capturing electrons, and the resistance increases [57,58]. After injection, the ethanol gas reacts with the O− or O2− ions on surface to liberate the electrons on the sensor, which reduces the resistance, leading to a high response. It seems that the presence of Gd3+ and Nb5+ ions facilitate this reaction, which enhances the sensitivity of Ti0.96Gd0.01Mo0.03O2 sensor. In this study, the results show that (Gd, Mo) is more effective for inducing the photocatalytic depollution properties of the TiO2 semiconductor while (Gd, Nb) is the best blend to reinforce its selective sensing performance towards ethanol vapor.
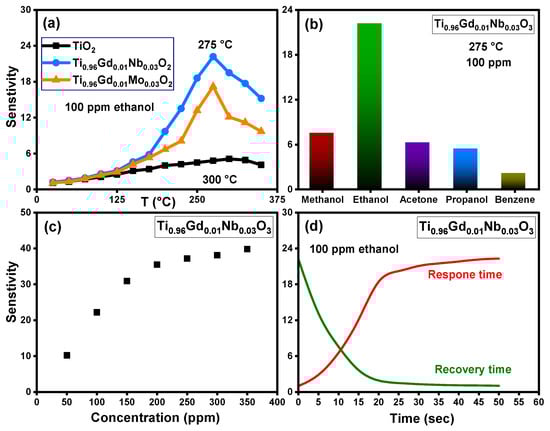
Figure 13.
Illustrating (a) sensitivity with temperature for 100 ppm ethanol gas of pure TiO2, Ti0.96Gd0.01Nb0.03O2, and Ti0.96Gd0.01Mo0.03O2 sensors, (b) sensitivity of Ti0.96Gd0.01Nb0.03O2 sensor towards different gases, (c) sensitivity–concentration curve, and (d) response and recovery times of 100 ppm ethanol.
3. Experimental
3.1. Synthesis of TiO2-Based Compositions
Titanium butoxide (Ti(OBu)₄, 98%), gadolinium nitrate (Gd(NO3)3, 99.9%), niobium pentachloride (NbCl5, 99%), molybdenum chloride (MoCl5, 99.9%), and ammonium hydroxide (NH4OH) were used as starting materials to synthesize pure, (Gd, Nb) and (Gd, Mo) codoped TiO2 compositions. For pure TiO2, 12.8 mL Ti(C4H9O)4 reagent was dissolved in 40 mL butanol with constant stirring for 0.5 h. Then, ammonium hydroxide (NH4OH, 33%) was dropped into the solution until a pH of 7.8 was reached, to yield the precipitate. To remove any contaminants or impurities, the obtained precipitate was washed by deionized water several times and then dried at 105 °C. In an electric furnace, the obtained powder was placed into crucible and calcined at 610 °C for 3.5 h. For (Gd, Nb) and (Gd, Mo) codoped TiO2 with compositions of Ti0.96Gd0.01Nb0.03O2 and Ti0.96Gd0.01Mo0.03O2, the same steps were applied, similar to the pure TiO2 sample, but NbCl5 and MoCl5 were dissolved into Ti(OBu)₄ solution before precipitation, as demonstrated in Table 1.

Table 1.
Detailed weights of chemical regents used in synthesis of pure TiO2, Ti0.96Gd0.01Nb0.03O2, and Ti0.96Gd0.01Mo0.03O2 powders.
3.2. Characterization and Measurements
X-ray diffraction (PANalytical), scanning electron microscope (Quanta 250), and diffuse reflectance JASCO spectrophotometer (V-570) techniques were used to characterize the synthesized powders. The Rietveld refinement method using Match Crystal Impact (version 3.15 Build 278) linked with FullProf software Suite (January2018_XP) was used to estimate the lattice parameter and unit cell volume of the samples. The photocatalytic degradation features of pure TiO2, Ti0.96Gd0.01Nb0.03O2, and Ti0.96Gd0.01Mo0.03O2 catalysts were measured against 20 mg/L reactive yellow 145 and 20 mg/L brilliant green dyes as well as 20 mg/L amoxicillin antibiotic under natural sunlight. First, 50 mg of TiO2, Ti0.96Gd0.01Nb0.03O2, or Ti0.96Gd0.01Mo0.03O2 catalyst was added to a beaker containing 100 mL of dye or antibiotic solution in the dark for 40 min (with constant stirring) to evaluate the adsorption factor and then the solution was placed in sunlight (July, 1–3 pm). Every 15 min, 4 mL of the irradiated solution was collected and centrifuged (11,000 rpm) to remove the particles of the powder. The photocatalytic degradation efficiency was determined by measuring the changes in the absorbance of the maximum peak of reactive yellow 145 (418 nm), brilliant green (624), and amoxicillin antibiotic (270 nm) over time. The photodegradation efficiency (PE) is expressed as follows:
where A0 and C0 mean the principal absorbance and concentration of reactive yellow 145, brilliant green, and amoxicillin, whereas At and Ct specify to the absorbance and concentration of reactive yellow 145, brilliant green, and amoxicillin during the different irradiation times. The measurements of the gas sensing properties of pure TiO2, Ti0.96Gd0.01Nb0.03O2, and Ti0.96Gd0.01Mo0.03O2 sensors in pellet form were carried out in a homemade gas chamber. Various gases (methanol, ethanol, propanol, acetone, and benzene) were inserted into the chamber by micro-syringe. The resistivity of pure TiO2, Ti0.96Gd0.01Nb0.03O2, and Ti0.96Gd0.01Mo0.03O2 gas sensors was measured by a Keithley device (model 2450) at different temperatures and the sensitivity value was calculated based on the formula:
where Ra is the resistance of TiO2, Ti0.96Gd0.01Nb0.03O2, and Ti0.96Gd0.01Mo0.03O2 sensors in air; and Rg is the resistance of TiO2, Ti0.96Gd0.01Nb0.03O2, and Ti0.96Gd0.01Mo0.03O2 sensors in the different gases.
Funding
This research received no external funding.
Institutional Review Board Statement
Not applicable.
Informed Consent Statement
Not applicable.
Data Availability Statement
The datasets are available on reasonable request.
Acknowledgments
The authors extend their appreciation to the Deanship of Scientific Research at King Faisal University for the logistic support of this work through Project No. (GRANT 4582).
Conflicts of Interest
The author declares no conflict of interest.
References
- Dhall, S.; Mehta, B.; Tyagi, A.; Sood, K. A review on environmental gas sensors: Materials and technologies. Sens. Int. 2021, 2, 100116. [Google Scholar] [CrossRef]
- Rahayu, F.; Mustafa, I.; Marjani; Rochman, F.; Qazi, R.A.; Zeb, K.; Ullah, N. Newly Isolated Ligninolytic Bacteria and Its Applications for Multiple Dye Degradation. Water Air Soil Pollut. 2023, 234, 359. [Google Scholar] [CrossRef]
- Iqbal, M.; Ibrar, A.; Ali, A.; Hussain, S.; Shad, S.; Ullah, S.; Alshahrani, T.; Hakami, J.; Khan, F.; Thebo, K.H. Facile Synthesis of Mn doped Bi2S3 Photocatalyst for Efficient Degradation of Organic Dye under Visible-Light Irradiation. J. Mol. Struct. 2022, 1267, 133598. [Google Scholar] [CrossRef]
- Rehman, F.; Memon, F.H.; Ullah, S.; Mazumder, M.A.J.; Al-Ahmed, A.; Khan, F.; Thebo, K.H. Recent Development in Laminar Transition Metal Dichalcogenides-Based Membranes Towards Water Desalination: A Review. Chem. Rec. 2022, 22, e202200107. [Google Scholar] [CrossRef] [PubMed]
- Garg, A.; Chopra, L. Dye Waste: A significant environmental hazard. Mater. Today Proc. 2022, 48, 1310–1315. [Google Scholar] [CrossRef]
- Lellis, B.; Fávaro-Polonio, C.Z.; Pamphile, J.A.; Polonio, J.C. Effects of textile dyes on health and the environment and bioremediation potential of living organisms. Biotechnol. Res. Innov. 2019, 3, 275–290. [Google Scholar] [CrossRef]
- Al-Tohamy, R.; Ali, S.S.; Li, F.; Okasha, K.M.; Mahmoud, Y.A.-G.; Elsamahy, T.; Jiao, H.; Fu, Y.; Sun, J. A critical review on the treatment of dye-containing wastewater: Ecotoxicological and health concerns of textile dyes and possible remediation approaches for environmental safety. Ecotoxicol. Environ. Saf. 2022, 231, 113160. [Google Scholar] [CrossRef] [PubMed]
- Hosny, N.M.; Gomaa, I.; Elmahgary, M.G. Adsorption of polluted dyes from water by transition metal oxides: A review. Appl. Surf. Sci. Adv. 2023, 15, 100395. [Google Scholar] [CrossRef]
- Senasu, T.; Youngme, S.; Hemavibool, K.; Nanan, S. Sunlight-driven photodegradation of oxytetracycline antibiotic by BiVO4 photocatalyst. J. Solid State Chem. 2021, 297, 122088. [Google Scholar] [CrossRef]
- Alkaykh, S.; Mbarek, A.; Ali-Shattle, E.E. Photocatalytic degradation of methylene blue dye in aqueous solution by MnTiO3 nanoparticles under sunlight irradiation. Heliyon 2020, 6, e03663. [Google Scholar] [CrossRef] [PubMed]
- Atri, A.; Echabaane, M.; Bouzidi, A.; Harabi, I.; Soucase, B.M.; Ben Chaâbane, R. Green synthesis of copper oxide nanoparticles using Ephedra Alata plant extract and a study of their antifungal, antibacterial activity and photocatalytic performance under sunlight. Heliyon 2023, 9, e13484. [Google Scholar] [CrossRef] [PubMed]
- Moriomoto, T.; Oka, R.; Minagawa, K.; Masui, T. Novel near-infrared reflective black inorganic pigment based on cerium vanadate. RSC Adv. 2022, 12, 16570–16575. [Google Scholar] [CrossRef] [PubMed]
- Kumari, H.; Sonia; Suman; Ranga, R.; Chahal, S.; Devi, S.; Sharma, S.; Kumar, S.; Kumar, P.; Kumar, S.; et al. A Review on Photocatalysis Used for Wastewater Treatment: Dye Degradation. Water Air Soil Pollut. 2023, 234, 349. [Google Scholar] [CrossRef] [PubMed]
- Xu, J.; Shen, J.; Jiang, H.; Yu, X.; Qureshi, W.A.; Maouche, C.; Gao, J.; Yang, J.; Liu, Q. Progress and challenges in full spectrum photocatalysts: Mechanism and photocatalytic applications. J. Ind. Eng. Chem. 2023, 119, 112–129. [Google Scholar] [CrossRef]
- Li, Y.; Li, L.; Gong, Y.; Bai, S.; Ju, H.; Wang, C.; Xu, Q.; Zhu, J.; Jiang, J.; Xiong, Y. Towards full-spectrum photocatalysis: Achieving a Z-scheme between Ag2S and TiO2 by engineering energy band alignment with interfacial Ag. Nano Res. 2015, 8, 3621–3629. [Google Scholar] [CrossRef]
- Goulart, S.; Nieves, L.J.J.; Bó, A.G.D.; Bernardin, A.M. Sensitization of TiO2 nanoparticles with natural dyes extracts for photocatalytic activity under visible light. Dye Pigment 2020, 182, 108654. [Google Scholar] [CrossRef]
- Dodoo-Arhin, D.; Asiedu, T.; Agyei-Tuffour, B.; Nyankson, E.; Obada, D.; Mwabora, J. Photocatalytic degradation of Rhodamine dyes using zinc oxide nanoparticles. Mater. Today Proc. 2021, 38, 809–815. [Google Scholar] [CrossRef]
- Raizada, P.; Sudhaik, A.; Patial, S.; Hasija, V.; Khan, A.A.P.; Singh, P.; Gautam, S.; Kaur, M.; Nguyen, V.-H. Engineering nanostructures of CuO-based photocatalysts for water treatment: Current progress and future challenges. Arab. J. Chem. 2020, 13, 8424–8457. [Google Scholar] [CrossRef]
- Elango, G.; Roopan, S.M. Efficacy of SnO2 nanoparticles toward photocatalytic degradation of methylene blue dye. J. Photochem. Photobiol. B 2016, 155, 34–38. [Google Scholar] [CrossRef] [PubMed]
- Ijaz, M.; Zafar, M. Titanium dioxide nanostructures as efficient photocatalyst: Progress, challenges and perspective. Int. J. Energy Res. 2020, 45, 3569–3589. [Google Scholar] [CrossRef]
- Ge, Y.; Luo, H.; Huang, J.; Zhang, Z. Visible-light-active TiO2 photocatalyst for efficient photodegradation of organic dyes. Opt. Mater. 2020, 115, 111058. [Google Scholar] [CrossRef]
- Etacheri, V.; Di Valentin, C.; Schneider, J.; Bahnemann, D.; Pillai, S.C. Visible-light activation of TiO2 photocatalysts: Advances in theory and experiments. J. Photochem. Photobiol. C Photochem. Rev. 2015, 25, 1–29. [Google Scholar] [CrossRef]
- Ranjith, R.; Renganathan, V.; Chen, S.-M.; Selvan, N.S.; Rajam, P.S. Green synthesis of reduced graphene oxide supported TiO2/Co3O4 nanocomposite for photocatalytic degradation of methylene blue and crystal violet. Ceram. Int. 2019, 45, 12926–12933. [Google Scholar] [CrossRef]
- Huo, R.; Yang, J.-Y.; Liu, Y.-Q.; Liu, H.-F.; Li, X.; Xu, Y.-H. Preparation of W and N, S-codoped titanium dioxide with enhanced photocatalytic activity under visible light irradiation. Mater. Res. Bull. 2016, 76, 72–78. [Google Scholar] [CrossRef]
- Chobba, M.B.; Messaoud, M.; Weththimuni, M.L.; Bouaziz, J.; Licchelli, M.; De Leo, F.; Urzì, C. Preparation and characterization of photocatalytic Gd-doped TiO2 nanoparticles for water treatment. Environ. Sci. Pollut. Res. 2019, 26, 32734–32745. [Google Scholar] [CrossRef]
- Li, R.; Yang, J.; Xu, S.; Zhou, Y.; Wang, X.; Peng, H.; Du, J. Preparation of Gd-Doped TiO2 nanotube arrays by anodization method and its photocatalytic activity for Methyl orange degradation. Catalysts 2020, 10, 298. [Google Scholar] [CrossRef]
- Xu, J.; Ao, Y.; Fu, D.; Yuan, C. Synthesis of Gd-doped TiO2 nanoparticles under mild condition and their photocatalytic activity. Colloids Surfaces A Physicochem. Eng. Asp. 2009, 334, 107–111. [Google Scholar] [CrossRef]
- Bagwan, U.R.; Shaikh, I.N.; Malladi, R.S.; Harihar, A.L.; Hunagund, S.M. Effect of titanium dioxide and gadolinium dopants on photocatalytic behavior for acriflavine dye. J. Rare Earths 2018, 38, 234–240. [Google Scholar] [CrossRef]
- Wang, Z.; Zhu, L.; Wang, J.; Zhuang, R.; Mu, P.; Wang, J.; Yan, W. Advances in functional guest materials for resistive gas sensors. RSC Adv. 2022, 12, 24614–24632. [Google Scholar] [CrossRef] [PubMed]
- Jiang, L.; Lv, S.; Tang, W.; Zhao, L.; Wang, C.; Wang, J.; Wang, T.; Guo, X.; Liu, F.; Wang, C.; et al. YSZ-based acetone sensor using a Cd2SnO4 sensing electrode for exhaled breath detection in medical diagnosis. Sens. Actuators B Chem. 2021, 345, 130321. [Google Scholar] [CrossRef]
- Choi, N.-J.; Lee, Y.-S.; Kwak, J.-H.; Park, J.-S.; Park, K.-B.; Shin, K.-S.; Park, H.-D.; Kim, J.-C.; Huh, J.-S.; Lee, D.-D. Chemical warfare agent sensor using MEMS structure and thick film fabrication method. Sens. Actuators B 2005, 108, 177–183. [Google Scholar] [CrossRef]
- Vasiliev, A.; Malyshev, V. Sensors for the ultra-fast monitoring of explosive gas concentrations. Sens. Actuators B Chem. 2013, 189, 260–267. [Google Scholar] [CrossRef]
- Wang, Z.; Wang, Y.; Yan, J.; Liu, B.; Chen, Y.; Tian, Y. Metal–organic framework-based photonic crystal platforms for gas sensing: A review. Mater. Adv. 2022, 3, 6728–6741. [Google Scholar] [CrossRef]
- Souissi, R.; Bouricha, B.; Bouguila, N.; El Mir, L.; Labidi, A.; Abderrabba, M. Chemical VOC sensing mechanism of sol–gel ZnO pellets and linear discriminant analysis for instantaneous selectivity. RSC Adv. 2023, 13, 20651–20662. [Google Scholar] [CrossRef]
- Tan, Y.; Zhang, J. Highly sensitive ethanol gas sensors based on Co-doped SnO2 nanobelts and pure SnO2 nanobelts. Phys. E Low-Dimens. Syst. Nanostruct. 2023, 147, 115604. [Google Scholar] [CrossRef]
- Nur’Aini, A.; Oh, I. Volatile organic compound gas sensors based on methylammonium lead iodide perovskite operating at room temperature. RSC Adv. 2020, 10, 12982–12987. [Google Scholar] [CrossRef] [PubMed]
- Silva, E.A.; Braunger, M.L.; Gregori, A.; Olivati, C.A. Volatile organic compounds detection by electrical sensors using polyalkylthiophene-based Langmuir–Blodgett films. SN Appl. Sci. 2019, 1, 200. [Google Scholar] [CrossRef]
- Alzeer, J.; Hadeed, K.A. Ethanol and its Halal status in food industries. Trends Food Sci. Technol. 2016, 58, 14–20. [Google Scholar] [CrossRef]
- Din, S.U.; Haq, M.U.; Khatoon, R.; Chen, X.; Li, L.; Zhang, M.; Zhu, L. A novel ethanol gas sensor based on α-Bi2Mo3O12/Co3O4 nanotube-decorated particles. RSC Adv. 2020, 10, 21940–21953. [Google Scholar] [CrossRef] [PubMed]
- Li, J.; Ding, Q.; Mo, X.; Zou, Z.; Cheng, P.; Li, Y.; Sun, K.; Fu, Y.; Wang, Y.; He, D. A highly stable and sensitive ethanol sensor based on Ru-decorated 1D WO3 nanowires. RSC Adv. 2021, 11, 39130–39141. [Google Scholar] [CrossRef]
- Wang, Q.; Bai, J.; Hu, Q.; Hao, J.; Cheng, X.; Li, J.; Xie, E.; Wang, Y.; Pan, X. W-doped NiO as a material for selective resistive ethanol sensors. Sens. Actuators B Chem. 2020, 308, 127668. [Google Scholar] [CrossRef]
- Jahanshahi, P.; Wei, Q.; Jie, Z.; Zalnezhad, E. Designing a Non-invasive Surface Acoustic Resonator for Ultra-high Sensitive Ethanol Detection for an On-the-spot Health Monitoring System. Biotechnol. Bioprocess Eng. 2018, 23, 394–404. [Google Scholar] [CrossRef]
- Nechita, V.; Schoonman, J.; Musat, V. Ethanol and methanol sensing characteristics of Nb-doped TiO2 porous thin films. Phys. Status Solidi 2012, 209, 153–159. [Google Scholar] [CrossRef]
- Garzella, C.; Bontempi, E.; Depero, L.; Vomiero, A.; Della Mea, G.; Sberveglieri, G. Novel selective ethanol sensors: W/TiO2 thin films by sol–gel spin-coating. Sens. Actuators B Chem. 2003, 93, 495–502. [Google Scholar] [CrossRef]
- Phanichphant, S.; Liewhiran, C.; Wetchakun, K.; Wisitsoraat, A.; Tuantranont, A. Flame-Made Nb-Doped TiO2 Ethanol and Acetone Sensors. Sensors 2011, 11, 472–484. [Google Scholar] [CrossRef] [PubMed]
- Choi, J.; Sudhagar, P.; Lakshmipathiraj, P.; Lee, J.W.; Devadoss, A.; Lee, S.; Song, T.; Hong, S.; Eito, S.; Terashima, C.; et al. Three-dimensional Gd-doped TiO2 fibrous photoelectrodes for efficient visible light-driven photocatalytic performance. RSC Adv. 2014, 4, 11750–11757. [Google Scholar] [CrossRef]
- Kaleji, B.K.; Sarraf-Mamoory, R.; Fujishima, A. Influence of Nb dopant on the structural and optical properties of nanocrystalline TiO2 thin films. Mater. Chem. Phys. 2012, 132, 210–215. [Google Scholar] [CrossRef]
- Wang, S.; Bai, L.; Sun, H.; Jiang, Q.; Lian, J. Structure and photocatalytic property of Mo-doped TiO2 nanoparticles. Powder Technol. 2013, 244, 9–15. [Google Scholar] [CrossRef]
- Karunakaran, C.; Vinayagamoorthy, P.; Jayabharathi, J. Enhanced photocatalytic activity of magnetically separable bactericidal CuFe2O4-embedded Ag-deposited ZnO nanosheets. RSC Adv. 2016, 6, 1782–1791. [Google Scholar] [CrossRef]
- Gorgani, M.; Kaleji, B.K. Structural, photocatalytic and surface analysis of Nb/Ag codoped TiO2 mesoporous nanoparticles. J. Sol-Gel Sci. Technol. 2020, 96, 728–741. [Google Scholar] [CrossRef]
- Wang, Z.; Li, J.; Tang, F.; Lin, J.; Jin, Z. Polydopamine nanotubes-templated synthesis of TiO2 and its photocatalytic performance under visible light. RSC Adv. 2017, 7, 23535–23542. [Google Scholar] [CrossRef]
- DeSario, P.A.; Graham, M.E.; Gelfand, R.M.; Gray, K.A. The effect of Nb substitution on synthesis and photo-response of TiO2 thin films prepared by direct current magnetron sputtering. Thin Solid Films 2011, 519, 3562–3568. [Google Scholar] [CrossRef]
- Huang, J.-G.; Guo, X.-T.; Wang, B.; Li, L.-Y.; Zhao, M.-X.; Dong, L.-L.; Liu, X.-J.; Huang, Y.-T. Synthesis and Photocatalytic Activity of Mo-Doped TiO2 Nanoparticles. J. Spectrosc. 2015, 2015, 681850. [Google Scholar] [CrossRef]
- Jiang, G.; Wei, Z.; Chen, H.; Du, X.; Li, L.; Liu, Y.; Huang, Q.; Chen, W. Preparation of novel carbon nanofibers with BiOBr and AgBr decoration for the photocatalytic degradation of rhodamine B. RSC Adv. 2015, 5, 30433–30437. [Google Scholar] [CrossRef]
- Souissi, R.; Bouguila, N.; Bouricha, B.; Vázquez-Vázquez, C.; Bendahan, M.; Labidi, A. Thickness effect on VOC sensing properties of sprayed In2S3 films. RSC Adv. 2020, 10, 18841–18852. [Google Scholar] [CrossRef] [PubMed]
- Eom, N.S.A.; Cho, H.-B.; Lim, H.-R.; Hwang, T.-Y.; Song, Y.; Choa, Y.-H. Ultrasensitive detection of low-ppm H2S gases based on palladium-doped porous silicon sensors. RSC Adv. 2018, 8, 29995–30001. [Google Scholar] [CrossRef] [PubMed]
- Poloju, M.; Jayababu, N.; Reddy, M.R. Improved gas sensing performance of Al doped ZnO/CuO nanocomposite based ammonia gas sensor. Mater. Sci. Eng. B 2018, 227, 61–67. [Google Scholar] [CrossRef]
- Hussain, S.; Amu-Darko, J.N.O.; Wang, M.; Alothman, A.A.; Ouladsmane, M.; Aldossari, S.A.; Khan, M.S.; Qiao, G.; Liu, G. CuO-decorated MOF derived ZnO polyhedral nanostructures for exceptional H2S gas detection. Chemosphere 2023, 317, 137827. [Google Scholar] [CrossRef] [PubMed]


Disclaimer/Publisher’s Note: The statements, opinions and data contained in all publications are solely those of the individual author(s) and contributor(s) and not of MDPI and/or the editor(s). MDPI and/or the editor(s) disclaim responsibility for any injury to people or property resulting from any ideas, methods, instructions or products referred to in the content. |
© 2023 by the author. Licensee MDPI, Basel, Switzerland. This article is an open access article distributed under the terms and conditions of the Creative Commons Attribution (CC BY) license (https://creativecommons.org/licenses/by/4.0/).