
Simple Donor–π–Acceptor Compounds Exhibiting Aggregation-Induced Emission as Hidden Fingerprints Detecting Agents

Abstract
:1. Introduction
2. Results and Discussion
2.1. DFT Calculations
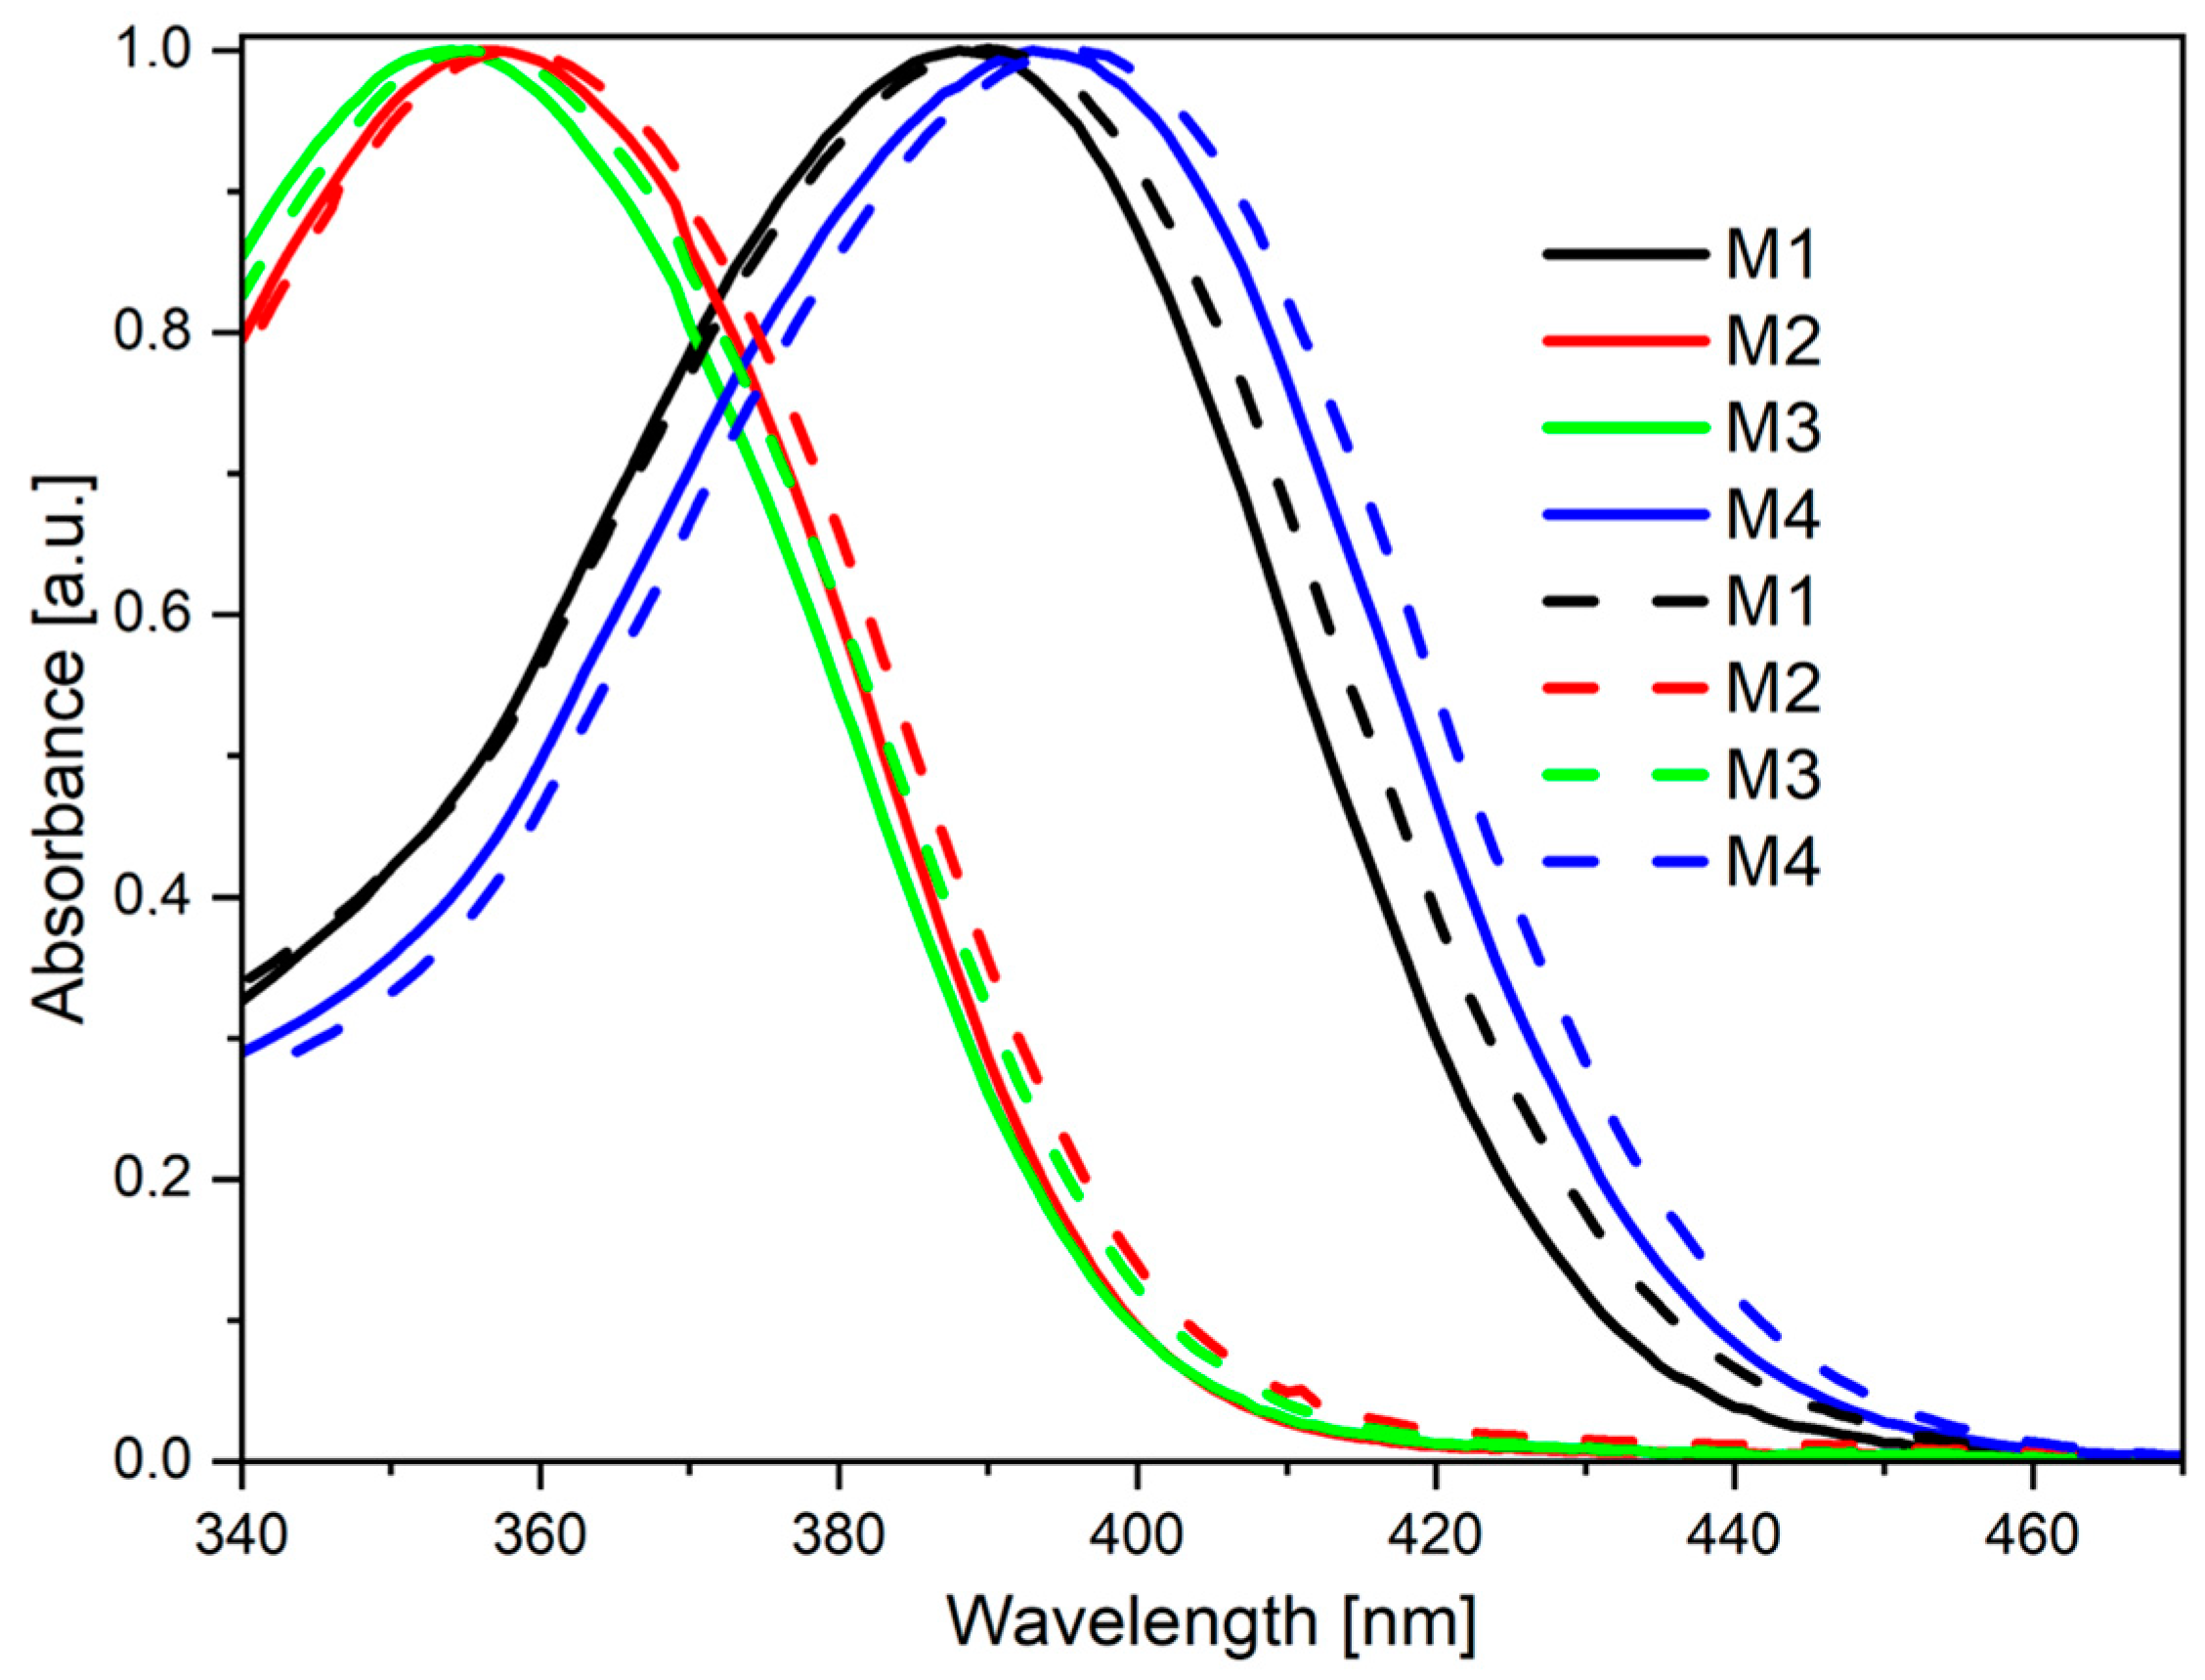
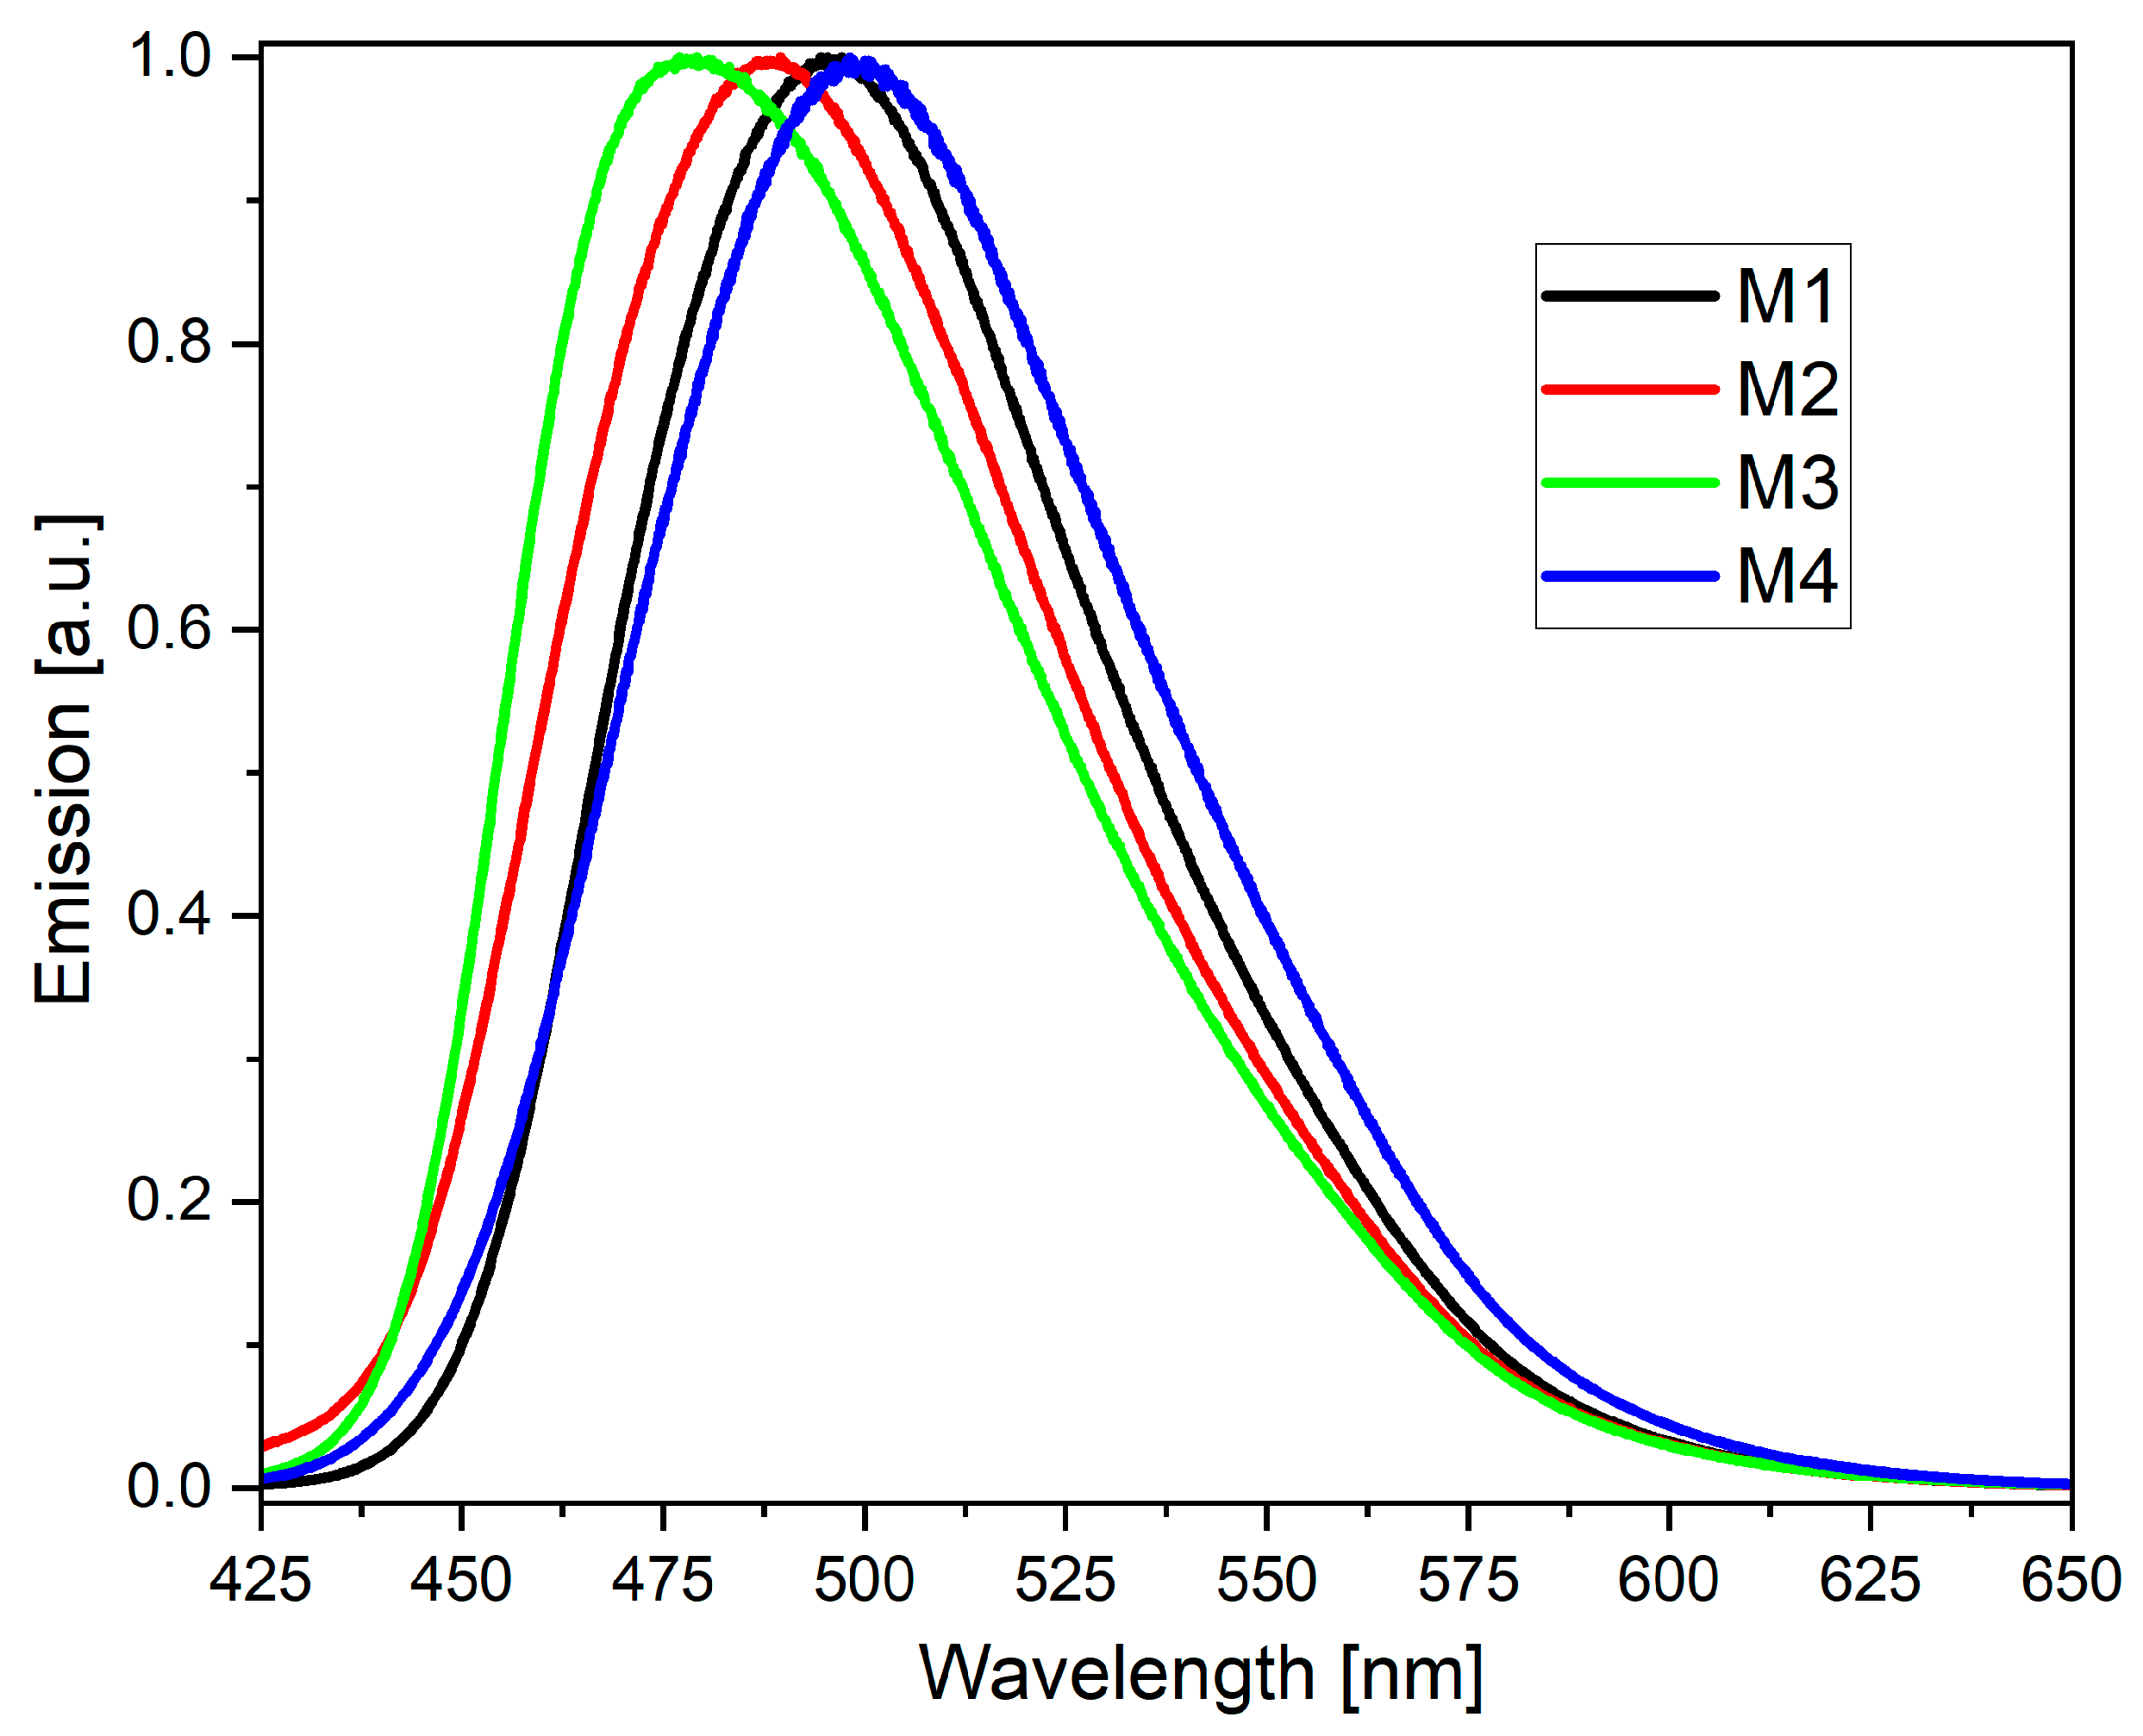
2.2. Photophysical Characterization
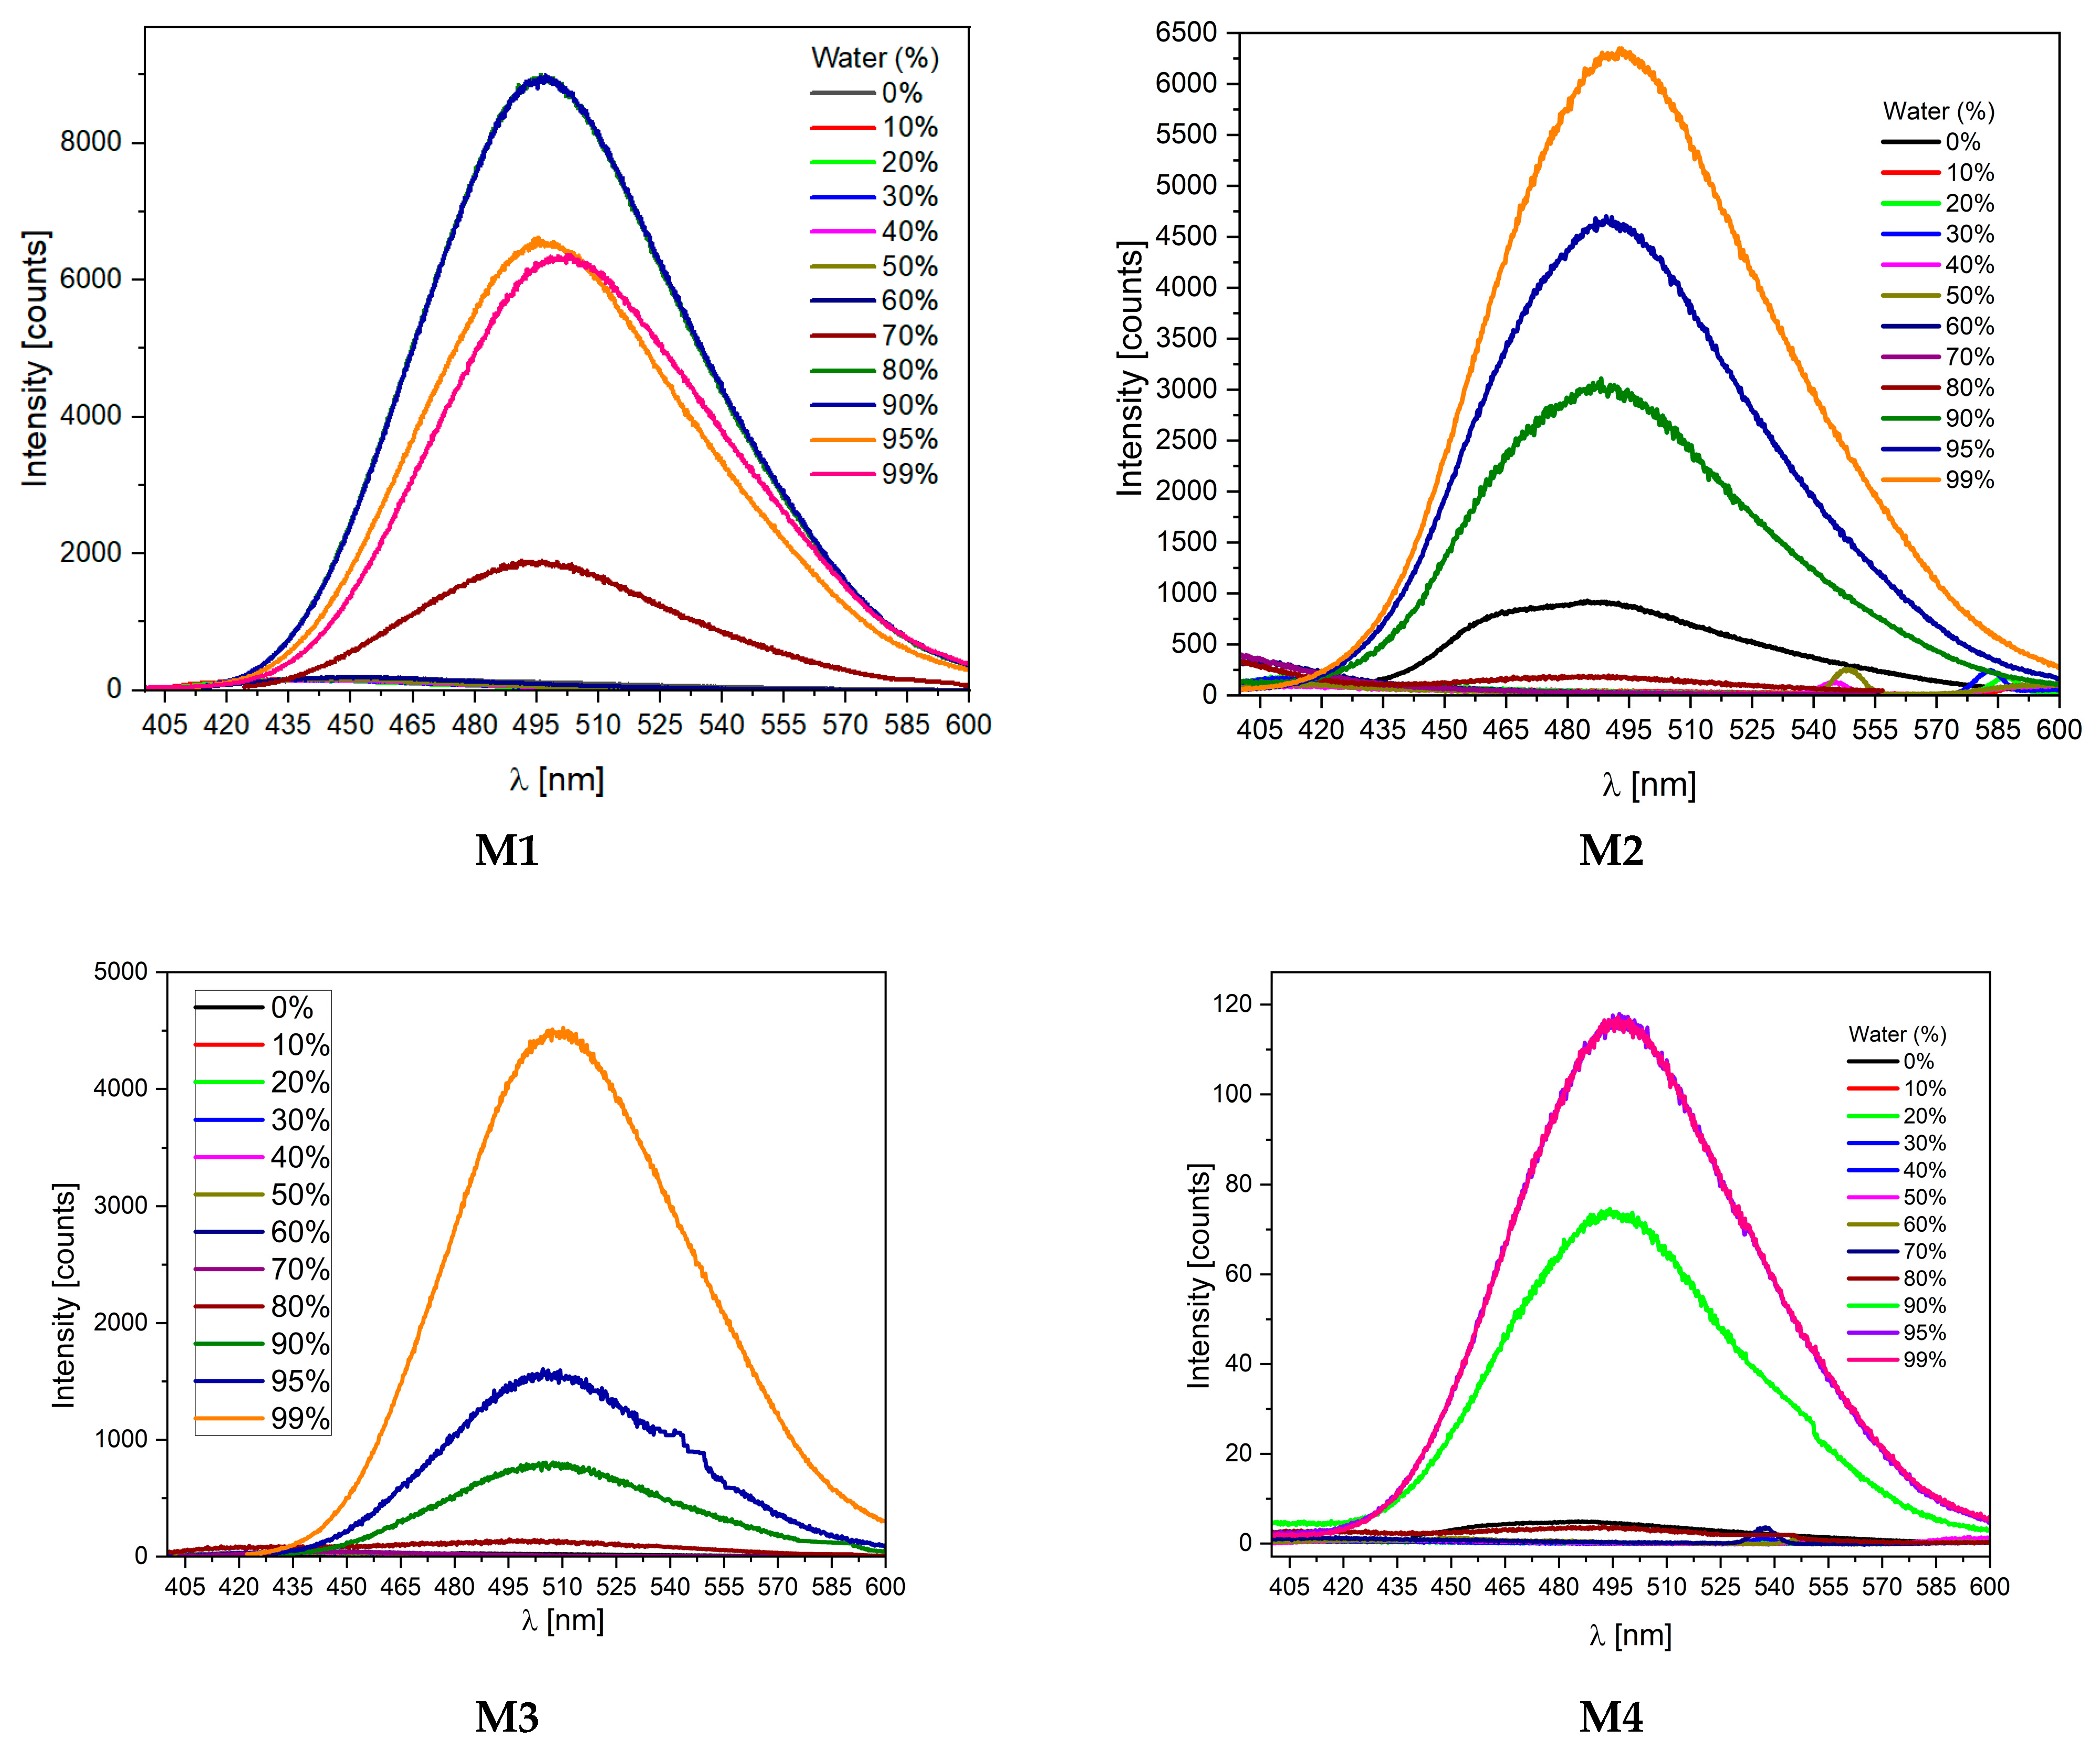
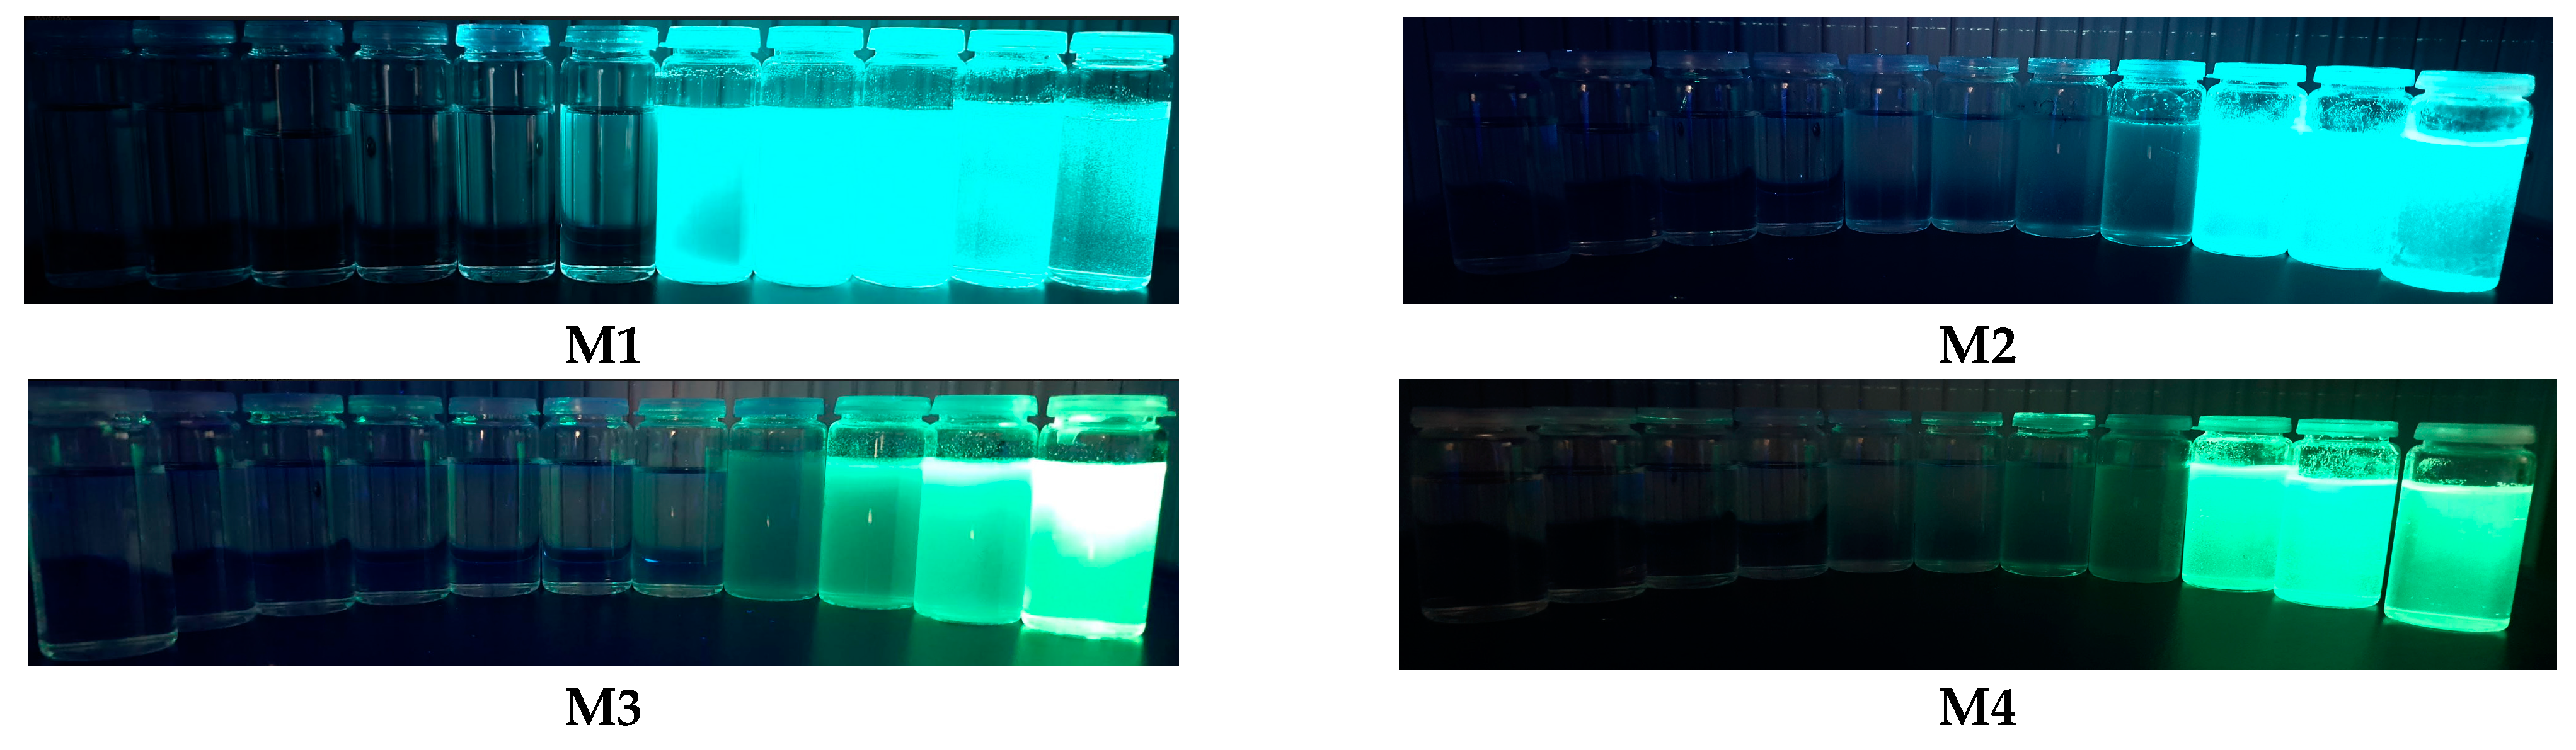
2.3. Aggregation-Induced Emission Investigations
2.4. Identification of Latent Fingerprints
3. Materials and Methods
3.1. General Methods
3.2. Synthesis and Characterization
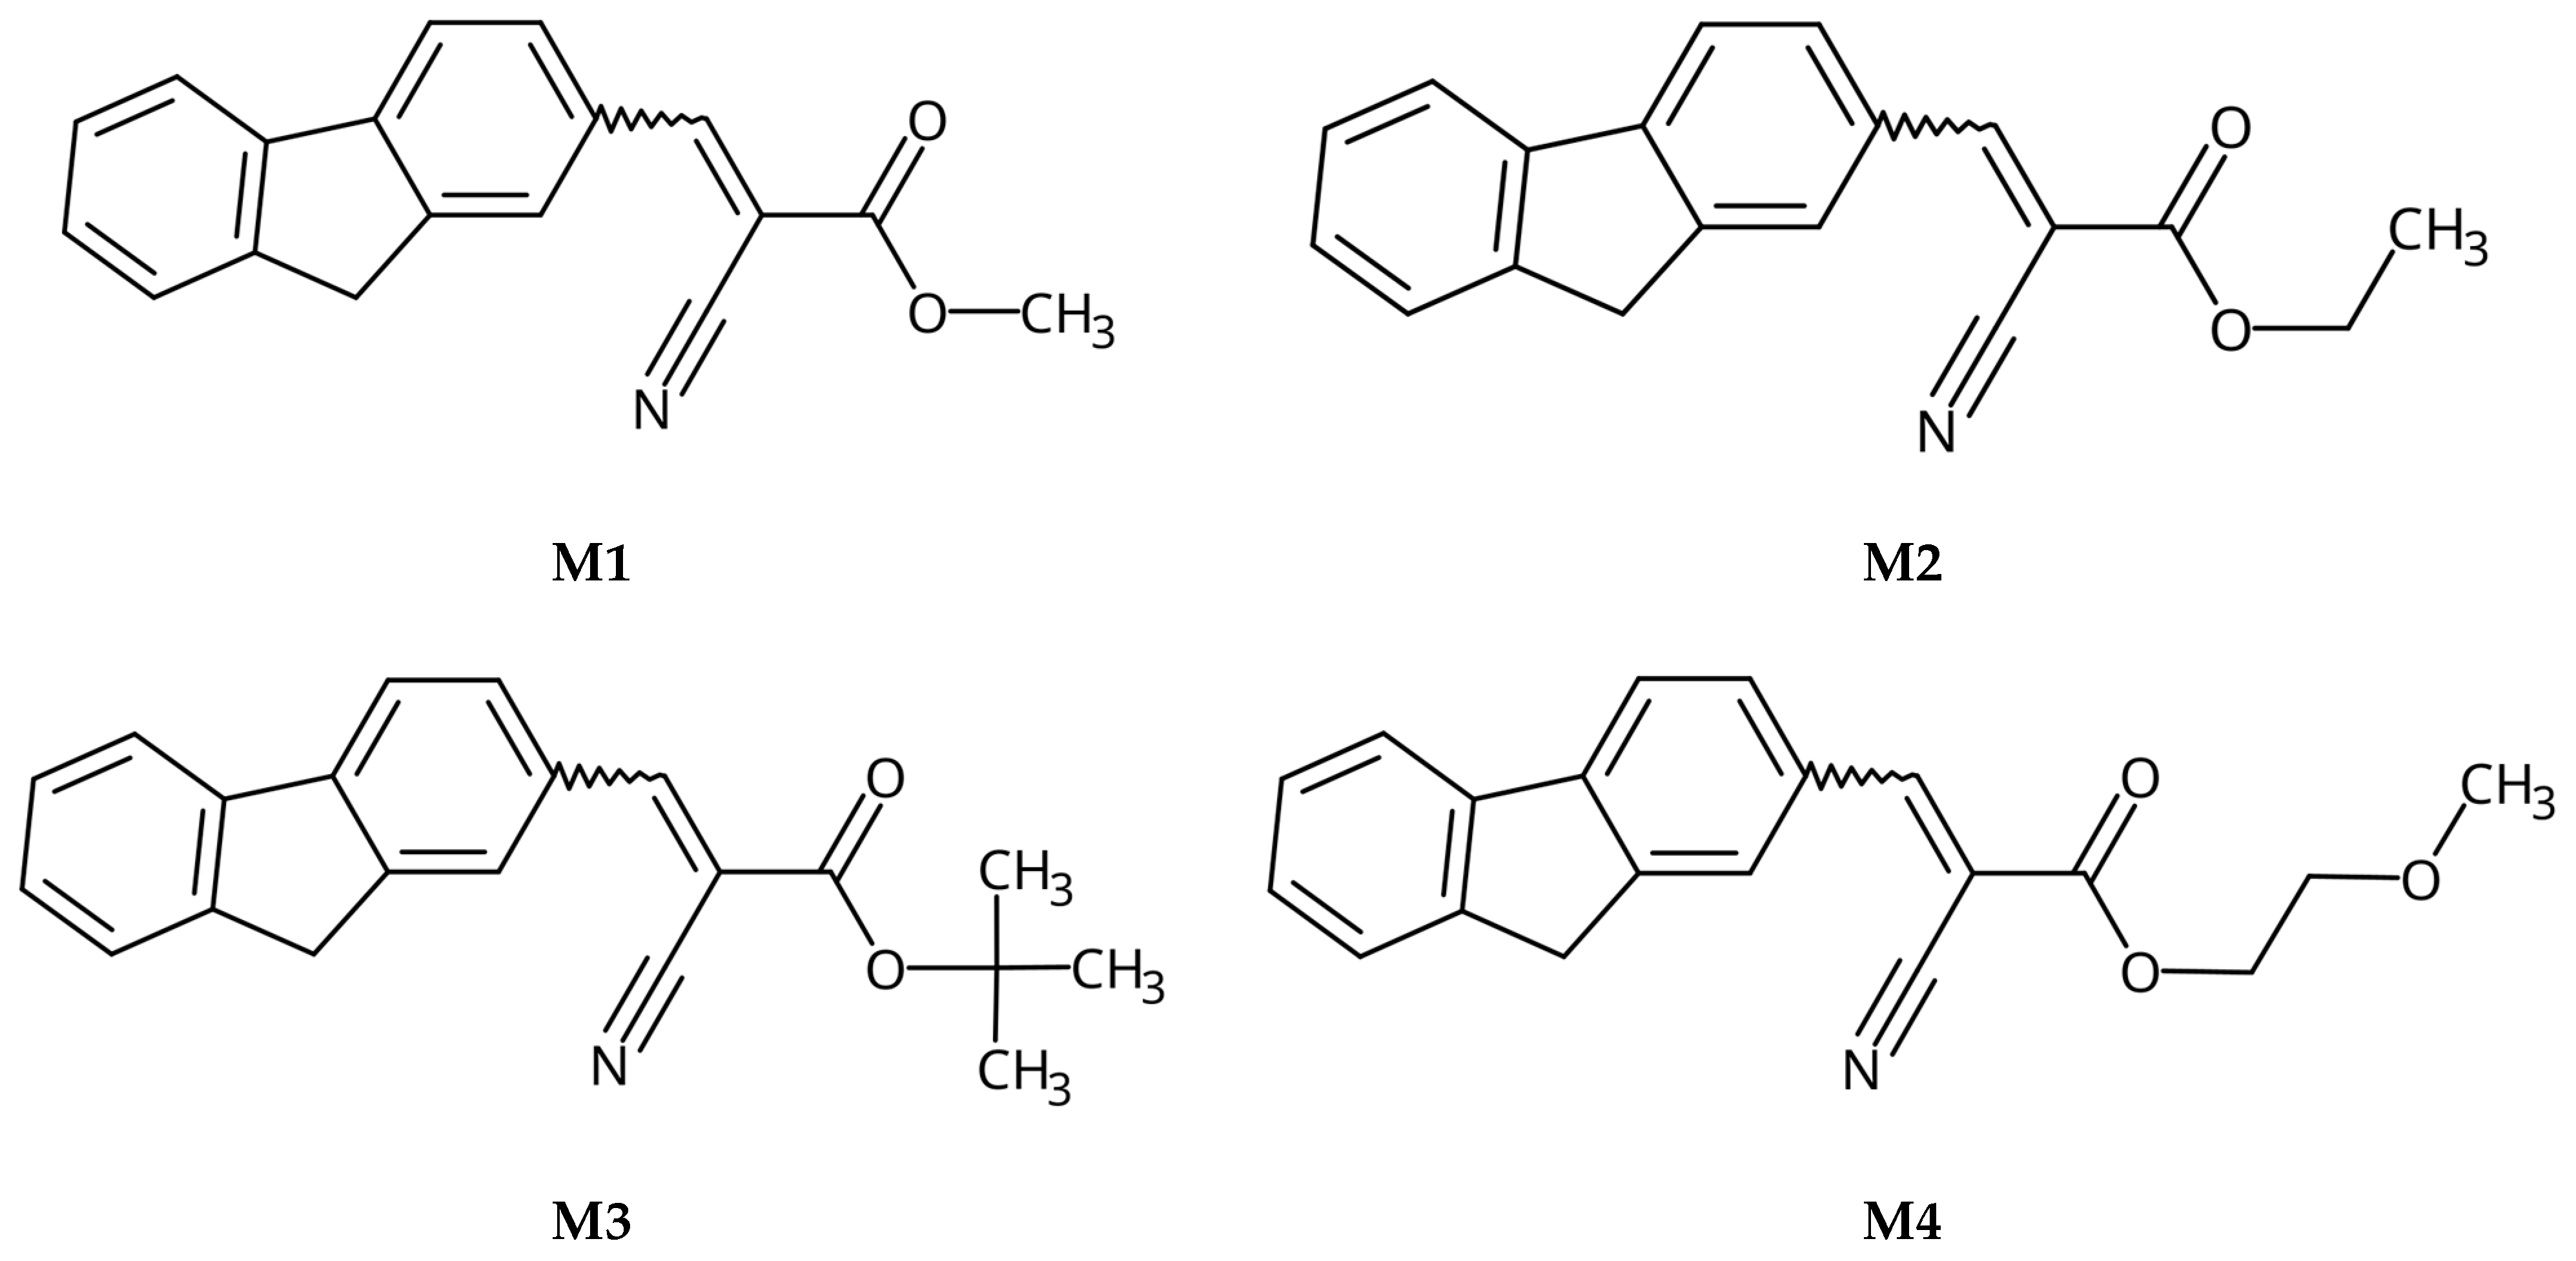
3.2.1. Synthesis of M1, methyl 2-cyano-3-(9H-fluoren-2-yl)prop-2-enoate
3.2.2. Synthesis of M2, ethyl 2-cyano-3-(9H-fluoren-2-yl)prop-2-enoate
3.2.3. Synthesis of M3, tert-butyl-2-cyano-3-(9H-fluoren-2-yl)prop-2-enoate
3.2.4. Synthesis of M4, 2-methoxyethyl 2-cyano-3-(9H-fluoren-2-yl)prop-2-enoate
4. Conclusions
Supplementary Materials
Author Contributions
Funding
Institutional Review Board Statement
Informed Consent Statement
Data Availability Statement
Acknowledgments
Conflicts of Interest
References
- Azman, A.R.; Mahat, N.A.; Wahab, R.A.; Ahmad, W.A.; Huri, M.A.M.; Hamzah, H.H. Relevant visualization technologies for latent fingerprints on wet objects and its challenges: A review. Egypt. J. Forensic Sci. 2019, 9, 23. [Google Scholar] [CrossRef]
- Steiner, R.; Moret, S.; Roux, C. Evaluation of the use of chemical pads to mimic latent fingermarks for research purposes. Forensic Sci. Int. 2020, 314, 110411. [Google Scholar] [CrossRef] [PubMed]
- Sears, V.G.; Bleay, S.M.; Bandey, H.L.; Bowman, V.J. A methodology for finger mark research. Sci. Justice 2012, 52, 145–160. [Google Scholar] [CrossRef] [PubMed]
- Gorka, M.; Thomas, A.; Bécue, A. Development of a printed quality control test strip for the analysis and imaging of fingermark composition. Forensic Sci. Int. 2021, 329, 111063. [Google Scholar] [CrossRef] [PubMed]
- Chhabra, M.; Ravulakollu, K.K.; Kumar, M.; Sharma, A.; Nayyar, A. Improving automated latent fingerprint detection and segmentation using deep convolutional neural network. Neural Comput. Appl. 2023, 35, 6471–6497. [Google Scholar] [CrossRef]
- Pankanti, S.; Prabhakar, S.; Jain, A.K. On the individuality of fingerprints. IEEE Trans. Pattern Anal. Mach. Intell. 2002, 24, 1010–1025. [Google Scholar] [CrossRef]
- Yuan, C.; Li, M.; Wang, M.; Cao, H.; Lin, T. A critical review of fundamentals and applications of electrochemical development and imaging of latent fingerprints. Electrochim. Acta 2021, 390, 138798. [Google Scholar] [CrossRef]
- Hu, J.; Wu, M.; Zhao, X.; Duan, Y.; Yuan, J.; Han, T. A donor-acceptor luminogen serving as a haptic film sensor for identity recognition. Dye. Pigment. 2022, 198, 110034. [Google Scholar] [CrossRef]
- Jain, A.K.; Feng, J.; Nagar, A.; Nandakumar, K. On matching latent fingerprints. In Proceedings of the 2008 IEEE Computer Society Conference on Computer Vision and Pattern Recognition Workshops, Anchorage, AK, USA, 23–28 June 2008; pp. 1–8. [Google Scholar]
- Yuan, C.; Li, M.; Wang, M.; Zhang, L. Cationic dye-diatomite composites: Novel dusting powders for developing latent fingerprints. Dye. Pigment. 2018, 153, 18–25. [Google Scholar] [CrossRef]
- Peng, D.; He, S.; Zhang, Y.; Yao, L.; Nie, W.; Liao, Z.; Ye, X. Blue light-induced rare-earth free phosphors for the highly sensitive and selective imaging of latent fingerprints based on enhanced hydrophobic interaction. J. Mater. 2022, 8, 229–238. [Google Scholar]
- Upendranath, K.; Venkatesh, T.; Vinuth, M. Development and visualization of level II, III features of latent fingerprints using some new 4-(4-substitutedphenyl)-6-(4-substitutedphenyl)-2-oxo-1,2-dihydropyridine-3-carbonitrile derivatives: Synthesis, characterization, optoelectronic and DFT studies. J. Indian Chem. Soc. 2022, 99, 100388. [Google Scholar] [CrossRef]
- Hu, Z.; Liu, R.; Zou, Z.; Zhou, L.; Wang, C.; Wang, J.; Yu, R. A highly stable ScNb2VO9: Eu3+ phosphor with wide band excitation for visualization of latent fingerprints based on the powder dusting method. Mater. Res. Bull. 2023, 165, 112300. [Google Scholar]
- Croxton, R.; Kent, T.; Littlewood, A.; Smith, M. An evaluation of inkjet printed amino acid fingerprint test targets for ninhydrin process monitoring−and some observations. Forensic Sci. Int. 2021, 321, 110741. [Google Scholar] [CrossRef] [PubMed]
- Azman, A.M. Fast, Easy, Reproducible Method for Planting Fingerprints for Ninhydrin, Iodine Development. J. Chem. Educ. 2021, 97, 571–573. [Google Scholar] [CrossRef]
- O’Neill, K.C.; Hinners, P.; Lee, Y.J. Chemical imaging of cyanoacrylate-fumed fingerprints by matrix-assisted laser desorption/ionization mass spectrometry imaging. J. Forensic Sci. 2018, 63, 1854–1857. [Google Scholar] [CrossRef]
- Yu, L.; Xu, Y.; Kim, J.; Lee, J.; Kim, J.S. A rational design of AIE-active fluorophore for the fingerprint optical detection. Bull. Korean Chem. Soc. 2023, 44, 516–522. [Google Scholar] [CrossRef]
- Malik, A.H.; Kalita, A.; Iyer, P.K. Development of well-preserved, substrate-versatile latent fingerprints by aggregation-induced enhanced emission-active conjugated polyelectrolyte. ACS Appl. Mater. Interfaces 2017, 9, 37501–37508. [Google Scholar] [CrossRef]
- ZhongáTang, B. Enhancing the visualization of latent fingerprints by aggregation induced emission of siloles. Analyst 2014, 139, 2332–2335. [Google Scholar]
- Di, L.; Xing, Y.; Yang, Z.; Xia, Z. Ultrabright AIE of Ir (III) complexes achieving expeditious monitoring of oxygen and high-definition development of latent fingerprints. Sens. Actuators B Chem. 2022, 350, 130894. [Google Scholar] [CrossRef]
- Khan, N.A.; Waheed, S.; Junaid, H.M.; Hamad, A.; Imran, M.; Shah, S.H.; Shahzad, S.A. Ultra-sensitive fluorescent and colorimetric probes for femtomolar detection of picric acid: Mechanochromic, latent fingerprinting, and pH responsive character with AIE properties. J. Photochem. Photobiol. A Chem. 2023, 435, 114318. [Google Scholar] [CrossRef]
- Ravindra, M.K.; Darshan, G.P.; Lavanya, D.R.; Mahadevan, K.M.; Premkumar, H.B.; Sharma, S.C.; Nagabhushana, H. Aggregation induced emission based active conjugated imidazole luminogens for visualization of latent fingerprints and multiple anticounterfeiting applications. Sci. Rep. 2021, 11, 16748. [Google Scholar] [CrossRef]
- Suresh, R.; Thiyagarajan, S.K.; Ramamurthy, P. An AIE based fluorescent probe for digital lifting of latent fingerprint marks down to minutiae level. Sens. Actuators B Chem. 2018, 258, 184–192. [Google Scholar] [CrossRef]
- Tian, R.; Wang, Y.L.; Li, C.; Zhu, M.Q. Turn-on green fluorescence imaging for latent fingerprint applications. Mater. Chem. Front. 2022, 6, 1188–1193. [Google Scholar] [CrossRef]
- Wang, M.; Li, M.; Yu, A.; Zhu, Y.; Yang, M.; Mao, C. Fluorescent nanomaterials for the development of latent fingerprints in forensic sciences. Adv. Funct. Mater. 2017, 27, 1606243. [Google Scholar] [CrossRef]
- Kim, B.I.; AfsaráUddin, M.; YoungáWoo, H. Surfactant chemistry for fluorescence imaging of latent fingerprints using conjugated polyelectrolyte nanoparticles. Chem. Commun. 2015, 51, 13634–13637. [Google Scholar]
- Wang, Y.L.; Li, C.; Qu, H.Q.; Fan, C.; Zhao, P.J.; Tian, R.; Zhu, M.Q. Real-time fluorescence in situ visualization of latent fingerprints exceeding level 3 details based on aggregation-induced emission. J. Am. Chem. Soc. 2020, 142, 7497–7505. [Google Scholar] [CrossRef]
- Sodhi, G.S.; Kaur, J. Powder method for detecting latent fingerprints: A review. Forensic Sci. Int. 2001, 120, 172–176. [Google Scholar] [CrossRef] [PubMed]
- Wang, X.; Liao, T.; Wang, H.; Hao, H.; Yang, Q.; Zhou, H.; Fan, R. Novel Organic-Inorganic Hybrid Polystyrene Nanoparticles with Trichromatic Luminescence for the Detection of Latent Fingerprints. Int. J. Anal. Chem. 2022, 1–8. [Google Scholar] [CrossRef]
- Singh, K.; Sharma, S.; Garg, R.K. Visualization of latent fingerprints using silica gel G: A new technique. Egypt. J. Forensic Sci. 2013, 3, 20–25. [Google Scholar] [CrossRef]
- Suksopee, V.; Supalaknari, S. Detection of Latent Fingerprints on Car Parts and Knifes Submerged in Water by Using Super-Glue Black Powder and Super-Glue with Black Powder. Ph.D. Thesis, Silpakorn University, Bangkok, Thailand, 2018. [Google Scholar]
- Bumbrah, G.S. Cyanoacrylate fuming method for detection of latent fingermarks: A review. Egypt. J. Forensic Sci. 2017, 7, 4. [Google Scholar] [CrossRef]
- Eksinitkun, G.; Pansiw, S.; Phutdhawong, W. Simple improvement in latent fingerprint detection with Ninhydrin/water glue on thermal paper. J. Phys. Conf. Ser. 2019, 1380, 012122. [Google Scholar] [CrossRef]
- Sari, S.A. Comparison between latent fingerprint identification using black powder and cyanoacrylate glue. Asian J. Chem. 2018, 30, 2615–2620. [Google Scholar] [CrossRef]
- Jin, X.; Wang, H.; Xin, R.; Ma, Y.; Wu, G.; Xu, T.; Ma, R. An aggregation-induced emission luminogen combined with a cyanoacrylate fuming method for latent fingerprint analysis. Analyst 2020, 145, 2311–2318. [Google Scholar] [CrossRef]
- Van Der Spil, K. Evaluating the Efficiency and Sensitivity of One-Step Cyanoacrylate Fuming Methods in the Detection and Visualisation of Latent Fingerprints on the Adhesive Side of Tape. Doctoral Dissertation, Murdoch University, Perth, Australia, 2019. [Google Scholar]
- Azaldegui, C.; Aguilar, G.; Enriquez, S.; Madonna, C.; Parish Fisher, C.; Burks, R. Benzoic acid derivatives as luminescent sublimation dyes in cyanoacrylate fuming of latent fingerprints. J. Forensic Sci. 2021, 66, 1085–1093. [Google Scholar] [CrossRef]
- Krebs, B.; Gapinska-Serwin, A.; Knaap, W. A Novel Technique: Developing Latent Fingerprints using Fluorescent Starch Powder and a Sandblasting Gun. J. Forensic Identif. 2021, 71, 291–308. [Google Scholar]
- Majani, S.S.; Gowda, B.G.; Prema, R.; Usha, V.; Shivamallu, C.; Iqbal, M.; Kollur, S.P. Dysprosium doped BaMgO2 nanopowders as highly luminescent materials: Preparation, characterization, and forensic application. Inorg. Chem. Commun. 2023, 155, 111133. [Google Scholar] [CrossRef]
- Jiang, Y.; Huang, Y.; Shi, X.; Lu, Z.; Ren, J.; Wang, Z.; Wang, L. Eu-MOF and its mixed-matrix membranes as a fluorescent sensor for quantitative ratiometric pH and folic acid detection, and visible fingerprint identifying. Inorg. Chem. Front. 2021, 22, 4924–4932. [Google Scholar] [CrossRef]
- Zhou, B.; Yan, D. Hydrogen-Bonded Two-Component Ionic Crystals Showing Enhanced Long-Lived Room-Temperature Phosphorescence via TADF-Assisted Förster Resonance Energy Transfer. Adv. Funct. Mater. 2019, 4, 1807599. [Google Scholar] [CrossRef]
- Frisch, M.J.; Trucks, G.W.; Schlegel, H.B.; Scuseria, G.E.; Robb, M.A.; Cheeseman, J.R.; Scalmani, G.; Barone, V.; Petersson, G.A.; Nakatsuji, H.X.; et al. Fox, Gaussian 16, Revision C.01; Gaussian, Inc.: Wallingford, CT, USA, 2019. [Google Scholar]
- Srivastava, R.; Joshi, L.R. The effect of substituted 1, 2, 4-triazole moiety on the emission, phosphorescent properties of the blue emitting heteroleptic iridium (III) complexes and the OLED performance: A theoretical study. Phys. Chem. Chem. Phys. 2014, 32, 17284–17294. [Google Scholar] [CrossRef]
- Liu, S.J.; Song, N.N.; Wang, J.X.; Huang, Y.Q.; Zhao, Q.; Liu, X.M.; Huang, W. A large perturbation on geometry structures, excited state properties, charge-injection and-transporting abilities of Ir (III) complexes by different substituents on ligands: A DFT/TDDFT study. Phys. Chem. Chem. Phys. 2011, 41, 18497–18506. [Google Scholar] [CrossRef]
- Wang, Y.; Peng, Q.; Liang, Y.; Li, B.; Zhu, W. Theoretical Study of Optical and Electronic Properties of Unsymmetrical Dendritic Molecules with Different Bridge Moieties. Aust. J. Chem. 2011, 11, 1475–1484. [Google Scholar] [CrossRef]
- Filipek, P.; Karoń, K.; Hellwig, H.; Szłapa-Kula, A.; Filapek, M. The Role of Intermolecular Interaction on Aggregation-Induced Emission Phenomenon and OLED Performance. Materials 2022, 15, 8525. [Google Scholar] [CrossRef] [PubMed]
- He, Z.; Ke, C.; Tang, B.Z. Journey of aggregation-induced emission research. ACS Omega 2018, 3, 3267–3277. [Google Scholar] [CrossRef] [PubMed]


| CODE | HOMO | LUMO | BOND LENGTHS |
|---|---|---|---|
| 1 | 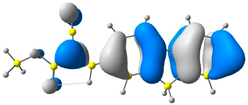 | 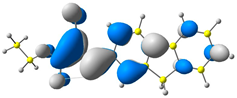 | 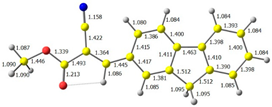 |
| E = −6.39 eV | E = −2.91 eV | ||
| 2 | 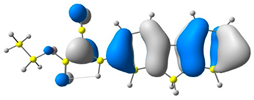 | 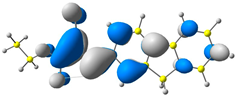 |  |
| E = −6.38 eV | E = −2.89 eV | ||
| 3 |  |  | 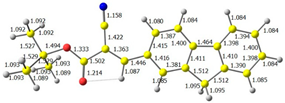 |
| E = −6.36 eV | E = −2.84 eV | ||
| 4 | 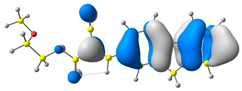 | 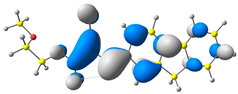 | 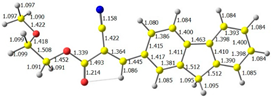 |
| E = −6.39 eV | E = −2.90eV |
| Code | IP(v) [eV] | IP(a) [eV] | EA(v) [eV] | EA(a) [eV] | λhole [eV] | λelectron [eV] | HEP [eV] | EEP [eV] |
|---|---|---|---|---|---|---|---|---|
| M1 | 6.27 | 6.17 | 3.05 | 3.22 | 0.20 | 0.34 | 6.07 | 3.39 |
| M2 | 6.26 | 6.16 | 3.03 | 3.21 | 0.20 | 0.34 | 6.06 | 3.37 |
| M3 | 6.24 | 6.14 | 2.98 | 3.15 | 0.20 | 0.35 | 6.04 | 3.33 |
| M4 | 6.27 | 6.17 | 3.04 | 3.22 | 0.19 | 0.34 | 6.07 | 3.39 |
| Code | Eox | Ered | IP a | EA a | Eg (cv) a | λonset | Eg (Opt) b | Stokes Shift [nm] | ɛ [L/mol × cm] |
|---|---|---|---|---|---|---|---|---|---|
| 1 | 1.28 | −1.47 | −6.38 | −3.63 | 2.75 | 435 | 2.85 | 97 | 110,000 |
| 2 | 1.33 | −1.49 | −6.43 | −3.61 | 2.82 | 442 | 2.80 | 139 | 89,000 |
| 3 | 1.28 | −1.43 | −6.38 | −3.67 | 2.71 | 400 | 3.10 | 144 | 80,000 |
| 4 | 1.31 | −1.55 | −6.41 | −3.55 | 2.86 | 402 | 3.08 | 104 | 45,000 |
| Code | UV-Vis λmax [nm] | PL λmax [nm] |
|---|---|---|
| M1 THF a | 388 | 484 (>1%) c |
| M1 THF:water b | 390 | 499 (68%) c |
| M1 POWDER | 389 | 495 (47%) c |
| M2 THF a | 357 | 496 (1%) c |
| M2 THF:water b | 358 | 442 (23%) c |
| M2 POWDER | 357 | 489 (46%) c |
| M3 THF a | 354 | 497 (>1%) c |
| M3 THF:water b | 357 | 454 (4%) c |
| M3 POWDER | 355 | 479 (34%) c |
| M4 THF a | 393 | 497 (>1%) c |
| M4 THF:water b | 397 | 509 (1%) c |
| M4 POWDER | 398 | 498 (2%) c |
Disclaimer/Publisher’s Note: The statements, opinions and data contained in all publications are solely those of the individual author(s) and contributor(s) and not of MDPI and/or the editor(s). MDPI and/or the editor(s) disclaim responsibility for any injury to people or property resulting from any ideas, methods, instructions or products referred to in the content. |
© 2023 by the authors. Licensee MDPI, Basel, Switzerland. This article is an open access article distributed under the terms and conditions of the Creative Commons Attribution (CC BY) license (https://creativecommons.org/licenses/by/4.0/).
Share and Cite
Filipek, P.; Hellwig, H.; Szlapa-Kula, A.; Filapek, M. Simple Donor–π–Acceptor Compounds Exhibiting Aggregation-Induced Emission as Hidden Fingerprints Detecting Agents. Molecules 2023, 28, 7597. https://doi.org/10.3390/molecules28227597
Filipek P, Hellwig H, Szlapa-Kula A, Filapek M. Simple Donor–π–Acceptor Compounds Exhibiting Aggregation-Induced Emission as Hidden Fingerprints Detecting Agents. Molecules. 2023; 28(22):7597. https://doi.org/10.3390/molecules28227597
Chicago/Turabian StyleFilipek, Patrycja, Hubert Hellwig, Agata Szlapa-Kula, and Michał Filapek. 2023. "Simple Donor–π–Acceptor Compounds Exhibiting Aggregation-Induced Emission as Hidden Fingerprints Detecting Agents" Molecules 28, no. 22: 7597. https://doi.org/10.3390/molecules28227597