
Exploring Human Metabolome after Wine Intake—A Review


Abstract
:1. Introduction
2. Clinical Studies
2.1. Interventional Studies
2.1.1. Wash out Period
2.1.2. Duration of the Study
2.1.3. Participants
2.1.4. Type and Amount of Wine/Wine Derivatives
2.2. Observational Studies
2.2.1. Food Frequency Questionnaires (FFQs)
2.2.2. Participants
3. Biological Samples, Analytical Techniques and Statistical Analysis
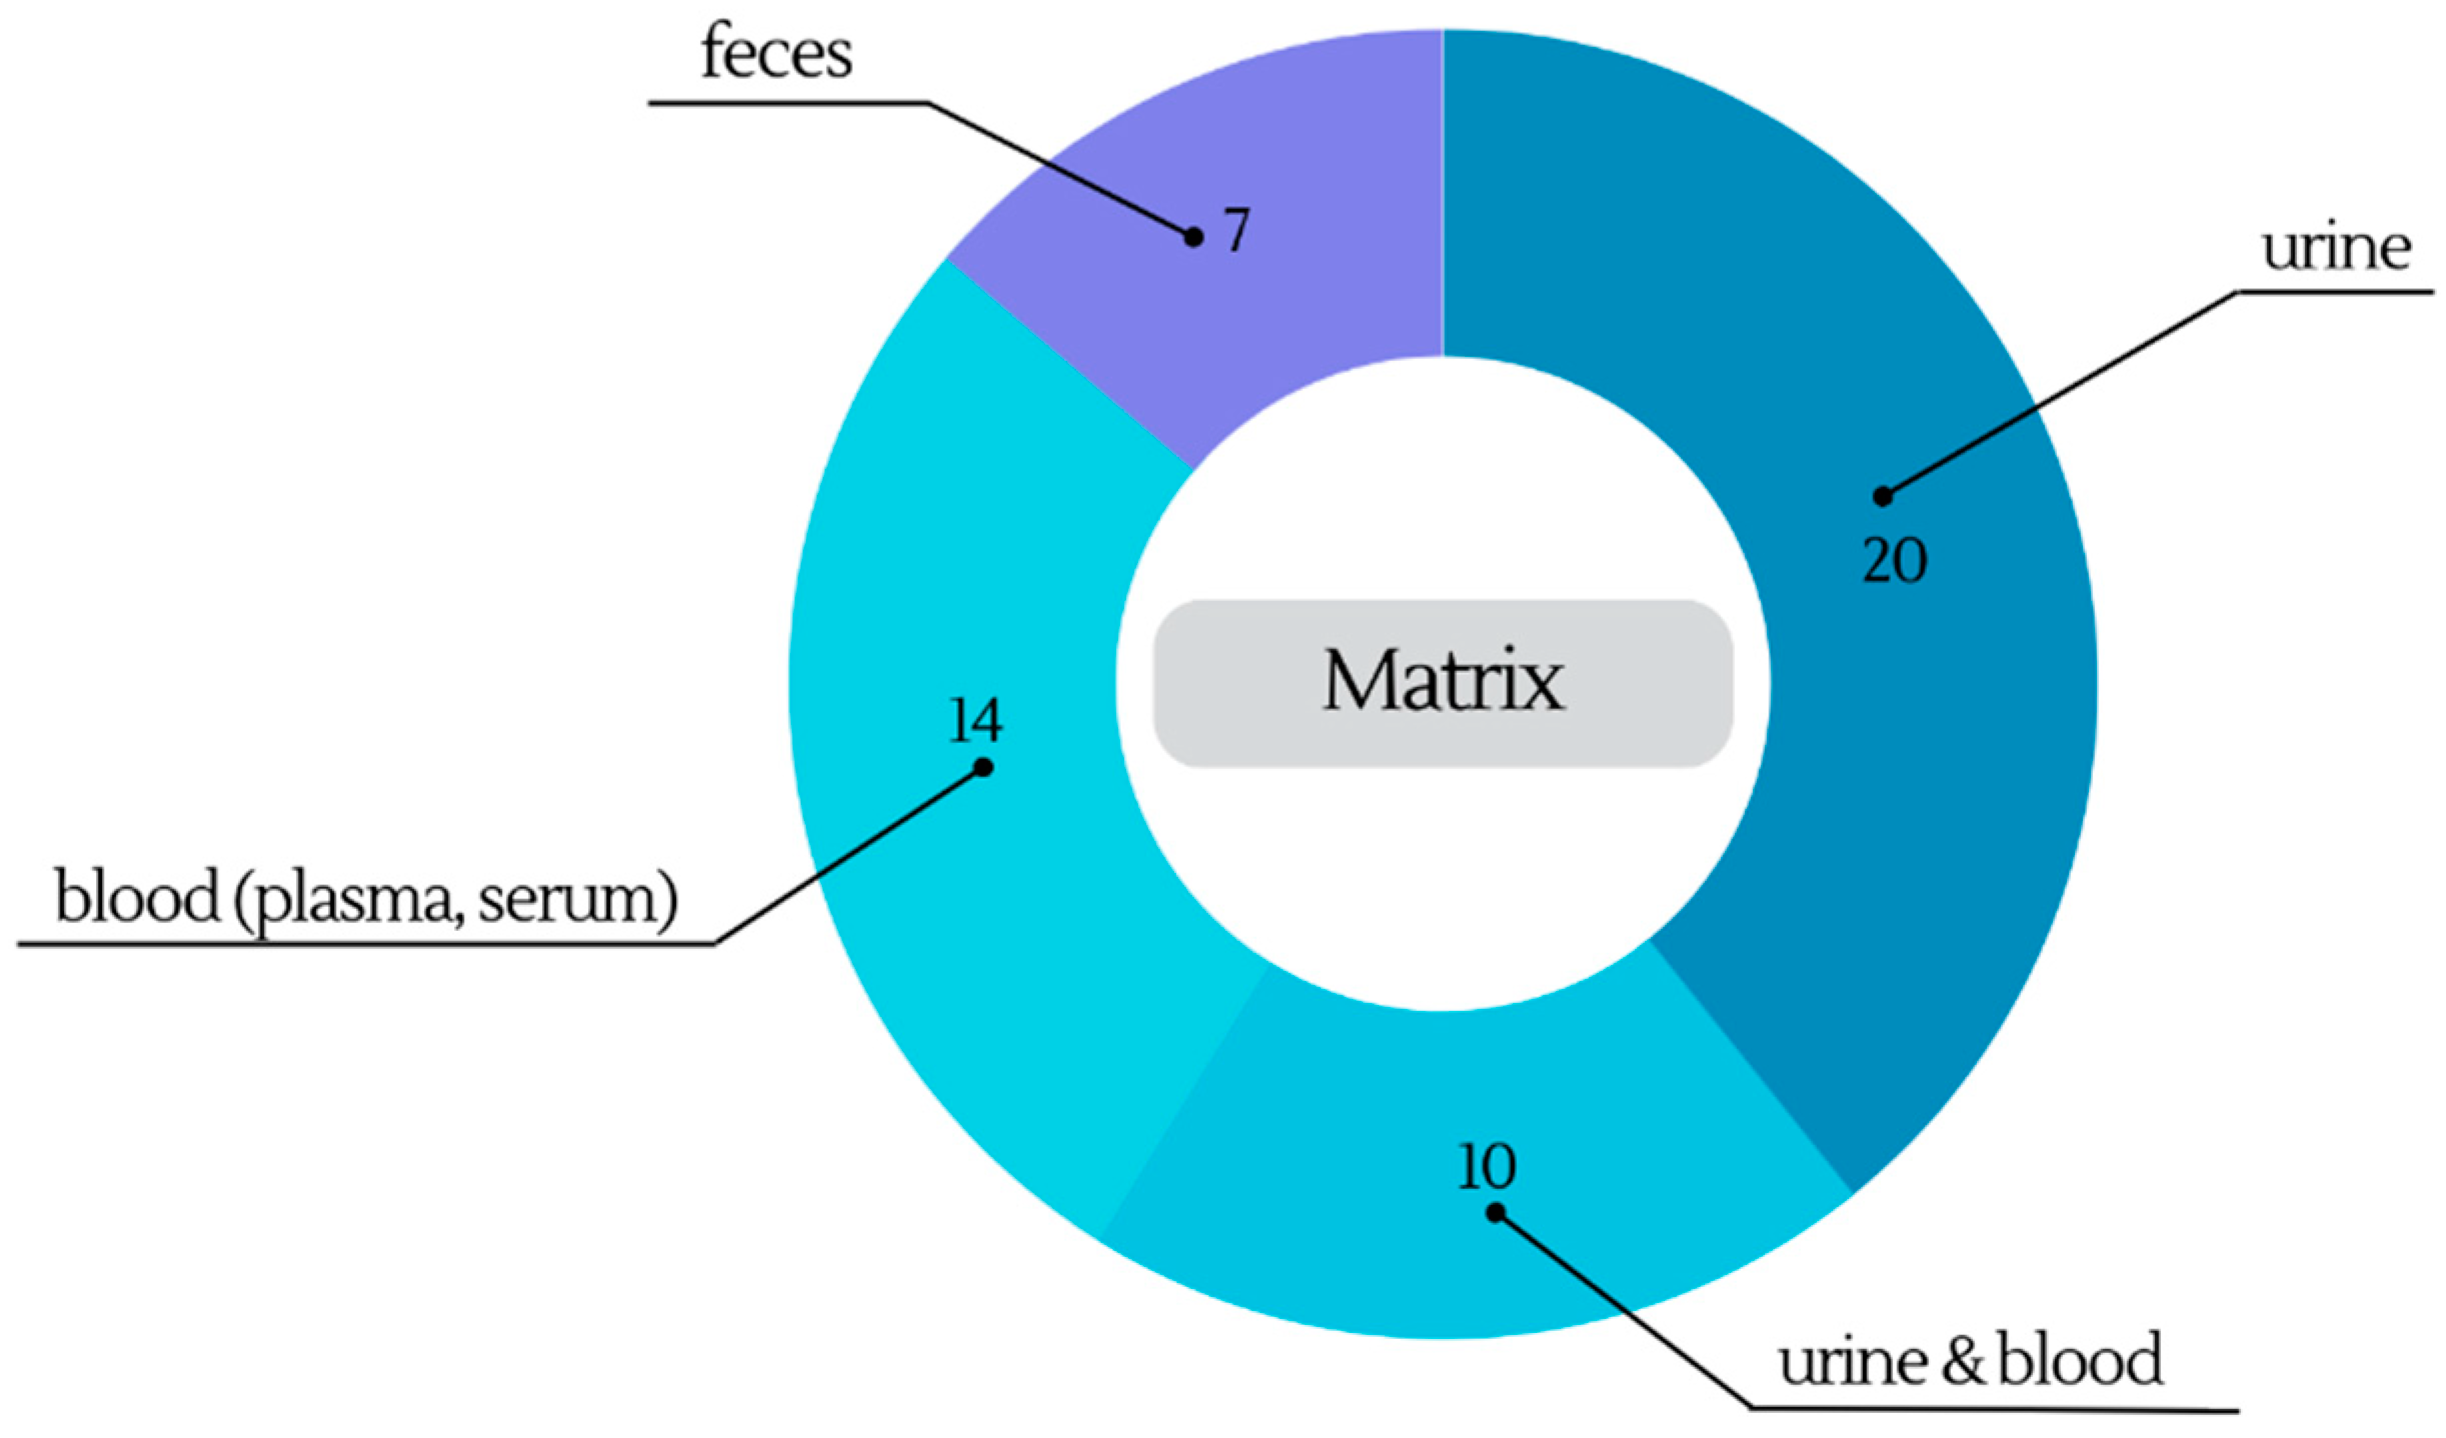
3.1. Biological Samples Preparation
3.1.1. Urine
3.1.2. Blood (Plasma, Serum)
3.1.3. Feces
3.2. Analytical Techniques
3.2.1. LC-MS
3.2.2. GC-MS
3.2.3. NMR
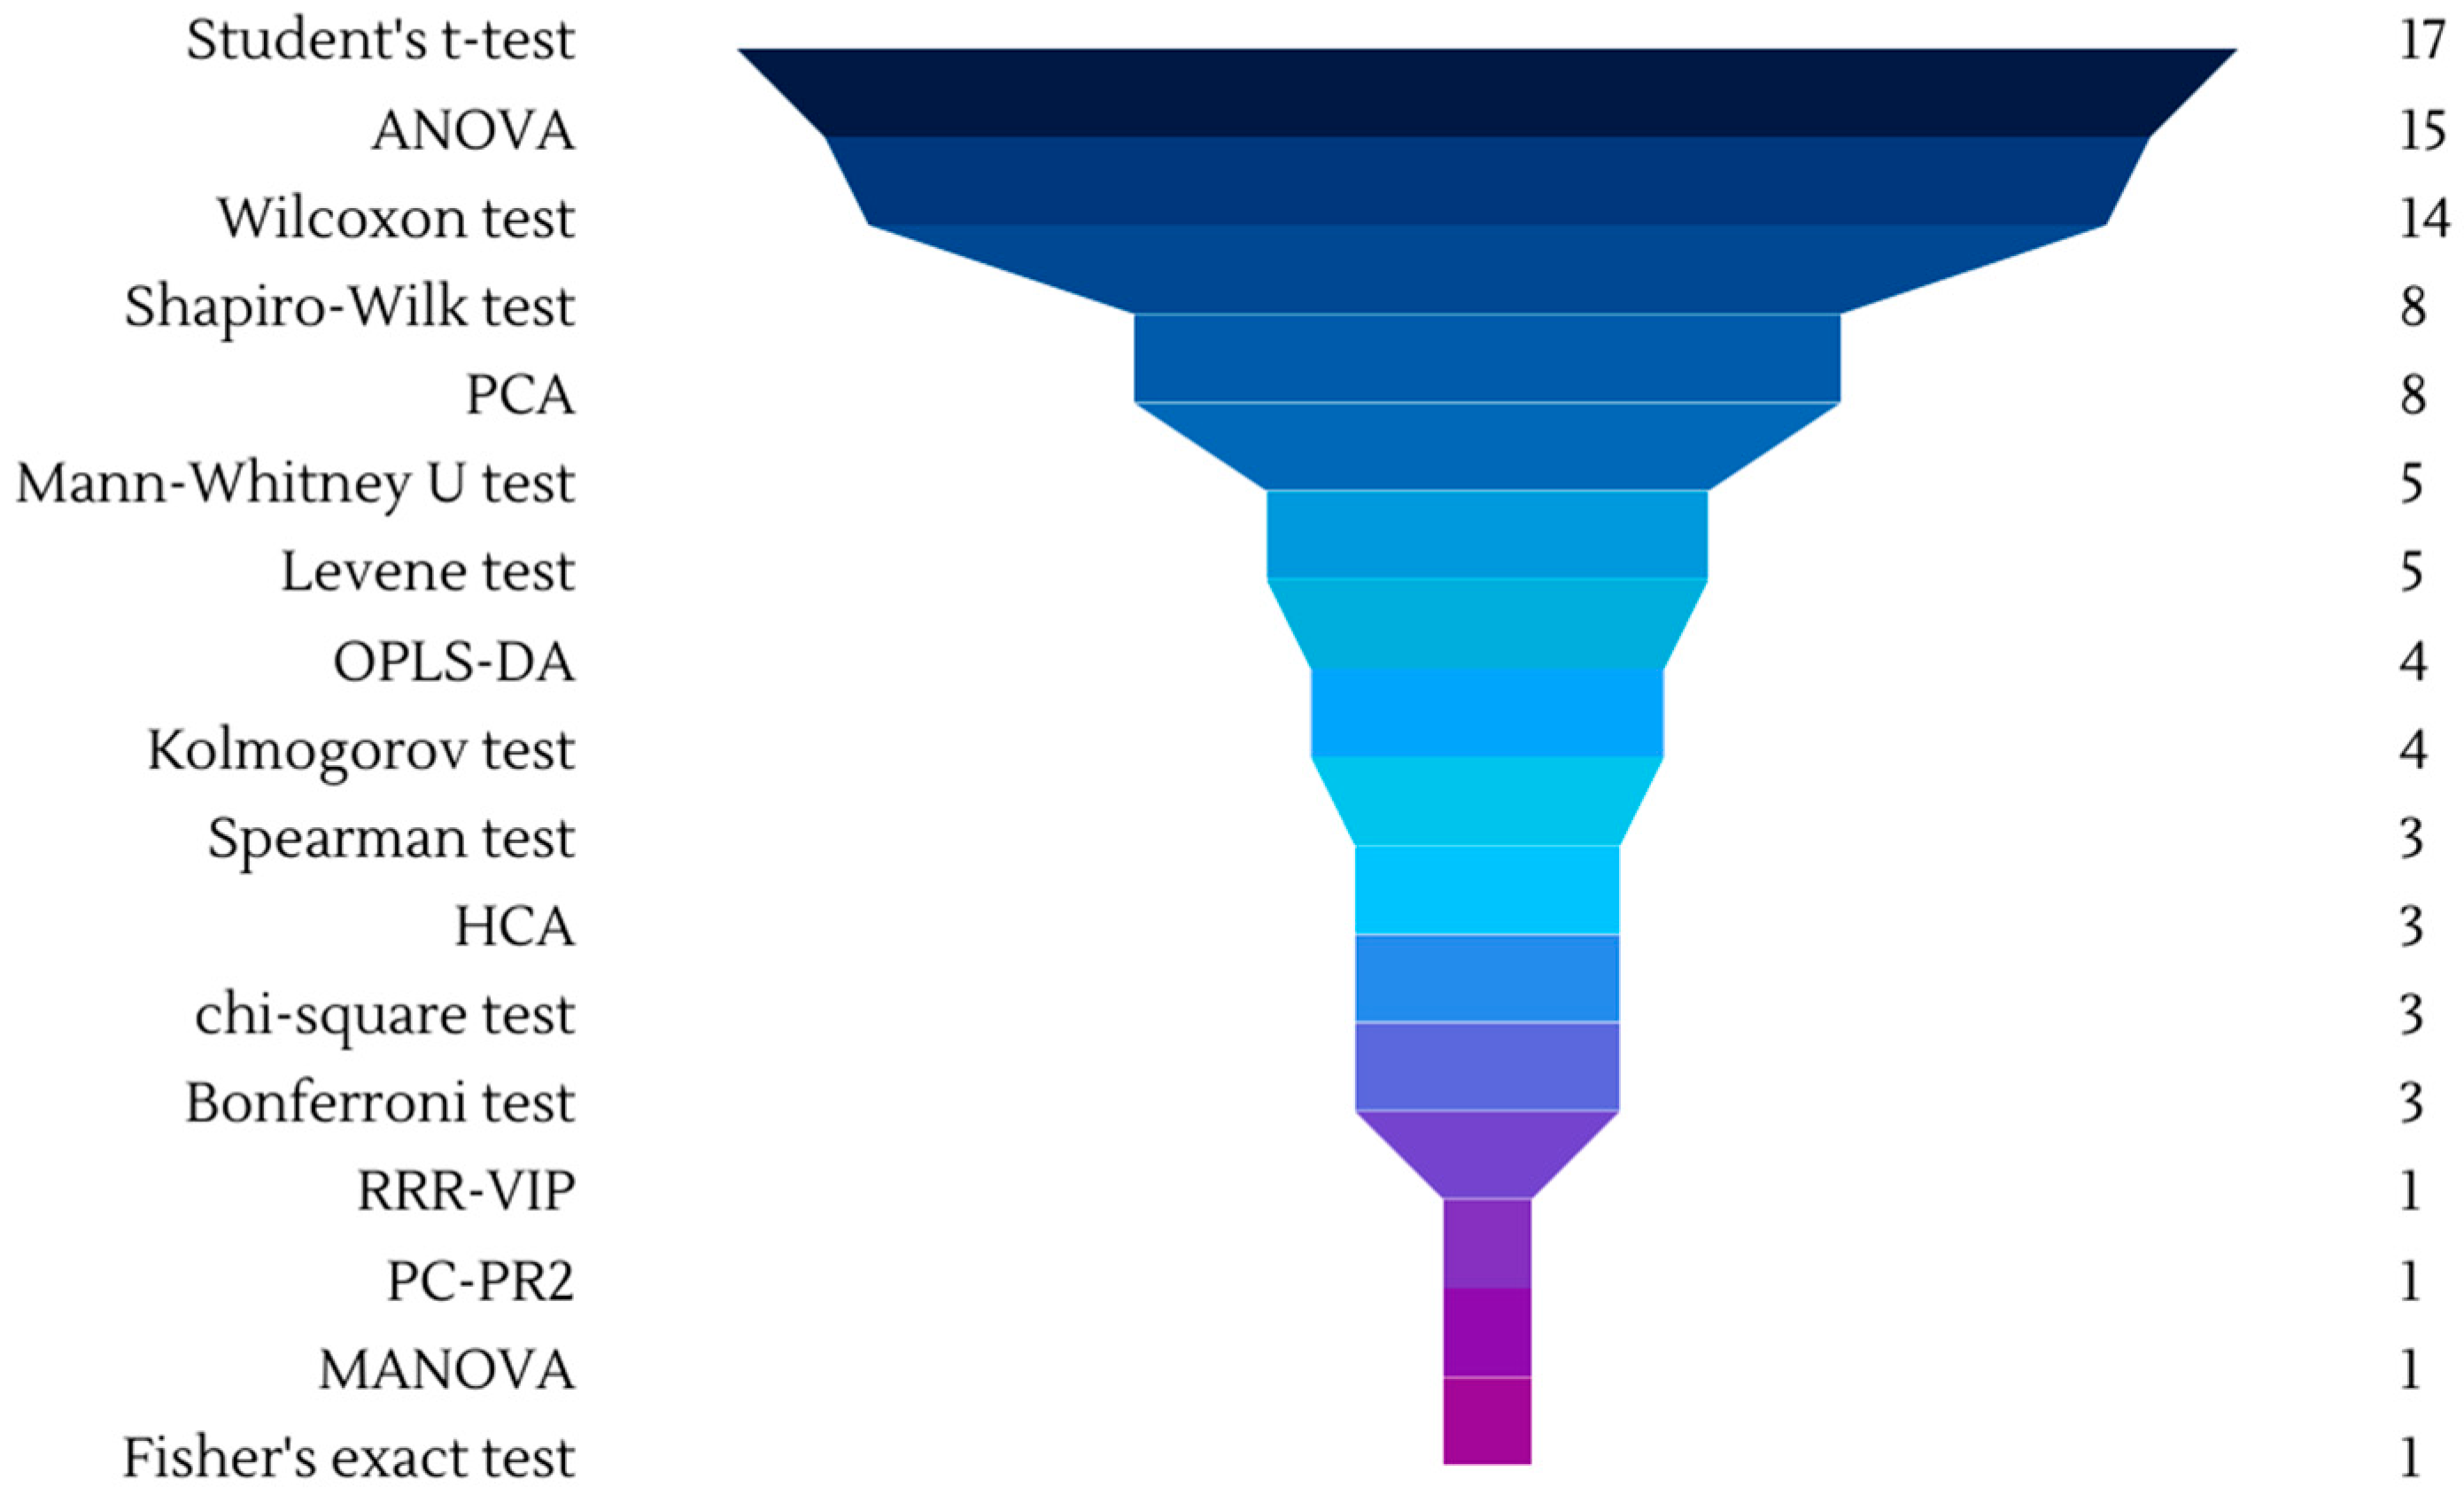
3.3. Chemometrics
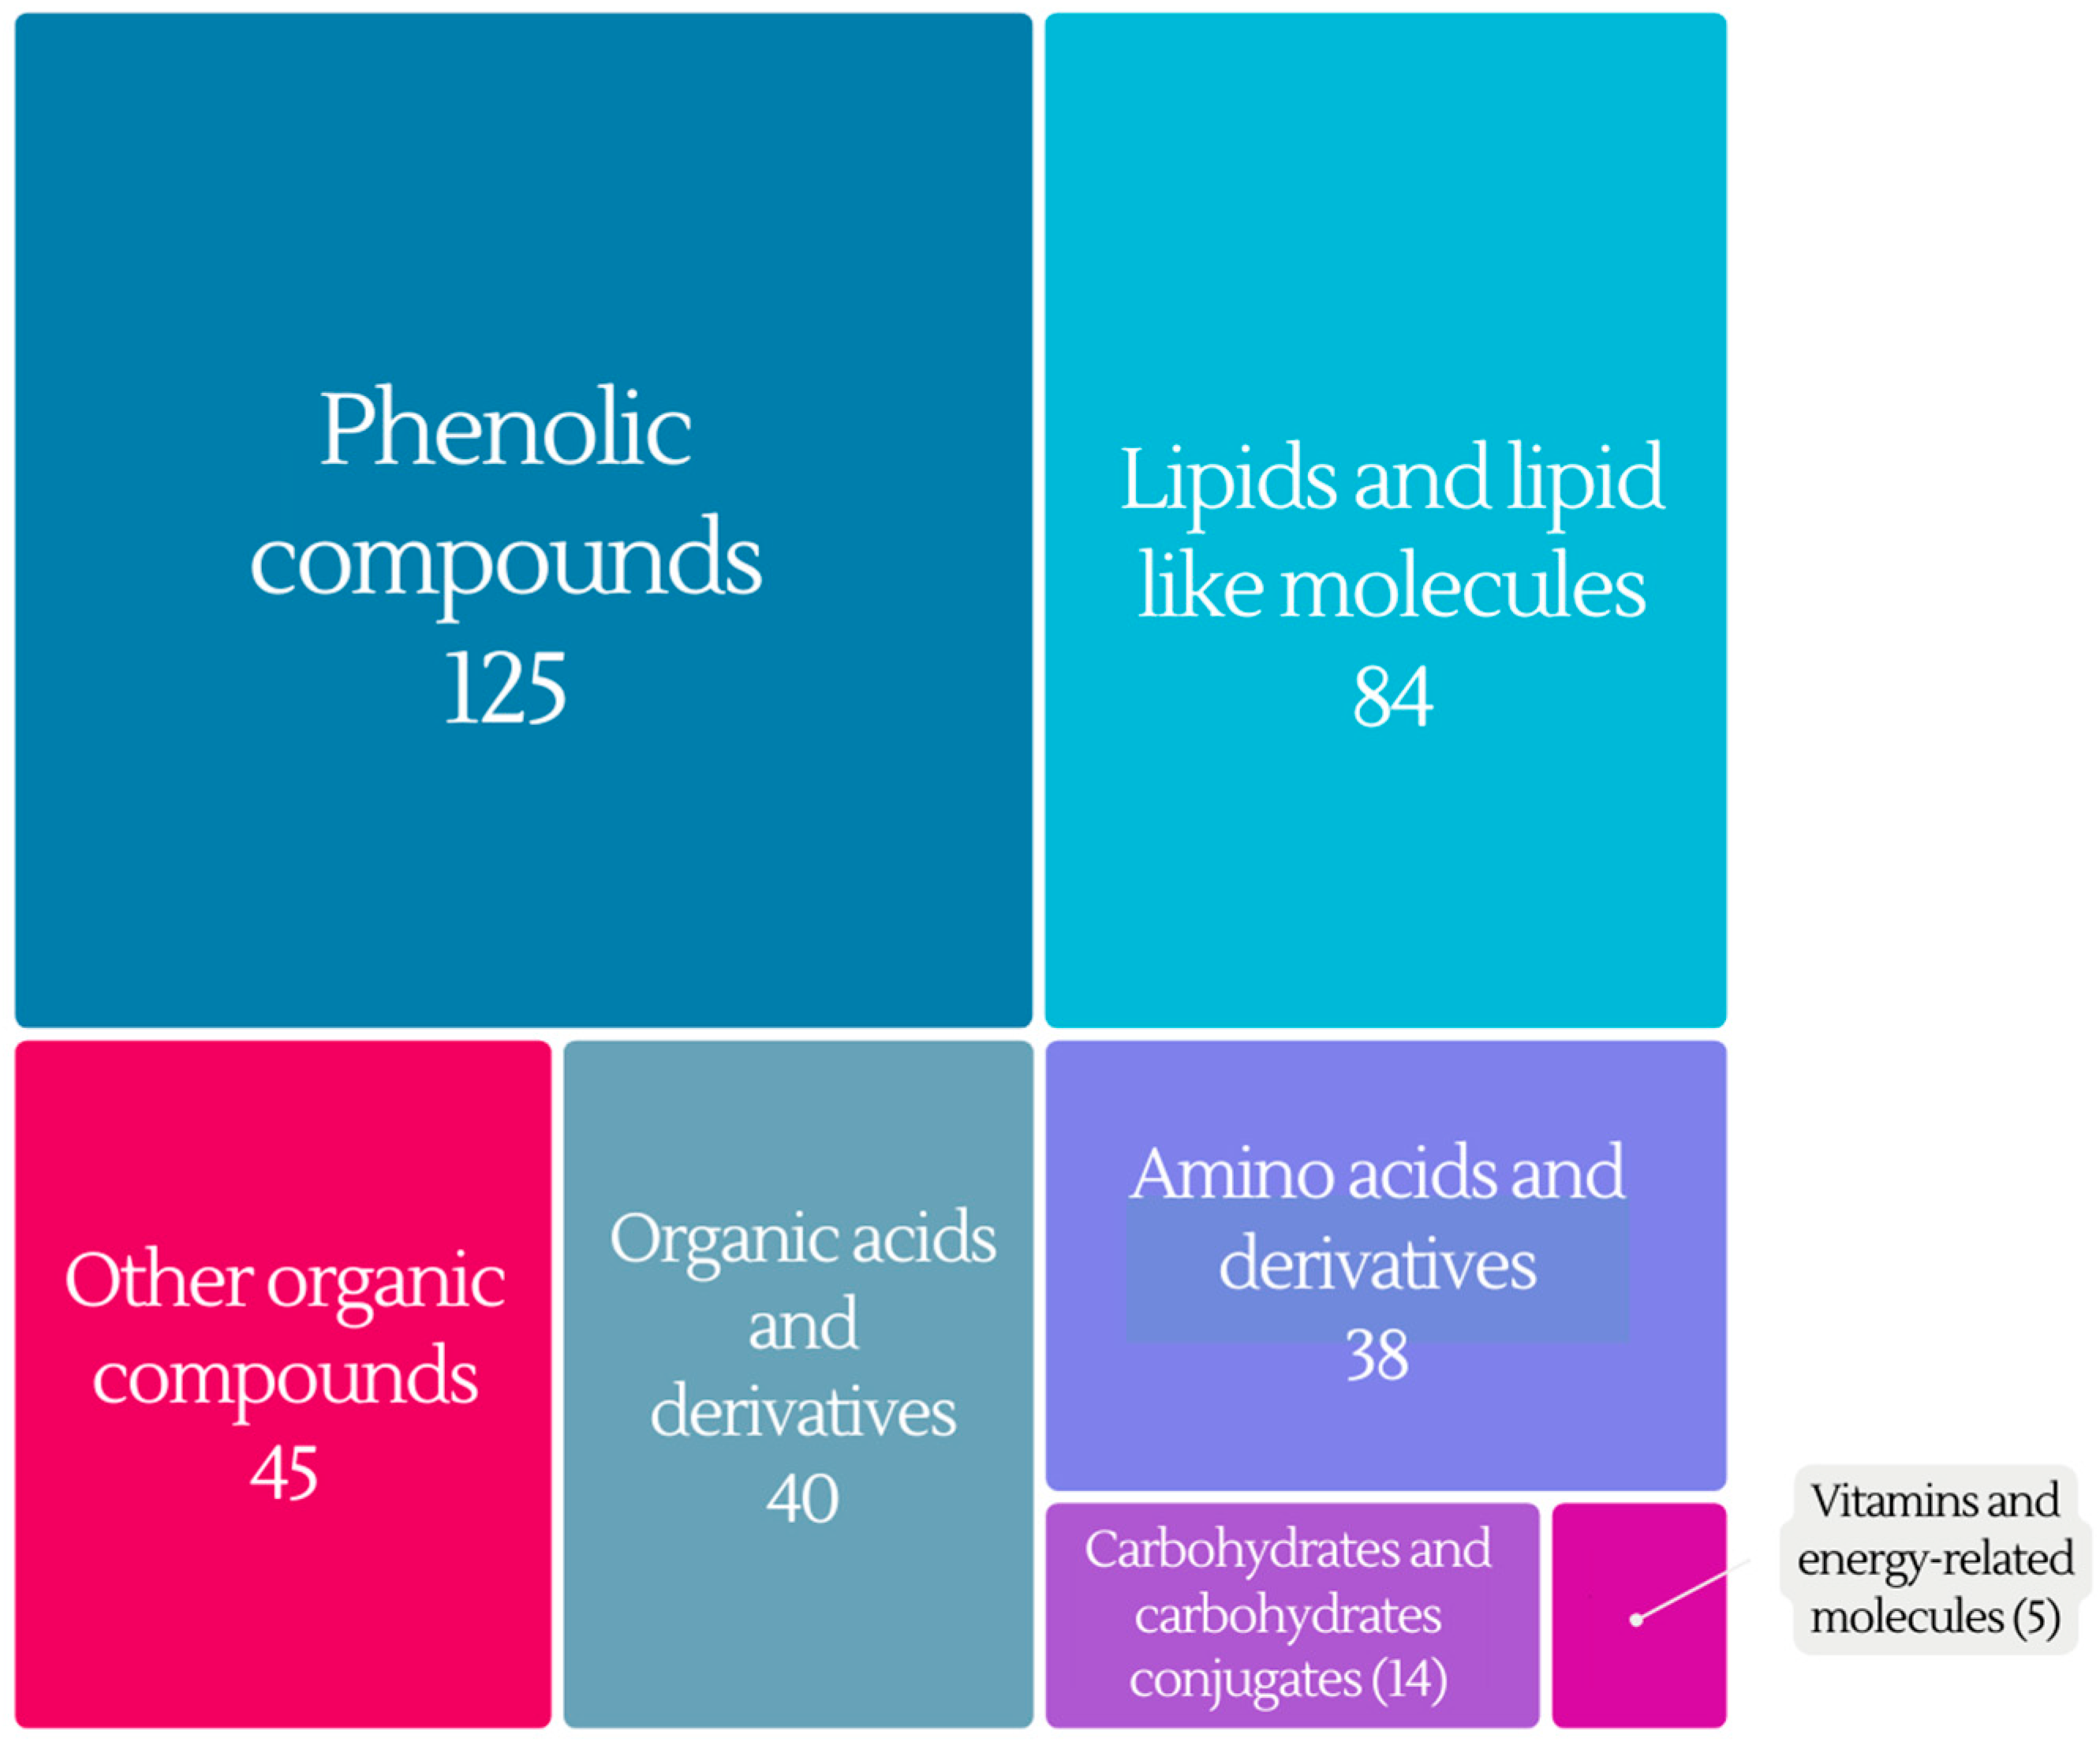
4. Metabolites–Biomarkers of Wine Intake
4.1. Phenolic Compounds
4.2. Lipids and Lipid-like Molecules
4.3. Organic Acids and Derivatives
4.4. Amino Acids and Derivatives
4.5. Carbohydrates and Carbohydrate Conjugates
4.6. Vitamins and Energy Compounds
4.7. Other Organic Compounds
5. Conclusions
Supplementary Materials
Author Contributions
Funding
Institutional Review Board Statement
Informed Consent Statement
Conflicts of Interest
References
- Our World in Data. Available online: https://ourworldindata.org/grapher/wine-consumption-per-person (accessed on 29 August 2023).
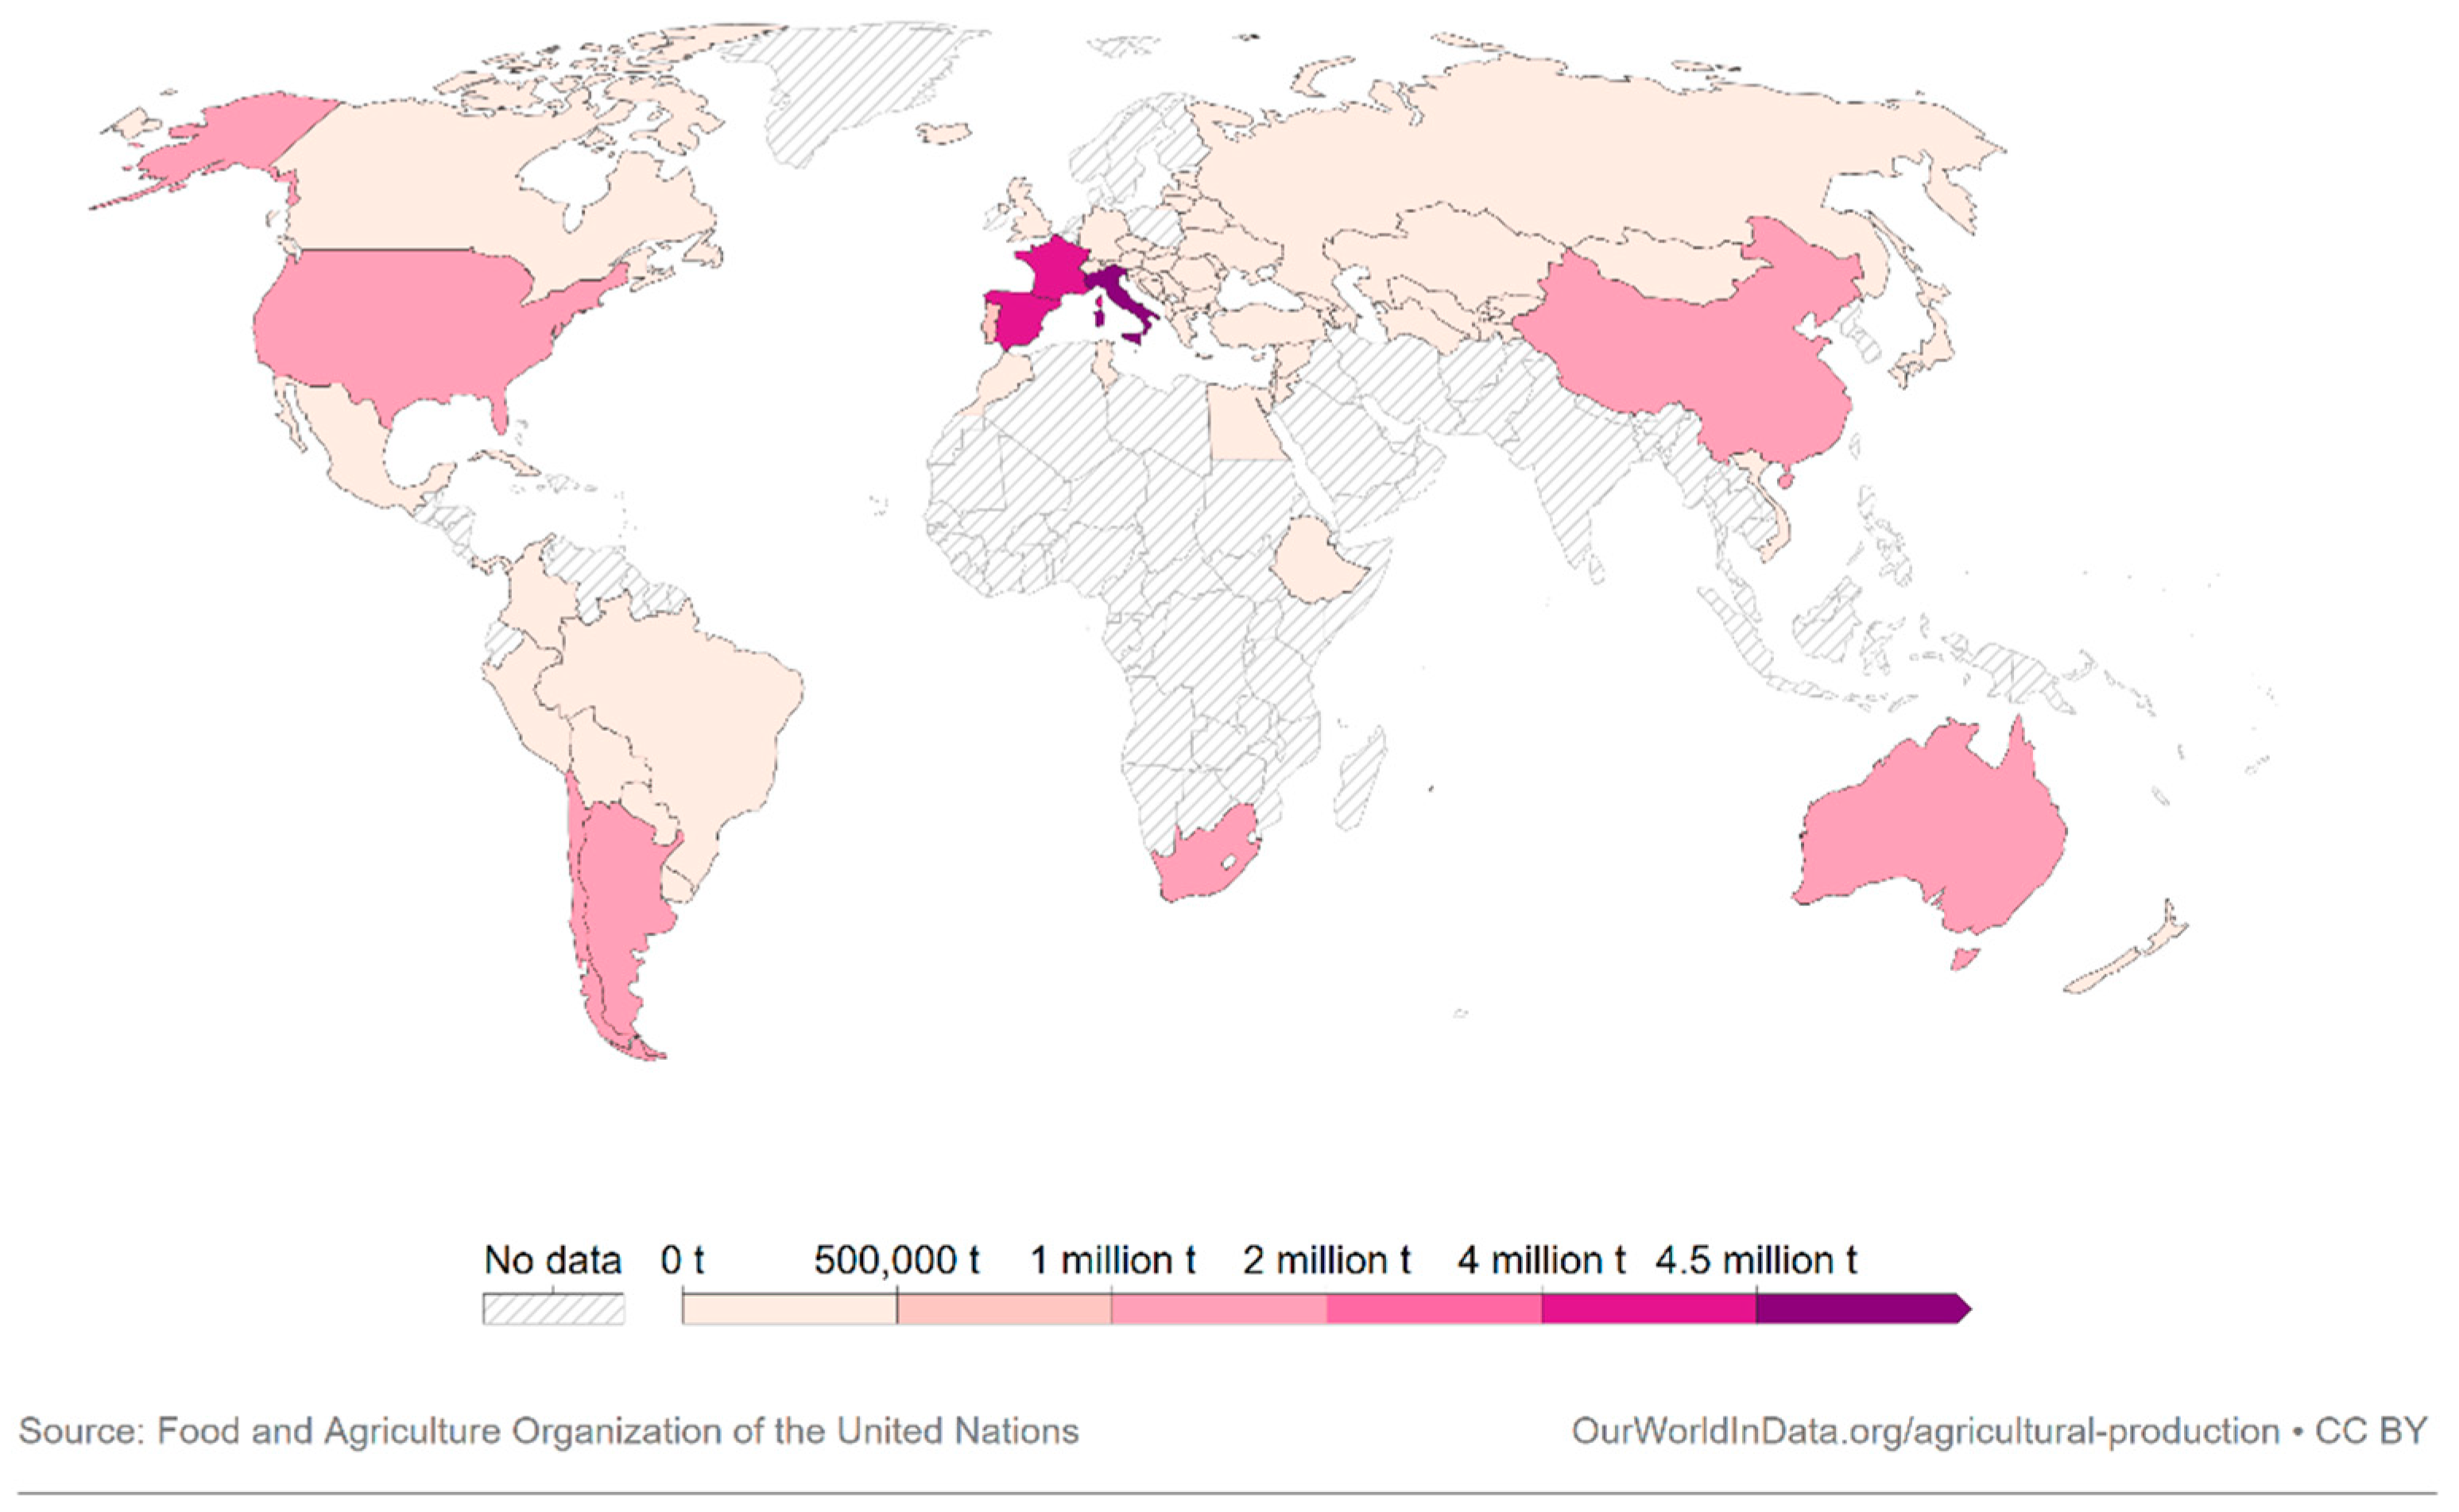
- Our World in Data. Available online: https://ourworldindata.org/grapher/wine-production (accessed on 29 August 2023).
- Fehér, J.; Lengyel, G.; Lugasi, A. The Cultural History of Wine-Theoretical Background to Wine Therapy. Cent. Eur. J. Med. 2007, 2, 379–391. [Google Scholar] [CrossRef]
- Renaud, S.; de Lorgeril, M. Wine, Alcohol, Platelets, and the French Paradox for Coronary Heart Disease. Lancet 1992, 339, 1523–1526. [Google Scholar] [CrossRef] [PubMed]
- Guilford, J.M.; Pezzuto, J.M. Wine and Health: A Review. Am. J. Enol. Vitic. 2011, 62, 471–486. [Google Scholar] [CrossRef]
- Fragopoulou, E.; Choleva, M.; Antonopoulou, S.; Demopoulos, C.A. Wine and Its Metabolic Effects. A Comprehensive Review of Clinical Trials. Metabolism 2018, 83, 102–119. [Google Scholar] [CrossRef] [PubMed]
- Fragopoulou, E.; Antonopoulou, S. The French Paradox Three Decades Later: Role of Inflammation and Thrombosis. Clin. Chim. Acta 2020, 510, 160–169. [Google Scholar] [CrossRef]
- Aleixandre, J.L.; Aleixandre-Tudó, J.L.; Bolaños-Pizzaro, M.; Aleixandre-Benavent, R. Mapping the Scientific Research on Wine and Health (2001–2011). J. Agric. Food Chem. 2013, 61, 11871–11880. [Google Scholar] [CrossRef] [PubMed]
- Costanzo, S.; Di Castelnuovo, A.; Donati, M.B.; Iacoviello, L.; de Gaetano, G. Wine, Beer or Spirit Drinking in Relation to Fatal and Non-Fatal Cardiovascular Events: A Meta-Analysis. Eur. J. Epidemiol. 2011, 26, 833–850. [Google Scholar] [CrossRef] [PubMed]
- Lucerón-Lucas-Torres, M.; Saz-Lara, A.; Díez-Fernández, A.; Martínez-García, I.; Martínez-Vizcaíno, V.; Cavero-Redondo, I.; Álvarez-Bueno, C. Association between Wine Consumption with Cardiovascular Disease and Cardiovascular Mortality: A Systematic Review and Meta-Analysis. Nutrients 2023, 15, 2785. [Google Scholar] [CrossRef] [PubMed]
- Lombardo, M.; Feraco, A.; Camajani, E.; Caprio, M.; Armani, A. Health Effects of Red Wine Consumption: A Narrative Review of an Issue That Still Deserves Debate. Nutrients 2023, 15, 1921. [Google Scholar] [CrossRef] [PubMed]
- González-Domínguez, R.; Sayago, A.; Fernández-Recamales, Á. Metabolomics: An Emerging Tool for Wine Characterization and the Investigation of Health Benefits. In Engineering Tools in the Beverage Industry; Elsevier: Amsterdam, The Netherlands, 2019; pp. 315–350. ISBN 9780128152584. [Google Scholar]
- Arbulu, M.; Sampedro, M.C.; Gómez-Caballero, A.; Goicolea, M.A.; Barrio, R.J. Untargeted Metabolomic Analysis Using Liquid Chromatography Quadrupole Time-of-Flight Mass Spectrometry for Non-Volatile Profiling of Wines. Anal. Chim. Acta 2015, 858, 32–41. [Google Scholar] [CrossRef] [PubMed]
- Hagyousif, Y.A.; Sharaf, B.M.; Zenati, R.A.; El-Huneidi, W.; Bustanji, Y.; Abu-Gharbieh, E.; Alqudah, M.A.Y.; Giddey, A.D.; Abuhelwa, A.Y.; Alzoubi, K.H.; et al. Skin Cancer Metabolic Profile Assessed by Different Analytical Platforms. Int. J. Mol. Sci. 2023, 24, 1604. [Google Scholar] [CrossRef] [PubMed]
- Scalbert, A.; Brennan, L.; Manach, C.; Andres-Lacueva, C.; Dragsted, L.O.; Draper, J.; Rappaport, S.M.; van der Hooft, J.J.; Wishart, D.S. The Food Metabolome: A Window over Dietary Exposure. Am. J. Clin. Nutr. 2014, 99, 1286–1308. [Google Scholar] [CrossRef] [PubMed]
- Ding, J.; Feng, Y.Q. Mass Spectrometry-Based Metabolomics for Clinical Study: Recent Progresses and Applications. TrAC-Trends Anal. Chem. 2023, 158, 116896. [Google Scholar] [CrossRef]
- Lacalle-Bergeron, L.; Izquierdo-Sandoval, D.; Sancho, J.V.; López, F.J.; Hernández, F.; Portolés, T. Chromatography Hyphenated to High Resolution Mass Spectrometry in Untargeted Metabolomics for Investigation of Food (Bio)Markers. TrAC Trends Anal. Chem. 2021, 135, 116161. [Google Scholar] [CrossRef]
- Kennedy, A.D.; Wittmann, B.M.; Evans, A.M.; Miller, L.A.D.; Toal, D.R.; Lonergan, S.; Elsea, S.H.; Pappan, K.L. Metabolomics in the Clinic: A Review of the Shared and Unique Features of Untargeted Metabolomics for Clinical Research and Clinical Testing. J. Mass Spectrom. 2018, 53, 1143–1154. [Google Scholar] [CrossRef]
- Astarita, G.; Langridge, J. An Emerging Role for Metabolomics in Nutrition Science. Lifestyle Genom. 2013, 6, 181–200. [Google Scholar] [CrossRef]
- Khymenets, O.; Vázquez-Fresno, R.; Palau-Rodriguez, M.; Llorach, R.; Urpí-Sardà, M.; Garcia-Aloy, M.; Tulipani, S.; Lupianez-Barbero, A.; Andres-Lacueva, C. Metabolomic Approaches in the Study of Wine Benefits in Human Health. In Wine Safety, Consumer Preference, and Human Health; Springer International Publishing: Cham, Switzerland, 2016; pp. 293–317. ISBN 9783319245140. [Google Scholar]
- Evens, R.P. (Ed.) Drug and Biological Development; Springer: New York, NY, USA; Boston, MA, USA, 2007; ISBN 978-0-387-32978-9. [Google Scholar]
- Belda, I.; Cueva, C.; Tamargo, A.; Ravarani, C.N.; Acedo, A.; Bartolomé, B.; Moreno-Arribas, M.V. A Multi-Omics Approach for Understanding the Effects of Moderate Wine Consumption on Human Intestinal Health. Food Funct. 2021, 12, 4152–4164. [Google Scholar] [CrossRef]
- Zorraquín-Peña, I.; de Llano, D.G.; Tamargo, A.; Victoria Moreno-Arribas, M.; Bartolomé, B. Moderate Wine Consumption Reduces Faecal Water Cytotoxicity in Healthy Volunteers. Nutrients 2020, 12, 2716. [Google Scholar] [CrossRef]
- Esteban-Fernández, A.; Ibañez, C.; Simó, C.; Bartolomé, B.; Moreno-Arribas, V. Metabolome-Based Clustering after Moderate Wine Consumption. Oeno One 2020, 54, 455–467. [Google Scholar] [CrossRef]
- Esteban-Fernández, A.; Ibañez, C.; Simó, C.; Bartolomé, B.; Moreno-Arribas, M.V. An Ultrahigh-Performance Liquid Chromatography-Time-of-Flight Mass Spectrometry Metabolomic Approach to Studying the Impact of Moderate Red-Wine Consumption on Urinary Metabolome. J. Proteome Res. 2018, 17, 1624–1635. [Google Scholar] [CrossRef]
- Jiménez-Girón, A.; Muñoz-González, I.; Martín-Álvarez, P.J.; Moreno-Arribas, M.V.; Bartolomé, B. Towards the Fecal Metabolome Derived from Moderate Red Wine Intake. Metabolites 2014, 4, 1101–1118. [Google Scholar] [CrossRef] [PubMed]
- Jiménez-Girón, A.; Ibáñez, C.; Cifuentes, A.; Simó, C.; Muñoz-González, I.; Martín-Álvarez, P.J.; Bartolomé, B.; Moreno-Arribas, M.V. Faecal Metabolomic Fingerprint after Moderate Consumption of Red Wine by Healthy Subjects. J. Proteome Res. 2015, 14, 897–905. [Google Scholar] [CrossRef] [PubMed]
- Muñoz-González, I.; Jiménez-Girón, A.; Martín-Álvarez, P.J.; Bartolomé, B.; Moreno-Arribas, M.V. Profiling of Microbial-Derived Phenolic Metabolites in Human Feces after Moderate Red Wine Intake. J. Agric. Food Chem. 2013, 61, 9470–9479. [Google Scholar] [CrossRef]
- Pignatelli, P.; Ghiselli, A.; Buchetti, B.; Carnevale, R.; Natella, F.; Germanò, G.; Fimognari, F.; Di Santo, S.; Lenti, L.; Violi, F. Polyphenols Synergistically Inhibit Oxidative Stress in Subjects given Red and White Wine. Atherosclerosis 2006, 188, 77–83. [Google Scholar] [CrossRef]
- Vitaglione, P.; Sforza, S.; Galaverna, G.; Ghidini, C.; Caporaso, N.; Vescovi, P.P.; Fogliano, V.; Marchelli, R. Bioavailability of Trans-Resveratrol from Red Wine in Humans. Mol. Nutr. Food Res. 2005, 49, 495–504. [Google Scholar] [CrossRef]
- Rotches-Ribalta, M.; Andres-Lacueva, C.; Estruch, R.; Escribano, E.; Urpi-Sarda, M. Pharmacokinetics of Resveratrol Metabolic Profile in Healthy Humans after Moderate Consumption of Red Wine and Grape Extract Tablets. Pharmacol. Res. 2012, 66, 375–382. [Google Scholar] [CrossRef] [PubMed]
- Donovan, J.L.; Kasim-Karakas, S.; German, J.B.; Waterhouse, A.L. Urinary Excretion of Catechin Metabolites by Human Subjects after Red Wine Consumption. Br. J. Nutr. 2002, 87, 31–37. [Google Scholar] [CrossRef]
- Donovan, J.L.; Bell, J.R.; Kasim-Karakas, S.; German, J.B.; Walzem, R.L.; Hansen, R.J.; Waterhouse, A.L. Catechin Is Present as Metabolites in Human Plasma after Consumption of Red Wine. J. Nutr. 1999, 129, 1662–1668. [Google Scholar] [CrossRef]
- Haas, E.A.; Saad, M.J.; Santos, A.; Vitulo, N.; Lemos, W.J., Jr.; Martins, A.M.; Picossi, C.R.; Favarato, D.; Gaspar, R.S.; Magro, D.O.; et al. A Red Wine Intervention Does Not Modify Plasma Trimethylamine N-Oxide but Is Associated with Broad Shifts in the Plasma Metabolome and Gut Microbiota Composition. Am. J. Clin. Nutr. 2022, 116, 1515–1529. [Google Scholar] [CrossRef]
- Jiménez-Girón, A.; Queipo-Ortuño, M.I.; Boto-Ordóñez, M.; Muñoz-González, I.; Sánchez-Patán, F.; Monagas, M.; Martín-Álvarez, P.J.; Murri, M.; Tinahones, F.J.; Andrés-Lacueva, C.; et al. Comparative Study of Microbial-Derived Phenolic Metabolites in Human Feces after Intake of Gin, Red Wine, and Dealcoholized Red Wine. J. Agric. Food Chem. 2013, 61, 3909–3915. [Google Scholar] [CrossRef]
- Jacobs, D.M.; Deltimple, N.; van Velzen, E.; van Dorsten, F.A.; Bingham, M.; Vaughan, E.E.; van Duynhoven, J. 1H NMR Metabolite Profiling of Feces as a Tool to Assess the Impact of Nutrition on the Human Microbiome. NMR Biomed. 2008, 21, 615–626. [Google Scholar] [CrossRef] [PubMed]
- Urpí-Sardà, M.; Jáuregui, O.; Lamuela-Raventós, R.M.; Jaeger, W.; Miksits, M.; Covas, M.-I.; Andres-Lacueva, C. Uptake of Diet Resveratrol into the Human Low-Density Lipoprotein. Identification and Quantification of Resveratrol Metabolites by Liquid Chromatography Coupled with Tandem Mass Spectrometry. Anal. Chem. 2005, 77, 3149–3155. [Google Scholar] [CrossRef] [PubMed]
- Caccetta, R.A.A.; Croft, K.D.; Beilin, L.J.; Puddey, I.B. Ingestion of Red Wine Significantly Increases Plasma Phenolic Acid Concentrations but Does Not Acutely Affect Ex Vivo Lipoprotein Oxidizability. Am. J. Clin. Nutr. 2000, 71, 67–74. [Google Scholar] [CrossRef] [PubMed]
- Bell, J.R.; Donovan, J.L.; Wong, R.; Waterhouse, A.L.; German, J.B.; Walzem, R.L.; Kasim-Karakas, S.E. (+)-Catechin in Human Plasma after Ingestion of a Single Serving of Reconstituted Red Wine. Am. J. Clin. Nutr. 2000, 71, 103–108. [Google Scholar] [CrossRef]
- González-Domínguez, R.; Jáuregui, O.; Mena, P.; Hanhineva, K.; Tinahones, F.J.; Angelino, D.; Andrés-Lacueva, C. Quantifying the Human Diet in the Crosstalk between Nutrition and Health by Multi-Targeted Metabolomics of Food and Microbiota-Derived Metabolites. Int. J. Obes. 2020, 44, 2372–2381. [Google Scholar] [CrossRef]
- Regueiro, J.; Vallverdú-Queralt, A.; Simal-Gándara, J.; Estruch, R.; Lamuela-Raventós, R.M. Urinary Tartaric Acid as a Potential Biomarker for the Dietary Assessment of Moderate Wine Consumption: A Randomised Controlled Trial. Br. J. Nutr. 2014, 111, 1680–1685. [Google Scholar] [CrossRef]
- Regueiro, J.; Vallverdú-Queralt, A.; Simal-Gándara, J.; Estruch, R.; Lamuela-Raventós, R. Development of a LC-ESI-MS/MS Approach for the Rapid Quantification of Main Wine Organic Acids in Human Urine. J. Agric. Food Chem. 2013, 61, 6763–6768. [Google Scholar] [CrossRef] [PubMed]
- Bub, A.; Watzl, B.; Heeb, D.; Rechkemmer, G.; Briviba, K. Malvidin-3-Glucoside Bioavailability in Humans after Ingestion of Red Wine, Dealcoholized Red Wine and Red Grape Juice. Eur. J. Nutr. 2001, 40, 113–120. [Google Scholar] [CrossRef] [PubMed]
- Vázquez-Fresno, R.; Llorach, R.; Perera, A.; Mandal, R.; Feliz, M.; Tinahones, F.J.; Wishart, D.S.; Andres-Lacueva, C. Clinical Phenotype Clustering in Cardiovascular Risk Patients for the Identification of Responsive Metabotypes after Red Wine Polyphenol Intake. J. Nutr. Biochem. 2016, 28, 114–120. [Google Scholar] [CrossRef]
- Vázquez-Fresno, R.; Llorach, R.; Urpi-Sarda, M.; Khymenets, O.; Bulló, M.; Corella, D.; Fitó, M.; Martínez-González, M.A.; Estruch, R.; Andres-Lacueva, C. An NMR Metabolomics Approach Reveals a Combined-Biomarkers Model in a Wine Interventional Trial with Validation in Free-Living Individuals of the PREDIMED Study. Metabolomics 2014, 11, 797–806. [Google Scholar] [CrossRef]
- Boto-Ordóñez, M.; Urpi-Sarda, M.; Queipo-Ortuño, M.I.; Corella, D.; Tinahones, F.J.; Estruch, R.; Andres-Lacueva, C. Microbial Metabolomic Fingerprinting in Urine after Regular Dealcoholized Red Wine Consumption in Humans. J. Agric. Food Chem. 2013, 61, 9166–9175. [Google Scholar] [CrossRef] [PubMed]
- Vázquez-Fresno, R.; Llorach, R.; Alcaro, F.; Rodríguez, M.Á.; Vinaixa, M.; Chiva-Blanch, G.; Estruch, R.; Correig, X.; Andrés-Lacueva, C. 1H-NMR-Based Metabolomic Analysis of the Effect of Moderate Wine Consumption on Subjects with Cardiovascular Risk Factors. Electrophoresis 2012, 33, 2345–2354. [Google Scholar] [CrossRef]
- Rotches-Ribalta, M.; Urpi-Sarda, M.; Llorach, R.; Boto-Ordoñez, M.; Jauregui, O.; Chiva-Blanch, G.; Perez-Garcia, L.; Jaeger, W.; Guillen, M.; Corella, D.; et al. Gut and Microbial Resveratrol Metabolite Profiling after Moderate Long-Term Consumption of Red Wine versus Dealcoholized Red Wine in Humans by an Optimized Ultra-High-Pressure Liquid Chromatography Tandem Mass Spectrometry Method. J. Chromatogr. A 2012, 1265, 105–113. [Google Scholar] [CrossRef] [PubMed]
- van Dorsten, F.A.; Grün, C.H.; van Velzen, E.J.J.; Jacobs, D.M.; Draijer, R.; van Duynhoven, J.P.M. The Metabolic Fate of Red Wine and Grape Juice Polyphenols in Humans Assessed by Metabolomics. Mol. Nutr. Food Res. 2010, 54, 897–908. [Google Scholar] [CrossRef] [PubMed]
- Van Velzen, E.J.J.; Westerhuis, J.A.; Van Duynhoven, J.P.M.; Van Dorsten, F.A.; Hoefsloot, H.C.J.; Jacobs, D.M.; Smit, S.; Draijer, R.; Kroner, C.I.; Smilde, A.K. Multilevel Data Analysis of a Crossover Designed Human Nutritional Intervention Study. J. Proteome Res. 2008, 7, 4483–4491. [Google Scholar] [CrossRef]
- Motilva, M.J.; Macià, A.; Romero, M.P.; Rubió, L.; Mercader, M.; González-Ferrero, C. Human Bioavailability and Metabolism of Phenolic Compounds from Red Wine Enriched with Free or Nano-Encapsulated Phenolic Extract. J. Funct. Foods 2016, 25, 80–93. [Google Scholar] [CrossRef]
- Ortuño, J.; Covas, M.I.; Farre, M.; Pujadas, M.; Fito, M.; Khymenets, O.; Andres-Lacueva, C.; Roset, P.; Joglar, J.; Lamuela-Raventós, R.M.; et al. Matrix Effects on the Bioavailability of Resveratrol in Humans. Food Chem. 2010, 120, 1123–1130. [Google Scholar] [CrossRef]
- Bitsch, R.; Netzel, M.; Frank, T.; Strass, G.; Bitsch, I. Bioavailability and Biokinetics of Anthocyanins from Red Grape Juice and Red Wine. J. Biomed. Biotechnol. 2004, 2004, 293–298. [Google Scholar] [CrossRef]
- Urpi-Sarda, M.; Boto-Ordóñez, M.; Queipo-Ortuño, M.I.; Tulipani, S.; Corella, D.; Estruch, R.; Tinahones, F.J.; Andres-Lacueva, C. Phenolic and Microbial-Targeted Metabolomics to Discovering and Evaluating Wine Intake Biomarkers in Human Urine and Plasma. Electrophoresis 2015, 36, 2259–2268. [Google Scholar] [CrossRef]
- Jacobs, D.M.; Fuhrmann, J.C.; Van Dorsten, F.A.; Rein, D.; Peters, S.; Van Velzen, E.J.J.; Hollebrands, B.; Draijer, R.; Van Duynhoven, J.; Garczarek, U. Impact of Short-Term Intake of Red Wine and Grape Polyphenol Extract on the Human Metabolome. J. Agric. Food Chem. 2012, 60, 3078–3085. [Google Scholar] [CrossRef]
- Grün, C.H.; van Dorsten, F.A.; Jacobs, D.M.; Le Belleguic, M.; van Velzen, E.J.J.; Bingham, M.O.; Janssen, H.G.; van Duynhoven, J.P.M. GC-MS Methods for Metabolic Profiling of Microbial Fermentation Products of Dietary Polyphenols in Human and in Vitro Intervention Studies. J. Chromatogr. B Anal. Technol. Biomed. Life Sci. 2008, 871, 212–219. [Google Scholar] [CrossRef]
- Soleas, G.J.; Yan, J.; Goldberg, D.M. Ultrasensitive Assay for Three Polyphenols (Catechin, Quercetin and Resveratrol) and Their Conjugates in Biological Fluids Utilizing Gas Chromatography with Mass Selective Detection. J. Chromatogr. B Biomed. Sci. Appl. 2001, 757, 161–172. [Google Scholar] [CrossRef]
- Zamora-Ros, R.; Urpí-Sardà, M.; Lamuela-Raventós, R.M.; Estruch, R.; Vázquez-Agell, M.; Serrano-Martínez, M.; Jaeger, W.; Andres-Lacueva, C. Diagnostic Performance of Urinary Resveratrol Metabolites as a Biomarker of Moderate Wine Consumption. Clin. Chem. 2006, 52, 1373–1380. [Google Scholar] [CrossRef]
- Wang, Y.; Hodge, R.A.; Stevens, V.L.; Hartman, T.J.; McCullough, M.L. Identification and Reproducibility of Plasma Metabolomic Biomarkers of Habitual Food Intake in a Us Diet Validation Study. Metabolites 2020, 10, 382. [Google Scholar] [CrossRef]
- Hernández-Alonso, P.; Papandreou, C.; Bulló, M.; Ruiz-Canela, M.; Dennis, C.; Deik, A.; Wang, D.D.; Guasch-Ferre, M.; Yu, E.; Toledo, E. Plasma Metabolites Associated with Frequent Red Wine Consumption: A Metabolomics Approach within the PREDIMED Study. Mol. Nutr. Food Res. 2019, 63, e1900140. [Google Scholar] [CrossRef]
- Regal, P.; Porto-Arias, J.J.; Lamas, A.; Paz, L.; Barreiro, F.; Cepeda, A. LC-MS as a Tool to Overcome the Limitations of Self-Reported Dietary Assessments in the Determination of Wine Intake. Separations 2017, 4, 17. [Google Scholar] [CrossRef]
- Guertin, K.A.; Moore, S.C.; Sampson, J.N.; Huang, W.Y.; Xiao, Q.; Stolzenberg-Solomon, R.Z.; Sinha, R.; Cross, A.J. Metabolomics in Nutritional Epidemiology: Identifying Metabolites Associated with Diet and Quantifying Their Potential to Uncover Diet-Disease Relations in Populations. Am. J. Clin. Nutr. 2014, 100, 208–217. [Google Scholar] [CrossRef]
- Pallister, T.; Jennings, A.; Mohney, R.P.; Yarand, D.; Mangino, M.; Cassidy, A.; MacGregor, A.; Spector, T.D.; Menni, C. Characterizing Blood Metabolomics Profiles Associated with Self-Reported Food Intakes in Female Twins. PLoS ONE 2016, 11, e0158568. [Google Scholar] [CrossRef] [PubMed]
- Langenau, J.; Oluwagbemigun, K.; Brachem, C.; Lieb, W.; Di Giuseppe, R.; Artati, A.; Kastenmüller, G.; Weinhold, L.; Schmid, M.; Nöthlings, U. Blood Metabolomic Profiling Confirms and Identifies Biomarkers of Food Intake. Metabolites 2020, 10, 468. [Google Scholar] [CrossRef] [PubMed]
- Domínguez-López, I.; Parilli-Moser, I.; Arancibia-Riveros, C.; Tresserra-Rimbau, A.; Martínez-González, M.A.; Ortega-Azorín, C.; Salas-Salvadó, J.; Castañer, O.; Lapetra, J.; Arós, F.; et al. Urinary Tartaric Acid, a Biomarker of Wine Intake, Correlates with Lower Total and Ldl Cholesterol. Nutrients 2021, 13, 2883. [Google Scholar] [CrossRef] [PubMed]
- Zamora-Ros, R.; Rothwell, J.A.; Achaintre, D.; Ferrari, P.; Boutron-Ruault, M.-C.; Mancini, F.R.; Affret, A.; Kühn, T.; Katzke, V.; Boeing, H.; et al. Evaluation of Urinary Resveratrol as a Biomarker of Dietary Resveratrol Intake in the European Prospective Investigation into Cancer and Nutrition (EPIC) Study. Br. J. Nutr. 2017, 117, 1596–1602. [Google Scholar] [CrossRef] [PubMed]
- Noh, H.; Freisling, H.; Assi, N.; Zamora-Ros, R.; Achaintre, D.; Affret, A.; Mancini, F.; Boutron-Ruault, M.-C.; Flögel, A.; Boeing, H.; et al. Identification of Urinary Polyphenol Metabolite Patterns Associated with Polyphenol-Rich Food Intake in Adults from Four European Countries. Nutrients 2017, 9, 796. [Google Scholar] [CrossRef] [PubMed]
- Zamora-Ros, R.; Achaintre, D.; Rothwell, J.A.; Rinaldi, S.; Assi, N.; Ferrari, P.; Leitzmann, M.; Boutron-Ruault, M.-C.; Fagherazzi, G.; Auffret, A.; et al. Urinary Excretions of 34 Dietary Polyphenols and Their Associations with Lifestyle Factors in the EPIC Cohort Study. Sci. Rep. 2016, 6, 26905. [Google Scholar] [CrossRef]
- Playdon, M.C.; Sampson, J.N.; Cross, A.J.; Sinha, R.; Guertin, K.A.; Moy, K.A.; Rothman, N.; Irwin, M.L.; Mayne, S.T.; Stolzenberg-Solomon, R.; et al. Comparing Metabolite Profiles of Habitual Diet in Serum and Urine. Am. J. Clin. Nutr. 2016, 104, 776–789. [Google Scholar] [CrossRef] [PubMed]
- Edmands, W.M.B.; Ferrari, P.; Rothwell, J.A.; Rinaldi, S.; Slimani, N.; Barupal, D.K.; Biessy, C.; Jenab, M.; Clavel-Chapelon, F.; Fagherazzi, G.; et al. Polyphenol Metabolome in Human Urine and Its Association with Intake of Polyphenol-Rich Foods across European Countries. Am. J. Clin. Nutr. 2015, 102, 905–913. [Google Scholar] [CrossRef] [PubMed]
- Zamora-Ros, R.; Urpí-Sardà, M.; Lamuela-Raventós, R.M.; Estruch, R.; Martínez-González, M.Á.; Bulló, M.; Arós, F.; Cherubini, A.; Andres-Lacueva, C. Resveratrol Metabolites in Urine as a Biomarker of Wine Intake in Free-Living Subjects: The PREDIMED Study. Free Radic. Biol. Med. 2009, 46, 1562–1566. [Google Scholar] [CrossRef] [PubMed]
- Wang, Y.; Gapstur, S.M.; Carter, B.D.; Hartman, T.J.; Stevens, V.L.; Gaudet, M.M.; McCullough, M.L. Untargeted Metabolomics Identifies Novel Potential Biomarkers of Habitual Food Intake in a Cross-Sectional Study of Postmenopausal Women. J. Nutr. 2018, 148, 932–943. [Google Scholar] [CrossRef]
- Boughton, B.A.; Hamilton, B. Metabolomics: From Fundamentals to Clinical Applications; Sussulini, A., Ed.; Advances in Experimental Medicine and Biology; Springer International Publishing: Cham, Switzerland, 2017; Volume 965, ISBN 978-3-319-47655-1. [Google Scholar]
- Brennan, L. NMR-Based Metabolomics: From Sample Preparation to Applications in Nutrition Research. Prog. Nucl. Magn. Reson. Spectrosc. 2014, 83, 42–49. [Google Scholar] [CrossRef]
- Nagana Gowda, G.A.; Raftery, D. NMR-Based Metabolomics. Adv. Exp. Med. Biol. 2021, 1280, 19–37. [Google Scholar] [CrossRef]
- Matysik, S.; Le Roy, C.I.; Liebisch, G.; Claus, S.P. Metabolomics of Fecal Samples: A Practical Consideration. Trends Food Sci. Technol. 2016, 57, 244–255. [Google Scholar] [CrossRef]
- Cui, L.; Lu, H.; Lee, Y.H. Challenges and Emergent Solutions for LC-MS/MS Based Untargeted Metabolomics in Diseases. Mass Spectrom. Rev. 2018, 37, 772–792. [Google Scholar] [CrossRef]
- Zhou, B.; Xiao, J.F.; Tuli, L.; Ressom, H.W. LC-MS-Based Metabolomics. Mol. BioSyst. 2012, 8, 470–481. [Google Scholar] [CrossRef] [PubMed]
- Tang, D.-Q.; Zou, L.; Yin, X.-X.; Ong, C.N. HILIC-MS for Metabolomics: An Attractive and Complementary Approach to RPLC-MS. Mass Spectrom. Rev. 2016, 35, 574–600. [Google Scholar] [CrossRef] [PubMed]
- Steuer, A.E.; Brockbals, L.; Kraemer, T. Metabolomic Strategies in Biomarker Research-New Approach for Indirect Identification of Drug Consumption and Sample Manipulation in Clinical and Forensic Toxicology? Front. Chem. 2019, 7, 319. [Google Scholar] [CrossRef] [PubMed]
- Rainville, P.D.; Theodoridis, G.; Plumb, R.S.; Wilson, I.D. Advances in Liquid Chromatography Coupled to Mass Spectrometry for Metabolic Phenotyping. TrAC-Trends Anal. Chem. 2014, 61, 181–191. [Google Scholar] [CrossRef]
- Guo, J.; Huan, T. Comparison of Full-Scan, Data-Dependent, and Data-Independent Acquisition Modes in Liquid Chromatography–Mass Spectrometry Based Untargeted Metabolomics. Anal. Chem. 2020, 92, 8072–8080. [Google Scholar] [CrossRef] [PubMed]
- Fraga-Corral, M.; Carpena, M.; Garcia-Oliveira, P.; Pereira, A.G.; Prieto, M.A.; Simal-Gandara, J. Analytical Metabolomics and Applications in Health, Environmental and Food Science. Crit. Rev. Anal. Chem. 2022, 52, 712–734. [Google Scholar] [CrossRef]
- Chen, Y.; Li, E.; Xu, L.-Y. Guide to Metabolomics Analysis: A Bioinformatics Workflow. Metabolites 2022, 12, 357. [Google Scholar] [CrossRef]
- Liu, X.; Zhou, L.; Shi, X.; Xu, G. New Advances in Analytical Methods for Mass Spectrometry-Based Large-Scale Metabolomics Study. TrAC-Trends Anal. Chem. 2019, 121, 115665. [Google Scholar] [CrossRef]
- Khamis, M.M.; Adamko, D.J.; El-Aneed, A. Mass Spectrometric Based Approaches in Urine Metabolomics and Biomarker Discovery. Mass Spectrom. Rev. 2017, 36, 115–134. [Google Scholar] [CrossRef]
- Defossez, E.; Bourquin, J.; von Reuss, S.; Rasmann, S.; Glauser, G. Eight Key Rules for Successful Data-dependent Acquisition in Mass Spectrometry-based Metabolomics. Mass Spectrom. Rev. 2021, 42, 131–143. [Google Scholar] [CrossRef] [PubMed]
- Lenz, E.M.; Wilson, I.D. Analytical Strategies in Metabonomics. J. Proteome Res. 2007, 6, 443–458. [Google Scholar] [CrossRef]
- Smolinska, A.; Blanchet, L.; Buydens, L.M.C.; Wijmenga, S.S. Analytica Chimica Acta NMR and Pattern Recognition Methods in Metabolomics: From Data Acquisition to Biomarker Discovery: A Review. Anal. Chim. Acta 2012, 750, 82–97. [Google Scholar] [CrossRef] [PubMed]
- Zhang, A.; Sun, H.; Wang, P.; Han, Y.; Wang, X. Modern Analytical Techniques in Metabolomics Analysis. Analyst 2012, 137, 293–300. [Google Scholar] [CrossRef] [PubMed]
- Qu, Z.; Liu, A.; Li, P.; Liu, C.; Xiao, W.; Huang, J.; Liu, Z.; Zhang, S. Advances in Physiological Functions and Mechanisms of (−)-Epicatechin. Crit. Rev. Food Sci. Nutr. 2021, 61, 211–233. [Google Scholar] [CrossRef] [PubMed]
- Kaliora, A.C.; Kanellos, P.T.; Kalogeropoulos, N. Gallic Acid Bioavailability in Humans. In Handbook on Gallic Acid: Natural Occurrences, Antioxidant Properties and Health Implications; Nova Science Publishers: Hauppauge, NY, USA, 2013; pp. 301–312. ISBN 978-1-62618-921-8. [Google Scholar]
- Ou, S.; Kwok, K.-C. Ferulic Acid: Pharmaceutical Functions, Preparation and Applications in Foods. J. Sci. Food Agric. 2004, 84, 1261–1269. [Google Scholar] [CrossRef]
- Srinivasan, M.; Sudheer, A.R.; Menon, V.P. Ferulic Acid: Therapeutic Potential Through Its Antioxidant Property. J. Clin. Biochem. Nutr. 2007, 40, 92–100. [Google Scholar] [CrossRef]
- Magnani, C.; Isaac, V.L.B.; Correa, M.A.; Salgado, H.R.N. Caffeic Acid: A Review of Its Potential Use in Medications and Cosmetics. Anal. Methods 2014, 6, 3203–3210. [Google Scholar] [CrossRef]
- Aldaba-Muruato, L.; Ventura-Juárez, J.; Perez-Hernandez, A.; Hernández-Morales, A.; Muñoz-Ortega, M.; Martínez-Hernández, S.; Alvarado-Sánchez, B.; Macías-Pérez, J. Therapeutic Perspectives of p-coumaric Acid: Anti-necrotic, Anti-cholestatic and Anti-amoebic Activities. World Acad. Sci. J. 2021, 3, 47. [Google Scholar] [CrossRef]
- Srinivasulu, C.; Ramgopal, M.; Ramanjaneyulu, G.; Anuradha, C.M.; Suresh Kumar, C. Syringic Acid (SA)—A Review of Its Occurrence, Biosynthesis, Pharmacological and Industrial Importance. Biomed. Pharmacother. 2018, 108, 547–557. [Google Scholar] [CrossRef]
- Cutler, R. Sphingomyelin and Ceramide as Regulators of Development and Lifespan. Mech. Ageing Dev. 2001, 122, 895–908. [Google Scholar] [CrossRef]
- Ridgway, N.D. Interactions between Metabolism and Intracellular Distribution of Cholesterol and Sphingomyelin. Biochim. Biophys. Acta-Mol. Cell Biol. Lipids 2000, 1484, 129–141. [Google Scholar] [CrossRef]
- Ribéreau-Gayon, P.; Glories, Y.; Maujean, A.; Dubourdieu, D. Handbook of Enology; Wiley: Hoboken, NJ, USA, 2006; Volume 6, ISBN 9780470010372. [Google Scholar]
- Patel, K.; Patel, D.K. The Beneficial Role of Rutin, A Naturally Occurring Flavonoid in Health Promotion and Disease Prevention: A Systematic Review and Update. In Bioactive Food as Dietary Interventions for Arthritis and Related Inflammatory Diseases; Elsevier: Amsterdam, The Netherlands, 2019; pp. 457–479. ISBN 9780128138205. [Google Scholar]
- Liu, Y.; Shi, C.; Zhang, G.; Zhan, H.; Liu, B.; Li, C.; Wang, L.; Wang, H.; Wang, J. Antimicrobial Mechanism of 4-Hydroxyphenylacetic Acid on Listeria Monocytogenes Membrane and Virulence. Biochem. Biophys. Res. Commun. 2021, 572, 145–150. [Google Scholar] [CrossRef] [PubMed]
- Carrasco-Pozo, C.; Gotteland, M.; Castillo, R.L.; Chen, C. 3,4-Dihydroxyphenylacetic Acid, a Microbiota-Derived Metabolite of Quercetin, Protects Against Pancreatic Β-Cells Dysfunction Induced By High Cholesterol. Exp. Cell Res. 2015, 334, 270–282. [Google Scholar] [CrossRef] [PubMed]
- Henning, S.M.; Wang, P.; Abgaryan, N.; Vicinanza, R.; de Oliveira, D.M.; Zhang, Y.; Lee, R.P.; Carpenter, C.L.; Aronson, W.J.; Heber, D. Phenolic Acid Concentrations in Plasma and Urine from Men Consuming Green or Black Tea and Potential Chemopreventive Properties for Colon Cancer. Mol. Nutr. Food Res. 2013, 57, 483–493. [Google Scholar] [CrossRef]
- Edwards, S.J.; Carter, S.; Nicholson, T.; Allen, S.L.; Morgan, P.T.; Jones, S.W.; Rendeiro, C.; Breen, L. (-)-Epicatechin and Its Colonic Metabolite Hippuric Acid Protect against Dexamethasone-Induced Atrophy in Skeletal Muscle Cells. J. Nutr. Biochem. 2022, 110, 109150. [Google Scholar] [CrossRef]
- Aschoff, J.K.; Riedl, K.M.; Cooperstone, J.L.; Högel, J.; Bosy-Westphal, A.; Schwartz, S.J.; Carle, R.; Schweiggert, R.M. Urinary Excretion of Citrus Flavanones and Their Major Catabolites after Consumption of Fresh Oranges and Pasteurized Orange Juice: A Randomized Cross-over Study. Mol. Nutr. Food Res. 2016, 60, 2602–2610. [Google Scholar] [CrossRef] [PubMed]
- Urpi-Sarda, M.; Llorach, R.; Khan, N.; Monagas, M.; Rotches-Ribalta, M.; Lamuela-Raventos, R.; Estruch, R.; Tinahones, F.J.; Andres-Lacueva, C. Effect of Milk on the Urinary Excretion of Microbial Phenolic Acids after Cocoa Powder Consumption in Humans. J. Agric. Food Chem. 2010, 58, 4706–4711. [Google Scholar] [CrossRef] [PubMed]
- Rechner, A.R.; Spencer, J.P.; Kuhnle, G.; Hahn, U.; Rice-Evans, C.A. Novel Biomarkers of the Metabolism of Caffeic Acid Derivatives In Vivo. Free Radic. Biol. Med. 2001, 30, 1213–1222. [Google Scholar] [CrossRef]
- Rechner, A.R.; Kuhnle, G.; Bremner, P.; Hubbard, G.P.; Moore, K.P.; Rice-Evans, C.A. The Metabolic Fate of Dietary Polyphenols in Humans. Free Radic. Biol. Med. 2002, 33, 220–235. [Google Scholar] [CrossRef]
- Tabone, M.; García-Merino, J.A.; Bressa, C.; Rocha Guzman, N.E.; Herrera Rocha, K.; Chu Van, E.; Castelli, F.A.; Fenaille, F.; Larrosa, M. Chronic Consumption of Cocoa Rich in Procyanidins Has a Marginal Impact on Gut Microbiota and on Serum and Fecal Metabolomes in Male Endurance Athletes. J. Agric. Food Chem. 2022, 70, 1878–1889. [Google Scholar] [CrossRef] [PubMed]
- Bouatra, S.; Aziat, F.; Mandal, R.; Guo, A.C.; Wilson, M.R.; Knox, C.; Bjorndahl, T.C.; Krishnamurthy, R.; Saleem, F.; Liu, P.; et al. The Human Urine Metabolome. PLoS ONE 2013, 8, e73076. [Google Scholar] [CrossRef] [PubMed]


| Study Type | Intervention Period | Participants (Gender) | Health of Participants | Control Group | Wine (mL)/day | Type of Wine (Variety of Wine) | Matrix | Metabolomic Analysis | Analytical Technique (Mode) | Sample Preparation | Statistical Analysis | Ref. |
|---|---|---|---|---|---|---|---|---|---|---|---|---|
| crossover | 20 days | 8 (m, f) | healthy | 272, 100 (gin) | RW, DRW, gin (Merlot) | feces | Targeted | UPLC-ESI-MS/MS (−) | dilution with NaCl and again with ACN | Student’s t-test, nonparametric Wilcoxon matched-pairs test, PCA | [35] | |
| crossover | 4 weeks | 53 (m, f) | mildly hypertensive | capsules with mix of RW and GJ EXT | feces | Targeted | H-NMR | alkalized with NaOH and acidified with formic acid, LLE with D2O, CD3OD both containing TSP | Student’s t-test, PCA, PLS-DA | [36] | ||
| crossover | 1 day | 11 (m) | healthy | 250 | RW (Merlot) | plasma | Targeted | LC-ESI-MS/MS (±) | 3 different methods tested [HLB SPE (selected), PPT with acidified MeOH, LLE with ethyl acetate] | - | [37] | |
| crossover | 1 day | 12 (m) | healthy | RW, DRW, Phenol-stripped RW, water (Cabernet Shiraz) | plasma | Targeted | GC-MS | lyophilization, acetate buffer (pH 4.5), hydrolysis with b-glucuronidase, sulfatase, b-glucosidase, LLE with ethyl acetate, derivatization with BSTFA | ANOVA, general linear modelling | [38] | ||
| crossover | 1 day | 9 (m, f) | healthy | 120 | water, DRW, water and alcohol (ARW) (Cabernet sauvignon) | plasma | Targeted | GC-MS | hydrolysis with b-glucuronidase, arylsulfatase, LLE with methylene chloride/water and ethyl acetate, derivatization with BSTFA | Student’s t test, Wilcoxon signed-rank test, Fisher’s exact test | [39] | |
| crossover | 1 day | 9 (m, f) | nm | 120 | RW, DRW (Cabernet Sauvignon) | plasma | Targeted | GC-MS | hydrolysis with β-glucuronidase, sulfatase, LLE with methylene chloride/water and ethyl acetate, derivatization with BSTFA | Least-squares nonlinear regression, ANOVA, Student’s t-test | [33] | |
| crossover | 3 weeks | 42 (m) | CAD | - | 250 | RW (Merlot) | plasma | Non targeted | LC-MS/MS, UPLC-ESI-MS/MS (±) | PPT with MeOH | Shapiro-Wilk test, Student’s t-test, paired Wilcoxon test, Spearman rank correlation test, Bonferroni test | [34] |
| crossover | 4 weeks | 10 (m, f) | healthy | 270 | RW (nm) | plasma | Targeted | UHPLC-MS/MS (±) | 3 different methods tested [PPT with ACN/formic acid/ammonium formate, HLB SPE, hybrid PPT] | Student’s t-test | [40] | |
| crossover | 1 day | 21 (m) | healthy | 100, 200, 300 | RW (Tempranillo (85%), Graciano and Garnacha Tinta (15%)) | urine | Targeted | LC–ESI-MS/MS (−) | dilution with formic acid/water | omnibus K2 D’Agostino-Pearson test, Shapiro-Wilk test, non-parametric Mann-Whitney U test, Wilcoxon test, Clopper-Pearson exact binomial method. | [41] | |
| crossover | 1 day | 5 (m) | healthy | 200 | RW (Tempranillo) | urine | Targeted | LC−ESI-MS/MS (−) | dilution with water/formic acid | Student’s t-test | [42] | |
| crossover | 1 day | 9 (m, f) | healthy | 120 | RW, DRW (Cabernet Sauvignon) | urine | Targeted | GC-MS | hydrolysis with β-d-glucuronidase, sulfatase, LLE with ethyl acetate, derivatization with BSTFA | Student’s t-test | [32] | |
| crossover | 1 day | 6 (m) | healthy | 500 | RW, DRW, GJ (Lemberger) | urine | Targeted | HPLC-UV-Vis (+) | C18 SPE | ANOVA, Fischer’s test, linear regression analysis | [43] | |
| crossover | 4 weeks | 57 (m, f) | T2D or ≥3 CHD risk factors | DRW (Merlot) | urine | Non targeted | H-NMR | Mixed with TSP, NaN3, KH2PO4 in D2O-buffer KOD (pH = 7) | OSC-PLS-DA | [44] | ||
| crossover | 4 weeks | 56 (m, f) | T2D or ≥3 CHD risk factors | 272, 100 (gin) | RW, DRW, gin (nm) | urine | Non targeted | H-NMR | Mixed with TSP, NaN3, KH2PO4 in D2O | Mann-Whitney U test, Mann-Whitney test, logistic regression model | [45] | |
| crossover | 4 weeks | 36 (m) | healthy | 272 | DRW (Merlot) | urine | Targeted | UPLC−MS/MS (−) | MCX SPE | Student’s t-test | [46] | |
| crossover | 4 weeks | 61 (m) | T2D or ≥3 CHD risk factors | 272, 100 (gin) | RW, DRW, gin (Merlot) | urine | Non targeted | H-NMR | Mixed with TSP, NaN3, KH2PO4 in D2O-buffer KOD (pH = 7) | ANOVA test, Fisher’s LSD test | [47] | |
| crossover | 4 weeks | 10 (m) | T2D or ≥3 CHD risk factors | 272 | RW (Merlot), DRW | urine | Targeted | UPLC–MS/MS (−) | HLB SPE | Kolmogorov test, Levene test, nonparametric Friedman test, paired Wilcoxon test | [48] | |
| crossover | 4 weeks | 58 (m, f) | mildly hypertensive | capsules 2:1 polyphenol-rich mix of RW and GJ EXTs, capsules with GJ EXT | urine | GC-TOF-MS: target, H-NMR: Non targeted | H-NMR, GC-TOF-MS | H-NRM: phosphate buffer (pH 7, TSP) GC-MS: hydrolysis with β-glucuronidase, LLE with ethyl acetate, derivatization with BSTFA/trimethylchlorosilane | Wilcoxon test, ML-PLS-DA | [49] | ||
| crossover | 4 weeks | 29 (m, f) | mildly hypertensive | capsules with mix of RW EXT and GJ EXT | urine | Non targeted | H-NMR | buffer phosphate and sodium salt (TSP)) (pH 3) | PLS-DA | [50] | ||
| crossover | 1 day | 12 (m, f) | healthy | 272, 100 (gin) | DRW with EXT, DRW with encapsulated EXT, gin | urine, plasma | Targeted | UPLC-ESI-MS/MS (±) | HLB SPE | ANOVA, Tukey’s test | [51] | |
| crossover | 1 day | 11 (m) | healthy | 250, 1000 (GJ), 10 tablets | RW, GJ, capsules with RW EXT (nm) | urine, plasma | Targeted | GC-MS | urine: dilution with water, plasma/urine: acetate buffer (pH 5.2), hydrolysis with β-glucuronidase, LLE with ACN/ethyl acetate (in urine a solution of NaCl were added before extraction), derivatisedwith MSTFA: NH4I: 2-mercaptoethanol reaction mixture (ammonium iodide and 2-mercaptoethanol per litter of MSTFA) | least-square regression analysis | [52] | |
| crossover | 1 day | 9 (m, f) | healthy | 400 | RW, GJ (Lemberger) | urine, plasma | Targeted | HPLC-UV-Vis (+) | C18 SPE | Shapiro-Wilk test, Student’s t-test | [53] | |
| crossover | 4 weeks | 36 (m) | T2D or ≥3 of the CVRFs | 272, 100 (gin) | RW, DRW (Merlot), gin | urine, plasma | Targeted | UPLC-ESI-MS/MS (−) | HLB SPE | PCA, HCA, ANOVA, Bonferroni test, Binary stepwise logistic regression analysis | [54] | |
| crossover | 5 days | 35 (m) | healthy | 630 | capsules 2:1 polyphenol-rich mix of RW and GJ EXTs | urine, plasma | H-NMR: target, GC-MS, LC-MS/MS: target and Non targeted | GC-MS, LC-MS/MS (±), H-NMR | plasma: PPT with ACN, LLE with water/ethanol/dichloromethane. urine: dilution H-NMR urine: see [49] GC-MS: fatty acid esterification, derivatization with O-methylhydroxyamine hydrochloride, MSTFA | Mann-Whitney U test, Wilcoxon test | [55] | |
| crossover | 4 weeks | 26 (m, f) | nm | capsules with mix of RW EXT and GJ EXT | urine, plasma, feces | Non targeted | GC–TOF–MS | urine, plasma: hydrolysis with β-d-glucuronidase, acidification with HCl, LLE with ethyl acetate, derivatization: BSTFA/TMCS | PCA, OPLS-DA | [56] | ||
| crossover | 1 day | 10 (nm) | nm | WW, GJ, vegetable cocktail (Lindemans Chardonnay) | urine, serum | Targeted | GC–MS | LLE with ethyl acetate, derivatization with BSTFA | Pearson test | [57] | ||
| crossover | 4 weeks | 52 (m, f) | healthy | 200 (RW, WW), 300 (sparkling wine), 100 (gin) | RW, WW, gin (nm) | urine, serum | Targeted | LC-MS/MS (−) | HLB SPE | Kolmogorov test, Levene test, Wilcoxon test, Student’s t-test, ANOVA | [58] | |
| parallel | 4 weeks | 19 (m, f) | healthy | abstention (5) | 250 | RW (nm) | feces | Targeted | UPLC-ESI-MS/MS (−), SPME-GCMS | DVB/CAR/PDMS SPME | Shapiro–Wilk test, Levene test, One-way ANOVA, Tukey’s test, Student’s t-test | [22] |
| parallel | 4 weeks | 8 (m, f) | healthy | abstention (4) | 250 | RW (Pinot Noir) | feces | Targeted | UPLC-ESI-MS/MS (−), SPME-GCMS | phenolic metabolites: dilution with NaCl and again with ACN/water short-chain fatty acids: SPE | Student’s t-test | [23] |
| parallel | 4 weeks | 41 (m, f) | healthy | abstention (8) | 250 | RW (Pinot Noir) | feces | Non targeted | UPLC-TOF-MS (−) | dilution (x2) with NaCl, filtered with polyvinylidene difluoride (PVDF) membrane | Shapiro-Wilk test, Student’s t-test, Wilcoxon matched-pairs test, PCA | [27] |
| parallel | 4 weeks | 41 (m, f) | healthy | abstention (8) | 250 | RW (Pinot Noir) | feces | Targeted and Non targeted | UPLC-ESI-MS/MS (−), UPLC-TOF/MS (−) | dilution with NaCl and again with ACN | Shapiro-Wilk test, Student’s t-test, Mann-Whitney test, Wilcoxon matched-pairs test, PCA | [26] |
| parallel | 4 weeks | 41 (m, f) | healthy | 250 | RW (Pinot Noir) | feces | Targeted | UPLC-ESI-MS/MS (−) | dilution with NaCl and again with ACN | Student’s t-test, Mann-Whitney test, Wilcoxon matched-pairs test, one-way ANOVA, Shapiro-Wilk test | [28] | |
| parallel | 15 days | 20 (m, f) | healthy | Abstention (10) | 300 | RW, WW (nm) | plasma | Τargeted | HPLC-ESA | hydrolysis with glucuronidase/sulfatase, acetate buffer (pH 5.0), LLE with ethyl acetate | one-way ANOVA, non-parametric tests (Wilcoxon test, Kolmogorov-Smirnov test), Levene test, MANOVA, Bonferroni test, correlation analysis using Pearson’s test | [29] |
| parallel | 1 day | 25 (10, 5, 5 all m) | healthy | - | 300, 600, 600 | RW (Lambrusco, Cabernet Franc, Agliatico) | serum | Targeted | HPLC-UV-Vis (+), HPLC-MS (−), HPLC-MS/MS (−) | LLE with ethyl acetate | - | [30] |
| parallel | 4 weeks | 41 (m, f) | healthy | abstention (8) | 250 | RW (Pinot Noir) | urine | Non targeted | UPLC-QTOF-MS (−) | centrifugation and direct analysis | PCA, HCA, one-way ANOVA, OPLS-DA | [24] |
| parallel | 4 weeks | 41 (m, f) | healthy | abstention (8) | 250 | RW (Pinot Noir) | urine | Non targeted | UPLC-TOF-MS (−) | centrifugation and direct analysis | PCA, Student’s t-test, OPLS-DA | [25] |
| parallel | 1 day | 10 (m) | healthy | grape EXT tablets (3) | 375 | RW (Merlot) | urine, plasma | Targeted | LC–ESI–MS/MS (−) | HLB SPE | Mann–Whitney U test, Wilcoxon test | [31] |
| Number of Participants (Gender) | Health of Participants | Matrix | Metabolomic Analysis | Analytical Technique (Mode) | Sample Preparation | Statistical Analysis | Ref. |
|---|---|---|---|---|---|---|---|
| 671 (m, f) | general population | plasma | Targeted | UPLC-ESI-MS/MS (±) | PPT with MeOH | Pearson’s partial correlation | [59] |
| 1157 (m, f) | T2D or ≥3 major CVRFs | plasma | Non targeted | UPLC-MS/MS (−) | amino acids and other polar metabolites: LLE with ACN/MeOH/formic acid, lipids: LLE with isopropanol | cross-validation | [60] |
| 25 (nm) | healthy | plasma | Targeted | HPLC-ESI-MS/MS (± tested but–preferred) | PPT with acetic acid, HLB SPE | not used a statistical analysis test rather than statistical parameters | [61] |
| 502 (m, f) | healthy | plasma | Non targeted | UPLC-ESI-MS/MS (±) | PPT with MeOH | 2-sided statistical tests (chi-square test, Mann-Whitney U Test), FDRs, LASSO regression | [62] |
| 3559 (f) | general population | plasma, serum | Targeted and Non targeted | UPLC-MS/MS (±), GC-MS | UPLC: PPT with MeOH, GC: PPT with MeOH, derivatization: BSTF | linear regression analysis | [63] |
| 849 (m, f) | general population | serum | Non targeted | UPLC-ESI-MS/MS (−) | LLE with MeOH | Student’s t-tests, chi-square test | [64] |
| 222 (m, f) | T2D or ≥3 major CVRFs | urine | Targeted | LC–ESI-MS/MS (−) | dilution with water/formic acid | Shapiro-Wilk test, multiple adjusted linear regression models | [65] |
| 475 (m, f) | general population | urine | Targeted | UHPLC-ESI-MS/MS (+) | hydrolysis with β-glucuronidase, sulfatase, LLE with ethyl acetate | one-way ANOVA, Spearman’s rank correlations, partial Spearman’s correlations | [66] |
| 475 (m, f) | general population | urine | Targeted | UPLC-ESI-MS-MS (+) | hydrolysis with β-glucuronidase, sulfatase LLE with ethyl acetate | expectation-maximization (EM) algorithm, GLMs, RRR-VIP method, reduced rank regression, LASSO regression, RRR analysis, internal two-fold cross-validation | [67] |
| 1386 (m, f) | general population | urine | Targeted | UPLC-ESI-MS/MS | hydrolysis with β-glucuronidase, sulfatase LLE with ethyl acetate | PC-PR2, one-way ANOVA | [68] |
| 253 (m, f) | new or recurrent colorectal adenoma cases and adenoma-free controls | urine | Non targeted | UPLC-MS, UPLC-ESI-MS/MS (±), GC-MS | direct analysis | Wilcoxon’s signed rank test, chi-square test, Partial Pearson correlation, FDR calculation (Benjamini-Hochberg procedure), LASSO regression | [69] |
| 481 (m, f) | general population | urine | Non targeted | UPLC-QTOF-MS (−) | dilution with water | OPLS-DA, HCA | [70] |
| 1000 (m, f) | T2D or ≥3 CHD risk factors | urine | Targeted | UPLC-MS/MS (−) | HLB SPE | chi-square tests, Kolmogorov test, Levene test, one way ANOVA, Mann-Whitney test | [71] |
| 1369 (f) | healthy postmenopausal women | serum, urine | Non targeted | UPLC-ESI-MS/MS (±) | PPT with MeOH | Pearson’s partial correlation, linear Support Vector Machine multivariate classification model | [72] |
| Effect of Wine Consumption | Name | Molecular Formula | Sample | Analytical Technique | Ref. | |
|---|---|---|---|---|---|---|
| up | Phenol sulfate | C6H6O4S | urine | UPLC-QTOF-MS | [25] | |
| Quinic acid | C7H12O6 | urine | UPLC-QTOF-MS | [24] | ||
| Phenylpropanoic acids | 3-(4-hydroxyphenyl)lactate | C9H9O4- | plasma | UPLC-MS/MS, GC-MS | [63] | |
| 3-hydroxyphenylpropionic acid | C9H10O3 | urine | H-NMR, GC-TOF-MS | [49] | ||
| Vanillactic acid | C10H12O5 | plasma | LC-MS/MS, UPLC-MS/MS | [34] | ||
| up | Homovanillic acid | C9H10O4 | urine | UPLC-MS/MS, GC-MS, GC–TOF–MS | [34,49,56] | |
| down | Homovanillic acid sulfate | C9H10O7S | urine | UPLC-QTOF-MS | [25] | |
| 4-hydroxymandelic acid | C8H8O4 | urine | GC-MS, GC–TOF–MS | [49,56] | ||
| down | 4-methoxyphenylethanol sulfate | C9H12O6S | urine | UPLC-QTOF-MS | [25] | |
| Gallic acid metabolites | Gallic acid | C7H6O5 | urine, plasma | UPLC-ESI-MS-MS, UPLC−MS/MS | [46,54,76] | |
| Gallic acid sulfate | C7H6O8S | urine | UPLC-MS/MS | [51] | ||
| Gallic acid glucuronide | C13H16O10 | urine | UPLC-MS/MS | [51] | ||
| up | 4-O-methylgallic acid | C8H8O5 | urine, plasma | UPLC-QTOF-MS, UPLC−MS/MS, GC-MS | [38,46,70] | |
| up | 3-O-methylgallic acid | C8H8O5 | feces | UPLC-ESI-MS/MS, UPLC-TOF-MS | [26,28,35] | |
| Methylgallic acid sulfate | C8H8O8S | urine | UPLC-QTOF-MS, UPLC−MS/MS | [46,54,70] | ||
| up | Gallic acid ethyl ester | C9H10O5 | urine | UPLC-ESI-MS/MS | [67,68] | |
| Gallic acid ethyl ester sulfate | C9H10O8S | urine | UPLC-QTOF-MS | [70] | ||
| Ethylgallate | C9H10O5 | urine | UPLC−MS/MS | [46,54] | ||
| Ethylgallate glucuronide 1,2 | C15H18O11 | urine | UPLC−MS/MS | [46] | ||
| Ethylgallate sulfate | C9H10O8S | urine | UPLC−MS/MS | [46,54] | ||
| Pyrogallol (1,2,3-trihydroxybenzene) | C6H6O3 | urine | UPLC−MS/MS, GC-MS, GC-MS, LC-MS/MS | [46,49,55] | ||
| up | Pyrogallol sulfate | C6H6O6S | urine | UPLC-QTOF-MS | [25] | |
| up | Phloroglucinol (1,3,5-trihydroxybenzene) | C6H6O3 | urine | UPLC-QTOF-MS | [25] | |
| Tyrosols | Hydroxytyrosol | C8H10O3 | urine | UPLC-ESI-MS-MS, UPLC-TOF-MS | [25,51,68] | |
| Hydroxytyrosol sulfate | C8H10O6S | urine | UPLC-QTOF-MS, UPLC-ESI-MS/MS | [51] | ||
| down | Hydroxytyrosol glucoside | C14H20O8 | urine | UPLC-QTOF-MS | [25] | |
| Tyrosol | C8H10O2 | urine | UPLC-ESI-MS/MS | [68] | ||
| up | Tyrosol sulfate | C8H10O5S | urine | UPLC-TOF-MS | [25] | |
| Hydroxyhippuric acids | Vanilloylglycine | C10H11NO5 | urine | UPLC-MS/MS | [46] | |
| Cinnamic acids and derivatives | (Z)-N-Feruloyl-5-hydroxyanthranilic acid | C17H15NO6 | urine | UPLC-QTOF-MS | [24] | |
| Hydrocinnamic acids | up | Coumaroyl-glucose | C15H18O8 | urine | UPLC-QTOF-MS | [25] |
| Ferulic acid/Isoferulic acid | C10H10O4 | urine | UPLC−MS/MS, LC-MS/MS, GC-MS | [46,49,55] | ||
| up | Ferulic/isoferulic acid sulfate | C10H10O7S | urine | UPLC-ESI-MS/MS, UPLC-TOF-MS | [25,51] | |
| Ferulic acid glucuronide | C16H18O10 | urine | UPLC-MS/MS | [51] | ||
| Dihydroferulic acid | C10H12O4 | urine | H-NMR, GC-TOF-MS | [49] | ||
| up | Caffeic acid | C9H8O4 | urine, plasma | UPLC−MS/MS, UPLC-TOF-MS, HPLC-ESA | [25,29,38,46] | |
| down | Caffeic acid sulfate | C9H8O7S | urine | UPLC−MS/MS, UPLC-TOF-MS, HPLC-ESA | [25,51] | |
| Dihydrocaffeic acid | C9H10O3 | urine | UPLC−MS/MS | [46] | ||
| down | Dihydrocaffeic acid 3-sulfate | C9H10O7S | urine | UPLC-QTOF-MS | [25] | |
| Sinapic acid | C11H12O5 | urine | UPLC−MS/MS | [46] | ||
| p-coumaric | C9H8O3 | urine, plasma, feces | UPLC-MS/MS, UPLC-ESI-MS/MS | [35,46,54,68] | ||
| m-coumaric | C9H8O3 | urine, feces | UPLC-ESI-MS/MS | [22,46] | ||
| m-coumaric acid sulfate | C9H8O6S | urine | UPLC-QTOF-MS | [70] | ||
| down | Piplartine | C17H19NO5 | urine | UPLC-QTOF-MS | [25] | |
| Hydroxybenzoic acid derivatives | 3-hydroxybenzoic acid | C7H6O3 | urine | UPLC−MS/MS | [46] | |
| 4-hydroxybenzoic acid | C7H6O3 | urine, plasma | UPLC−MS/MS, GC-MS | [46,49] | ||
| 2,4-dihydroxybenzoic acid | C7H6O4 | urine | UPLC−MS/MS | [46,54] | ||
| up | 2,5-dihydroxybenzoic acid (gentisate) | C7H6O4 | urine, plasma | UPLC−MS/MS | [34,46] | |
| 2,6-dihydroxybenzoic acid | C7H6O4 | urine | UPLC−MS/MS | [46] | ||
| up | 3,5-dihydroxybenzoic acid | C7H6O4 | urine, feces | UPLC-ESI-MS/MS, UPLC-TOF-MS | [26,28,35,46] | |
| 3-(3-hydroxyphenyl)propionic acid or 3-(4-hydroxyphenyl)propionic acid | C9H10O3 | urine, feces | UPLC-QTOF/MS, UPLC-ESI-MS/MS, GC–TOF–MS | [22,26,27,46,56] | ||
| 3-(3-hydroxyphenyl)-3-hydroxypropionic acid | C9H10O4 | urine | GC-MS, GC–TOF–MS | [49,56] | ||
| up | Vanillic acid (3-methoxy-4-hydroxybenzoic acid) | C8H8O4 | urine, feces | UPLC−MS/MS, GC-MS, GC–TOF–MS, UPLC-ESI-MS/MS | [26,28,35,46,49,55,56] | |
| Isovanillic acid (4-methoxy-3-hydroxybenzoic acid) | C8H8O4 | urine | H-NMR, GC-TOF-MS | [49] | ||
| up | Vanillic acid 4-sulfate | C8H8O7S | urine | UPLC-QTOF-MS | [25] | |
| up | Protocatechuic acid | C7H6O4 | urine, plasma, feces | UPLC-MS/MS, UPLC-ESI-MS/MS, UPLC-TOF-MS | [26,28,35] | |
| Protocatechuic acid sulfate | C7H6O7S | urine | UPLC-MS/MS | [51] | ||
| Syringic acid (4-hydroxy-3,5-dimethoxybenzoic acid) | C9H10O5 | urine, plasma, feces | UPLC−MS/MS, GC-MS, GC–TOF–MS, UPLC-ESI-MS/MS, UPLC-TOF-MS | [26,28,35,46,49,56] | ||
| Syringic acid sulfate | C9H10O8S | urine | UPLC-ESI-MS/MS, UPLC-QTOF-MS | [51,70] | ||
| Syringic acid glucuronide | C15H18O11 | urine | UPLC-MS/MS | [51] | ||
| down | Methyl 3-(2,3-dihydroxy-3-methylbutyl)-4-hydroxybenzoate (Hostmaniane) | C13H18O5 | urine | UPLC-QTOF-MS | [25] | |
| Hydroxycoumarins | 4-hydroxycoumarin | C9H6O3 | plasma | LC-MS/MS, UPLC-MS/MS | [34] | |
| Coumarins and derivatives | Urolithin A | C13H8O4 | urine | UPLC-QTOF-MS | [24] | |
| Cis-caffeoyl tartaric acid/caftaric acid | C13H12O9 | urine | UPLC-QTOF-MS | [24] | ||
| up | Aurantricholide B | C17H10O6 | urine | UPLC-QTOF-MS | [24] | |
| 5-(6-hydroxy-3,7-dimethyl-2,7-octadienyloxy)-7-methoxycoumarin | C20H24O5 | urine | UPLC-QTOF-MS | [24] | ||
| Catechols | Catechol/pyrocatechol | C6H6O2 | urine, feces | LC-MS/MS, UPLC-ESI-MS/MS, GC-MS | [22,55] | |
| up | (Pyro) catechol sulfate | C6H6O5S | urine | UPLC-QTOF-MS | [25] | |
| 3-methoxycatechol sulfate | C7H6O7S | plasma | LC-MS/MS, UPLC-MS/MS | [34] | ||
| up | O-methoxycatechol-o-sulfate | C7H8O5S | urine | UPLC-QTOF-MS | [25] | |
| 3,4-dihydrophenylglycol | C8H10O4 | urine | GC-MS, LC-MS/MS, H-NMR | [55] | ||
| up | 4-hydroxy-5-(3-hydroxyphenyl)-valeric acid | C11H14O4 | feces | UPLC-QTOF-MS, UPLC-ESI-MS/MS | [26,27] | |
| up | 4-hydroxy-5-(3,4-dihydroxyphenyl)-valeric acid | C11H12O5 | feces | UPLC-QTOF-MS, UPLC-ESI-MS/MS | [26,28] | |
| up | 4-hydroxy-5-(3,4-dihydroxyphenyl)-valeric acid-o-sulfate | C11H14O8S | urine | UPLC-QTOF-MS | [25] | |
| 4-hydroxy-5-(3,4-dihydroxyphenyl)-valeric acid-o-methyl-o-sulfate | C12H16O9S | urine | UPLC-QTOF-MS | [24] | ||
| up | 5-(3,4-dihydroxyphenyl)-γ-valerolactone (DHPV 1,2) | C11H12O4 | urine, feces | UPLC-QTOF/MS, UPLC-ESI-MS/MS | [26,27,46,51] | |
| up | 5-(3,4-dihydroxyphenyl)-γ-valerolactone glucuronides | C17H20O10 | urine | UPLC−MS/MS, UPLC-TOF-MS | [25,46] | |
| 5-(3,4-dihydroxyphenyl)-γ-valerolactone sulfates | C11H12O7S | urine | UPLC−MS/MS, UPLC-TOF-MS | [25,46] | ||
| Methoxyhydroxyphenyl-γ-valerolactone (MHPV) | C12H14O4 | urine | UPLC-MS/MS | [46] | ||
| Methoxyhydroxyphenyl-γ-valerolactone glucuronide | C18H22O10 | urine | UPLC-MS/MS | [46] | ||
| Methoxyhydroxyphenyl-γ-valerolactone sulfates | C12H14O7S | urine | UPLC-MS/MS | [46] | ||
| up | 5-(3′-hydroxyphenyl)-γ-valerolactone or 5-(4′-hydroxyphenyl)-γ-valerolactone | C12H12O2 | feces | UPLC−MS/MS, UPLC-TOF-MS | [26,28] | |
| up | 5-(3′,4′,5′-trihydroxyphenyl)-γ-valerolactone-o-methyl-o-sulfate | C12H14O9S | urine | UPLC-QTOF-MS | [25] | |
| Stilbenes | Resveratrol | C14H12O3 | urine, plasma, serum | UPLC-ESI-MS/MS, GC-MS, HPLC-ESA, HPLC-UV-Vis, UPLC-MS/MS | [29,30,52,54,57,61,66,67,68] | |
| Resveratrol sulfate | C14H12O6S | urine, plasma | UPLC-ESI-MS/MS, UPLC-MS/MS | [40,48,51,71] | ||
| Resveratrol 3,4′-disulfate | C14H12O9S2 | urine | LC–ESI–MS/MS | [31] | ||
| Resrveratrol glucoside (trans-resveratrol 3-O-b-glucoside, or cis-resveratrol 3-O-b-glucoside) | C20H22O8 | urine | UPLC-MS/MS, LC–ESI–MS/MS, UPLC-ESI-MS/MS | [37,48,54,66] | ||
| Resveratrol glucoside sulfate | C20H22O11S | urine | UPLC-MS/MS, LC–ESI–MS/MS | [48] | ||
| Resveratrol glucuronide (trans-resveratrol 3-O-glucuronide or trans-resveratrol 4-O-glucuronide or cis-resveratrol 3-O-glucuronide or cis-resveratrol 4-O-glucuronide) | C20H20O9 | urine, plasma | UPLC-ESI-MS/MS, LC-MS/MS, LC–ESI–MS/MS | [37,48,51,58,71] | ||
| Dihydroresveratrol (DHR) | C14H14O3 | urine, plasma, serum | LC–ESI–MS/MS, GC-MS | [48,52] | ||
| Dihydroresveratrol glucuronide | C20H22O9 | urine | UPLC-QTOF-MS, LC–ESI–MS/MS | [48,70] | ||
| Dihydroresveratrol sulfate | C14H14O6S | urine | LC–ESI–MS/MS, UPLC-MS/MS | [40,48] | ||
| Flavonoids | up | (Epi)catechin | C15H14O6 | urine, plasma, serum | UPLC-ESI-MS/MS, HPLC-ESA, GC–MS, UPLC-QTOF-MS | [24,29,32,33,57,68] |
| up | (Epi)catechin glucuronides | C21H22O12 | urine | UPLC−MS/MS, GC-MS | [32,46] | |
| up | (Epi)catechin sulfates | C15H14O9S | urine, plasma | UPLC−MS/MS, GC-MS | [32,33,46,51] | |
| up | Methyl catechin | C16H16O6 | urine, plasma | GC-MS | [32,33] | |
| up | Methyl catechin glucuronide sulfates (1,2,3) | urine | GC-MS | [32] | ||
| up | Methyl(epi)catechin glucuronides (1,2,3) | C22H24O12 | urine | UPLC-ESI-MS/MS, UPLC-MS/MS, GC-MS | [32,46,51] | |
| up | Methyl(epi)catechin sulfates (1,2,3) | C16H16O9S | urine | UPLC-ESI-MS/MS, UPLC-MS/MS, GC-MS | [32,46,51] | |
| up | Catechin glucuronide sulfate | urine | GC-MS | [32] | ||
| Quercetin | C15H10O7 | urine, serum | GC–MS | [57] | ||
| down | Quercetin o-(acetyl-glucoside) | C23H22O13 | urine | UPLC-QTOF-MS | [25] | |
| Cyanidin 3-glucoside | C21H21ClO11 | urine, plasma | HPLC-UV-Vis | [53] | ||
| Delphinidin 3-glucoside | C21H21O12+ | urine, plasma | HPLC-UV-Vis | [53] | ||
| Peonidin 3-glucoside | C22H23ClO11 | urine, plasma | HPLC-UV-Vis | [53] | ||
| Petunidin 3-glucoside | C22H23O12+ | urine, plasma | HPLC-UV-Vis | [53] | ||
| Malvidin glucoside | C23H25ClO12 | urine | UPLC-ESI-MS/MS, LC-UV-VIS | [51,53] | ||
| Procyanidin b-type dimer | C30H26O12 | urine | UPLC-QTOF-MS | [24] | ||
| down | Naringenin | C15H12O5 | urine | UPLC-QTOF-MS | [25] | |
| up | Luteolin sulfate | C15H10O9S | urine | UPLC-QTOF-MS | [25] | |
| up | Hesperetin-o-sulfate | C16H14O9S | urine | UPLC-QTOF-MS | [25] | |
| up | 5,7-dihydroxy-3′,4′-dimethoxy-5′-prenylflavanone | C22H24O6 | urine | UPLC-QTOF-MS | [25] | |
| up | 5′-methoxybilobetin | C32H22O11 | urine | UPLC-QTOF-MS | [25] | |
| up | Hordatine B glucoside | C35H50N8O10 | urine | UPLC-QTOF-MS | [25] | |
| Isoflavonoids | up | Kanzonol I | C27H32O5 | urine | UPLC-QTOF-MS | [25] |
| up | Kanzonol R | C22H26O5 | urine | UPLC-QTOF-MS | [25] | |
| Phenylpropanoids and polyketides | up | Licarin C | C22H26O5 | urine | UPLC-QTOF-MS | [25] |
| Lignans, neolignans and related compounds | Enterolactone | C18H18O4 | urine | UPLC−MS/MS | [46] | |
| down | Tracheloside | C27H34O12 | urine | UPLC-QTOF-MS | [25] | |
| up | Azaspirazid | C47H71NO12 | urine | UPLC-QTOF-MS | [25] | |
| Others | up | 4′,6′-dihydroxy-2′-methoxyacetophenone 6′-glucoside | C15H20O9 | urine | UPLC-QTOF-MS | [25] |
| 4-methylbenzenesulfonate | C7H7O3S- | plasma | LC-MS/MS, UPLC-MS/MS | [34] | ||
| up | alpha-Terpinyl cinnamate | C19H24O2 | urine | UPLC-QTOF-MS | [25] |
| Effect of Wine Consumption | Name | Molecular Formula | Sample | Analytical Tecnhique | Ref. | |
|---|---|---|---|---|---|---|
| Short-chain fatty acid (SCFA) | up | Butyric acid | C4H8O2 | feces | UPLC-ESI-MS/MS, SPME-GC-MS | [22,23] |
| up | Acetic acid | C2H4O2 | feces | UPLC-ESI-MS/MS, SPME-GC-MS | [22,23] | |
| up | Propionic acid | C3H6O2 | feces | UPLC-ESI-MS/MS, SPME-GC-MS | [22,23] | |
| Methyl-branched fatty acids | up | 2-methylbutyric acid | C5H10O2 | feces | UPLC-QTOF-MS, UPLC-ESI-MS/MS | [26,27] |
| Valeric acid | C5H10O3 | feces | UPLC-ESI-MS/MS, SPME-GCMS | [22] | ||
| up | Isovaleric acid | C5H10O2 | feces | UPLC-ESI-MS/MS, SPME-GC-MS | [22,23] | |
| Hydroxy fatty acids | Alpha-hydroxyisovalerate | C5H10O3 | plasma | LC-MS, GC-MS, HPLC-MS/MS | [34,63] | |
| 3-hydroxyisovaleric acid | C5H10O3 | plasma | UPLC-MS/MS, GC-MS | [63] | ||
| up | 2,3-dihydroxyvaleric acid | C5H10O4 | plasma, urine | UPLC-MS/MS, GC-MS, UPLC-QTOF-MS | [25,34,59,69,72] | |
| up | 2,3-dihydroxy-3-methylvaleric acid | C6H12O4 | urine | UPLC-QTOF-MS | [24,25] | |
| up | Citramalic acid | C5H8O5 | plasma | LC-MS/MS, UPLC-MS/MS | [34] | |
| up | 2-isopropylmalate | C7H10O4 | urine | UPLC-MS/MS, GC-MS | [24,69] | |
| Isopropylmalic acid | C7H12O5 | urine | UPLC-QTOF-MS | [24] | ||
| 3-hydroxymethylglutaric acid | C6H10O5 | urine | UPLC-QTOF-MS | [24] | ||
| 2,3-dimethyl-3-hydroxyglutaric acid | C7H12O5 | urine | UPLC-QTOF-MS | [24,25] | ||
| Branched fatty acids | up | Diethylmalonic acid | C7H12O4 | feces | UPLC-QTOF-MS, UPLC-ESI-MS/MS | [26,27] |
| Medium-chain fatty acids (MCFA) | Caproic acid | C6H12O2 | feces | UPLC-ESI-MS/MS, SPME-GCMS | [22] | |
| Long-chain fatty acids (LCFA) | Hydroxyoctanoic acid | C8H16O3 | plasma | LC-MS/MS, UPLC-MS/MS | [34] | |
| Octanoic acid (Caprylic acid) | C8H16O2 | feces | UPLC-ESI-MS/MS, SPME-GCMS, UPLC-MS/MS, GC-MS | [22,75] | ||
| Capric acid (10:0) | C10H20O2 | plasma | UPLC-MS/MS, GC-MS | [63] | ||
| down | 3-hydroxyoctadecanoic acid | C18H36O3 | plasma | LC-MS/MS, UPLC-MS/MS | [34] | |
| Decanoic acid | C10H20O2 | feces | UPLC-ESI-MS/MS, SPME-GCMS | [22] | ||
| Docosahexaenoic acid (DHA; 22:6n3) | C22H32O2 | plasma | UPLC-MS/MS, GC-MS | [63] | ||
| Arachidonic acid (20:4n6) | C20H32O2 | plasma | UPLC-MS/MS, GC-MS | [63] | ||
| Eicosapentaenoic acid (epa; 20:5n3) | C20H30O2 | plasma | UPLC-MS/MS, GC-MS | [63] | ||
| Oleic acid | C18H34O2 | plasma | GC-MS, LC-MS/MS, H-NMR | [55] | ||
| Docosapentaenoate (n3 DPA; 22:5n3) | C22H34O2 | plasma | UPLC-MS/MS, GC-MS | [63] | ||
| Hexadecenedioate (C16:1-DC) | C16H28O4 | plasma | LC-MS/MS, UPLC-MS/MS | [34] | ||
| Octadecenedioate (C18:1-DC) | C18H32O4 | plasma | LC-MS/MS, UPLC-MS/MS | [34] | ||
| Lineolic acids and derivatives | 9- and 13-hydroxyoctadecadienoic acids (HODES) | C18H32O3 | plasma | LC-MS/MS, UPLC-MS/MS | [34] | |
| Stearidonate (18:4n3) | C18H27O2− | plasma | UPLC-MS/MS, GC-MS | [63] | ||
| Fatty acid esters | up | 2-phenethyl butyrate | C12H16O2 | feces | UPLC-QTOF-MS, UPLC-ESI-MS/MS | [26,27] |
| up | 2-phenylethyl hexanoate | C14H20O2 | feces | UPLC-QTOF-MS, UPLC-ESI-MS/MS | [26,27] | |
| up | Docosahexaenoic acid methyl ester | C23H34O2 | feces | UPLC-QTOF-MS, UPLC-ESI-MS/MS | [26,27] | |
| Dodecadienoate (12:2) | C19H34O3 | plasma | LC-MS/MS, UPLC-MS/MS | [34] | ||
| Fatty acids esters (Carnitines) | Acetylcarnitine | C9H17NO4 | plasma | LC-MS/MS, UPLC-MS/MS | [34] | |
| down | 3-decenoylcarnitine | C17H31NO4 | plasma | LC-MS/MS, UPLC-MS/MS | [34] | |
| 3-hydroxyhexanoylcarnitine | C13H25NO5 | plasma | LC-MS/MS, UPLC-MS/MS | [34] | ||
| 5-dodecenoylcarnitine (C12:1) | C19H35NO4 | plasma | LC-MS/MS, UPLC-MS/MS | [34] | ||
| Adipoylcarnitine | C13H24NO6 | plasma | LC-MS/MS, UPLC-MS/MS | [34] | ||
| Octadecanedioylcarnitine (C18-DC) or octadecenedioylcarnitine (C18:1-DC) | C25H47NO4 | plasma | LC-MS/MS, UPLC-MS/MS | [34] | ||
| Succinylcarnitine | C11H19NO6 | plasma | LC-MS/MS, UPLC-MS/MS | [34] | ||
| Lignoceroylcarnitine (C24) | C31H61NO4 | plasma | LC-MS/MS, UPLC-MS/MS | [34] | ||
| Cis-4-decenoylcarnitine (C10:1) | C17H32NO4 | plasma | LC-MS/MS, UPLC-MS/MS | [34] | ||
| Glycosylglycerols | up | Galactosylglycerol | C9H18O8 | urine | UPLC-QTOF-MS | [25] |
| Fatty acyl glycosides | up | (3s,5r,6s,7e,9x)-7-megastigmene-3,6,9-triol 9-glucoside | C19H34O8 | urine | UPLC-QTOF-MS | [25] |
| up | Methyl helianthenoate f glucoside | C17H22O8 | urine | UPLC-QTOF-MS | [25] | |
| down | 4-methoxybenzenepropanol 1-(2-sulfoglucoside) | C16H24O10S | urine | UPLC-QTOF-MS | [25] | |
| Furanoid fatty acids | up | Wyeronic acid | C13H10O4 | urine | UPLC-QTOF-MS | [25] |
| 3-carboxy-4-methyl-5-pentyl-2-furanpropanoic acid (3-CMPFP) | C14H20O5 | urine | UPLC-QTOF-MS | [25] | ||
| 3-carboxy-4-methyl-5-propyl-2-furanpropanoate (CMPF) | C12H16O5 | plasma | UPLC-MS/MS | [72] | ||
| Glycerophospholipids | Glycosyl-n-behenoyl-sphingadienine (d18:2/22:0) | plasma | LC-MS/MS, UPLC-MS/MS | [34] | ||
| down | Linoleoyl-linolenoyl-glycerol (18:2/18:3), (18:2/18:2), (18:2/18:2) | C39H66O5 | plasma | LC-MS/MS, UPLC-MS/MS | [34] | |
| down | Oleoyl-linoleoyl-glycerol | C39H70O5 | plasma | UPLC-MS/MS | [72] | |
| 1-(1-enyl-palmitoyl)-2-palmitoyl-GPC (p-16:0/16:0) | C40H80NO7P | plasma | LC-MS/MS, UPLC-MS/MS | [34] | ||
| 1-linoleoyl-2-linolenoyl-GPC (18:2/18:3) | C44H84NO8P | plasma | LC-MS/MS, UPLC-MS/MS | [34] | ||
| 1-myristoyl-2-palmitoyl-GPC (14:0/16:0) | C38H76NO8P | plasma | LC-MS/MS, UPLC-MS/MS | [34] | ||
| 1-oleoyl-2-docosahexaenoyl-GPC (18:1/22:6) | C48H82NO8P | plasma | LC-MS/MS, UPLC-MS/MS | [34] | ||
| 1-stearoyl-2-arachidonoyl-GPC (18:0/20:4) | C46H84NO8P | plasma | LC-MS/MS, UPLC-MS/MS | [34] | ||
| Glycerophosphorylcholine (GPC) | C8H20NO6P | plasma | LC-MS/MS, UPLC-MS/MS | [34] | ||
| Lysophosphatidylcholine | C10H22NO7P | plasma | GC-MS, LC-MS/MS, H-NMR | [55] | ||
| Phosphatidylcholine | C46H88NO8P | plasma | GC-MS, LC-MS/MS, H-NMR | [55] | ||
| Phosphatidylcholine diacyl C32:1, c36:5 | plasma | UPLC-MS/MS, GC-MS | [63] | |||
| down | Sphingomyelin (d18:1/19:0, d19:1/18:0), (d18:1/20:1, d18:2/20:0), (d18:1/22:1, d18:2/22:0, d16:1/24:1), (d18:2/18:1), (d18:2/21:0, d16:2/23:0) | C47H93N2O6P | plasma | GC-MS, LC-MS/MS, UPLC-MS/MS | [34,55,72] | |
| 1-(1-enyl-stearoyl)-GPE (p-18:0) | C23H48NO6P | plasma | LC-MS/MS, UPLC-MS/MS | [34] | ||
| 1-linoleoyl-GPE (18:2) | C23H44NO7P | plasma | LC-MS/MS, UPLC-MS/MS | [34] | ||
| Glycerolipids | down | C18:0 cholesteryl ester | C48H82O2 | plasma | UPLC-MS/MS | [60] |
| up | C20:5 cholesteryl ester | C20H32O2 | plasma | UPLC-MS/MS | [60] | |
| up | C34:1 phosphatidylcholine | C40H80NO8P | plasma | UPLC-MS/MS | [60] | |
| Steroids and steroid derivatives | up | Cholesterol sulfate | C27H46O4S | feces | UPLC-QTOF-MS, UPLC-ESI-MS/MS | [26,27] |
| down | Sulfolithocholic acid | C24H40O6S | feces | UPLC-QTOF-MS, UPLC-ESI-MS/MS | [26,27] | |
| Tetrahydrocortisol sulfate | C21H33NaO8S | plasma | LC-MS/MS, UPLC-MS/MS | [34] | ||
| up | Deoxycholic acid | C24H40O4 | feces | UPLC-QTOF-MS, UPLC-ESI-MS/MS | [26,27] | |
| Isoursodeoxycholic acid | C24H40O4 | plasma | LC-MS/MS, UPLC-MS/MS | [34] | ||
| Deoxycholic acid glucuronide | C30H48O10 | plasma | LC-MS/MS, UPLC-MS/MS | [34] | ||
| Glycodeoxycholate 3-sulfate | C26H43NO8S | plasma | LC-MS/MS, UPLC-MS/MS | [34] | ||
| Dexydroepiandrosterone sulfate | C19H28O5S | plasma | GC-MS, LC-MS/MS, H-NMR | [55] | ||
| 4-androsten-3beta,17beta-diol disulfate | C19H30O8S2 | plasma | UPLC-MS/MS, GC-MS | [63] | ||
| up | 5alpha-androstan-3alpha,17beta-diol monosulfate | C19H31O5S− | plasma | LC-MS/MS, UPLC-MS/MS | [34] | |
| 5alpha-androstan-3beta,17beta-diol disulfate | C19H32O8S2 | plasma | UPLC-MS/MS, GC-MS | [63] | ||
| up | Androstenediol (3β,17β) monosulfate | C19H28O6S | plasma | UPLC-MS/MS | [34,72] | |
| Epiandrosterone sulfate | C19H30O5S | plasma | UPLC-MS/MS, GC-MS | [63] | ||
| up | Andro steroid monosulfate | C19H28O6S | plasma | LC-MS/MS, UPLC-MS/MS | [34] | |
| Monoterpenoids | 1-methyl-4-(1-methyl-2-propenyl)-benzene | C13H18 | urine | UPLC-QTOF-MS | [24] | |
| up | Valechlorin | C22H31ClO8 | urine | UPLC-QTOF-MS | [25] | |
| Terpene glycosides | 16,17-dihydro-16a,17-dihydroxygibberellin a4 17-glucoside | C25H36O12 | urine | UPLC-QTOF-MS | [24,25] |
| Effect of Wine Consumption | Name | Molecular Formula | Sample | Analytical Technique | Ref. | |
|---|---|---|---|---|---|---|
| Aliphatic | down | Formic acid | CH2O2 | urine | H-NMR | [50] |
| up | Lactic acid | C3H6O3 | urine | H-NMR | [44] | |
| up | Tartaric acid | C4H6O6 | urine | LC–ESI-MS/MS, UHPLC-TOF MS, H-NMR | [25,41,42,44,45,47,65] | |
| Isobutyric acid | C4H8O2 | feces | UPLC-ESI-MS/MS, SPME-GC-MS, H-NMR | [22,23,36] | ||
| 2-hydroxybutyric acid (AHD) | C4H8O3 | plasma | UPLC-MS/MS, GC-MS | [63] | ||
| down | 2R,3R-dihydroxybutyric acid | C4H8O4 | plasma | LC-MS/MS, UPLC-MS/MS | [34] | |
| up | Glutaric acid | C5H8O4 | feces | UPLC-QTOF-MS, UPLC-ESI-MS/MS | [26,27] | |
| up | 2-hydroxyglutaric acid | C5H8O5 | urine, feces | UPLC-QTOF-MS, UPLC-ESI-MS/MS | [24,26,27] | |
| 3-methyl-2-oxobutyrate | C5H8O3 | plasma | UPLC-MS/MS, GC-MS | [63] | ||
| Citric acid | C6H8O7 | urine | UPLC-QTOF-MS | [24] | ||
| up | Methylisocitric acid | C7H10O7 | urine | UPLC-QTOF-MS | [25] | |
| up | Monoglyceride citrate | C9H14O9 | urine | UPLC-QTOF-MS | [25] | |
| up | Gulonate | C6H11O7− | plasma | LC-MS/MS, UPLC-MS/MS | [34] | |
| 4-methyl-2-oxopentanoate | C6H10O3 | plasma | UPLC-MS/MS, GC-MS | [63] | ||
| up | 2-isopropyl-3-oxosuccinate | C7H10O5 | urine | UPLC-QTOF-MS | [25] | |
| up | 2-oxovaleric acid | C5H8O3 | urine | UPLC-QTOF-MS | [24,25] | |
| γ-delta-dioxovaleric acid | C5H6O4 | urine | UPLC-QTOF-MS | [24] | ||
| up | 3-methyl-2-oxovalerate | C6H10O3 | urine, plasma | HPLC-MS/MS, H-NMR | [34,45,47] | |
| down | Dimethylguanidino valeric acid (DMGV) | C8H15N3O3 | plasma | UPLC-MS/MS | [60] | |
| down | Tricarballylic acid | C6H8O6 | feces | UPLC-QTOF-MS, UPLC-ESI-MS/MS | [26,27] | |
| down | 3-indoxylsulfuric acid | C8H7NO4S | urine | GC-MS, LC-MS/MS, H-NMR | [55] | |
| up | (E)-2-propenyl [3-(2-propenylthio)-2-propenyl] sulfate | C9H14O4S2 | urine | UPLC-QTOF-MS | [25] | |
| Benzene and substituted derivatives | Benzoate | C7H5O2− | plasma | UPLC-MS/MS, GC-MS | [75] | |
| up | Benzoic acid | C7H6O2 | feces | UPLC-ESI-MS/MS, UPLC-TOF-MS | [26,27] | |
| Sulfosalicylic acid | C7H6O6S | urine | UPLC-QTOF-MS | [24,25] | ||
| Phenylacetic acid | C8H8O2 | urine, feces | UPLC-MS/MS, UPLC-ESI-MS/MS | [22,23,46] | ||
| 2-hydroxyphenylacetic acid | C8H8O3 | urine | UPLC−MS/MS | [46] | ||
| up | 3-hydroxyphenylacetic acid | C8H8O3 | urine, plasma, feces | H-NMR, UPLC−MS/MS, GC-MS, LC-MS/MS, GC–TOF–MS, UPLC-ESI-MS/MS, UPLC-TOF-MS | [26,28,44,46,49,54,55,56] | |
| up | 4-hydroxyphenylacetic acid | C8H8O3 | urine | UPLC-ESI-MS-MS, H-NMR, GC-MS, H-NMR, GC–TOF–MS | [44,47,49,50,56,68] | |
| 3,4-dihydroxyphenylacetic acid | C8H8O4 | urine, plasma, feces | UPLC-ESI-MS/MS, GC-MS | [22,46,49,68] | ||
| οrtho-hydroxyphenylacetic acid | C8H8O3 | plasma | LC-MS/MS, UPLC-MS/MS | [34] | ||
| N-formylanthranilic acid | C8H7NO3 | plasma | LC-MS/MS, UPLC-MS/MS | [34] | ||
| up | Hippuric acid | C9H9NO3 | urine | GC-MS, H-NMR, GC–TOF–MS | [47,49,50,55,56] | |
| 3-hydroxyhippuric acid | C9H9NO4 | urine | GC-MS, GC–TOF–MS, LC-MS/MS | [49,55,56] | ||
| up | 4-hydroxyhippuric acid | C9H9NO4 | urine, plasma | UPLC−MS/MS, ΝΜR, GC-MS, H-NMR, GC–TOF–MS, LC-MS/MS | [24,46,49,50,54,55,56] | |
| Phenylpropionic acid | C9H10O2 | feces | UPLC-ESI-MS/MS | [22,55,56] | ||
| up | 3-phenylpropionic acid (hydrocinnamic acid) | C9H10O2 | feces | UPLC-TOF-MS, UPLC-ESI-MS/MS | [26,28] |
| Categorization | Effect of Wine Consumption | Name | Molecular Formula | Sample | Analytical Technique | Ref. |
|---|---|---|---|---|---|---|
| Amino Acids | down | Alanine | C3H7NO2 | urine | H-NMR | [50] |
| Alanine Derivatives | up | N-acetyl-beta-alanine | C5H9NO3 | plasma | LC-MS/MS, UPLC-MS/MS | [34] |
| up | 1-carboxyethylphenylalanine | C12H15NO4 | plasma | LC-MS/MS, UPLC-MS/MS | [34] | |
| Amino Acids | down | Threonine | C4H9NO3 | urine, plasma | H-NMR, GC-MS, LC-MS/MS | [44,55] |
| Amino Acids | down | Lysine | C6H14N2O2 | plasma | GC-MS, LC-MS/MS, H-NMR | [55] |
| Lysine Derivatives | Pipecolic acid | C6H11NO2 | plasma | UPLC-MS/MS, GC-MS | [63] | |
| Amino Acids | down | Tyrosine | C9H11NO3 | plasma | GC-MS, LC-MS/MS, H-NMR | [55] |
| Amino Acids | L-alpha-aminobutyric acid | C4H9NO2 | plasma | UPLC-MS/MS, GC-MS | [63] | |
| Amino Acids | down | S-methylcysteine sulfoxide (kale anemia factor) | C4H9NO3S | plasma | LC-MS/MS, UPLC-MS/MS | [34] |
| N-acyl-alpha amino acids | down | Acetylcysteine | C5H9NO3S | urine | UPLC-QTOF-MS | [25] |
| Amino Acids | down | 2-ketocaprylate | C8H14O3 | plasma | LC-MS/MS, UPLC-MS/MS | [34] |
| Amino Acids | down | Alliin | C6H11NO3S | plasma | LC-MS/MS, UPLC-MS/MS | [34] |
| Non-essential amino acids | up | Carnitine | C7H15NO3 | plasma | UPLC-MS/MS | [60] |
| Uncommon amino acids | up | gamma-Carboxyglutamic acid | C6H9NO6 | plasma | LC-MS/MS, UPLC-MS/MS | [34] |
| Alpha amino acids and derivatives | down | Guanidinoacetate | C3H7N3O2 | plasma | LC-MS/MS, UPLC-MS/MS | [34] |
| Histidine derivatives | up | 1-methylhistidine | C7H11N3O2 | urine | GC-MS, LC-MS/MS, H-NMR | [55] |
| l-cysteine-s-conjugates | up | Lanthionine | C6H12N2O4S | plasma | LC-MS/MS, UPLC-MS/MS | [34] |
| Glutamic acid derivatives | down | Glutamic acid gamma-methyl ester (PGMGT) | C6H11NO4 | plasma | LC-MS/MS, UPLC-MS/MS | [34] |
| N-acyl-alpha amino acids | up | N-acetylglutamine | C7H12N2O4 | plasma | LC-MS/MS, UPLC-MS/MS | [34] |
| Tryptamine derivatives | down | Serotonin | C10H12N2O | plasma | LC-MS/MS, UPLC-MS/MS | [34] |
| down | N-methyltryptamine | C11H14N2 | urine | UPLC-QTOF-MS | [25] | |
| Metabolites of the Tryptophan-Niacin catabolic pathway | 2-amino-3-carboxymuconic acid semialdehyde | C7H7NO5 | urine | UPLC-QTOF-MS | [24] | |
| Reductive products of tryptophan | up | Indole-3-propionic acid | C11H11NO2 | plasma | LC-MS/MS, UPLC-MS/MS | [34] |
| Tryptophan metabolites | up | Indole-3-lactic-acid | C11H11NO3 | urine | GC-MS, LC-MS/MS, H-NMR | [55] |
| Indolyl carboxylic acids and derivatives | up | Tryptophan 2-c-mannoside | C17H22N2O7 | plasma | LC-MS/MS, UPLC-MS/MS | [34] |
| N-trimethylated amino acids | up | Betaine | C5H11NO2 | urine | H-NMR | [44] |
| Canavanine biosynthesis pathway | up | O-ureidohomoserine | C5H11N3O4 | urine | UPLC-QTOF-MS | [25] |
| Valine and derivatives | down | 4-hydroxyvalsartan | C24H29N5O4 | urine | UPLC-QTOF-MS | [25] |
| Hormones | down | Thyroxine | C15H11I4NO4 | plasma | LC-MS/MS, UPLC-MS/MS | [34] |
| up | 3-methylcrotonylglycine | C7H11NO3 | urine | UPLC-QTOF-MS | [25] | |
| Dipeptides | up | Cysteinylglycine disulfide | C8H15N3O5S2 | plasma | LC-MS/MS, UPLC-MS/MS | [34] |
| Aspartyl-leucine/leucyl-aspartate | C10H18N2O | urine | UPLC-QTOF-MS | [24] | ||
| down | Hydroxyprolyl-(iso)leucine | C11H20N2O4 | urine | UPLC-QTOF-MS | [25] | |
| up | L-γ-glutamyl-l-(iso)leucine | C11H20N2O5 | urine | UPLC-QTOF-MS | [25] | |
| Hypoglycin b | C12H18N2O5 | urine | UPLC-QTOF-MS | [24] | ||
| up | Phenylalanylaspartic acid | C13H16N2O5 | urine | UPLC-QTOF-MS | [25] | |
| Hybrid peptides | down | Bis-γ-glutamylcysteinylbis-β-alanine | C22H36N6O12S2 | urine | UPLC-QTOF-MS | [25] |
| Peptides | down | Phytosulfokine a | C33H46N6O16S2 | urine | UPLC-QTOF-MS | [25] |
| Effect of Wine Consumption | Name | Molecular Formula | Sample | Analytical Technique | Ref. | |
|---|---|---|---|---|---|---|
| Polyols | up | Erythritol | C4H10O4 | plasma | LC-MS/MS, UPLC-MS/MS | [34] |
| up | Ribitol | C5H12O5 | plasma | LC-MS/MS, UPLC-MS/MS | [34] | |
| up | Arabitol/Xylitol | C5H12O5 | plasma | LC-MS/MS, UPLC-MS/MS | [34] | |
| up | Arabonate/Xylonate | C5H10CaO6 | plasma | LC-MS/MS, UPLC-MS/MS | [34] | |
| up | L-Fucose | C6H12O5 | urine | H-NMR | [44] | |
| up | Scyllo-inositol/inositol | C6H12O6 | plasma | LC-MS, GC-MS, UHPLC-MS/MS | [60,62,63] | |
| up | Glucose | C6H12O6 | urine | H-NMR | [44] | |
| up | Glucose-1-phosphate | C6H13O9P | urine | GC-MS, LC-MS/MS, H-NMR | [55] | |
| up | Mannitol | C6H14O6 | urine | H-NMR | [44,45,47] | |
| up | Sedoheptulose | C7H14O7 | plasma | LC-MS/MS, UPLC-MS/MS | [34] | |
| up | Sucrose | C12H22O11 | urine | GC-MS, LC-MS/MS, H-NMR | [55] | |
| Alkylglucosinolates | up | Glucosinalbin | C14H18NO10S2 | urine | UPLC-QTOF-MS | [25] |
| 3-methylbutyl glucosinolate | C12H23NO9S2 | urine | UPLC-QTOF-MS | [24] | ||
| n-acylneuraminic acids | down | N-Acetylneuraminate (sialic acid) | C11H19NO9 | plasma | LC-MS/MS, UPLC-MS/MS | [34] |
| Effect of Wine Consumption | Name | Molecular Formula | Sample | Analytical Technique | Ref. | |
|---|---|---|---|---|---|---|
| Cofactors and Vitamins | up | Nicotinic acid (vitamin B3) | C6H5NO2 | urine | GC-MS, LC-MS/MS, H-NMR | [55] |
| up | Pantoic acid | C6H12O4 | plasma | LC-MS/MS, UPLC-MS/MS | [34] | |
| up | Isocitric lactone | C6H6O6 | plasma | LC-MS/MS, UPLC-MS/MS | [34] | |
| down | Phosphate | O4P-3 | plasma | LC-MS/MS, UPLC-MS/MS | [34] | |
| down | Cytidine triphosphate | C9H16N3O14P3 | urine | UPLC-QTOF-MS | [25] |
| Effect of Wine Consumption | Name | Molecular Formula | Sample | Analytical Technique | Ref. | ||
|---|---|---|---|---|---|---|---|
| Organic compounds (Aliphatic) | Organic oxygen compounds | up | Methanol | CH4O | urine | H-NMR | [44] |
| Ethanol | C2H6O | urine | H-NMR | [45,47] | |||
| up | Ethyl hydrogen sulfate | C2H6O4S | urine, plasma | UHPLC-MS/MS | [25,40] | ||
| up | Ethyl glucuronide | C8H14O7 | plasma | UPLC-MS/MS, H-NMR | [45,59,72] | ||
| up | Ethyl α-glucopyranoside | C8H16O6 | plasma | UPLC-MS/MS | [59] | ||
| Ethyl alpha-glucopyranoside | C15H20O10 | plasma | LC-MS/MS, UPLC-MS/MS | [34] | |||
| up | Dimethylamine (DMA) | C2H7N | urine | H-NMR | [44] | ||
| 2,3-butanediol | C4H10O2 | urine | H-NMR | [45] | |||
| up | 2,3-pentanedione | C5H8O2 | feces | UPLC-QTOF-MS, UPLC-ESI-MS/MS | [26,27] | ||
| Organosulfur compounds | up | Ethyl 1-(ethylthio)propyl disulfide | C7H16S3 | urine | UPLC-QTOF-MS | [25] | |
| down | Ajoene (2-propenyl-3-(2-propenylsulfinyl)-1-propenyl disulfide) | C9H14OS3 | urine | UPLC-QTOF-MS | [25] | ||
| Organonitrogen compounds | down | Linoleoyl ethanolamide | C20H37NO2 | plasma | LC-MS/MS, UPLC-MS/MS | [34] | |
| Organic compounds (Cyclic) | Alcaloids | Trigonelline | C7H7NO2 | urine | H-NMR, GC-TOF-MS | [49] | |
| up | Piperine | C17H19NO3 | plasma | LC-MS, GC-MS | [60,63] | ||
| Organoheterocyclic compounds | 2-Furanmethanol | C5H6O2 | urine | UPLC-QTOF-MS | [24] | ||
| up | Dihydropteridine | C6H6N4 | urine | UPLC-QTOF-MS | [25] | ||
| up | Ethyl maltol | C7H8O3 | urine | UPLC-QTOF-MS | [25] | ||
| down | 5-hydroxyindole | C8H7NO | urine | UPLC-QTOF-MS | [25] | ||
| (R)-2,3-dihydro-3,5-dihydroxy-2-oxo-3-indoleacetic acid | C10 H9NO5 | urine | UPLC-QTOF-MS | [24] | |||
| up | 1-(2,3-dihydro-1h-pyrrolizin-5-yl)-2-propen-1-one | C10H11NO | urine | UPLC-QTOF-MS | [25] | ||
| up | 4-[(2,4-dihydroxyphenyl)azo] benzenesulfonic acid | C12H10N2O5S | urine | UPLC-QTOF-MS | [25] | ||
| down | 5-(1-propynyl)-5′-vinyl-2,2′-bithiophene | C13H10S2 | urine | UPLC-QTOF-MS | [25] | ||
| 5-ethynyl-5′-(1-propynyl)-2,2′-bithiophene | C13H8S2 | urine | UPLC-QTOF-MS | [24] | |||
| up | Stercobilin | C33H46N4O6 | feces | UPLC-QTOF-MS, UPLC-ESI-MS/MS | [26,27] | ||
| up | Urobilinogen | C33H44N4O6 | feces | UPLC-QTOF-MS, UPLC-ESI-MS/MS | [26,27] | ||
| Benzene and supstituted derivatives | up | p-chlorobenzene sulfonyl urea | C7H7ClN2O3S | urine | UPLC-QTOF-MS | [25] | |
| down | p-cresol sulfate | C7H8O4S | urine | GC-MS, LC-MS/MS, H-NMR | [55] | ||
| up | 4-hydroxy-5-(phenyl)-valeric acid | C11H14O3 | feces | UPLC-QTOF-MS, UPLC-ESI-MS/MS | [22,26,27,28,35] | ||
| up | 4-hydroxy-5-(phenyl)-valeric acid-o-sulfate | C11H14O6S | urine | UPLC-QTOF-MS | [25] | ||
| up | 4-hydroxy-5-(phenyl)-valeric acid-o-glucuronide | C17H22O9 | urine | UPLC-QTOF-MS | [25] | ||
| up | Salicylate glucuronide | C13H14O9 | urine | UPLC-QTOF-MS | [25] | ||
| up | Dibenzyl disulfide | C14H14S2 | urine | UPLC-QTOF-MS | [25] | ||
| down | Cinnamyl cinnamate | C18H16O2 | urine | UPLC-QTOF-MS | [25] | ||
| Flavidulol c | C34H42O4 | urine | UPLC-QTOF-MS | [25] | |||
| Purines and purine derivatives | down | Xanthine | C5H4N4O2 | feces | UPLC-QTOF-MS, UPLC-ESI-MS/MS | [26,27] | |
| up | Uric acid | C5H4N4O3 | plasma | GC-MS | [38] | ||
| 3-methylxanthine | C6H6N4O2 | plasma | LC-MS/MS, UPLC-MS/MS | [34] | |||
| up | 1,3-dimethyluric acid | C7H8N4O3 | plasma | LC-MS/MS, UPLC-MS/MS | [34] | ||
| Pyrimidines and pyrimidine derivatives | Theophylline | C7H8N4O2 | plasma | UPLC-MS/MS, GC-MS | [63] | ||
| up | Caffeine | C8H10N4O2 | plasma | UPLC-MS/MS | [60] | ||
| up | 5-acetylamino-6-formylamino-3-methyluracil | C8H10N4O4 | urine | UPLC-QTOF-MS | [25] | ||
| up | Nicotine | C10H14N2 | urine | UPLC-MS, UPLC-MS/MS, GC-MS | [69] | ||
| up | Cotinine | C10H12N2O | plasma | UPLC-MS/MS | [60] | ||
| Pyrimidine nucleosides | Deoxyuridine | C9H12N2O5 | plasma | LC-MS/MS, UPLC-MS/MS | [34] | ||
| Pyrrolidines | up | Acisoga [n-(3-acetamidopropyl)pyrrolidin-2-one] | C9H16N2O2 | plasma | LC-MS/MS, UPLC-MS/MS | [34] |
Disclaimer/Publisher’s Note: The statements, opinions and data contained in all publications are solely those of the individual author(s) and contributor(s) and not of MDPI and/or the editor(s). MDPI and/or the editor(s) disclaim responsibility for any injury to people or property resulting from any ideas, methods, instructions or products referred to in the content. |
© 2023 by the authors. Licensee MDPI, Basel, Switzerland. This article is an open access article distributed under the terms and conditions of the Creative Commons Attribution (CC BY) license (https://creativecommons.org/licenses/by/4.0/).
Share and Cite
Lekka, P.; Fragopoulou, E.; Terpou, A.; Dasenaki, M. Exploring Human Metabolome after Wine Intake—A Review. Molecules 2023, 28, 7616. https://doi.org/10.3390/molecules28227616
Lekka P, Fragopoulou E, Terpou A, Dasenaki M. Exploring Human Metabolome after Wine Intake—A Review. Molecules. 2023; 28(22):7616. https://doi.org/10.3390/molecules28227616
Chicago/Turabian StyleLekka, Pelagia, Elizabeth Fragopoulou, Antonia Terpou, and Marilena Dasenaki. 2023. "Exploring Human Metabolome after Wine Intake—A Review" Molecules 28, no. 22: 7616. https://doi.org/10.3390/molecules28227616