Deep Eutectic Solvent-Based Dispersive Liquid–Liquid Microextraction Coupled with LC-MS/MS for the Analysis of Two Ochratoxins in Capsicum


Abstract
:
1. Introduction
2. Results
2.1. Characterization of DES Composition
2.2. DES-DLLME Optimization
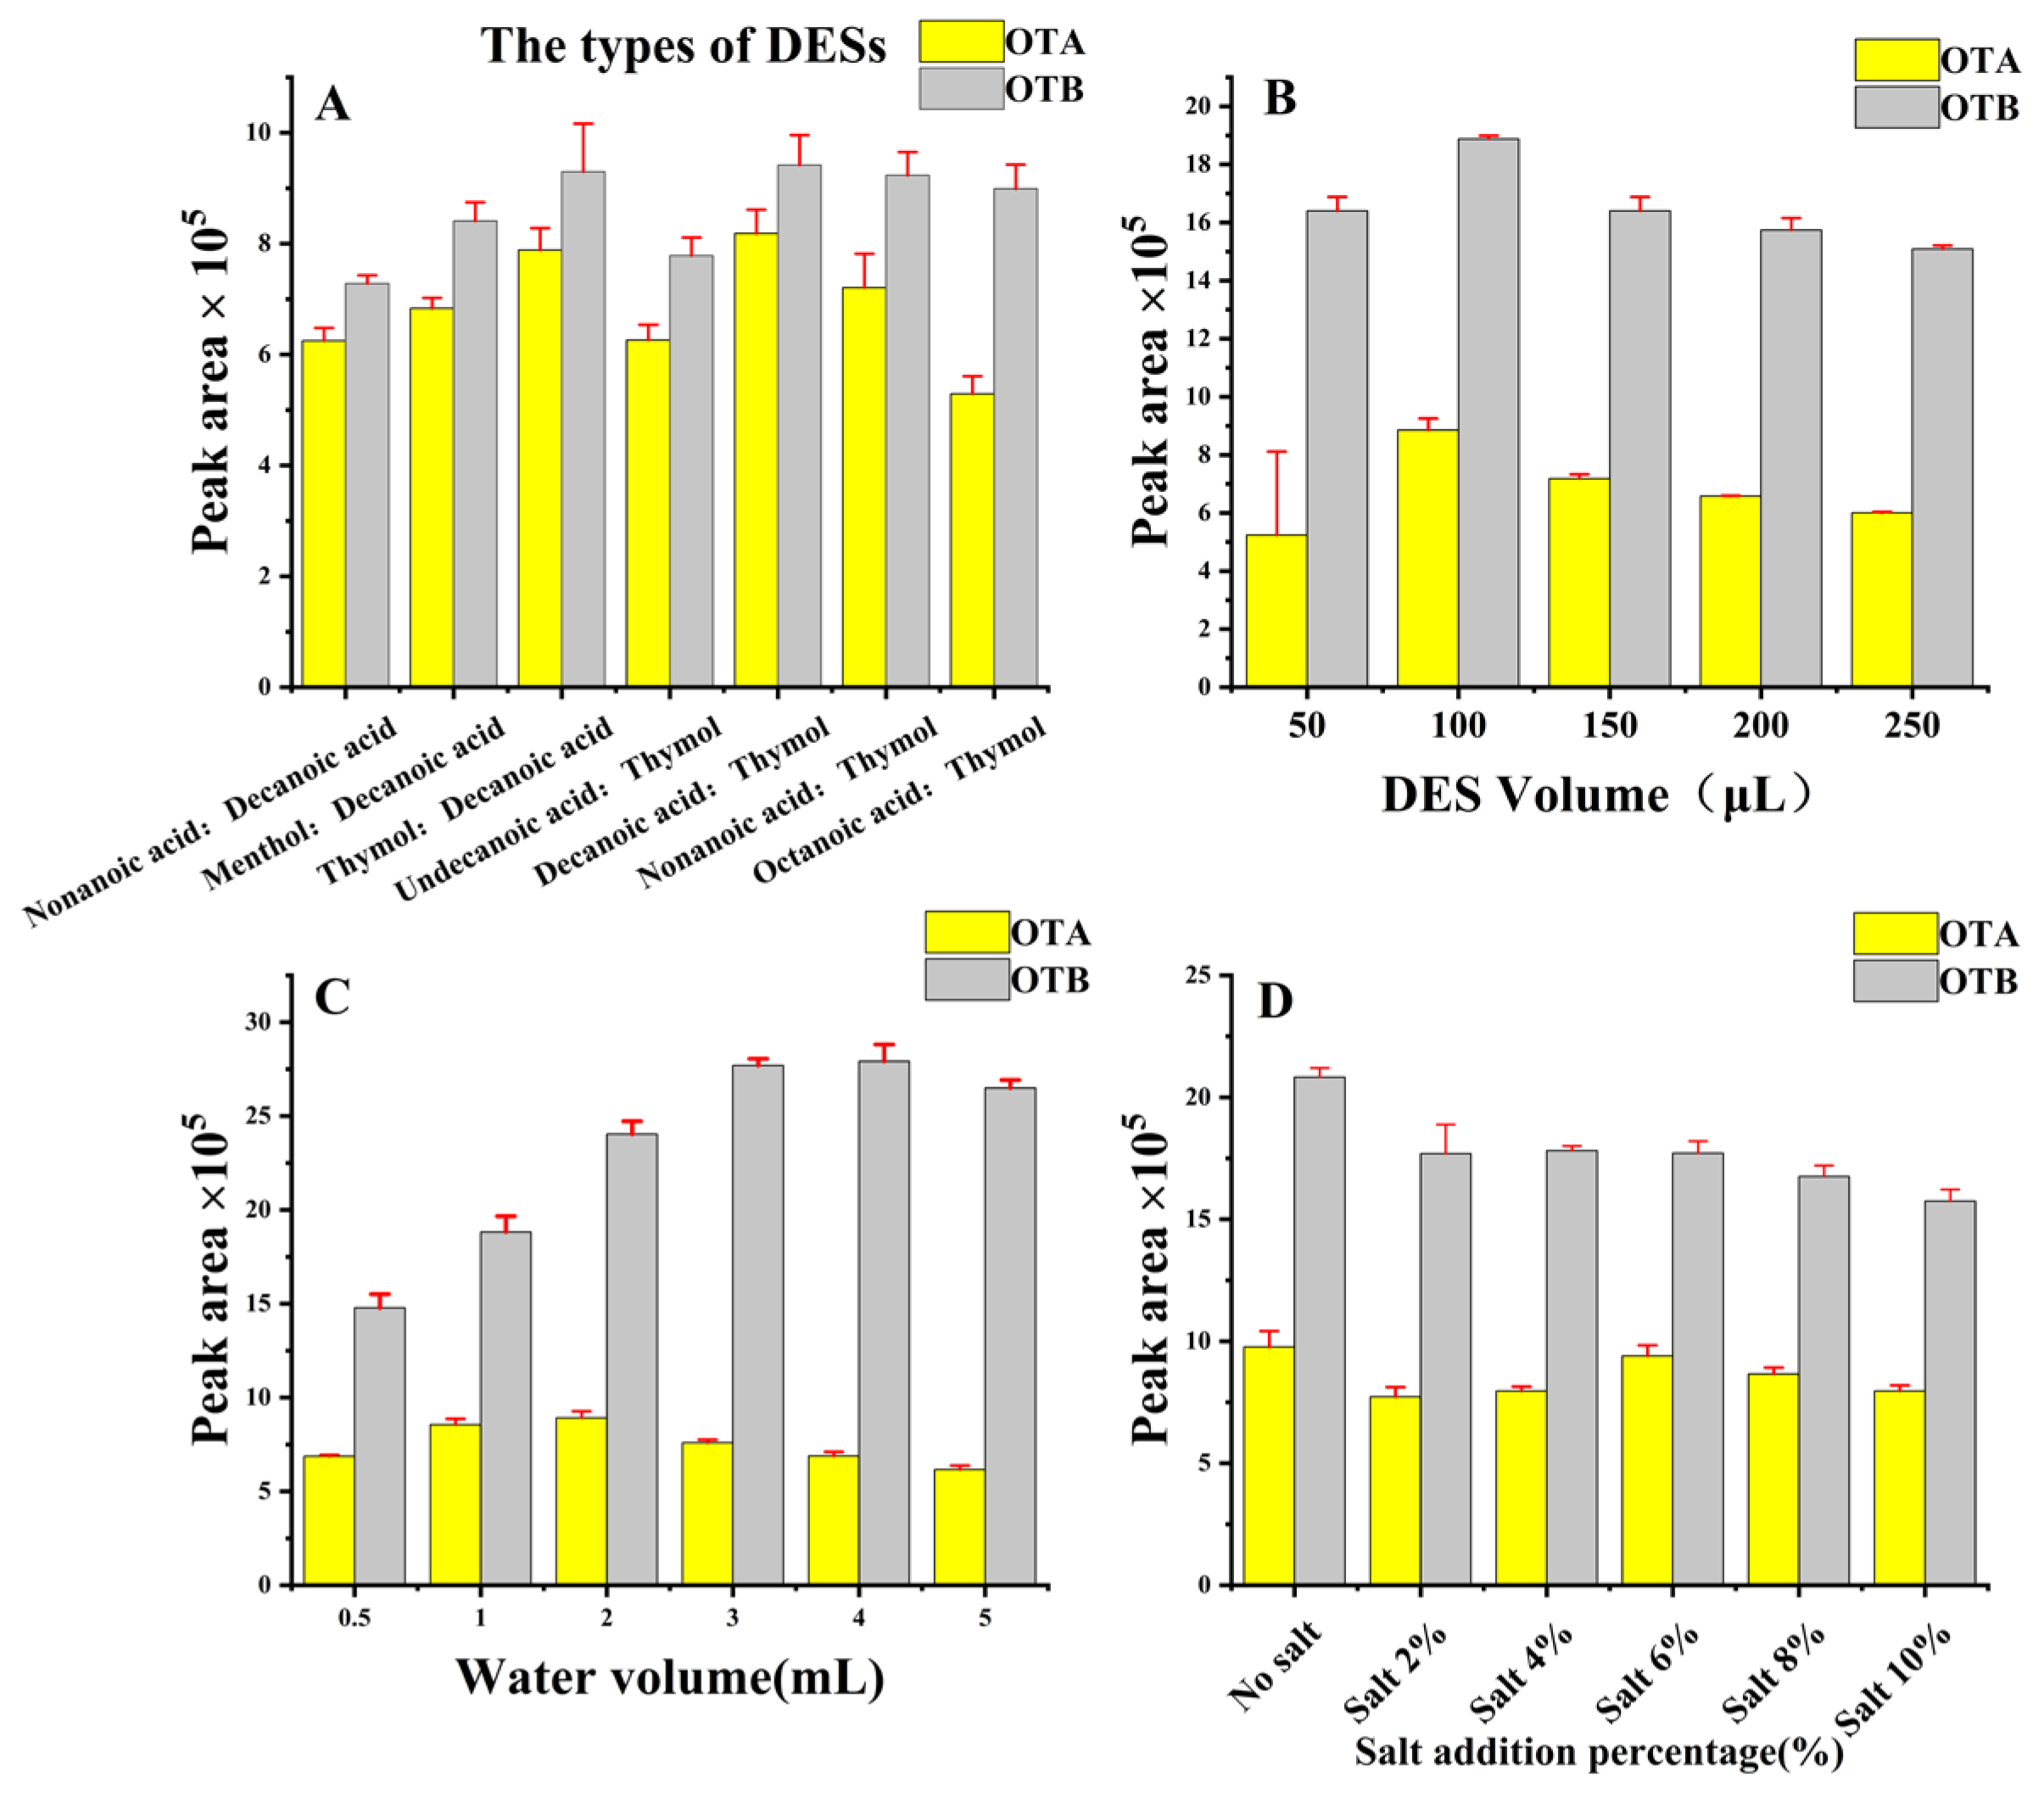
2.2.1. Type of DES
2.2.2. Effect of DES Volume
2.2.3. Effect of Water Volume
2.2.4. Effect of Salt Addition
2.3. Method Validation
2.4. Application in Analysis of Real Samples
2.5. Method Greenness Assessment
2.6. Comparison of Various Methods for Detecting OTs
3. Experimental
3.1. Materials and Methods
3.2. Chromatographic and Mass Spectrometric Conditions of LC-MS/MS
3.3. Preparation of Deep Eutectic Solvents
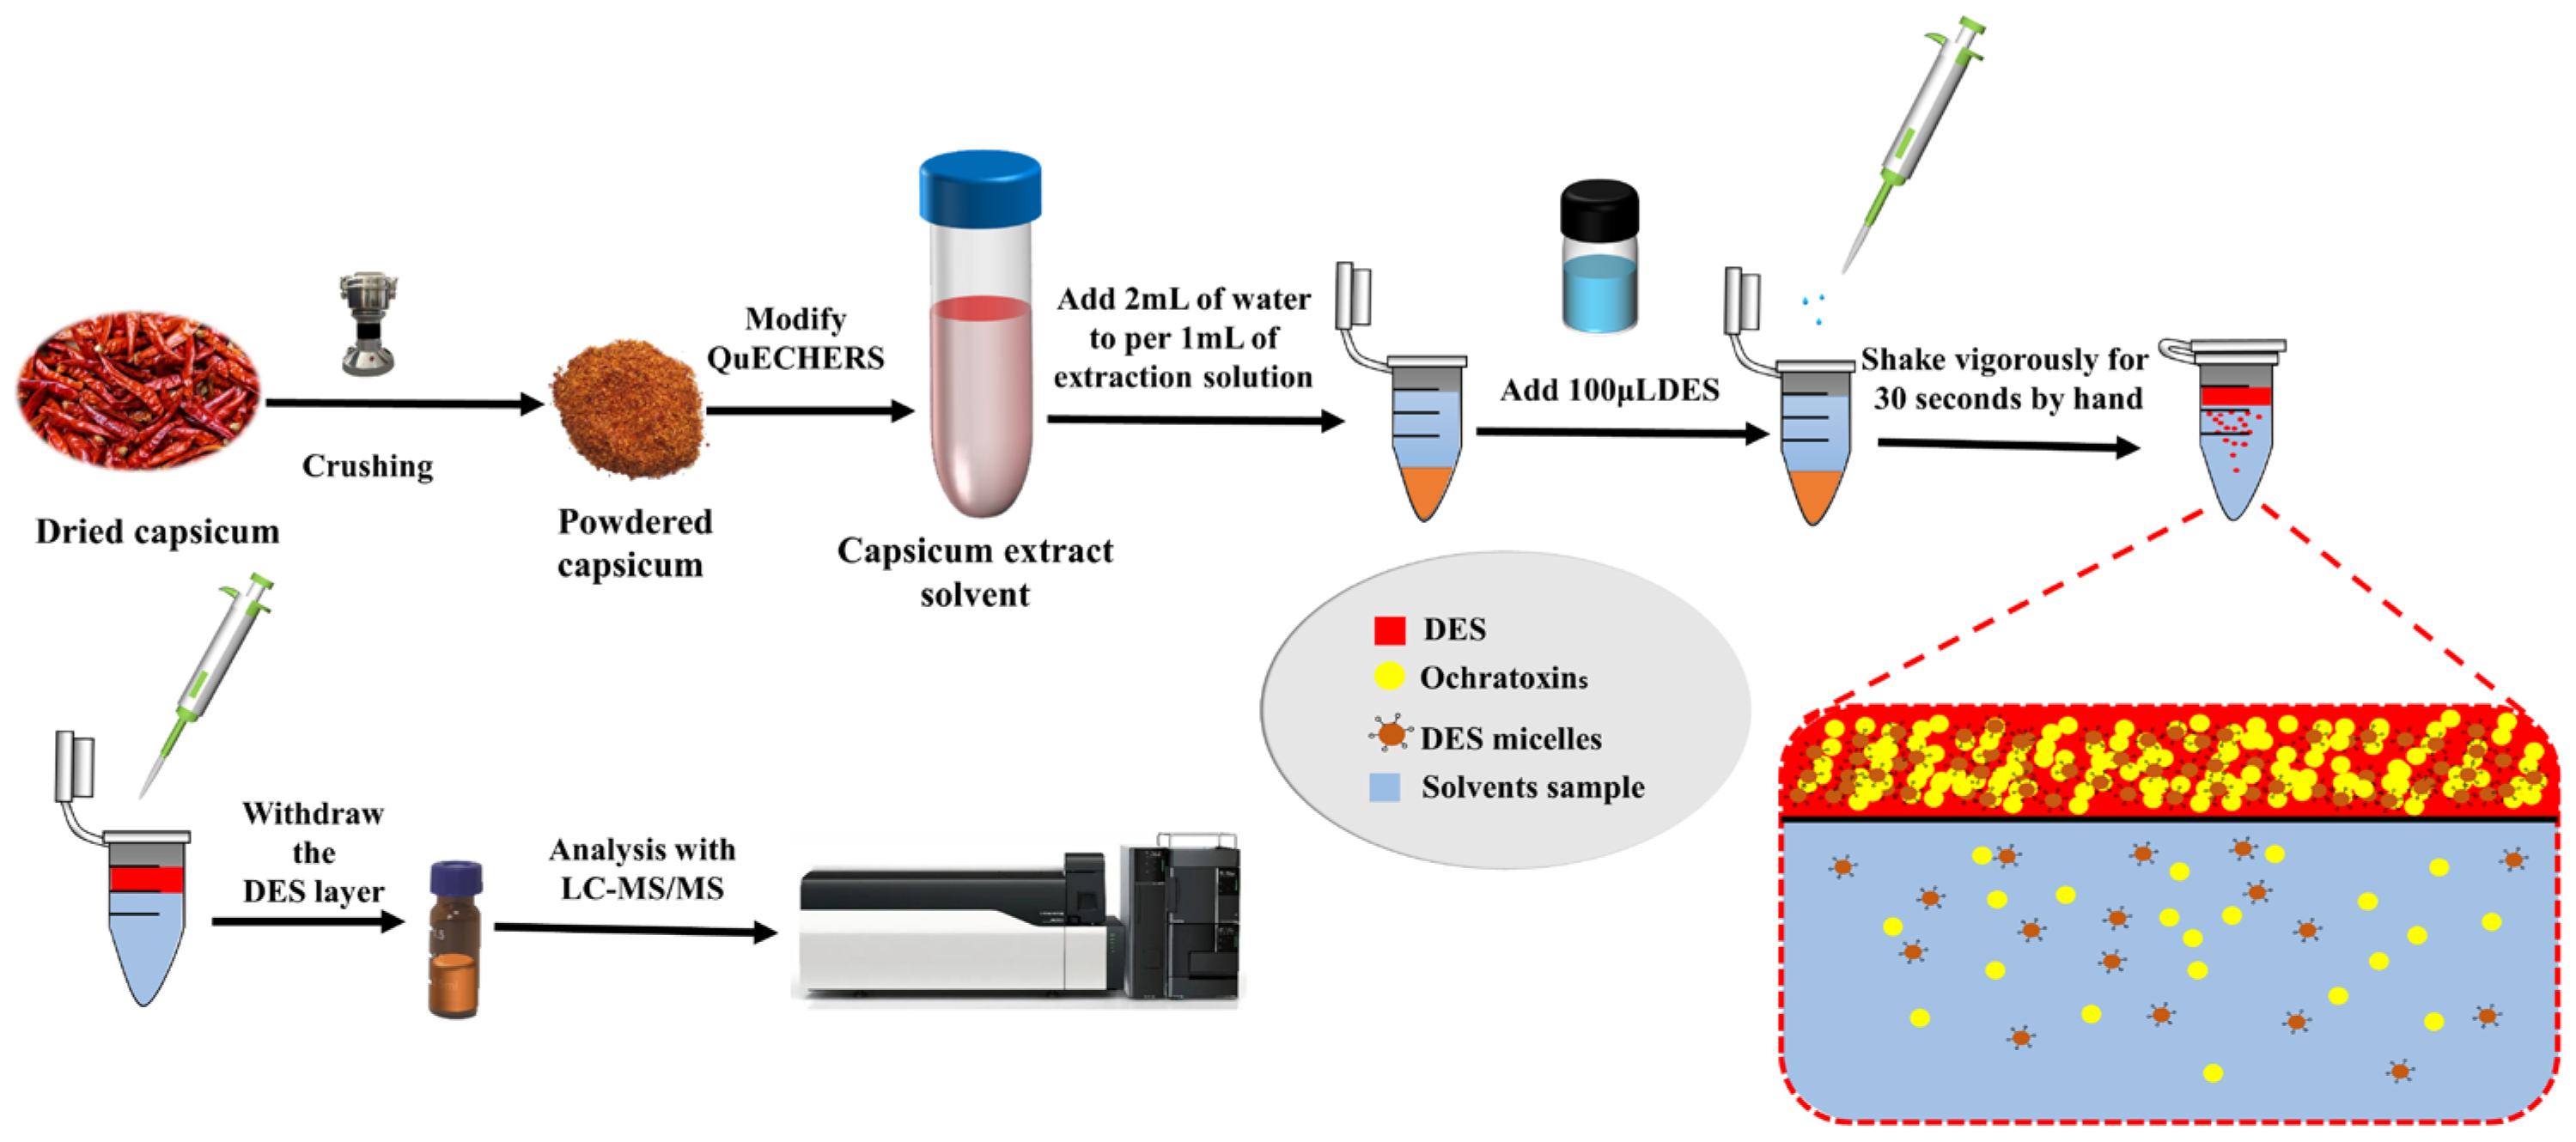
3.4. Dispersive Liquid–Liquid Microextraction Procedure (DLLME)
4. Conclusions
Author Contributions
Funding
Institutional Review Board Statement
Informed Consent Statement
Data Availability Statement
Conflicts of Interest
References
- Abdel-Salam, O.M. Preference for hot pepper: A complex interplay of personal, cultural, and pharmacological effects. Temperature 2016, 3, 39–40. [Google Scholar] [CrossRef]
- Székács, A.; Wilkinson, M.G.; Mader, A.; Appel, B.J.F.C. Environmental and Food Safety of Spices and Herbs along Global Food Chains; Elsevier: Amsterdam, The Netherlands, 2018; Volume 83, pp. 1–6. [Google Scholar]
- Ugulu, I.; Akhter, P.; Iqbal Khan, Z.; Akhtar, M.; Ahmad, K. Trace metal accumulation in pepper (Capsicum annuum L.) grown using organic fertilizers and health risk assessment from consumption. Food Res. Int. 2021, 140, 109992. [Google Scholar] [CrossRef] [PubMed]
- Zhu, L.; Dong, X.-X.; Gao, C.-B.; Gai, Z.; He, Y.-X.; Qian, Z.-J.; Liu, Y.; Lei, H.-T.; Sun, Y.-M.; Xu, Z.-L. Development of a highly sensitive and selective electrochemical immunosensor for controlling of rhodamine B abuse in food samples. Food Control 2022, 133, 108662. [Google Scholar] [CrossRef]
- Xue, R.; Wang, H.; Zhao, D.; Qin, W.; Lin, H.; Ye, Q.; Liu, S. Identification of heat-resistant Bacillus strains in peppers in Sichuan Province, China. LWT 2023, 174, 114425. [Google Scholar] [CrossRef]
- Yogendrarajah, P.; Deschuyffeleer, N.; Jacxsens, L.; Sneyers, P.-J.; Maene, P.; De Saeger, S.; Devlieghere, F.; De Meulenaer, B. Mycological quality and mycotoxin contamination of Sri Lankan peppers (Piper nigrum L.) and subsequent exposure assessment. Food Control 2014, 41, 219–230. [Google Scholar] [CrossRef]
- Jacxsens, L.; Pratheeb; Yogendrarajaha; De Meulenaer, B. Risk Assessment of Mycotoxins and Predictive Mycology in Sri Lankan Spices: Chilli and Pepper. Procedia Food Sci. 2016, 6, 326–330. [Google Scholar] [CrossRef]
- Thanushree, M.P.; Sailendri, D.; Yoha, K.S.; Moses, J.A.; Anandharamakrishnan, C. Mycotoxin contamination in food: An exposition on spices. Trends Food Sci. Technol. 2019, 93, 69–80. [Google Scholar] [CrossRef]
- Zhao, X.; Yuan, Y.; Zhang, X.; Yue, T. Identification of ochratoxin A in Chinese spices using HPLC fluorescent detectors with immunoaffinity column cleanup. Food Control 2014, 46, 332–337. [Google Scholar] [CrossRef]
- Heussner, A.H.; Bingle, L.E.H. Comparative Ochratoxin Toxicity: A Review of the Available Data. Toxins 2015, 7, 4253–4282. [Google Scholar] [CrossRef]
- World Health Organization International Agency for Research on Cancer. Some naturally occurring substances: Food items and constituents, heterocyclic aromatic amines and mycotoxins. IARC Monogr. Eval. Carcinog. Risk Chem. Hum. 1993, 56, 99. [Google Scholar]
- Zhang, S.; Zhou, S.; Lyu, B.; Qiu, N.; Li, J.; Zhao, Y.; Wu, Y. Dietary exposure to fumonisins and ochratoxins in the Chinese general population during 2007–2020: Results from three consecutive total diet studies. Food Chem. Toxicol. 2022, 159, 112768. [Google Scholar] [CrossRef] [PubMed]
- GB 2761-2017; Maximum Residue Level of Mycotoxin in Food-National Regulations for Food Safety. MOH, China Food Standard Regulations: Beijing, China, 2017.
- European Commission. Commission Regulation (EU) 2015/1137 of 13 July 2015 amending Regulation (EC) No 1881/2006 as regards the maximum level of Ochratoxin A in Capsicum spp. spices. Off. J. Eur. Union 2015, 185, 11–12. [Google Scholar]
- Meerpoel, C.; Vidal, A.; di Mavungu, J.D.; Huybrechts, B.; Tangni, E.K.; Devreese, M.; Croubels, S.; De Saeger, S. Development and validation of an LC–MS/MS method for the simultaneous determination of citrinin and ochratoxin a in a variety of feed and foodstuffs. J. Chromatogr. A 2018, 1580, 100–109. [Google Scholar] [CrossRef] [PubMed]
- Ventura, M.; Anaya, I.; Broto-Puig, F.; Agut, M.; Comellas, L. Two-Dimensional Thin-Layer Chromatographic Method for the Analysis of Ochratoxin A in Green Coffee. J. Food Prot. 2005, 68, 1920–1922. [Google Scholar] [CrossRef]
- Zhu, W.; Ren, C.; Nie, Y.; Xu, Y. Quantification of ochratoxin A in Chinese liquors by a new solid-phase extraction clean-up combined with HPLC-FLD method. Food Control 2016, 64, 37–44. [Google Scholar] [CrossRef]
- Noba, S.; Omote, M.; Kitagawa, Y.; Mochizuki, N. Determination of Ochratoxin A in Wine by Immunoaffinity Cleanup and Liquid Chromatography Tandem Mass Spectrometry. J. Food Prot. 2008, 71, 1038–1042. [Google Scholar] [CrossRef]
- Bascarán, V.; de Rojas, A.H.; Chouciño, P.; Delgado, T. Analysis of ochratoxin A in milk after direct immunoaffinity column clean-up by high-performance liquid chromatography with fluorescence detection. J. Chromatogr. A 2007, 1167, 95–101. [Google Scholar] [CrossRef]
- Flajs, D.; Domijan, A.-M.; Ivić, D.; Cvjetković, B.; Peraica, M.J.F. ELISA and HPLC analysis of ochratoxin A in red wines of Croatia. Food Control 2009, 20, 590–592. [Google Scholar] [CrossRef]
- Zhang, A.; Ma, Y.; Feng, L.; Wang, Y.; He, C.; Wang, X.; Zhang, H.J.F.C. Development of a sensitive competitive indirect ELISA method for determination of ochratoxin A levels in cereals originating from Nanjing, China. Food Control 2011, 22, 1723–1728. [Google Scholar] [CrossRef]
- Gałuszka, A.; Migaszewski, Z.; Namieśnik, J. The 12 principles of green analytical chemistry and the SIGNIFICANCE mnemonic of green analytical practices. TrAC Trends Anal. Chem. 2013, 50, 78–84. [Google Scholar] [CrossRef]
- Kurowska-Susdorf, A.; Zwierżdżyński, M.; Bevanda, A.M.; Talić, S.; Ivanković, A.; Płotka-Wasylka, J. Green analytical chemistry: Social dimension and teaching. TrAC Trends Anal. Chem. 2019, 111, 185–196. [Google Scholar] [CrossRef]
- Prabhune, A.; Dey, R. Green and sustainable solvents of the future: Deep eutectic solvents. J. Mol. Liq. 2023, 379, 121676. [Google Scholar] [CrossRef]
- Abbott, A.P.; Capper, G.; Davies, D.L.; Munro, H.L.; Rasheed, R.K.; Tambyrajah, V.J.C. Preparation of novel, moisture-stable, Lewis-acidic ionic liquids containing quaternary ammonium salts with functional side chainsElectronic supplementary information (ESI) available: Plot of conductivity vs. temperature for the ionic liquid formed from zinc chloride and choline chloride (2:1). Chem. Commun. 2001, 19, 2010–2011. [Google Scholar]
- Smith, E.L.; Abbott, A.P.; Ryder, K.S. Deep Eutectic Solvents (DESs) and Their Applications. Chem. Rev. 2014, 114, 11060–11082. [Google Scholar] [CrossRef] [PubMed]
- Sulthan, R.; Reghunadhan, A.; Sambhudevan, S. A new era of chitin synthesis and dissolution using deep eutectic solvents-comparison with ionic liquids. J. Mol. Liq. 2023, 380, 121794. [Google Scholar] [CrossRef]
- Cao, J.; He, Y.; Zhang, X.; Shi, L.; Zeng, B.; Zhao, F. Development of a tributyl phosphate-based hydrophobic deep eutectic solvent for liquid-liquid microextraction of total parabens in beverages. J. Mol. Liq. 2023, 387, 122593. [Google Scholar] [CrossRef]
- Sulthan, R.; Sambhudevan, S.; Greeshma, S.; Gayathri, S.; Anagha, D.A.; Niranjan, B.; Gayathri, K.; Unni, V.V. Extraction of β-chitin using deep eutectic solvents for biomedical applications. Mater. Today Proc. 2023. [Google Scholar] [CrossRef]
- Akmes, A.; Dalmaz, A.; Sivrikaya Özak, S. Hydrophilic deep eutectic solvent based microextraction procedure for the determination of four paraben preservatives in vitamin D for babies: A green approach. Microchem. J. 2023, 193, 109013. [Google Scholar] [CrossRef]
- He, S.; Ho Row, K.; Tang, W. Deep eutectic solvents based in situ isolation technique for extractive deterpenation of essential oils. Food Chem. 2024, 431, 137153. [Google Scholar] [CrossRef]
- Sivrikaya Ozak, S.; Yılmaz, Y. Ultrasound-assisted hydrophobic deep eutectic solvent based solid-liquid microextraction of Sudan dyes in spice samples. Spectrochim. Acta Part A Mol. Biomol. Spectrosc. 2020, 236, 118353. [Google Scholar] [CrossRef]
- Rageh, A.H.; Abdel-aal, F.A.M.; Farrag, S.A.; Ali, A.-M.B.H. A surfactant-based quasi-hydrophobic deep eutectic solvent for dispersive liquid-liquid microextraction of gliflozins from environmental water samples using UHPLC/fluorescence detection. Talanta 2024, 266, 124950. [Google Scholar] [CrossRef] [PubMed]
- Raposo, F.; Barceló, D. Challenges and strategies of matrix effects using chromatography-mass spectrometry: An overview from research versus regulatory viewpoints. TrAC Trends Anal. Chem. 2021, 134, 116068. [Google Scholar] [CrossRef]
- Saleh, B.K.; Omer, A.; Teweldemedhin, B. Medicinal uses and health benefits of chili pepper (Capsicum spp.): A review. MOJ Food Process. Technol. 2018, 6, 325–328. [Google Scholar] [CrossRef]
- Bai, B.; Guo, Y.; Meng, S.; Chen, S.; Bo, T.; Zhang, J.; Shen, D.; Liu, Y.; Yang, Y.; Fan, S. Determination of Flavonoid Compounds in Shanxi Aged Vinegars Based on Hydrophobic Deep Eutectic Solvent VALLME-HPLC Method: Assessment of the Environmental Impact of the Developed Method. Molecules 2023, 28, 5619. [Google Scholar] [CrossRef]
- Pena-Pereira, F.; Wojnowski, W.; Tobiszewski, M. AGREE—Analytical GREEnness Metric Approach and Software. Anal. Chem. 2020, 92, 10076–10082. [Google Scholar] [CrossRef] [PubMed]
- Płotka-Wasylka, J.; Wojnowski, W. Complementary green analytical procedure index (ComplexGAPI) and software. Green Chem. 2021, 23, 8657–8665. [Google Scholar] [CrossRef]
- Płotka-Wasylka, J. A new tool for the evaluation of the analytical procedure: Green Analytical Procedure Index. Talanta 2018, 181, 204–209. [Google Scholar] [CrossRef]
- Lino, C.M.; Baeta, L.; Pena, A.S.; Silveira, I.N. Determination of ochratoxin A in coriander (Coriandrum sativum L.) by hpcl/fluorescence detection. Química Nova 2006, 29, 436–439. [Google Scholar] [CrossRef]
- Saha, D.; Acharya, D.; Roy, D.; Shrestha, D.; Dhar, T.K. Simultaneous enzyme immunoassay for the screening of aflatoxin B1 and ochratoxin A in chili samples. Anal. Chim. Acta 2007, 584, 343–349. [Google Scholar] [CrossRef]


| Hydrogen Bond Donor (HBD) | Hydrogen Bond Acceptor (HBA) | Molar Ratio between HBD and HBA | DES Was Synthesized at Room Temperature | Images for the Prepared Mixtures |
|---|---|---|---|---|
| Decanoic acid | Thymol | 1:1 | Yes |  |
| Decanoic acid | Thymol | 1:2 | No |  |
| Nonanoic acid | Thymol | 1:1 | Yes |  |
| Menthol | Thymol | 1:1 | Yes | 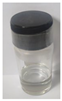 |
| Undecanoic acid | Thymol | 1:2 | No | 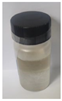 |
| Nonanoic acid | Decanoic acid | 1:1 | Yes |  |
| Octanoic acid | Thymol | 1:1 | Yes | 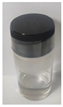 |
| Undecanoic acid | Thymol | 1:1 | Yes |  |
| Menthol | Decanoic acid | 1:1 | Yes |  |
| Parameter | Ochratoxins | Matrix Effects | Standard Curve | R2 | ||
|---|---|---|---|---|---|---|
| Standard Curve | Isotope Internal | External Standard Method | Isotope Internal Standard Method | |||
| Matrix | OTA | −75.63 | −2.22 | y = 10837.32x + 5446.51 | y = 0.83x + 0.05 | >0.95 |
| OTB | −8.09 | 12.94 | y = 29252.73x + 22367.98 | y = 2.99x + 0.22 | ||
| DES | OTA | −71.29 | 3.16 | y = 40871.50x − 4518.93 | y = 0.96x + 0.0056 | |
| OTB | 6.45 | 10.45 | y = 108457.92x − 6646.02 | y = 3.21x + 0.01 | ||
| Sample Number | Sample Name | Detection of OTA μg/kg | Detection of OTB μg/kg |
|---|---|---|---|
| 1 | LJ-13 | 187.62 | 50.95 |
| 2 | LJ-43 | 7.14 | 16.24 |
| 3 | LJ-45 | ND | 8.24 |
| 4 | LJ-49 | ND | 4.40 |
| Analytical Methods | Matrix | D.L. 1 | Linear | Reference |
|---|---|---|---|---|
| HPLC-FLD | Coriander | 0.05 µg/kg | 10–51 μg/kg | [40] |
| ELISA | Capsicum | 10 μg/kg | 10–50 μg/kg | [41] |
| LC-MS-MS | Capsicum | 0.15–0.45 μg/kg | 0.5–250 μg/kg | This work |
| Compound | Precursor Ion | Product Ion | Collision Energy (eV) | Q1—Pre Deviation Voltage (eV) | Q3—Pre Deviation Voltage (eV) | Dwell Time (mSec) |
|---|---|---|---|---|---|---|
| OTA | 403.8 | 238.95 * | −23 | −12 | −26 | 10 |
| 357.95 | −35 | −12 | −24 | 10 | ||
| OTB | 369.9 | 205.00 * | −21 | −18 | −22 | 10 |
| 187.00 | −34 | −10 | −12 | 10 | ||
| OTA | 423.9 | 250.00 * | −24 | −12 | −26 | 10 |
| OTA | 389.9 | 216.10 * | −21 | −19 | −23 | 10 |
Disclaimer/Publisher’s Note: The statements, opinions and data contained in all publications are solely those of the individual author(s) and contributor(s) and not of MDPI and/or the editor(s). MDPI and/or the editor(s) disclaim responsibility for any injury to people or property resulting from any ideas, methods, instructions or products referred to in the content. |
© 2023 by the authors. Licensee MDPI, Basel, Switzerland. This article is an open access article distributed under the terms and conditions of the Creative Commons Attribution (CC BY) license (https://creativecommons.org/licenses/by/4.0/).
Share and Cite
Yang, H.; Li, J.; Mao, J.; Xu, C.; Song, J.; Xie, F. Deep Eutectic Solvent-Based Dispersive Liquid–Liquid Microextraction Coupled with LC-MS/MS for the Analysis of Two Ochratoxins in Capsicum. Molecules 2023, 28, 7634. https://doi.org/10.3390/molecules28227634
Yang H, Li J, Mao J, Xu C, Song J, Xie F. Deep Eutectic Solvent-Based Dispersive Liquid–Liquid Microextraction Coupled with LC-MS/MS for the Analysis of Two Ochratoxins in Capsicum. Molecules. 2023; 28(22):7634. https://doi.org/10.3390/molecules28227634
Chicago/Turabian StyleYang, Hongbo, Jin Li, Jianfei Mao, Chan Xu, Jieyu Song, and Feng Xie. 2023. "Deep Eutectic Solvent-Based Dispersive Liquid–Liquid Microextraction Coupled with LC-MS/MS for the Analysis of Two Ochratoxins in Capsicum" Molecules 28, no. 22: 7634. https://doi.org/10.3390/molecules28227634