Abstract
Sanguinarine (SAN), as the main active component of a traditional Chinese veterinary medicine, has been widely used in the animal husbandry and breeding industry. However, the metabolites of SA are still uncertain. Therefore, this research aimed to investigate the metabolites of SA based on rats in vivo. The blood, feces, and urine of rats were collected after the oral administration of 40 mg/kg SAN. Ultra-high-performance liquid chromatography coupled with quadrupole time-of-flight mass spectrometry (UPLC-Q-TOF-MS/MS) was employed to identify the metabolites of SAN. The elemental composition of sanguinarine metabolites was inferred by analyzing their exact molecular weight, and the structures of the metabolites were predicted based on their fragment ions and cleavage pathways. A total of 12 metabolites were identified, including three metabolites in the plasma, four in the urine, and nine in the feces. According to the possible metabolic pathways deduced in this study, SAN was mainly metabolized through reduction, oxidation, demethylation, hydroxylation, and glucuronidation. This present research has summarized the metabolism of SAN in rats, which is helpful for further studying the metabolic mechanism of SAN in vivo and in vitro.
1. Introduction
Sanguinarine (SAN), a benzophenanthridine alkaloid, is the main component of Macleaya cordata (Willd.) R. Br. (English name: Plume Poppy), from the poppy family. It has been demonstrated that SAN possesses multiple biological activities, in particular antibacterial and anti-inflammatory properties, as well as regulating intestinal flora [1,2]. As a result of antibiotic growth promoters (AGPs) being banned in China, AGPs have been completely withdrawn from the market [3]. Meanwhile, traditional Chinese veterinary medicines have become the focus for replacing AGPs. In China, SAN has been successfully developed into a traditional Chinese veterinary medicine for its outstanding growth-promoting effect [4,5,6]. Moreover, it has been authorized for long-term addition to feed and has been widely used in the breeding industry [7].
Even though there are many reports on the growth promoting mechanism [6] and pharmacological activities [8,9] of SAN, studies on the metabolites of SAN are still limited. In the last century it was reported that SAN can produce toxic effects in rats [10]; furthermore, SAN is a major active substance in Argemone mexicana seed oil (AO), which caused “epidemic dropsy” in New Delhi, India [11]. Moreover, numerous studies have shown evidence of a correlation between AO and genotoxicity [12,13]. In addition, SAN also leads to severe cardiac abnormalities and dysfunction; recently, decreases in the heart rate and red blood cell count of zebrafish were reported [14]. It was found that 14,000 mg/kg Sangrovit (SAN as active substance) resulted in an elevated reduction in glutathione level and superoxide dismutase activity in the liver [15]. Macleaya Cordata extract, of which SAN is a major ingredient, was found to exhibit hypotoxic properties after acute exposure in SD rats and ICR mice [16]. As it is well known, drug metabolism is closely related to drug bioactivities and toxicity. Therefore, the identification of drug metabolites is of vital importance for elucidating the drug’s pharmacological mechanisms and pharmacokinetic behavior.
The earliest research showed that 3,4-benzoacridine was the metabolite of SAN [17]; nevertheless, a later study reported that SAN was metabolized to dihydrosanguinarine (DHSAN) [18], which was identified in the plasma and livers of rats using high-performance liquid chromatography electrospray mass spectrometry (HPLC/ESI-MS). The formation of DHSAN might be the first step of SAN detoxification in an organism and its subsequent elimination in phase II reactions. However, benz[c]acridine (BCA), which was reported as the metabolite of SAN in the literature, was found neither in the urine nor in the plasma or liver [19]. Another study reported that there were six metabolites formed in rat liver microsomes (RLM); the main metabolite (m/z 320) resulted from ring cleavage of SAN followed by demethylation, whereas the metabolite (m/z 348) was oxidized by recombinant human cytochrome P450 (CYP) in the presence of NADPH. The diol-sanguinarine metabolite (m/z 366) formed by RLM is derived from a putative epoxy-sanguinarine metabolite (m/z 348). 5,6-Dihydrosanguinarine is the prominent derivative formed from SAN in cells that do not express CYP [20].
Interestingly, the formation of the dihydro metabolite has been reported in the literature, which could be the main route of biotransformation (detoxification) of the benzo[c]phenanthridines in human hepatocytes. In addition, demethylation occurred on DHSAN in human hepatocytes, pig liver microsomes, and cytoplasms [21,22]. Zhang et al.’s [22] study showed that seven metabolites were identified in pig liver preparations; DHSAN was the main metabolite formed in the liver microsomes and in the cytosol. One oxidative metabolite and two O-demethylenated metabolites of SAN (m/z 320) were found in the trichloroacetic-acid-treated microsomal samples. However, a SAN pseudo base and two additional O-demethylenated metabolites of DHSAN (m/z 322) were found only in the acetonitrile-treated microsomal samples. Moreover, chelerythrine (CHE, an analogue of SAN) has been reported in many metabolites in rat vivo or vitro; the results show that the biotransformation pathways of CHE include reduction, demethylation, hydroxylation, and methylene dioxy cycle opening. Glucuronidation mainly occurred in the side chain of the benzophenanthridine parent structure; the metabolites of CHE in phase I and phase II were 25 and 8, respectively [23].
Enzymes are essential for metabolic reactions in organisms. The inhibitory effect of SAN on the cytochrome P450 enzyme has been reported, especially in CYP1A2, CYP2C9, CYP2C8, and CYP3A4, while it is not obvious in CYP2A6, CYP2D6, and CYP2E1 (Qi et al., 2013) [24]. Zhang confirmed that benzoquinone oxidase (NQO1) was employed in the reduction in SAN’s imine bond and DHSAN was generated by reduction with less toxicity than the metabolite in CYP1A1-metabolizing pathway [25]. All in all, the metabolism of SAN has been preliminarily studied by many researchers, but all of the studies were based on the liver microsomes in pigs, rats, and humans. There is no research on the metabolism of SAN in rats in vivo.
The aim of this study was to identify the metabolites of SAN in rats via UPLC-Q-TOF-MS/MS, and to infer the possible metabolic pathways so as to provide a research basis for the future studies of the metabolic mechanism of SAN in animals and the key enzymes in each metabolic pathway.
2. Results and Discussion
2.1. Fragmentations of Precursor Compound
Comparing the fragment ions of metabolites with the parent drug is a common and effective measure to identify the metabolites. In order to acquire an accurate identification, it is necessary to first find the fragmentation of the parent drug. Combined with the fragmentations of SAN mentioned in the literature [26], the fragmentations of SAN are shown in Figure 1. The retention time, elemental composition, type of reaction, accurate mass, and mass error are shown in Table 1. Twelve metabolites were finally identified, with three metabolites in the plasma (M1, M2, and M9), four metabolites in the urine (M1, M7, M11, and M12), and nine metabolites (M1−M8 and M10) in the feces. All of the metabolite structures are shown in Figure S1.
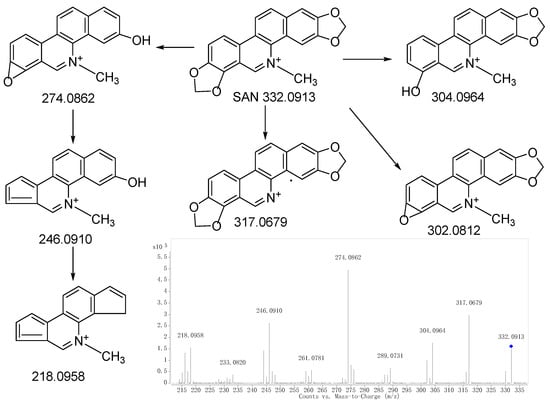
Figure 1.
MS/MS spectrum of SAN and the proposed fragmentation pathways.“◆”: precursor ion.

Table 1.
Identification of SAN metabolites in rats using UPLC/Q-TOF-MS.
Rat liver microsomes are most commonly used in metabolic research. The results of rat liver microsomes often provide important references for the research of in vivo of rats. According to the results reported by Deroussent et al. [20], only six metabolites of SAN had been identified, half of what was found in this research. Obviously, there is a significant difference between in vitro and in vivo metabolism research.
2.2. Structural Elucidation
Metabolite M0 produced the molecular ion M+ at m/z 332.0928, with a retention time of 13.496 min, which is in accordance with the molecular formula of C20H15NO4 (calculated for C20H15NO4+: 332.0917). The MS/MS spectrum (Figure 2a) displayed the precursor ion at m/z 332.0928, which generated the product ion at m/z 317.0682, 304.0981, 302.0810, and 274.0867 through the loss of CH3, CO, CH2O, and C2H2O2, respectively, and m/z 274.0867 further produced m/z 246.0917 and 218.0956 through the loss CO and 2CO, respectively. The product ions and fragmentation patterns were the same as SAN, and M0 was further confirmed using the reference standard. Under the same LC/MS condition, M0 showed the same chromatographic retention time, accurate mass, and product ions as the reference standard of SAN. Therefore, M0 was unambiguously identified as SAN.
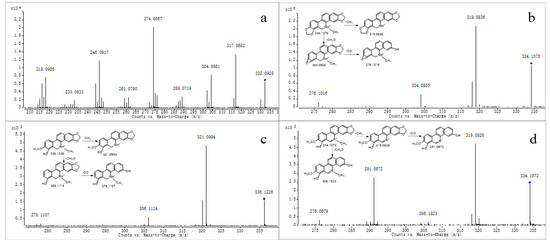
Figure 2.
MS/MS spectra of M0 (a), M1 (b), M2 (c), and M3 (d). “◆”: precursor ion.
Metabolite M1 produced the quasi-molecular ion [M+H]+ at m/z 334.1075 with a retention time of 24.281 min, which was consistent with the molecular formula of C20H15NO4 (calculated for [M+H]+: 334.1074). The fragment ion at m/z 334.1075 generated fragments at m/z 319.0836, 304.0955, and 276.1016 through the loss of CH3, CH2O, and C2H2O2, respectively (Figure 2b). The product ions mentioned above were 2 Da more than that of M0, which was consistent with the fragmentation pathways of M0; we suggest it could be a reductive metabolite of M0. M1 was further confirmed through comparison with the reference standard. Using the same LC-MS condition, M1 showed the same retention time, accurate mass, and fragment ions through comparison of the standard of DHSAN. Therefore, M1 was identified as DHSAN.
Metabolite M2 produced the quasi-molecular ion [M+H]+ at m/z 336.1226 with a retention time of 19.730 min, which was in accordance with the molecular formula of C20H17NO4 (calculated for [M+H]+: 336.1230). The precursor ion at m/z 336.1226 generated a product ion at m/z 321.0994, 306.1114, and 278.1107 through the loss of CH3, CH2O, and C2H2O2, respectively, as observed in the MS/MS spectrum (Figure 2c). All of the product ions were 2 Da more than that of DHSAN, which agreed with the fragmentation pathways of DHSAN. Deroussent et al. also found this metabolite in the rat liver microsomes [20]. So, we suggest it could be the product of DHSAN after the ring-cleavage reaction.
Metabolite M3 produced the molecular ion M+ at m/z 334.1072 (Rt = 12.098 min), which was in accordance with the molecular formula of C20H16NO4 (calculated for [M]+: 334.1074). The MS/MS spectrum (Figure 2d) demonstrated that the precursor ion at m/z 334.1072 generated the product ion at m/z 319.0826 through the loss of CH3, and m/z 291.0872 was produced from the ion at m/z 319.0826 through the loss of CO. The above fragmentation pathways agreed with the structural characteristics of M2. On the other hand, M3 had the same fragment ions as demethylation chelerythrine, as reported by Q. Lin et al. [23]. Therefore, we speculate it could be a product ion of M2 after oxidation.
Metabolites M4 and M5 produced the molecular ion M+ at m/z 320.0893 and 320.0912, respectively, with a retention time of 11.014 and 12.721 min, respectively, which were in accordance with the molecular formula of C19H14NO4 (calculated for [M]+: 320.0917). The MS/MS spectrum (Figure 3a) showed the precursor ion generated the product ion at m/z 305.0680 and 292.0961 through the loss of CH3 and CO, and m/z 292.0961 further produced m/z 274.0856 through the loss of H2O. The product ions of M4 and M5 were 14 Da less than M3, and were consistent with the fragmentation pathway of M3; thus, we suggest they could be products of M3 after demethylation, as both M4 and M5 were isomers.
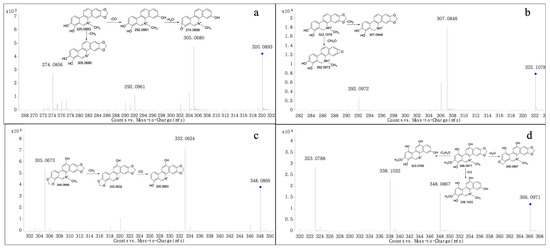
Figure 3.
MS/MS spectra of M4-5 (a), M6 (b), M7 (c), and M8 (d). “◆”: precursor ion.
Metabolite M6 produced the quasi-molecular ion [M+H]+ at m/z 332.1078 with a retention time of 16.749 min, which was in accordance with the molecular formula of C19H15NO4 (calculated for [M+H]+: 332.1074). The MS/MS spectrum (Figure 3b) showed that the precursor ion at m/z 332.1078 generated a product ion at m/z 307.0848 and 292.0972 through the loss of CH3 and CH2O, respectively. The product ions all were 14 Da less than M2, based on the fragmentation ions found; we suggest that M6 could be the product of M2 after demethylation.
Metabolite M7 produced the molecular ion M+ at m/z 348.0866 (RT = 16.749 min), which was consistent with the molecular formula of C20H14NO5 (calculated for [M]+: 348.0866). The fragment at m/z 333.0624 was generated by the precursor ion at m/z 348.0866 through the loss of CH3, and the product ion at m/z 305.0673 was formed from the ion at m/z 348.0866 through the loss of CO. The above behaviors were observed in the MS/MS spectrum (Figure 3c). The product ions all were 16 Da more than M0. We suggest that M7 could be a product of M0 after hydroxylation; however, the position of hydroxylation was uncertain.
The fragment ion at m/z 366.0971 (RT = 17.864 min) was formed from Metabolite M8, which was in accordance with the molecular formula of C20H16NO6 (calculated for[M]+: 366.0972). The MS/MS spectrum (Figure 3d) demonstrated the precursor ion at m/z 366.0971 generated the product ion at m/z 348.0867, 338.1022 and 323.0788 by loss of H2O, CO and C2H3O, All the product ions were 32 Da more than M3, we suggested that M8 could be the product of M3 after hydroxylation and the hydrogen in the benzene ring was doubly hydroxylated. However, the position of hydroxylation was uncertain.
Metabolite M9 was eluted at a retention time of 19.730 min with the quasi-molecular ion [M+H]+ at m/z 498.1398. The elemental composition was proposed to be C25H23NO10 (calculated for [M+H]+: 498.1395), which demonstrated that M9 was glucuronide conjugate of M6. The MS/MS spectrum (Figure 4a) showed two characteristic product ions at m/z 322.1047 and 307.0916, which were in accordance with those of M6. Therefore, M9 was proposed as an acyl glucuronide conjugate of M6.
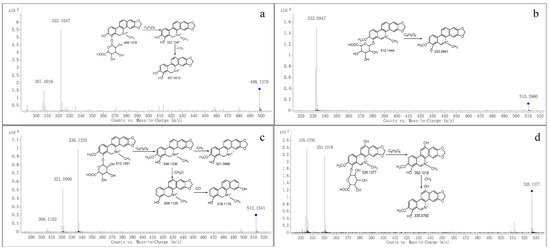
Figure 4.
MS/MS spectra of M9 (a), M10 (b), M11 (c) and M12 (d). “◆”: precursor ion.
Metabolite M10 produced the molecular ion M+ at m/z 510.1444 (RT = 23.847 min), which was in accordance with the molecular formula of C26H24NO10 (calculated for [M]+: 510.1395), which indicated that M10 was a glucuronide conjugate of M3. The MS/MS spectrum (Figure 4b) showed the fragment ion at m/z 333.0947, which was consistent with M3. Therefore, M10 was tentatively identified as a glucuronide conjugate of M3.
Metabolite M11 produced the quasi-molecular ion [M+H]+ at m/z 512.1541 (RT = 15.213 min), which was in accordance with the molecular formula of C26H25NO10 (calculated for [M+H]+: 512.1551). The MS/MS spectrum (Figure 4c) showed that M2 was generated from the ion at m/z 512.1541 through the loss of C6H8O6, and m/z 321.0996 and 306.1102 were formed from M2 through the loss of CH3 and CH2O, respectively. Therefore, we suggest it could be a product of M2 because of glucuronidation.
The m/z at 526.1377 (RT = 15.691 min) was produced from Metabolite M12, whose fragmentation pathways were in accordance with the molecular formula of C26H24NO11 (calculated for [M]+: 526.1344). The MS/MS spectrum (Figure 4d) showed that the precursor ion at m/z 526.1377 generated the product ion at m/z 350.1018 through the loss of C6H8O6. Moreover, the fragment at m/z 335.0790 was produced from m/z at 350.1018 through the loss of CH3. Therefore, we suggest M12 could be the product of glucuronidation of M3 after hydroxylation.
2.3. Metabolite Profile and Metabolic Pathways of SAN
According to the fragmentations of SAN mentioned above, based on both the inferred metabolite structures and the document literature, the possible metabolic pathways are presented in Figure 5. Considering that the number of metabolites in the plasma and urine was much less than that in the feces, a possible reason is that SAN was orally administrated to the rats, which led to a low dose absorption into the blood. The previous study reported that after a single oral dose of 3H-sanguinarine, more than 42% of the ingested radioactivity was present in the gastrointestinal tract [27].
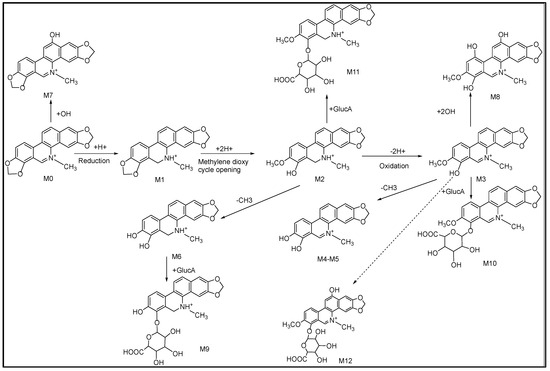
Figure 5.
Proposed metabolic pathways of SAN in rats.
A HPLC-MS/MS method was established for the simultaneous quantitative analysis of SAN and DHSAN in chicken plasma, and was applied to a pharmacokinetic study in chicken. The results showed that Cmax (0.9 ng/mL) of SAN was attained at 0.38 h and Cmax (5.17 ng/mL) of DHSAN was attained at 0.25 h, which indicated that both SAN and DHSAN were rapidly absorbed in the chickens; even though the absorbed dose of SAN was low, DHSAN was more easily absorbed [28]. The pharmacokinetics results showed that after SAN was administered through subcutaneous injection, the Cmax of SAN (30.16 ng/mL) and DHSAN (5.61 ng/mL) were achieved at 0.25 h; meanwhile, after the oral administration of SAN, Cmax of SAN (3.40 ng/mL) and DHSAN (2.41 ng/mL) were attained at 2.75 h, and the relative bioavailability of SAN was lower than DHSAN, which indicated that SAN had difficulty being absorbed after oral administration in pigs [29]. Moreover, male and female rats were intragastrically administered SAN (0.5 mg/kg body weight and 5 mg/kg body weight dose for 28 days), and the Cmax of SAN (low dose) in female and male rats was reached (4.76 and 3.88 ng/mL) at 2.17 h (Tmax) and the Cmax of SAN (high dose) in female and male rates was reached (33.12 and 24.36 ng/mL) at 2.17 h (Tmax) [30]. There were a large amount of SAN excreted from the feces after SAN was orally administered [31]. In conclusion, all of the studies mentioned above indicate that the absorption of SAN in vivo was poor, which could be the main reason for the differences in the amount of metabolites produced in the plasma, urine, and feces.
There were different results found for the metabolite of SAN between this study and other studies in the literatures. A metabolite with m/z 350.1023 of SAN was identified by Zhang et al. in pig liver microsomes; however, this was not included in the present research, and, interestingly, the metabolite’s glucuronidation product was identified. We speculate that m/z 350.1023 was possibly completely glucuronidated in rats and led to no detection [25]. Deroussent et al. researched the metabolites and metabolic pathways of SAN in rat liver microsomes, and all of the identified metabolites were all included in this study. However, the reaction(s) involved in the metabolic pathways was different; Deroussent et al. reported that the metabolic process of SAN was oxidation, demethylation, and reduction, respectively, while this study suggests that reduction should be the first step, followed by oxidation, demethylation, hydroxylation, and glucuronidation [20]. To sum up, the metabolism of SAN in rats is more complex than that in vitro, and there are also different metabolic pathways; this needs to be further verified in further studies.
3. Materials and Methods
3.1. Chemicals and Reagents
Sanguinarine (purity > 98%) and dihydrosanguinarine (purity > 96%) were provided by Micolta Biresource Inc., Ltd. (Changsha, China). Formic acid was obtained from ROE. Acetonitrile and methyl alcohol were acquired from Merck. Sodium carboxymethylcellulose (CMC-Na, Lot: CC31154150) was purchased from Beijing Coolaber Technology Co., Ltd. (Beijing, China). Deionized water was purified using a Milli-Q system (Bedford, MA, USA). The other chemicals were of analytical grade and were commercially available.
3.2. Animals and Drug Administration
Male Sprague-Dawley (SD) rats (180–220 g) were purchased from Changsha Tianqin Biotechnology Co., Ltd. (Changsha, China), and were acclimatized for a week before any treatments. All of the experimental protocols were approved by the Animal Ethics Committee of Hunan Agricultural University, and the procedures were in accordance with the guidelines of the Committee on the Care and Use of Laboratory Animals of the U.S. National Institutes of Health. Twelve SD rats were randomly divided into four groups (three rats in each group), including one blank group and three experiment groups, which were used to gather plasma, urine, and feces, respectively. SAN (4 mg/mL) was suspended in 0.5% CMC-Na, which was given to the rats at a dose of 40 mg/kg through oral gavage.
3.3. Sample Collection and Pretreatment
3.3.1. Sample Collection
The rats were housed in metabolism cages prior to drug administration. The plasma samples were collected using a retro-orbital puncture with a glass capillary from the fossa orbitalis vein 1, 2, and 4 h after dosing. The samples were collected into heparinized plastic tubes and centrifuged at 3000 rpm for 10 min, and the resulting plasma samples were merged. The urine and feces samples were gathered at 0–12, 12–24, 24–36, and 36–48 h after dosing and then merged, and the feces were air dried. All of the samples were stored at −80 °C until analysis.
3.3.2. Sample Pretreatment
The pretreatment methods for the plasma, urine, and feces were described in an article that has already been published [23]. First, 1 mL of the urine sample was mixed with an equal volume of acetonitrile for protein precipitation and vortexed for 2 min, and then centrifuged at 5000 r/min for 5 min, and the supernatant was collected and dried with nitrogen at 45 °C. The residue was reconstituted in 200 μL methanol and mixed for 2 min, then the sample was centrifuged at 12,000 r/min for 10 min and the supernatant was collected. The fecal sample (1 g) was ultrasonically extracted with 20 mL methanol for 30 min and then centrifuged at 5000 r/min for 5 min. The supernatant was collected and dried with nitrogen at 45 °C, the residue was dissolved using 200 μL methanol and mixed for 2 min, and then centrifuged at 12,000 r/min for 10 min and the supernatant was collected. Then, 250 μL of rat plasma was transferred into 1.5 mL tubes and 1 mL methanol was added and mixed for 2 min to precipitate the protein, the mixture was centrifuged at 12,000 r/min for 10 min. The supernatant was then collected to a clean tube and dried with nitrogen at 45 °C. The residue was reconstituted in 100 μL methanol and mixed for 2 min, and then the sample was centrifuged at 12,000 r/min for 10 min nd the supernatant was collected. Finally, an aliquot of 10 μL from all of the collected supernatants was injected into the UPLC-Q-TOF-MS/MS system for analysis.
3.4. Instruments and Analytical Conditions
A 1290 high-performance liquid chromatography system (Agilent Technologies, Palo Alto, CA, USA) equipped with a quaternary gradient pump, in-line degassing, and constant temperature column oven was used. SAN and its metabolites were separated on an ACQUITY UPLC TM HSS T3 column (100 mm × 2.1 mm, 1.8 μm) at a column temperature of 40 °C. The mobile phase, consisting of 0.1% formic acid in water (A) and 0.1% formic acid in acetonitrile (B), was delivered at a flow rate of 0.3 mL/min, and the injection volume was 1 µL. A linear gradient of 5–21% B for 0–9 min, 21–27% B for 9–11.5 min, 27–43% B for 11.5–15 min, 43–85% B for 15–28 min, 85–95% B for 28–30 min, 95% B for 30–33 min, and 5% B for 33.1–35 min was employed.
MS and MS/MS data were obtained in positive mode (m/z: 100–1000) using an electrospray ionization (ESI) interface on an Agilent Technologies 6530 Q-TOF. The parameters were as follows: drying gas temperature of 350 °C; drying gas flow of 12 L/min, nebulizer (N2) pressure of 35 psi, sheath gas (N2) temperature of 350 °C, sheath gas flow of 11 L/min, capillary voltage of 4000 V, nozzle voltage of 500 V, and fragmentor of 135 V. A collision energy of 20–40 V was used for the MS/MS analysis. An Agilent Masshunter B.08.00 was used for instrument control and data acquisition.
3.5. Data Analysis
Before the sample pretreatment and data acquisition, we summarized the metabolites and pathways of sanguinarine and other alkaloids (such as chelerythrine) by searching relative articles. Then, the metabolic reaction, pathway, and m/z of the possible metabolites of sanguinarine were concluded in an Excel, which was named a private database. After data acquisition and background correction, we searched for possible metabolites in total ion chromatogram using the database and selected the high abundance components that existed in the database. The MS/MS spectra of the selected substances were acquired using the target MS/MS method, then the structure of the component fragments of metabolites were inferred according to the fragmentation pattern of sanguinarine.
4. Conclusions
In this study, the metabolism of SAN was firstly explored in rats in vivo via UPLC-Q-TOF-MS/MS. Twelve metabolites were identified based on the chromatographic retention times, accurate mass measurements, MS/MS fragmentation patterns. and fragment ion mass. The metabolic pathways involved reduction, oxidation, demethylation, hydroxylation, and glucuronidation. This research have identified the metabolites of SAN firstly in rats, which is helpful to deeply research the metabolic mechanism and find out the key enzymes of SAN in rats. The mechanism of SAN is important to decrease the toxicity by interfering with drug-metabolizing key enzymes, and also ensure the safety and widespread use of Macleaya cordata (Willd.) R. Br.
Supplementary Materials
The following supporting information can be downloaded at: https://www.mdpi.com/article/10.3390/molecules28227641/s1, Figure S1: Structures of SAN and its metabolites.
Author Contributions
Investigation, M.L.; project administration, J.Z. and Z.Y.; supervision, J.Z. and Z.Y.; writing—original draft, M.L., writing—review and editing, Z.L., Z.D. and X.Z. All authors have read and agreed to the published version of the manuscript.
Funding
This study was supported by the National Key Research and Development Program (2022YFD1801105).
Institutional Review Board Statement
The study was approved by the Animal Ethical Committee of Hunan Agricultural University (protocol code NO.87(2021) and date of approval 9/10/2021).
Informed Consent Statement
Not applicable.
Data Availability Statement
Data are contained within the article and Supplementary Materials.
Conflicts of Interest
The authors declare no conflict of interest.
References
- Zhang, Q.; Lyu, Y.; Huang, J.; Zhang, X.; Yu, N.; Wen, Z.; Chen, S. Antibacterial Activity and Mechanism of Sanguinarine against Providencia Rettgeri in Vitro. PeerJ 2020, 8, e9543. [Google Scholar] [CrossRef] [PubMed]
- Danielewski, M.; Zielińska, S.; Matuszewska, A.; Słupski, W.; Włodarczyk, M.; Jęśkowiak, I.; Wiatrak, B.; Kowalski, K.; Jezierska-Domaradzka, A.; Ziółkowski, P.; et al. Sanguinarine-Chelerythrine Fraction of Coptis Chinensis Exerts Anti-Inflammatory Activity in Carrageenan Paw Oedema Test in Rats and Reveals Reduced Gastrotoxicity. Oxid. Med. Cell. Longev. 2022, 2022, 1504929. [Google Scholar] [CrossRef] [PubMed]
- Tian, M.; He, X.; Feng, Y.; Wang, W.; Chen, H.; Gong, M.; Liu, D.; Clarke, J.L.; van Eerde, A. Pollution by Antibiotics and Antimicrobial Resistance in LiveStock and Poultry Manure in China, and Countermeasures. Antibiotics 2021, 10, 539. [Google Scholar] [CrossRef] [PubMed]
- Xue, G.D.; Wu, S.B.; Choct, M.; Pastor, A.; Steiner, T.; Swick, R.A. Impact of a Macleaya Cordata-Derived Alkaloid Extract on Necrotic Enteritis in Broilers. Poult. Sci. 2017, 96, 3581–3585. [Google Scholar] [CrossRef] [PubMed]
- Zhao, L.; Alvensleben, S.V.; Fusconi, G.; Morlacchini, M. Safety Evaluation of a Standardized Macleaya Cordata Extract in a Ninety Day Feeding Study in Weaned Piglets. Open J. Anim. Sci. 2017, 7, 213–231. [Google Scholar] [CrossRef][Green Version]
- Huang, P.; Zhang, Y.; Xiao, K.; Jiang, F.; Wang, H.; Tang, D.; Liu, D.; Liu, B.; Liu, Y.; He, X.; et al. The Chicken Gut Metagenome and the Modulatory Effects of Plant-Derived Benzylisoquinoline Alkaloids. Microbiome 2018, 6, 211. [Google Scholar] [CrossRef]
- Wang, F.; Yin, Y.; Yang, M.; Chen, J.; Fu, C.; Huang, K. Effects of Combined Supplementation of Macleaya Cordata Extract and Benzoic Acid on the Growth Performance, Immune Responses, Antioxidant Capacity, Intestinal Morphology, and Microbial Composition in Weaned Piglets. Front. Vet. Sci. 2021, 8, 708597. [Google Scholar] [CrossRef]
- Li, J.; Wu, Y.; Dong, S.; Yu, Y.; Wu, Y.; Xiang, B.; Li, Q. Research Progress on Neuroprotective Effects of Isoquinoline Alkaloids. Molecules 2023, 28, 4797. [Google Scholar] [CrossRef]
- Ke, Q.; Duan, K.; Cheng, Y.; Xu, S.; Xiao, S.; Fang, L. Sanguinarine Exhibits Antiviral Activity against Porcine Reproductive and Respiratory Syndrome Virus via Multisite Inhibition Mechanisms. Viruses 2023, 15, 688. [Google Scholar] [CrossRef]
- Sarkar, S.M. Isolation from Argemone Oil of Dihydrosanguinarine and Sanguinarine; Toxicity of Sanguinarine. Nature 1948, 162, 265. [Google Scholar] [CrossRef]
- Sharma, B.D.; Bhatia, V.; Rahtee, M.; Kumar, R.; Mukharjee, A. Epidemic Dropsy: Observations on Pathophysiology and Clinical Features during the Delhi Epidemic of 1998. Trop. Doct. 2002, 32, 70–75. [Google Scholar] [CrossRef] [PubMed]
- Ansari, K.M.; Dhawan, A.; Khanna, S.K.; Das, M. Protective Effect of Bioantioxidants on Argemone Oil/Sanguinarine Alkaloid Induced Genotoxicity in Mice. Cancer Lett. 2006, 244, 109–118. [Google Scholar] [CrossRef] [PubMed]
- Ghosh, I.; Mukherjee, A. Argemone Oil Induces Genotoxicity in Mice. Drug Chem. Toxicol. 2016, 39, 407–411. [Google Scholar] [CrossRef]
- Wang, X.; Yang, X.; Wang, J.; Li, L.; Zhang, Y.; Jin, M.; Chen, X.; Sun, C.; Wang, R.; Liu, K. Cardiotoxicity of Sanguinarine via Regulating Apoptosis and MAPK Pathways in Zebrafish and HL1 Cardiomyocytes. Comp. Biochem. Physiol. C Toxicol. Pharmacol. 2022, 252, 109228. [Google Scholar] [CrossRef] [PubMed]
- Zdarilova, A.; Vrublova, E.; Vostalova, J.; Klejdus, B.; Stejskal, D.; Proskova, J.; Kosina, P.; Svobodova, A.; Vecera, R.; Hrbac, J.; et al. Natural Feed Additive of Macleaya Cordata: Safety Assessment in Rats a 90-Day Feeding Experiment. Food Chem. Toxicol. 2008, 46, 3721–3726. [Google Scholar] [CrossRef]
- Dong, Z.; Tang, S.-S.; Ma, X.-L.; Li, C.-H.; Tang, Z.-S.; Yang, Z.-H.; Zeng, J.-G. Preclinical Safety Evaluation of Macleaya Cordata Extract: A Re-Assessment of General Toxicity and Genotoxicity Properties in Rodents. Front. Pharmacol. 2022, 13, 980918. [Google Scholar] [CrossRef]
- Hakim, S.A.; Mijovic, V.; Walker, J. Experimental Transmission of Sanguinarine in Milk: Detection of a Metabolic Product. Nature 1961, 189, 201–204. [Google Scholar] [CrossRef]
- Dvorák, Z.; Simánek, V. Metabolism of Sanguinarine: The Facts and the Myths. Curr. Drug Metab. 2007, 8, 173–176. [Google Scholar] [CrossRef]
- Psotová, J.; Klejdus, B.; Vecera, R.; Kosina, P.; Kubán, V.; Vicar, J.; Simánek, V.; Ulrichová, J. A Liquid Chromatographic-Mass Spectrometric Evidence of Dihydrosanguinarine as a First Metabolite of Sanguinarine Transformation in Rat. J. Chromatogr. B Analyt. Technol. Biomed. Life Sci. 2006, 830, 165–172. [Google Scholar] [CrossRef]
- Deroussent, A.; Ré, M.; Hoellinger, H.; Cresteil, T. Metabolism of Sanguinarine in Human and in Rat: Characterization of Oxidative Metabolites Produced by Human CYP1A1 and CYP1A2 and Rat Liver Microsomes Using Liquid Chromatography-Tandem Mass Spectrometry. J. Pharm. Biomed. Anal. 2010, 52, 391–397. [Google Scholar] [CrossRef]
- Kosina, P.; Vacek, J.; Papoušková, B.; Stiborová, M.; Stýskala, J.; Cankař, P.; Vrublová, E.; Vostálová, J.; Simánek, V.; Ulrichová, J. Identification of Benzo[c]Phenanthridine Metabolites in Human Hepatocytes by Liquid Chromatography with Electrospray Ion-Trap and Quadrupole Time-of-Flight Mass Spectrometry. J. Chromatogr. B Analyt. Technol. Biomed. Life Sci. 2011, 879, 1077–1085. [Google Scholar] [CrossRef] [PubMed]
- Zhang, H.-H.; Wu, Y.; Sun, Z.-L.; Liu, Z.-Y. Identification of Sanguinarine Metabolites in Pig Liver Preparations by Accurate Mass Measurements Using Electrospray Ionization Hybrid Ion Trap/Time-of-Flight Mass Spectrometry. Rapid Commun. Mass Spectrom. 2013, 27, 979–984. [Google Scholar] [CrossRef] [PubMed]
- Lin, Q.; Ma, C.; Guan, H.; Chen, L.; Xie, Q.; Cheng, X.; Wang, C. Metabolites Identification and Reversible Interconversion of Chelerythrine and Dihydrochelerythrine in Vitro/in Vivo in Rats Using Ultra-Performance Liquid Chromatography Combined with Electrospray Ionization Quadrupole Time-of-Flight Tandem Mass Spectrometry. J. Pharm. Biomed. Anal. 2020, 189, 113462. [Google Scholar] [CrossRef]
- Qi, X.-Y.; Liang, S.-C.; Ge, G.-B.; Liu, Y.; Dong, P.-P.; Zhang, J.-W.; Wang, A.-X.; Hou, J.; Zhu, L.-L.; Yang, L.; et al. Inhibitory Effects of Sanguinarine on Human Liver Cytochrome P450 Enzymes. Food Chem. Toxicol. 2013, 56, 392–397. [Google Scholar] [CrossRef] [PubMed]
- Zhang, D.-S.; Liu, Z.-Y.; Li, Y.; Sun, Z.-L. NQO1 Involves in the Imine Bond Reduction of Sanguinarine and Recombinant Adeno-Associated Virus Mediated NQO1 Overexpression Decreases Sanguinarine-Induced Cytotoxicity in Rat BRL Cells. Toxicol. Lett. 2014, 225, 119–129. [Google Scholar] [CrossRef]
- Dong, Z.; Liu, M.; Zhong, X.; Ou, X.; Yun, X.; Wang, M.; Ren, S.; Qing, Z.; Zeng, J. Identification of the Impurities in Bopu Powder® and Sangrovit® by LC-MS Combined with a Screening Method. Molecules 2021, 26, 3851. [Google Scholar] [CrossRef]
- Vecera, R.; Klejdus, B.; Kosina, P.; Orolin, J.; Stiborová, M.; Smrcek, S.; Vicar, J.; Dvorák, Z.; Ulrichová, J.; Kubán, V.; et al. Disposition of Sanguinarine in the Rat. Xenobiotica 2007, 37, 549–558. [Google Scholar] [CrossRef]
- Xie, H.; Yang, J.; Feng, S.; Cheng, P.; Zeng, J.; Xiong, X. Simultaneous Quantitative Determination of Sanguinarine, Chelerythrine, Dihydrosanguinarine and Dihydrochelerythrine in Chicken by HPLC-MS/MS Method and Its Applications to Drug Residue and Pharmacokinetic Study. J. Chromatogr. B Analyt. Technol. Biomed. Life Sci. 2015, 985, 124–130. [Google Scholar] [CrossRef]
- Wu, Y.; Zhao, N.-J.; Cao, Y.; Sun, Z.; Wang, Q.; Liu, Z.-Y.; Sun, Z.-L. Sanguinarine Metabolism and Pharmacokinetics Study in Vitro and in Vivo. J. Vet. Pharmacol. Ther. 2020, 43, 208–214. [Google Scholar] [CrossRef]
- Shen, L.-X.; Liu, G.-F.; Song, J.-S.; Cao, Y.-H.; Peng, X.; Wu, R.-R.; Cao, Y.; Chen, X.-J.; Liu, Z.; Sun, Z.-L.; et al. Sex Differences in the Pharmacokinetics and Tissue Residues of Macleaya Cordata Extracts in Rats. Xenobiotica 2022, 52, 46–53. [Google Scholar] [CrossRef]
- Kosina, P.; Walterová, D.; Ulrichová, J.; Lichnovský, V.; Stiborová, M.; Rýdlová, H.; Vicar, J.; Krecman, V.; Brabec, M.J.; Simánek, V. Sanguinarine and Chelerythrine: Assessment of Safety on Pigs in Ninety Days Feeding Experiment. Food Chem. Toxicol. 2004, 42, 85–91. [Google Scholar] [CrossRef] [PubMed]


Disclaimer/Publisher’s Note: The statements, opinions and data contained in all publications are solely those of the individual author(s) and contributor(s) and not of MDPI and/or the editor(s). MDPI and/or the editor(s) disclaim responsibility for any injury to people or property resulting from any ideas, methods, instructions or products referred to in the content. |
© 2023 by the authors. Licensee MDPI, Basel, Switzerland. This article is an open access article distributed under the terms and conditions of the Creative Commons Attribution (CC BY) license (https://creativecommons.org/licenses/by/4.0/).