Abstract
The management of phosphine (PH3) resistance in stored grain pests is an essential component of implementing timely and effective pest control strategies. The prevailing standard method for PH3 resistance testing involves the exposure of adult insects to a specific concentration over a fixed period. Although it is widely adopted, this method necessitates an extensive period for assay preparation and diagnosis. To address this issue, this study employed Direct Immersion Solid-Phase Microextraction (DI-SPME) coupled with Gas Chromatography-Mass Spectrometry (GC-MS) to compare and analyze the metabolic profiles of PH3-sensitive (TC-S), PH3 weak-resistant (TC-W), and PH3 strong-resistant (TC-SR) Tribolium castaneum (Herbst) adults. A total of 36 metabolites were identified from 3 different PH3-resistant strains of T. castaneum; 29 metabolites were found to present significant differences (p < 0.05) across these groups, with hydrocarbon and aromatic compounds being particularly prevalent. Seven metabolites showed no significant variations among the strains, consisting of four hydrocarbon compounds, two iodo-hydrocarbon compounds, and one alcohol compound. Further multivariate statistical analysis revealed a total of three, two, and nine differentially regulated metabolites between the TC-S versus TC-W, TC-S versus TC-SR, and TC-W versus TC-SR groups, respectively. Primarily, these metabolites comprised hydrocarbons and iodo-hydrocarbons, with the majority being associated with insect cuticle metabolism. This study demonstrates that DI-SPME technology is an effective method for studying differentially expressed metabolites in T. castaneum with different levels of PH3 resistance. This approach may help to provide a better understanding of the development of insect PH3 resistance and act as a valuable reference for the establishment of rapid diagnostic techniques for insect PH3 resistance.
1. Introduction
Tribolium castaneum (Herbst), commonly known as the red flour beetle, is a global stored grain pest. It has the potential to inflict damage on a wide array of commodities, more than 20%, thereby causing substantial economic losses, particularly in developing countries [1]. Over the past 50 years, PH3 has emerged as a preferred fumigant due to its cost-effectiveness, rapid diffusion, and low residual levels. However, the long-term irrational use of this single chemical increases the risk of PH3 resistance among T. castaneum populations [2]. Recent reports show that key grain-producing regions, including Asia, North America, South America, Europe, and Africa, have alarming levels of PH3 resistance [3,4]. This finding not only highlights the gravity of the situation but also focuses on the immediate necessity to address this urgent problem. Consequently, the grain industry is now confronted with an urgent demand for precise and rapid methods to detect PH3 resistance in insects [5,6]. These methods are essential for designing rational fumigation strategies, thereby offering innovative approaches and solutions to ensure food security and effective pest management.
The method established by the Food and Agriculture Organization (FAO) in 1975 serves as the standard procedure for diagnosing resistance to PH3 in pest populations. The diagnostic process involves two stages of mortality evaluations following the bioassay. The first stage is an initial assessment conducted at the conclusion of the fumigation phase, and the second stage is a subsequent confirmatory assessment of endpoint mortality 14 days after the fumigation period has ended [4]. The main limitation of this bioassay method, which is based on mortality rate, is the excessive time required for resistance diagnosis. The Knockdown Test (KT) method, a variation of the FAO method, offers a rapid assay for PH3 resistance based on time to knockdown. This assay relies on the response variable “behavior,” which is defined as the inability of an insect to walk in a coordinated manner [7,8,9]. However, the ambiguity of the KT discriminant criteria may lead to significant variations among the results obtained by different testers, thereby causing the diagnostic outcomes to potentially deviate substantially from the actual levels of resistance. Molecular resistance diagnosis is emerging as an alternative to the traditional FAO bioassay [10,11], but this technique requires a relatively high level of initial financial investment and specialized knowledge.
The toxicological mechanism of PH3 involves disrupting the sympathetic nervous system, inhibiting energy metabolism, and altering cellular redox balance [12]. Two mitochondrial enzymes—cytochrome b5 fatty acid desaturase (Cyt-b5-r) and dihydrolipoamide dehydrogenase (DLD)—have been defined as rph1 and rph2, key factors in PH3 resistance in various organisms, including several stored grain pests. However, the molecular mechanisms of these two key genes involved in PH3 toxicity remain unclear [13]. Recent studies suggest that variations in the levels of certain metabolites within insects significantly affect pesticide resistance, providing a new perspective on resistance mechanisms [14]. Specifically, compounds such as lipids and hydrocarbons appear to form a protective barrier that reduces insect susceptibility to PH3 [15,16,17,18]. Consequently, changes in specific insect metabolites may serve as biomarkers that indicate the level of PH3 resistance.
Solid-Phase Microextraction (SPME) has been widely recognized as a rapid sample processing technique, especially in the fields of analytical biology, pharmaceuticals, and food research. Compared to traditional detection methods, SPME coupled with GC-MS enhances the purity, reproducibility, and sensitivity of the extracts [19]. However, its primary limitation stems from its interest in volatile and semi-volatile compounds. While the majority of studies concerning insect volatile substances have concentrated on their roles in attraction or repellent effects (i.e., insect pheromones) [20,21], several innovative findings have been reported. For instance, Du et al. utilized HS-SPME to identify two benzoquinone derivatives with potential as biomarkers for detecting T. castaneum PH3 resistance [14]. Al-Khshemawee et al. employed DI-SPME chemical extraction technology coupled with GCMS to analyze metabolic changes in Ceratitis capitata (Wiedemann) during mating [22]. Furthermore, Alnajim et al. extracted and analyzed hydrocarbons in the cuticle of PH3-resistant and sensitive strains of T. castaneum and Rhyzopertha dominica (Fabricius) using DI-SPME-GC-MS, revealing that the high content of hydrocarbons might serve as a key factor in preventing PH3 entry into resistant insect bodies [16,17]. These studies demonstrate the high applicability of SPME in the field of insect PH3 resistance detection, facilitating not only the rapid diagnosis of population resistance to PH3 but also the exploration of potential PH3 resistance mechanisms. These insights hold practical implications for PH3 resistance management. Additionally, this technology affords researchers the ability to diagnose the PH3 resistance level of field-collected insect populations within the same day, thereby facilitating the timely implementation of specific management strategies.
Recognizing the substantial potential of Solid-Phase Microextraction (SPME) technology for differentiating levels of PH3 resistance in insects, for this study, we employed DI-SPME to investigate the dynamic changes of volatile organic metabolites within the T. castaneum across different PH3 resistance levels. This leads to the development of a PH3 resistance identification model. Figure 1 illustrates the processes we adopted to achieve the above purposes: First, the strains of T. castaneum samples that are sensitive, weakly resistant, and strongly resistant to PH3 are selected using the FAO method. Subsequently, DI-SPME-GCMS technology is utilized to extract and characterize the metabolites present in these three strains. Further, based on GC-MS analysis, metabolic profiles are constructed for the samples, and through the application of multivariate statistical analysis methods, a PH3 resistance identification model is formulated, identifying the metabolites that are differentially regulated under varying PH3 resistances. In addition, to explore the metabolic pathways of PH3 resistance, we individually evaluated key differential metabolites. This analysis holds long-term theoretical significance for understanding the underlying mechanisms of PH3 resistance in T. castaneum.
Figure 1.
Schematic diagram of the technical process used to explore the metabolic changes in T. castaneum strains with different levels of PH3 resistance via DI-SPME coupled with GC-MS.
2. Results and Discussion
2.1. Phosphine Susceptibility Tests
Probit analysis was conducted on the adult mortality rates of three T. castaneum strains (Wuhan, Qihe and Zibo), revealing significant alignment (p < 0.001) with complementary log-log and probit-log regression models in response to varying PH3 concentrations. These strains showed less variability (heterogeneity < 1), indicating that mortality response to PH3 was concentrated. The G-factor, a potency estimation index for mortality response data, ranged from 0.027 to 0.284, maintaining accurate lethal concentration predictions at various probability levels. The G-factor of the three T. castaneum strains was below the threshold of 0.5 and ranged between 0.027 and 0.284. This suggests that, based on the G-factor, the predicted lethal concentration ranges at various probability levels are reliable.
Resistance ratios were typically calculated at the 50% mortality level using the FAO method. The LC50 for the susceptible strain exposed for 20 h was 0.0088 mg/L (95% fiducial limits: 0.0085–0.0090 mg/L). In accordance with the literature, the adults of T. castaneum were classified into three different groups based on their levels of resistance to PH3: susceptibility, weak resistance (1 < RR < 100), and strong resistance (RR > 100) [23]. Therefore, in this experiment, the Wuhan, Qihe, and Zibo strains exhibit susceptibility, weak resistance, and strong resistance, respectively (Table 1).

Table 1.
Probit mortality response of adults of T. castaneum to PH3 at 25 ± 2 °C and 55 ± 5% RH.
2.2. Metabolite Expression in Response to Tribolium Castaneum (Herbst) Adults of Different Phosphine Resistance Levels
A total of 36 compounds were identified from 3 strains: 29 from TC-S, 36 from TC-W, and 32 from TC-SR (Table 2). While some compounds were ubiquitous across all three strains, others demonstrated differential expression in one or two strains. A one-way ANOVA and subsequent post hoc analysis (Fisher‘s LSD) revealed significant differences (p < 0.05) in the GC-MS response of 29 compounds, including 14 hydrocarbons; 4 aromatics; 3 ethers; 2 each of acids, alcohols, and aldehydes; and 1 each of iodo-hydrocarbons and ketone (Figure 2). Compounds such as 2-methyl-p-benzoquinone; (E)-2-decenal; 2-undecenal; (Z,Z)-1,8,11-heptadecatriene; 1,13-tetradecadiene; n-hexadecanoic acid; tetracosane; 13-methylheptacosane; 11-methylpentacosane; 2-methylheptacosane; 2-methyloctacosane; docosyl heptyl ether; hentriacontane; and cholesta-5,7-dien-3beta-ol were found to be upregulated with the increase in PH3 resistance level in T. castaneum. Conversely, compounds such as orcinol; ethyl-p-hydroxybenzoate; (Z)-8-dodecenol; 1-iodo-tetracosane; 1-iodo-docosane; and 1-iodo-hexacosane were downregulated as the resistance to PH3 in T. castaneum increased. The relative abundance (RA) of 1-pentadecene remained consistent and was found in the highest proportions among the T. castaneum strains with varying levels of PH3 resistance. This could be attributed to the distinctive role of 1-pentadecene as a characteristic volatile compound produced by T. castaneum [24,25]. Representative chromatograms and mass spectra for each group are provided in the Supplementary Materials (Figure S1).
Table 2.
Profile of metabolites produced from T. castaneum with different levels of PH3 resistance.
Figure 2.
Metabolites obtained in T. castaneum adults with different levels of PH3 resistance. The  represent significant compounds selected based on the p-value threshold (<0.05), and the
  represent non-significant compounds (left). The number of metabolites in each chemical classification (right).
represent significant compounds selected based on the p-value threshold (<0.05), and the represent non-significant compounds (left). The number of metabolites in each chemical classification (right).
To enhance the visualization of the similarities and differences in the RA of metabolites in the TC-S, TC-W, and TC-SR groups, a heatmap was constructed to cluster the identified metabolites based on the similarity of their RA changes. As depicted in Figure 3, the 29 metabolites subjected to hierarchical clustering across the three groups demonstrated varied regulatory directions. Each cell within the heatmap signifies the mean RA of a metabolite, with the color gradient from blue to red indicating the downregulation to upregulation of metabolites, respectively. Notably, approximately half of the metabolites in the TC-W and TC-SR groups exhibited upregulation, whereas the majority in the TC-S group were downregulated. The heatmap thus provides a clear and intuitive representation of the distinct metabolite patterns among adult T. castaneum strains with varying degrees of PH3 sensitivity (susceptibility, weak PH3 resistance, and strong PH3 resistance).
Figure 3.
Heatmap showing the changes of abundance values normalized (with p < 0.05; calculated via a one-way ANOVA) to the metabolites that are significantly influenced by different PH3 resistance levels.
2.3. Statistical Analysis and Differentially Regulated Metabolites
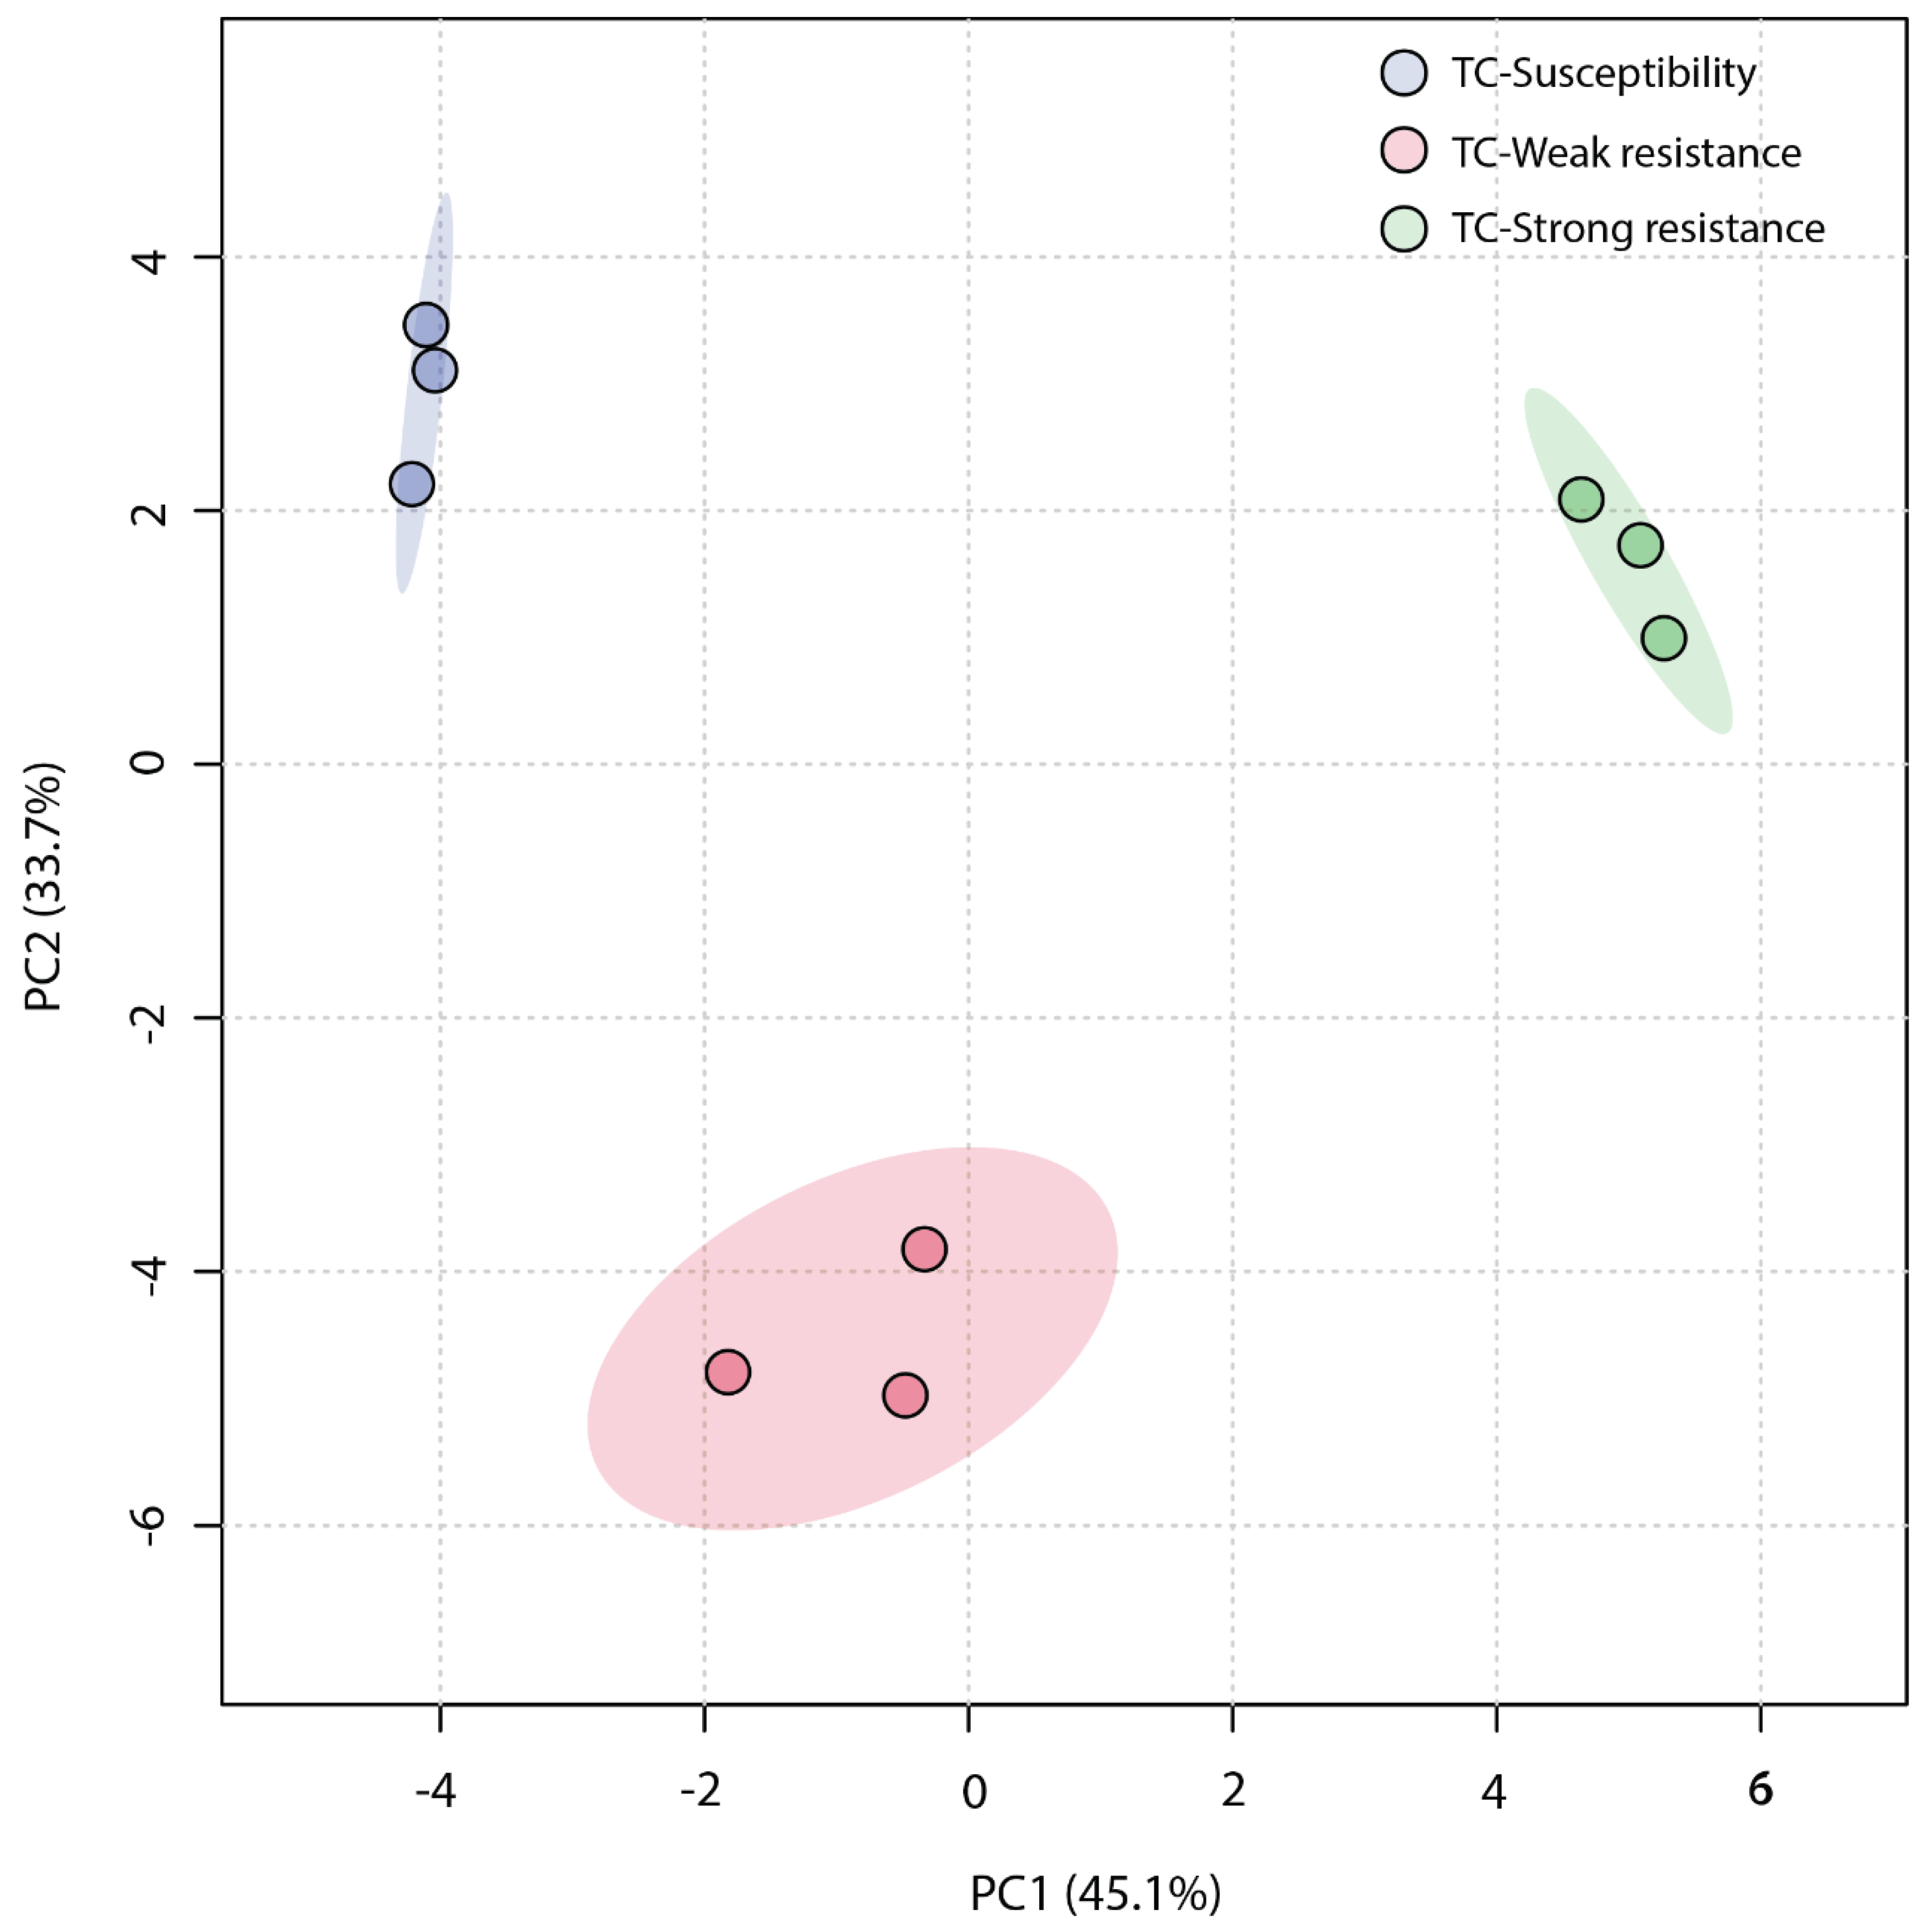
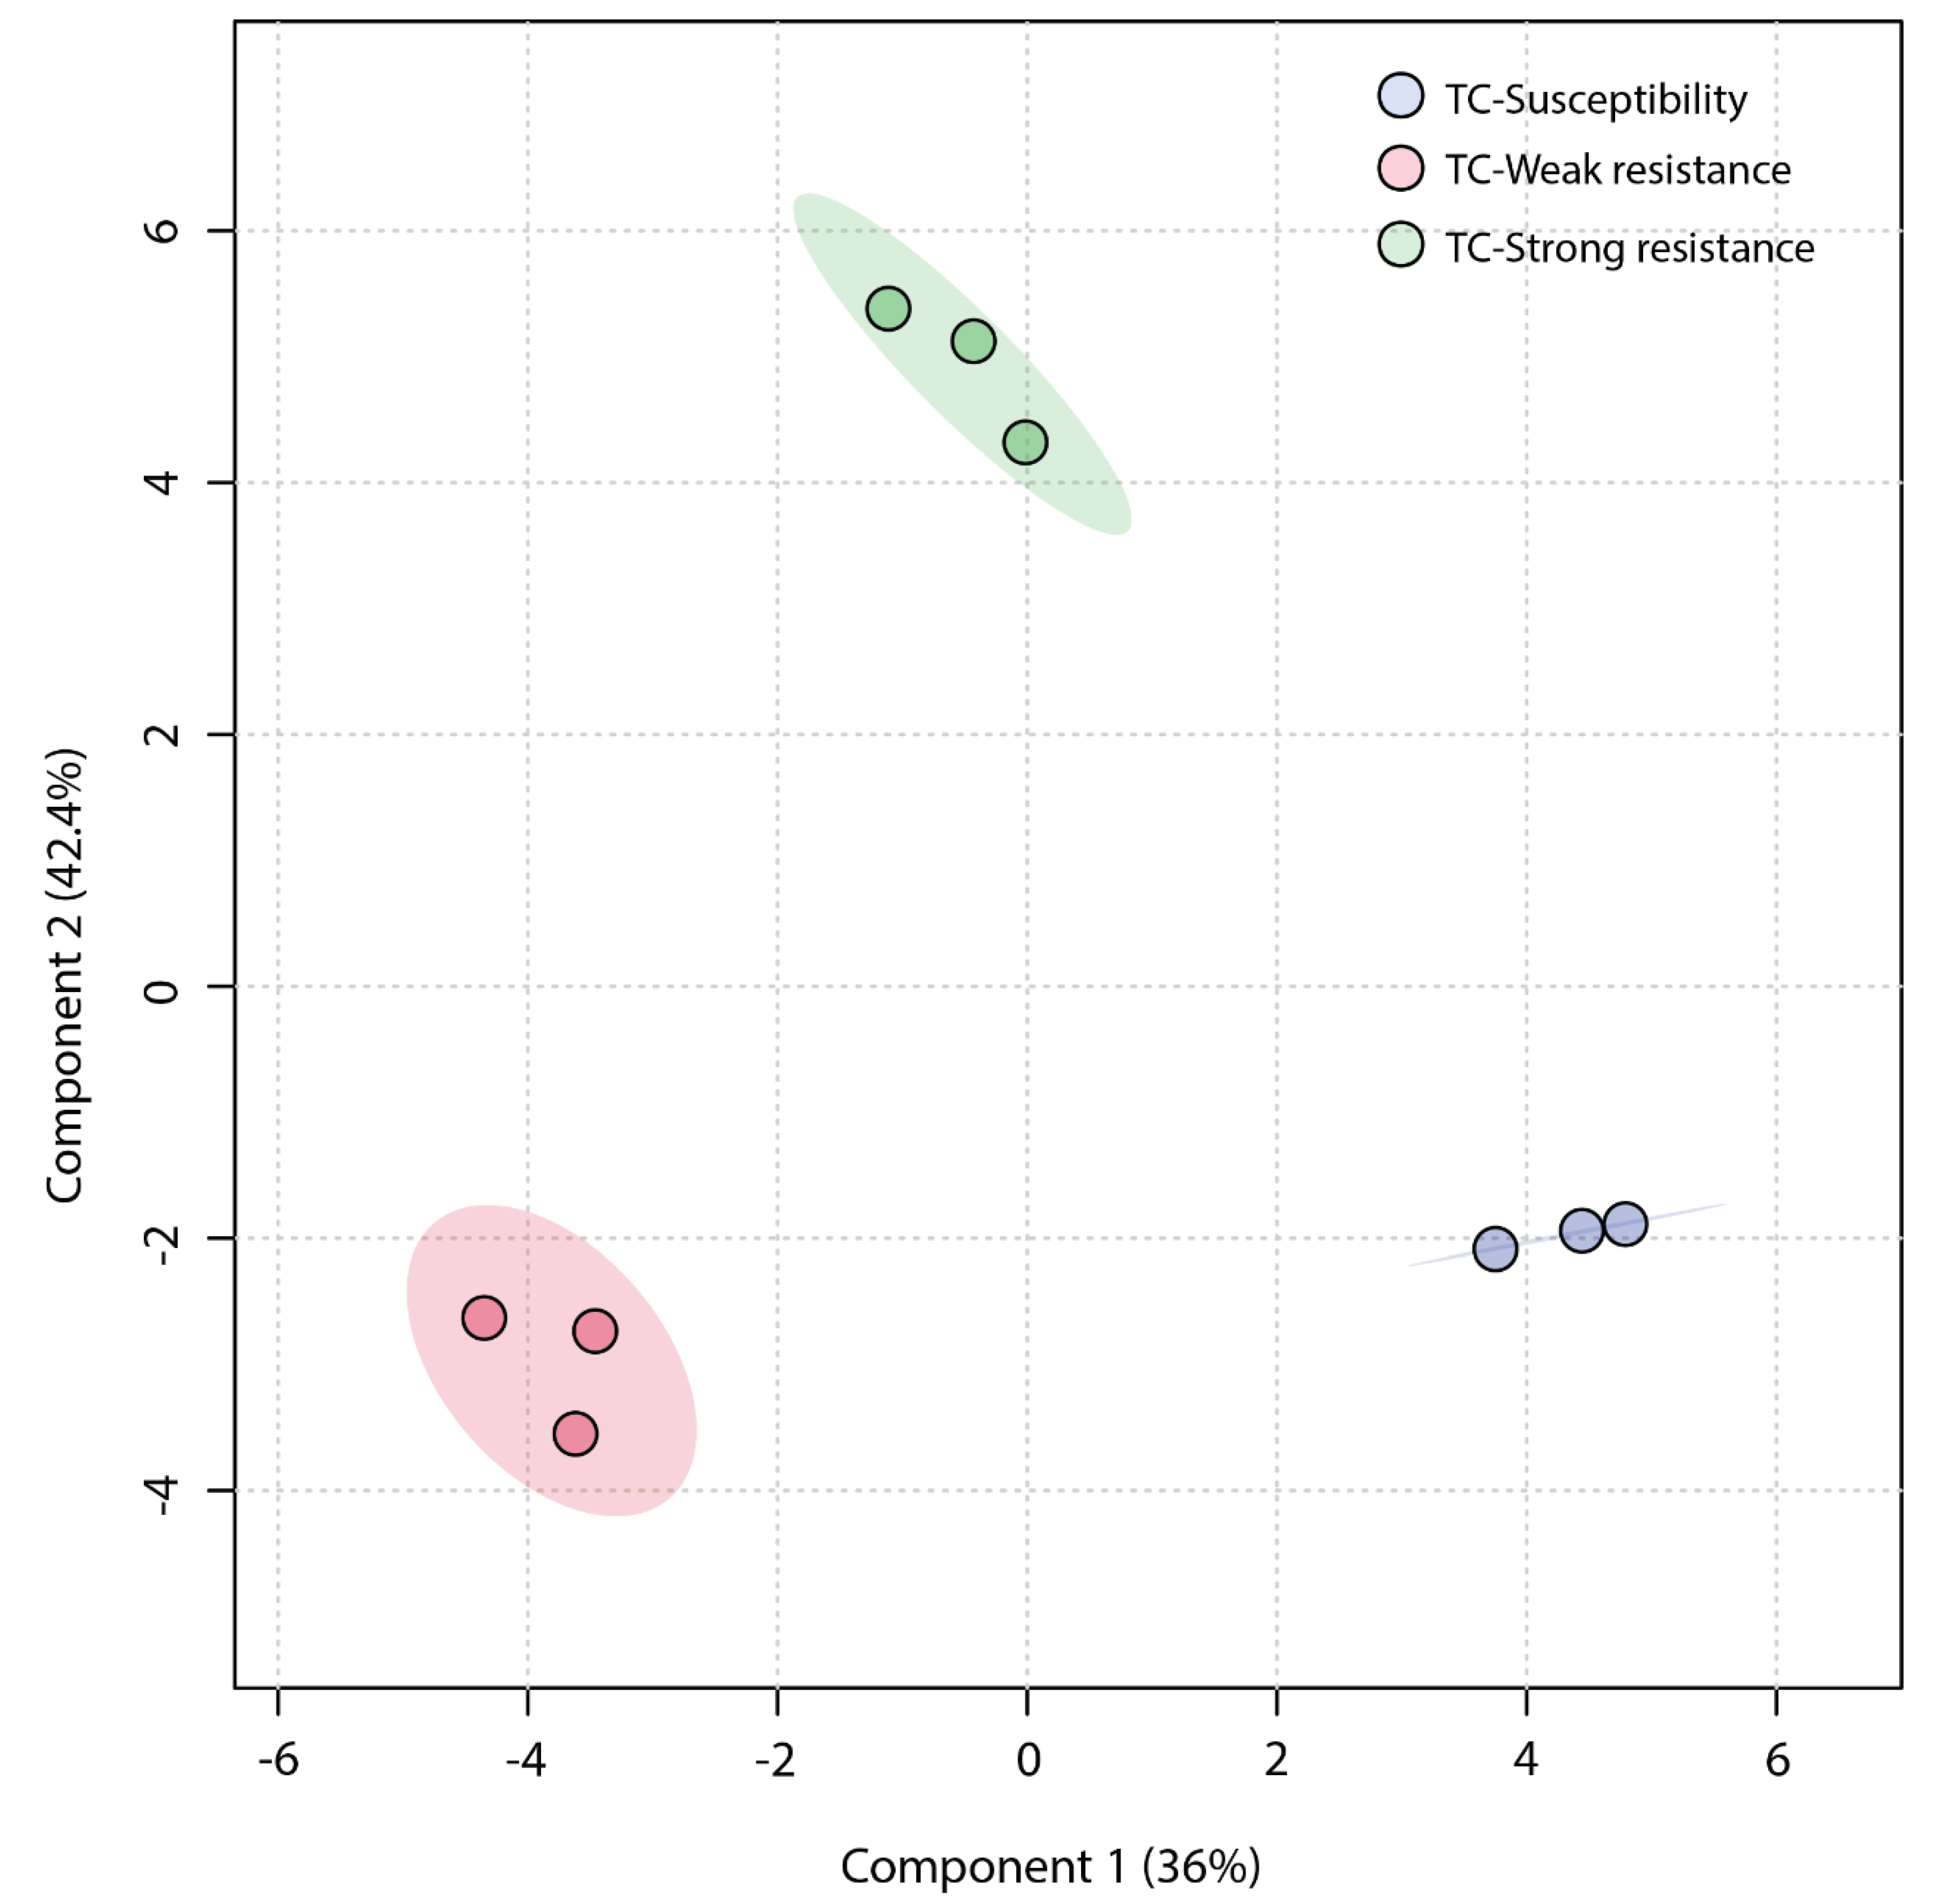
An unsupervised Principal Component Analysis (PCA) was employed to analyze the similarity among the three sample groups. The plot of the PCA scores (Figure 4) revealed that the first principal component (PC1) accounted for a significant proportion (45.1%) of the total variance in the original data, and the second principal component (PC2) explained 33.7%. The TC-W, TC-SR, and TC-S groups were clearly distinguished on the PC1 axis, with no overlap in the 95% confidence interval. On the PC2 axis, both TC-S and TC-SR were distinctly separated from the TC-W group. However, a clear separation between TC-S and TC-SR was not observed on this axis, potentially attributable to less significant inter-group differences. The Partial Least Squares Discriminant Analysis (PLS-DA) model, a supervised method, has greater distinguishing power compared to PCA models. As shown in Figure 5 (the score plot of the PLS-DA model), the inter-group distance of TC-W, TC-SR, and TC-S is larger, more clearly reflecting the differences among the three groups; moreover, the three groups demonstrated better clustering, indicating that PLS-DA successfully minimized the influence of intra-group variability. The above findings suggest that the emergence of PH3 resistance has significantly influenced the metabolic profiles of the T. castaneum adults, and this influence is strongly correlated with the level of resistance. The long-term domestication of PH3 has imposed an adaptive cost on the T. castaneum, and the changes in the content and composition of these metabolites may be the dynamic response to this adaptive cost.
Figure 4.
PCA score plot of metabolic profiles of T. castaneum adults from the TC-S, TC-W, and TC-SR groups.
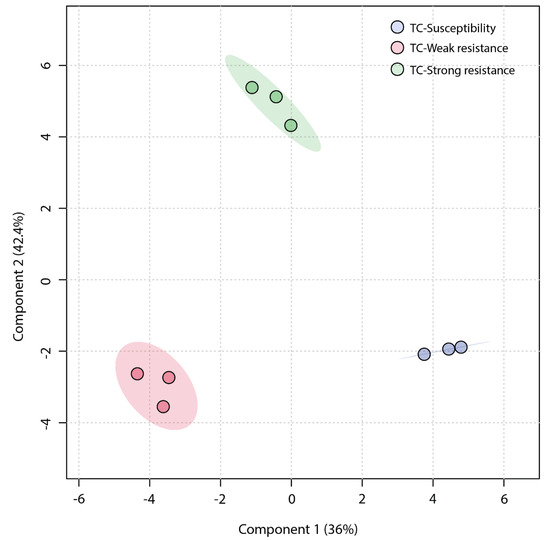
Figure 5.
PLS-DA score plot of metabolic profiles of T. castaneum adults from the TC-S, TC-W, and TC-SR groups.
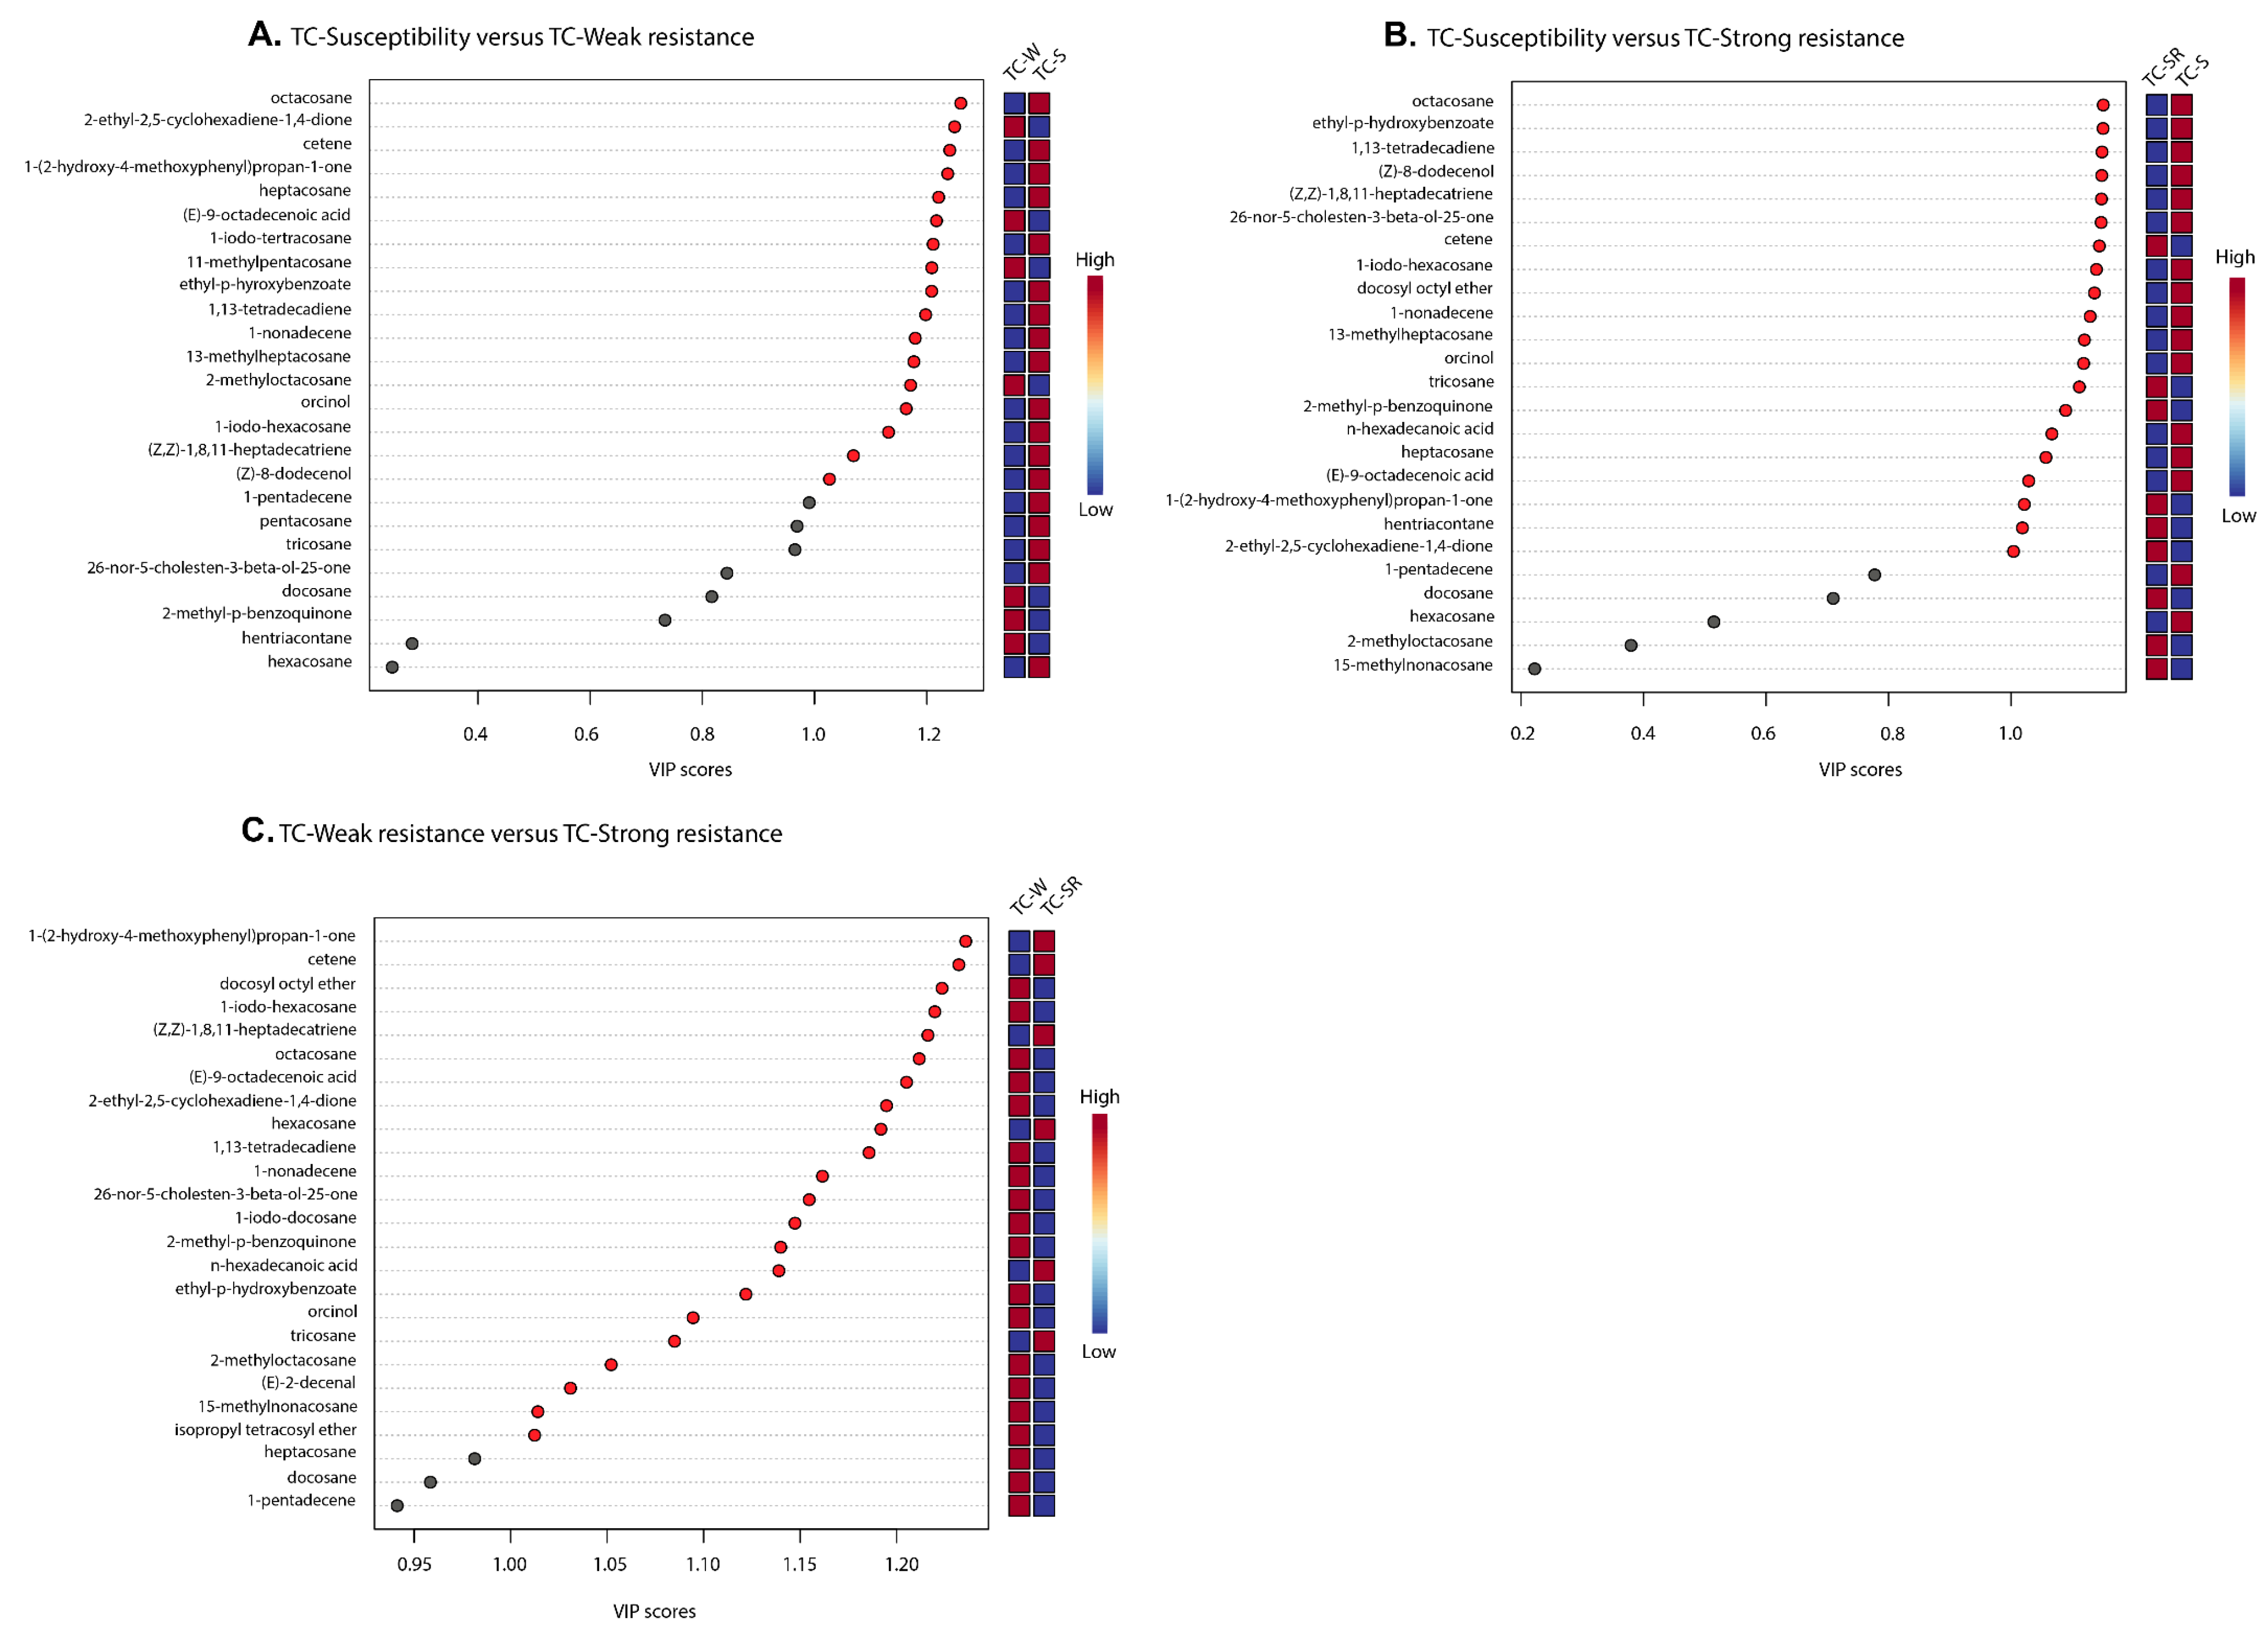
“Differential metabolites” are defined as substances that are identified among different samples but show significant variations in respective concentrations [26]. The Variable Importance in Projection (VIP) value of the PLS-DA model (threshold >1), the p-value of the Student’s t-test (threshold <0.05), and the Fold Change (FC) value (threshold > 0.5) were utilized as criteria to identify differential metabolites between the TC-S, TC-W, and TC-SR groups [27,28]. In the comparisons of TC-S versus TC-M, TC-S versus TC-SR, and TC-M versus TC-SR, a total of 14, 14, and 17 differentially regulated metabolites were identified, respectively (Figure 6A–C). Detailed information regarding the identification of these metabolites is listed in Table 3. It can be seen that there are three, two, and nine key differentially regulated metabolites that have the potential to serve as biomarkers for detecting the PH3 resistance levels of T. castaneum adults.
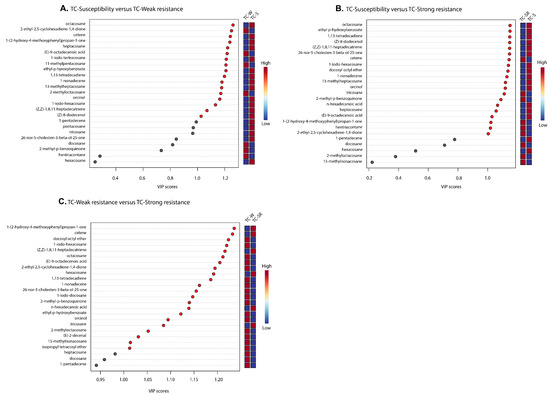
Figure 6.
A variable importance plot showing the contribution of each metabolite to the first component (ranked based on VIP scores). (A) TC-S vs. TC-W, (B) TC-S vs. TC-SR and (C) TC-W vs. TC-SR.
Table 3.
Differential metabolites in TC-S versus TC-W, TC-S versus TC-SR, and TC-W versus TC-SR comparisons (VIP > 1, p < 0.05 and |Log2(FC)| > 0.5).
These differentially regulated metabolites can be primarily categorized into several classes: hydrocarbons, iodo-hydrocarbons, alcohols, acids, and ethers (Figure 7 and Figure 8). Notably, among these three groups of differential metabolites, hydrocarbons constitute the majority, followed by iodo-hydrocarbons. Tricosane, hexacosane, 11-methylheptacosane, 2-methyloctacosane, 1,8,11-heptadecatriene (Z,Z)-, and hentriacontane have been identified as cuticular metabolites in T. castaneum [29], and their concentrations have been found to correlate positively with the level of PH3 resistance in T. castaneum. Research conducted by Alnajim et al. has previously reported that the levels of cuticular hydrocarbons in PH3-resistant strains is much higher than in sensitive strains [17]. This result aligns with the findings of the present study. The correlation may be attributed to the role of cuticular lipid metabolism in the development of insect PH3 resistance, leading to a significant accumulation of hydrocarbons in the cuticle. Consequently, this accumulation results in a pronounced reduction in the permeability of the insect cuticle, thereby enhancing resistance to PH3 in the insect [29]. Iodo-hydrocarbon compounds—e.g., (Z)-8-dodecenoland 26-nor-5-cholesten-3-beta-ol-25-one—are substances typically related to the synthesis of insect sex pheromones. In this study, a reduction in the RA of five distinct compounds—(Z)-8-dodecenol; 26-nor-5-cholesten-3-beta-ol-25-one; 1-iodo-tetracosane; 1-iodo-hexacosane and 1-iodo-docosane—was observed. This decrease may be linked to the potential fitness cost associated with enhanced PH3 resistance, resulting in the inhibition of sex pheromone production [30,31,32]. This finding strongly supports the results of a study conducted by Ridley et al. in which the reproductive capability of highly resistant T. castaneum was demonstrated to be significantly diminished in comparison to sensitive strains [33]. Fatty acids function as vital “fuel molecules” within biological organisms, facilitating ATP synthesis and enabling energy storage through esterification reactions. N-hexadecanoic acid is among the most prevalent fatty acids in organisms [34]. It plays a crucial role as an energy source in lipid metabolism and acts as a significant signaling molecule for assessing lipid content [35]. According to research by Schlipalius et al., the genes rph1 and rph2 can enhance PH3 toxicity by promoting lipid peroxidation and inflicting damage to fatty acids present on biological membranes [36]. Conversely, in PH3-resistant insects with rph1 or rph2 alleles, the sensitivity of the biological membrane to reactive oxygen species (ROS) is reduced, leading to a decrease in the consumption of fatty acids [29,37]. This finding further confirms the results of this study, suggesting that n-hexadecanoic acid can be employed as a biomarker to detect the resistance levels of T. castaneum to PH3. The content of the ether compound isopropyl tetracosyl ether exhibited significant variation but did not show a correlation with the PH3 resistance level in T. castaneum. This absence of correlation might be attributed to the individual differences among the test insects or the technique employed in metabolite extraction (DI-SPME). Recently, this type of substance has been detected by some researchers in studies exploring the impact of PH3 resistance on insect metabolic profiles, but detailed explanations have not been provided [17]. Consequently, the role of ether metabolites in insect PH3 resistance remains a ‘black box’, representing an intriguing direction for our subsequent research.
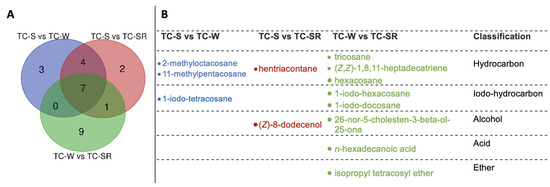
Figure 7.
The amount (A) and chemical names (B) of specific differentially regulated metabolites of T. castaneum (Herbst) adults of TC-S versus TC-W, TC-S versus TC-SR, and TC-W versus TC-SR.
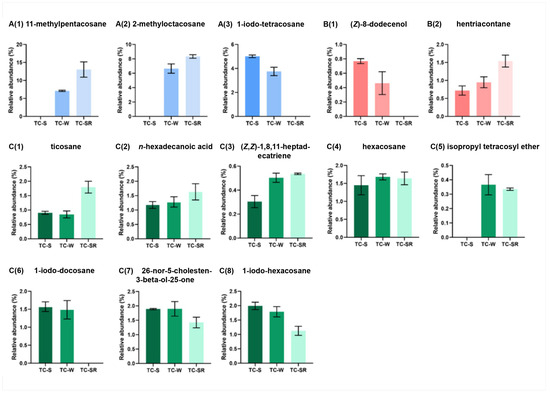
Figure 8.
Specific differentially regulated metabolites RA from TC-S, TC-W and TC-SR groups of T. castaneum adults. A(1) 11-methylpentacosane, A(2) 2-methyl-octacosane, A(3) 1-iodo-tetracosane in TC-S vs. TC-W group; B(1) (Z)-8-dodecenol, B(2) hentriacontane in TC-S vs. TC-SR group; C(1) ticosane, C(2) n-hexadecanoic acid, C(3) (Z,Z)-1,8,11-heptadecatriene, C(4) hexacosane, C(5) isopropyl tetracosyl ether, C(6) 1-iodo-docosane, C(7) 26-nor-5-cholesten-3-beta-ol-25-one, C(8) 1-iodo-hexacosane in TC-W vs. TC-SR group.
3. Materials and Methods
3.1. The Insect Culture
The Chinese Academy of Inspection and Quarantine (CAIQ) provided both susceptible and resistant T. castaneum adults (TC-S, TC-W, and TC-SR), which were initially collected from Wuhan (WH) in Hubei Province, Qihe (QH) in Shandong Province, and Zibo (ZB) in Shandong Province. To rear narrow-aged insects, a cohort of 1000 adult insects was incubated with 300 g of food consisting of wheat flour and yeast in a 9:1 ratio in a 4 L glass jar sealed with a meshed lid. After a 3-day spawning period, the adult insects were removed, and the remaining cultural medium containing eggs was incubated at 25 ± 2 °C and 65 ± 5% relative humidity. Emerging narrow-aged adults were subsequently transferred to a new jar with food to keep them at the same developmental stage. The insects utilized in the experiments were approximately one month old.
3.2. Fumigation Bioassay
The PH3 gas was generated from 56% aluminum phosphide tablets that had been immersed in a 5% aqueous solution of sulfuric acid. The concentration of this source gas was analyzed using a gas chromatograph (GC6890, Agilent Technology Co. Ltd., Santa Clara, CA, USA) equipped with a flame photometric detector (GC-FPD), with separation occurring in an Agilent J&W GS-GasPro column.
Fumigation bioassays with PH3 were conducted on T. castaneum adults inside 6-L desiccators, serving as fumigation chambers, at a controlled temperature of 25 ± 2 °C and 60 ± 5% RH. Plastic jars (40 mm inner diameter × 60 mm height) were utilized as containers for the test insects. Each chamber was assigned three jars, with each jar containing 30 T. castaneum adults. PH3 concentrations were selected within the ranges of 0.01–0.1 mg/L, 0.2–2.0 mg/L, and 1.0–10.0 mg/L for the TC-S, TC-W, and TC-SR strains, respectively, with approximately 5 to 8 concentrations chosen for each. Following a 20 h fumigation period, the desiccators were aerated for 2 h, after which the treated insects were removed and maintained at 25 ± 2 °C and 60 ± 5% RH. Mortality was assessed 72 h after fumigation.
3.3. Sample Preparation and Extraction Using DI-SPME
Before the extraction process, all insects used in this study were subjected to a cleaning process to ensure that their bodies were without feed residues. They were first placed on wet tissue and allowed to walk for 10 min, then transferred to dry tissue for an additional 10 min. For sample preparation, the insects were transferred into a 2 mL BeadBug™ microtube containing 1.6 mL of HPLC-grade acetonitrile (≥99.9%, Xilong Chemical Co. Ltd., Guangzhou, China) and 0.5 mm Silica glass beads and were homogenized at 4000 rpm for 1 min using a Beadbug homogenizer. Subsequently, the samples were centrifuged at 25 °C and 25,000× g for 3 min using a centrifuge (5417R, Eppendorf, Hamburg, Germany). The supernatant (1.3 mL) was transferred to a brown chromatography vial (Supelco, Darmstadt, Germany) with septa. The SPME fiber with a 50/30 µm Carboxen/DVB/PDMS coating (Sigma-Aldrich, Bellefonte, PA, USA) was inserted into the samples for extraction and conditioned for 1 h at 25 ± 1 °C. Then, GC-MS analysis was performed on the DI-SPME with a desorption time of 15 min. The samples were analyzed in biological triplicates.
3.4. Gas Chromatography-Mass Spectrometry (GC-MS) Conditions
The analysis was conducted using an Agilent 8890 GC (Agilent Technology Co. Ltd., Santa Clara, CA, USA), equipped with an HP-5MS capillary column (30 m × 0.25 mm, 0.25 μm; Agilent J&W Scientific) and coupled with an Agilent 5977B mass-selective detector (MSD, Agilent Technology Co. Ltd., Santa Clara, CA, USA). The carrier gas used was 99.999% purified helium, which was used at a constant flow rate of 1 mL/min. The injector temperature of the GC-MS was maintained at 270 °C. The initial temperature of the oven was set to 60 °C for 2 min; the temperature was then increased at 7 °C/min to 200 °C, 5 °C/min to 300 °C, and finally increased to 320 °C at 50 °C/min and maintained for 3 min. The ion source temperature was 230 °C, and the MSD transfer line temperature was 280 °C. Electron impact ionization (70 eV) was carried out at full-scan mode, ranging from 30 to 550 atomic mass units (amu), with a solvent delay time of 5 min. The total running time was 50.4 min.
3.5. Statistical Analyses
The GC-MS raw data were initially processed using Agilent MassHunter Qualitative Analysis Software (Version 10.0). Compounds were identified via comparison with the National Institute of Standards and Technology (NIST) and Wiley Registry ® of Mass Spectral Data. The identification of these compounds was further supported by the retention index provided by the NIST Chemical Web Book, along with Kovat’s retention index.
Within the R software platform, the XCMS package was utilized to extract and pre-process the characteristic data from GC-MS. The edited data matrix was then imported into SIMCA software (Version 14.0) for multivariate statistical analyses, including Principal Component Analysis (PCA) and Partial Least Squares Discriminant Analysis (PLS-DA). To assess the statistical significance between groups, a one-way Analysis of Variance (ANOVA), followed by the Fisher’s least significant difference (LSD) test, was employed, and all analyses were conducted using SPSS Statistic 26.0. Additionally, unless otherwise specified, the significance level for evaluating differences was set at 0.05.
4. Conclusions
In this investigation, the DI-SPME technique was utilized to isolate volatile organic compounds from acetonitrile extracts of T. castaneum with three different levels of PH3 resistance. Our subsequent analysis carried out by employing GC-MS revealed differences in the metabolic profiles across these different PH3 resistance levels, with a number of differentially regulated metabolites showing trends correlated with PH3 resistance. These variations could be principally attributed to changes in the hydrocarbons and iodo-hydrocarbons within the PH3-resistant insects. Moreover, this study demonstrated that DI-SPME-GCMS is an efficient detection method that has the potential to distinguish insects at different PH3 resistance levels, allowing for the distinction of different PH3-resistant strains based on their unique chemical signatures. Overall, these insights improve our understanding of the underlying mechanisms of insect PH3 resistance from a metabolites standpoint and could form the basis for the development of innovative diagnostic methods for insect PH3 resistance analysis.
Supplementary Materials
The following supporting information can be downloaded at: https://www.mdpi.com/article/10.3390/molecules28237721/s1, Figure S1: The chromatogram of each group.
Author Contributions
Conceptualization, C.S. and T.L.; methodology, C.S. and L.L.; software, C.S.; validation, C.S. and Q.L.; formal analysis, C.S.; investigation, C.S.; resources, C.S., L.L. and B.L.; data curation, L.L. and B.L.; writing—original draft preparation, C.S.; writing—review and editing, L.L., B.L, Q.L. and T.L.; visualization, C.S.; supervision, T.L.; project administration, T.L.; funding acquisition, B.L. All authors have read and agreed to the published version of the manuscript.
Funding
This work was funded by the Beijing Municipal Natural Science Foundation (NO. 6212032) and the technical support fund on postharvest control of biological contaminants of State Administration for Market Regulation (No. 2024).
Institutional Review Board Statement
The study was conducted according to the guidelines of the Declaration of Helsinki and was approved by Chinese Academy of Inspection and Quarantine (Approval Code: 2023S001, and Approval Date: 16 August 2023).
Informed Consent Statement
Not applicable.
Data Availability Statement
All data are contained within the article.
Conflicts of Interest
The authors declare no conflict of interest.
References
- Atta, B.; Rizwan, M.; Sabir, A.M.; Gogi, M.D.; Ali, K. Damage potential of Tribolium castaneum (Herbst)(Coleoptera: Tenebrionidae) on wheat grains stored in hermetic and non-hermetic storage bags. Int. J. Trop. Insect Sci. 2020, 40, 27–37. [Google Scholar] [CrossRef]
- Cook, S.A. Evaluation of Sealed Storage Silos for Grain Fumigation. Doctoral Dissertation, Kansas State University, Manhattan, KS, USA, 2016. [Google Scholar]
- Kim, K.; Yang, J.O.; Sung, J.Y.; Lee, J.Y.; Park, J.S.; Lee, H.S.; Lee, S.E. Minimization of energy transduction confers resistance to phosphine in the rice weevil. Sitophilus oryzae. Sci. Rep. 2019, 9, 14605. [Google Scholar] [PubMed]
- Jagadeesan, R.; Singarayan, V.T.; Nayak, M.K. A co-fumigation strategy utilizing reduced rates of phosphine (PH3) and sulfuryl fluoride (SF) to control strongly resistant rusty grain beetle, Cryptolestes ferrugineus (Stephens)(Coleoptera: Laemophloeidae). Pest Manag. Sci. 2021, 77, 4009–4015. [Google Scholar] [CrossRef] [PubMed]
- Daglish, G.J.; Nayak, M.K.; Arthur, F.H.; Athanassiou, C.G. Insect pest management in stored grain. In Recent Advances in Stored Product Protection; Springer: Berlin/Heidelberg, Germany, 2018; pp. 45–63. [Google Scholar]
- Rajendran, S. Insect pest management in stored products. Outlooks Pest Manag. 2020, 31, 24–35. [Google Scholar] [CrossRef]
- FAO. Recommended methods for the detection and measurement of resistance of agricultural pests to pesticides. Tentative method for adults of some major species of stored cereals with methyl bromide and phosphine—FAO Method No 16. In FAO Plant Protection Bulletin; FAO: Rome, Italy, 1975; Volume 23, pp. 12–25. [Google Scholar]
- Cao, Y.; Wang, D. Relationship between phosphine resistance and narcotic knockdown in Tribolium castaneum (Herbst), Sitophilus oryzae (L.), and S. zeamais (Motsch). In Proceedings of the Conference Controlled Atmosphere and Fumigation in Stored-products, Fresno, CA, USA, 29 October–3 November 2000. [Google Scholar]
- Afful, E.; Cato, A.; Nayak, M.K.; Phillips, T.W. A rapid assay for the detection of resistance to phosphine in the lesser grain borer, Rhyzopertha dominica (F.)(Coleoptera: Bostrichidae). J. Stored Prod. Res. 2021, 91, 101776. [Google Scholar] [CrossRef]
- Chen, Z.; Schlipalius, D.; Opit, G.; Subramanyam, B.; Phillips, T.W. Diagnostic molecular markers for phosphine resistance in US populations of Tribolium castaneum and Rhyzopertha dominica. PLoS ONE 2015, 10, e0121343. [Google Scholar]
- Schlipalius, D.I.; Valmas, N.; Tuck, A.G.; Jagadeesan, R.; Ma, L.; Kaur, R.; Ebert, P.R. A core metabolic enzyme mediates resistance to phosphine gas. Science 2012, 338, 807–810. [Google Scholar] [CrossRef] [PubMed]
- Nath, N.S.; Bhattacharya, I.; Tuck, A.G.; Schlipalius, D.I.; Ebert, P.R. Mechanisms of phosphine toxicity. J. Toxicol. 2011, 2011, 494168. [Google Scholar] [CrossRef]
- Schlipalius, D.I.; Tuck, A.G.; Jagadeesan, R.; Nguyen, T.; Kaur, R.; Subramanian, S.; Ebert, P.R. Variant linkage analysis using de novo transcriptome sequencing identifies a conserved phosphine resistance gene in insects. Genetics 2018, 209, 281–290. [Google Scholar] [CrossRef]
- Du, X. The Physiochemical Responses of Stored Grain Insect Pests to Synthetic Amorphous Silica (SAS) Powders. Doctoral Dissertation, Murdoch University, Murdoch, Australia, 2021. [Google Scholar]
- Kim, D.; Kim, K.; Lee, Y.H.; Lee, S.E. Transcriptome and Micro–CT analysis unravels the cuticle modification in phosphine-resistant stored grain insect pest, Tribolium castaneum (Herbst). Chem. Biol. Technol. Agric. 2023, 10, 88. [Google Scholar] [CrossRef]
- Alnajim, I.; Du, X.; Lee, B.; Agarwal, M.; Liu, T.; Ren, Y. New method of analysis of lipids in Tribolium castaneum (Herbst) and Rhyzopertha dominica (Fabricius) insects by direct immersion solid-phase microextraction (DI-SPME) coupled with GC–MS. Insects 2019, 10, 363. [Google Scholar] [CrossRef] [PubMed]
- Alnajim, I.; Agarwal, M.; Liu, T.; Li, B.; Du, X.; Ren, Y. Preliminary study on the differences in hydrocarbons between phosphine-susceptible and-resistant strains of Rhyzopertha dominica (Fabricius) and Tribolium castaneum (Herbst) using direct immersion solid-phase microextraction coupled with GC-MS. Molecules 2020, 25, 1565. [Google Scholar] [CrossRef] [PubMed]
- Alnajim, I.; Agarwal, M.; Liu, T.; Ren, Y. A novel method for the analysis of Volatile Organic Compounds (VOCs) from red flour beetle Tribolium castaneum (H.) using Headspace-SPME Technology. Curr. Anal. Chem. 2020, 16, 404–412. [Google Scholar] [CrossRef]
- Shan, C.; Li, B.; Li, L.; Li, B.; Ren, Y.; Liu, T. Correlation between irradiation treatment and metabolite changes in Bactrocera dorsalis (Diptera: Tephritidae) Larvae using solid-phase microextraction (SPME) coupled with gas chromatography-mass spectrometry (GC-MS). Molecules 2022, 27, 4641. [Google Scholar] [CrossRef] [PubMed]
- Renou, M.; Guerrero, A. Insect parapheromones in olfaction research and semiochemical-based pest control strategies. Ann. Rev. Entomol. 2000, 45, 605–630. [Google Scholar] [CrossRef] [PubMed]
- Witzgall, P.; Kirsch, P.; Cork, A. Sex pheromones and their impact on pest management. J. Chem. Ecol. 2010, 36, 80–100. [Google Scholar] [CrossRef]
- Al-Khshemawee, H.; Du, X.; Agarwal, M.; Yang, J.O.; Ren, Y.L. Application of direct immersion Solid-Phase Microextraction (DI-SPME) for understanding biological changes of Mediterranean fruit fly (Ceratitis capitata) during mating procedures. Molecules 2018, 23, 2951. [Google Scholar] [CrossRef]
- Opit, G.P.; Phillips, T.W.; Aikins, M.J.; Hasan, M.M. Phosphine resistance in Tribolium castaneum and Rhyzopertha dominica from stored wheat in Oklahoma. J. Econ. Entomol. 2012, 105, 1107–1114. [Google Scholar] [CrossRef]
- Villaverde, M.L.; Juárez, M.P.; Mijailovsky, S. Detection of Tribolium castaneum (Herbst) volatile defensive secretions by solid phase microextraction–capillary gas chromatography (SPME-CGC). J. Stored Prod. Res. 2007, 43, 540–545. [Google Scholar] [CrossRef]
- Tian, X.; Hao, J.; Wu, F.; Hu, H.; Zhou, G.; Liu, X.; Zhang, T. 1-Pentadecene, a volatile biomarker for the detection of Tribolium castaneum (Herbst)(Coleoptera: Tenebrionidae) infested brown rice under different temperatures. J. Stored Prod. Res. 2022, 97, 101981. [Google Scholar] [CrossRef]
- Wang, C.; Feng, Y.; Zhang, S.; Fu, T.; Sheng, Y.; Zhang, Y.; Zhang, D. Effects of storage on brown rice (Oryza sativa L.) metabolites, analyzed using gas chromatography and mass spectrometry. Food Sci. Nutr. 2020, 8, 2882–2894. [Google Scholar]
- Mon, K.K.; Zhu, Y.; Chanthavixay, G.; Kern, C.; Zhou, H. Integrative analysis of gut microbiome and metabolites revealed novel mechanisms of intestinal Salmonella carriage in chicken. Sci. Rep. 2020, 10, 4809. [Google Scholar] [CrossRef] [PubMed]
- Yin, W.M.; Xu, X.; He, Y.; Wei, G.B.; Sima, Y.H.; Shi, Q.X. Metabonomic analysis of Bombyx mori (Heterocera: Bombysidae) treated with acetaminophen. J. Insect Sci. 2014, 14, 225. [Google Scholar] [CrossRef] [PubMed]
- Nawrot, J.; Malinski, E.; Szafranek, J. Function and Composition of Cuticular Hydrocarbons of Stored-Product Insects. In Proceedings of the 6th International Working Conference on Stored-Product Protection, Canberra, Australia, 17–23 April 1994; CAB International: Wallingford, UK, 1994. [Google Scholar]
- Alnajim, I.; Aldosary, N.; Agarwal, M.; Liu, T.; Du, X.; Ren, Y. Role of lipids in phosphine resistant stored-grain insect pests Tribolium castaneum and Rhyzopertha dominica. Insects 2022, 13, 798. [Google Scholar] [CrossRef] [PubMed]
- Malekpour, R.; Rafter, M.A.; Daglish, G.J.; Walter, G.H. The movement abilities and resource location behaviour of Tribolium castaneum: Phosphine resistance and its genetic influences. J. Pest Sci. 2018, 91, 739–749. [Google Scholar] [CrossRef]
- Sakka, M.K.; Romano, D.; Stefanini, C.; Canale, A.; Benelli, G.; Athanassiou, C.G. Mobility parameters of Tribolium castaneum and Rhyzopertha dominica populations with different susceptibility to phosphine. J. Stored Prod. Res. 2020, 87, 101593. [Google Scholar] [CrossRef]
- Ridley, A.W.; Magabe, S.; Schlipalius, D.I.; Rafter, M.A.; Collins, P.J. Sublethal Exposure to Phosphine Decreases Offspring Production in Strongly. PLoS ONE 2012, 7, e53356. [Google Scholar] [CrossRef] [PubMed]
- Zhang, S.; Liu, L.; Steffen, D.; Ye, T.; Raftery, D. Metabolic profiling of gender: Headspace-SPME/GC–MS and 1-HNMR analysis of urine. Metabolomics 2012, 8, 323–334. [Google Scholar] [CrossRef]
- Pathak, R.; Kumari, A.; Mohsin, M.; Bisht, G.; Bala, M. Phytochemical assessment and in vitro antioxidant potential of Camelina sativa L. seed cake. Asian J. Res. Chem. 2020, 13, 38–43. [Google Scholar] [CrossRef]
- Jagadeesan, R.; Collins, P.J.; Daglish, G.J.; Ebert, P.R.; Schlipalius, D.I. Phosphine resistance in the rust red flour beetle, Tribolium castaneum (Coleoptera: Tenebrionidae): Inheritance, gene interactions and fitness costs. PLoS ONE 2012, 7, e31582. [Google Scholar] [CrossRef]
- Nayak, M.K.; Daglish, G.J.; Phillips, T.W.; Ebert, P.R. Resistance to the fumigant phosphine and its management in insect pests of stored products: A global perspective. Annu. Rev. Entomol. 2020, 65, 333–350. [Google Scholar] [CrossRef] [PubMed]


Disclaimer/Publisher’s Note: The statements, opinions and data contained in all publications are solely those of the individual author(s) and contributor(s) and not of MDPI and/or the editor(s). MDPI and/or the editor(s) disclaim responsibility for any injury to people or property resulting from any ideas, methods, instructions or products referred to in the content. |
© 2023 by the authors. Licensee MDPI, Basel, Switzerland. This article is an open access article distributed under the terms and conditions of the Creative Commons Attribution (CC BY) license (https://creativecommons.org/licenses/by/4.0/).