Article

A Fluorescence Resonance Energy Transfer Aptasensor for Aflatoxin B1 Based on Ligand-Induced ssDNA Displacement

by
Kseniya V. Serebrennikova
,
Alexey V. Samokhvalov
,
Anatoly V. Zherdev
and
Boris B. Dzantiev
*
A.N. Bach Institute of Biochemistry, Research Center of Biotechnology of the Russian Academy of Sciences, Leninsky Prospect 33, Moscow 119071, Russia
*
Author to whom correspondence should be addressed.
Molecules 2023, 28(23), 7889; https://doi.org/10.3390/molecules28237889
Submission received: 25 October 2023 / Revised: 27 November 2023 / Accepted: 29 November 2023 / Published: 1 December 2023
(This article belongs to the Special Issue Biosensors for Molecules Detection)

Abstract

:
In this study, a fluorescence resonance energy transfer (FRET)-based aptasensor for the detection of aflatoxin B1 (AFB1) was designed using a carboxyfluorescein (FAM)-labeled aptamer and short complementary DNA (cDNA) labeled with low molecular quencher RTQ1. The sensing principle was based on the detection of restored FAM-aptamer fluorescence due to the ligand-induced displacement of cDNA in the presence of AFB1, leading to the destruction of the aptamer/cDNA duplex and preventing the convergence of FAM and RTQ1 at the effective FRET distance. Under optimal sensing conditions, a linear correlation was obtained between the fluorescence intensity of the FAM-aptamer and the AFB1 concentration in the range of 2.5–208.3 ng/mL with the detection limit of the assay equal to 0.2 ng/mL. The assay time was 30 min. The proposed FRET aptasensor has been successfully validated by analyzing white wine and corn flour samples, with recovery ranging from 76.7% to 91.9% and 84.0% to 86.5%, respectively. This work demonstrates the possibilities of labeled cDNA as an effective and easily accessible tool for sensitive AFB1 detection. The homogeneous FRET aptasensor is an appropriate choice for contaminant screening in complex matrices.

Graphical Abstract

1. Introduction

Infection of agricultural crops with molds before/after harvest, including those caused by improper storage, is a serious threat to the health of consumers [1]. The subsequent processing of raw materials, despite destroying the cells themselves, is not always able to remove the compounds they secrete in the process of life. In particular, a number of mold toxins (mycotoxins) are resistant to treatment [2,3]. The most widespread and persistent toxins are listed as substances controlled in food at the legislative level [4,5]. These toxins include a group of aflatoxins, the most important member of which is aflatoxin B1 (AFB1) [6,7]. The International Agency for Research on Cancer has also classified it as a class 1 carcinogen [8]. Agricultural products, such as maize, corn, nuts, etc., are most susceptible to AFB1 contamination. In this regard, the European Commission has set maximum residue limits for AFB1 in cereals and grain-containing products at 2 µg/kg [4]. The problem of food contamination with AFB1 is of significant economic importance due to the serious threat to human and livestock health, as well as the marketing of agricultural products. The improvement of existing analytical systems and the search for new cost-effective and highly sensitive ones is the task of paramount importance in solving this problem.
Currently, common methods used for AFB1 detection are liquid chromatography–mass spectrometry [9] and gas chromatography–tandem mass spectrometry (GC-MS) [10]; enzyme-linked immunosorbent assay (ELISA) [11] and immunochromatographic assay [12]. Each of these methods has its pros and cons. Chromatographic methods provide high accuracy and repeatability but are usually time-consuming and expensive due to their complex pretreatment processes, making them difficult to use for the high-throughput screening of a large number of samples. Although ELISA and immunochromatography are more user-friendly methods, they require multiple steps of time-consuming immobilization of reagents. The use of conventional antibodies provides good sensitivity and selectivity but is associated with problems of denaturation, batch-to-batch variability, and issues concerning chemical modification. Therefore, there is a need for a reliable, rapid and inexpensive method for the quantitative detection of AFB1.
In this regard, homogeneous fluorescent methods open up new possibilities due to their simplicity, speed, and sensitivity [13,14,15,16]. For example, fluorescence polarization/anisotropy-based immunoassays have been successfully used to detect AFB1 [17,18,19]. Moreover, homogeneous fluorescent assays can be easily implemented using the fluorescence resonance energy transfer (FRET) process, involving intermolecular non-radiative energy transfer between donor–acceptor pairs [20,21]. FRET-based assays provide real-time registration of an analytical signal and implement homogeneous interactions in solution without the need for immobilization of reagents, which greatly simplifies the testing.
Although antibodies dominate as recognition compounds in analytical systems, alternative receptors, in particular aptamers, are actively considered. Aptamers are single-stranded oligonucleotide receptor molecules that provide a number of advantages for biosensors due to their simple structure, low cost, efficient renaturation, the possibility of chemical synthesis, and the predictability of modification [22].
Like any oligonucleotides, aptamers are able to form duplexes with complementary strands. The possibility of displacement of a complementary chain in the presence of a ligand has been demonstrated. This phenomenon is called ligand-induced strand displacement. Tuning the length and localization of the complementary chain opens up opportunities for adjusting the sensitivity of the analysis [23,24].
Several sequences specific to AFB1 have been published [25,26,27]. Among them, the sequence with the repeating motif 5′-CGTGTTGTCTCTCTGTGTCTCG-3′ exhibits the highest affinity [27,28], which provides dissociation constants in the range from 10−8 to 10−7 M.
To date, several FRET aptasensors for the detection of AFB1 have been proposed using various aptamer/complementary DNA duplexes and donor–acceptor pairs. In these sensors, donor–acceptor pairs based on nanoparticles have been applied, including fluorescent polymer dots–Ag nanoparticles [29], CdZnTe quantum dots–Au nanoparticles [30], and ZnS quantum dots–Ag nanoparticles [25]. In addition, donor–acceptor pairs based on organic compounds, namely fluorescein–BHQ-1 [31], fluorescein–DABCYL [32], as well as binary systems of Cy5-BHQ-2 and Cy3-Cy5 fluorophores [33], have been implemented. More complex systems using a pair of FAM/BHQ-1 labeled ssDNA with non-overlapping complementary sites on the aptamer [34] or a Cy5-BHQ-2/Cy3-BHQ-2 pair [35] have also been characterized.
In this work, we reported an alternative FRET assay based on ligand-induced strand displacement for AFB1 detection using the low-molecular organic label RTQ-1 as an energy acceptor for carboxyfluorescein (FAM). The subject of development is a fluorescent molecular sensor representing molecular fluorescent probes (donor–acceptor pair) in solution, which, under the influence of the target analyte, generates a fluorescence signal as a result of preventing the FRET process. The sensing principle was based on the transition of complementary ssDNA labeled with RTQ-1 (RTQ1-cDNA) between bound and unbound states in the presence of AFB1. The transition was accompanied by the restoration of fluorescence of the FAM-labeled aptamer (FAM-Apt) under conditions when the distance for unbound RTQ1-cDNA exceeded the minimum distance required between RTQ1-cDNA and FAM-Apt for the FRET process to occur (Figure 1a). We have demonstrated that close proximity (within a few nucleobases) of the donor–acceptor pair for a short stem-loop aptamer is not a necessary condition to ensure the sensitive detection of the ligand of interest. The parameters of the assay, such as RTQ1-cDNA and FAM-Apt concentrations, as well as reaction conditions, have been optimized. The reached analytical parameters of AFB1 detection (linear range and detection limit) were determined. Finally, the applicability of the proposed FRET aptasensor was evaluated by analyzing white wine and corn flour samples spiked with AFB1 standards.

2. Results and Discussion

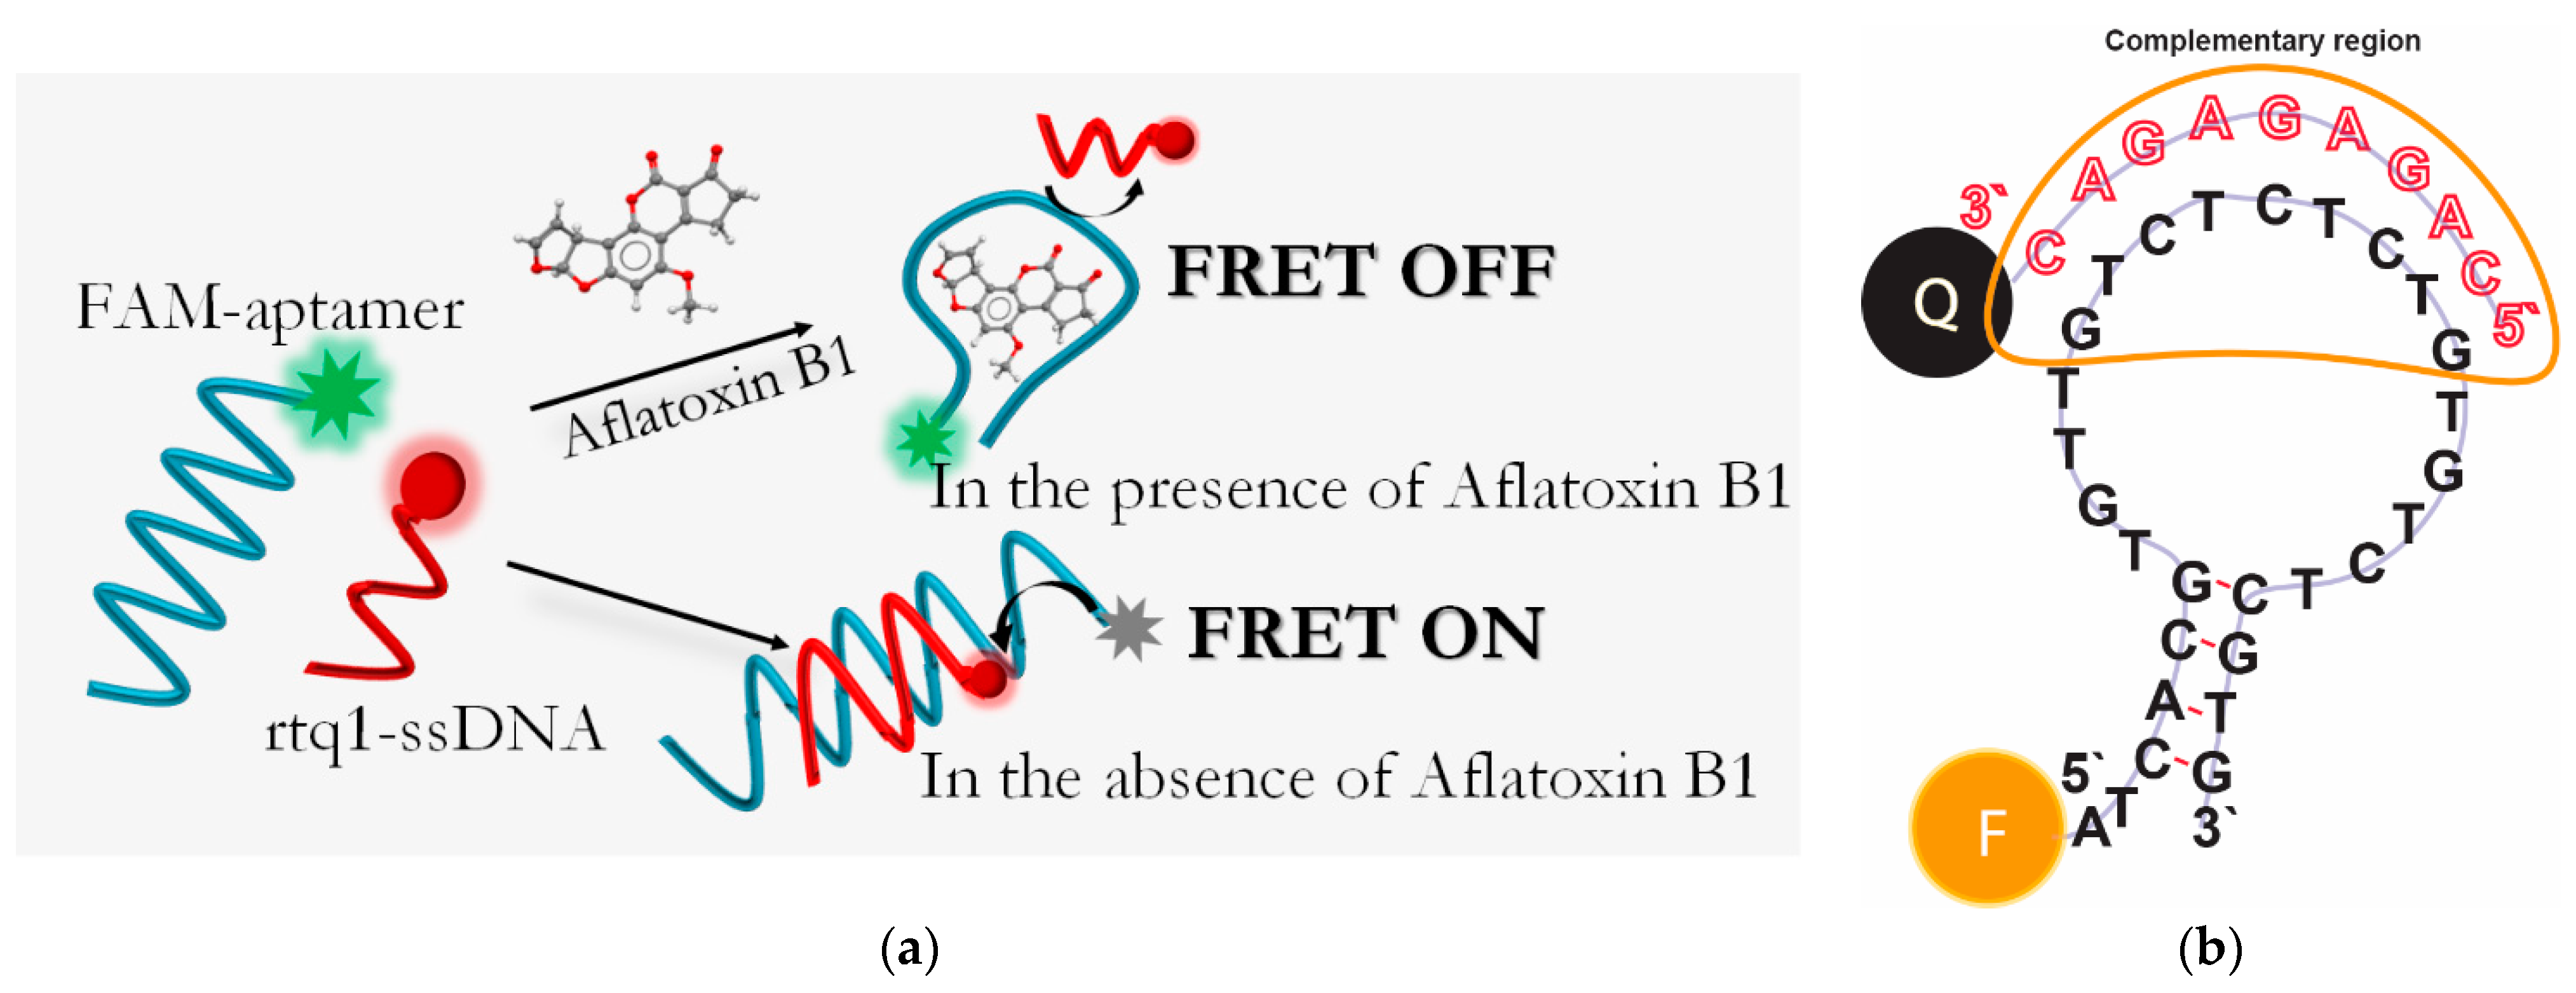
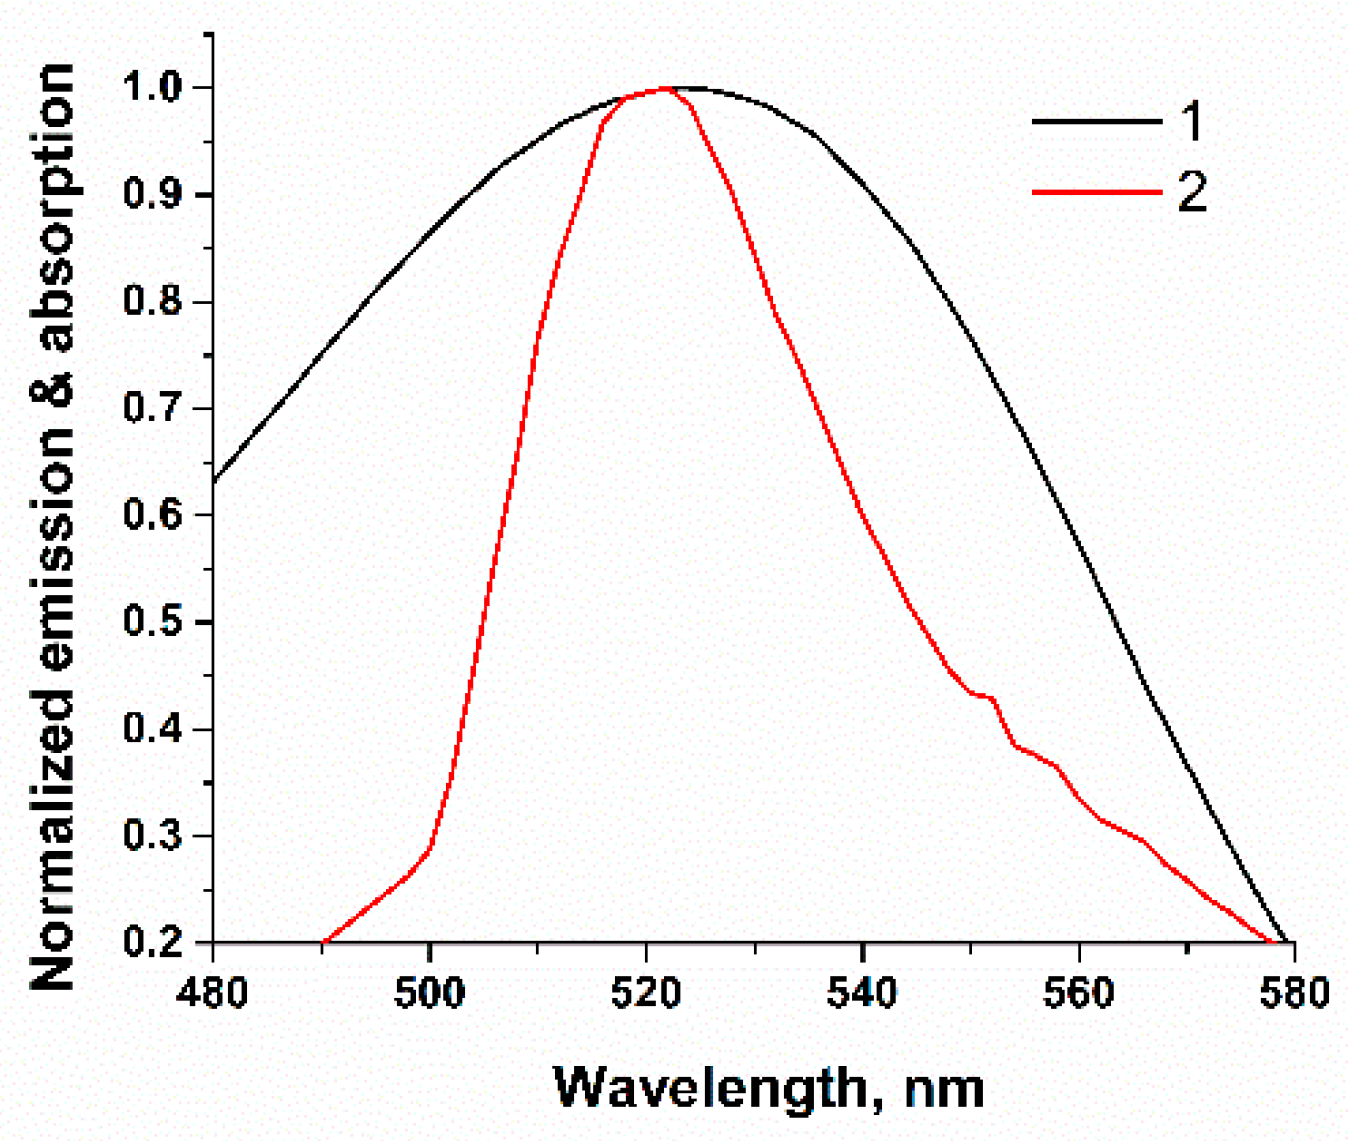
2.1. Principle of AFB1 Detection

A schematic illustration of the FRET-based aptasensor is demonstrated in Figure 1. In this assay, a specific FAM-labeled truncated 26-mer aptamer (5′-FAM-ATCACGTGTTGTCTCTCTGTGTCTCGTG-3′) with a stem-loop secondary structure stabilized by four base pairs was used. To detect AFB1, ssDNA complementary to either the 5′ or 3′ end of the aptamer was typically used to ensure the proximity between the quencher and the fluorophore [32,33,34,35,36]. Considering the flexibility of ssDNAs [37], we applied an ssDNA complementary to the loop region of the aptamer (Figure 1b) identified in previous studies as the binding site for AFB1 [28]. This choice provides the potential possibility of directly affecting the aptamer binding site rather than its structural integrity in the event of disruption of the terminal region of the ssDNA stem. Therefore, a short 9-mer ssDNA labeled with a quencher (RTQ1) at the 3′ end (5′-CAGAGAGAC-RTQ-1-3′) was complementary to the sequence in the loop region (Figure 1b) and close to the 5′ end of the aptamer. The length was chosen based on our previous study, showing that the formation of 23 H-bonds between that of the aptamer and ssDNA under high salt conditions (10 mM Mg2+, 10 mM Ca2+ and 100 mM Na+) is enough to have a dissociation constant close to 10−8. Under similar salt conditions, the dissociation constant of apamer-AFB1 was found to be 49 ± 2 [28]. Therefore, the interaction constants of aptamer–ligand and aptamer–ssDNA would be comparable [38]. In the absence of AFB1, the aptamer hybridized with the cDNA, as a result of which the RTQ1 turned out to be in close proximity to FAM, and the fluorescence of the latter was quenched. The spectral overlap shown in Figure 2 confirms the possibility of the FRET process for this donor–acceptor pair. In the presence of AFB1, a structural switch of the aptamer occurred with the formation of an analyte/aptamer complex, as a result of which cDNA was dehybridized from the aptamer and the fluorescence of FAM was recovered.

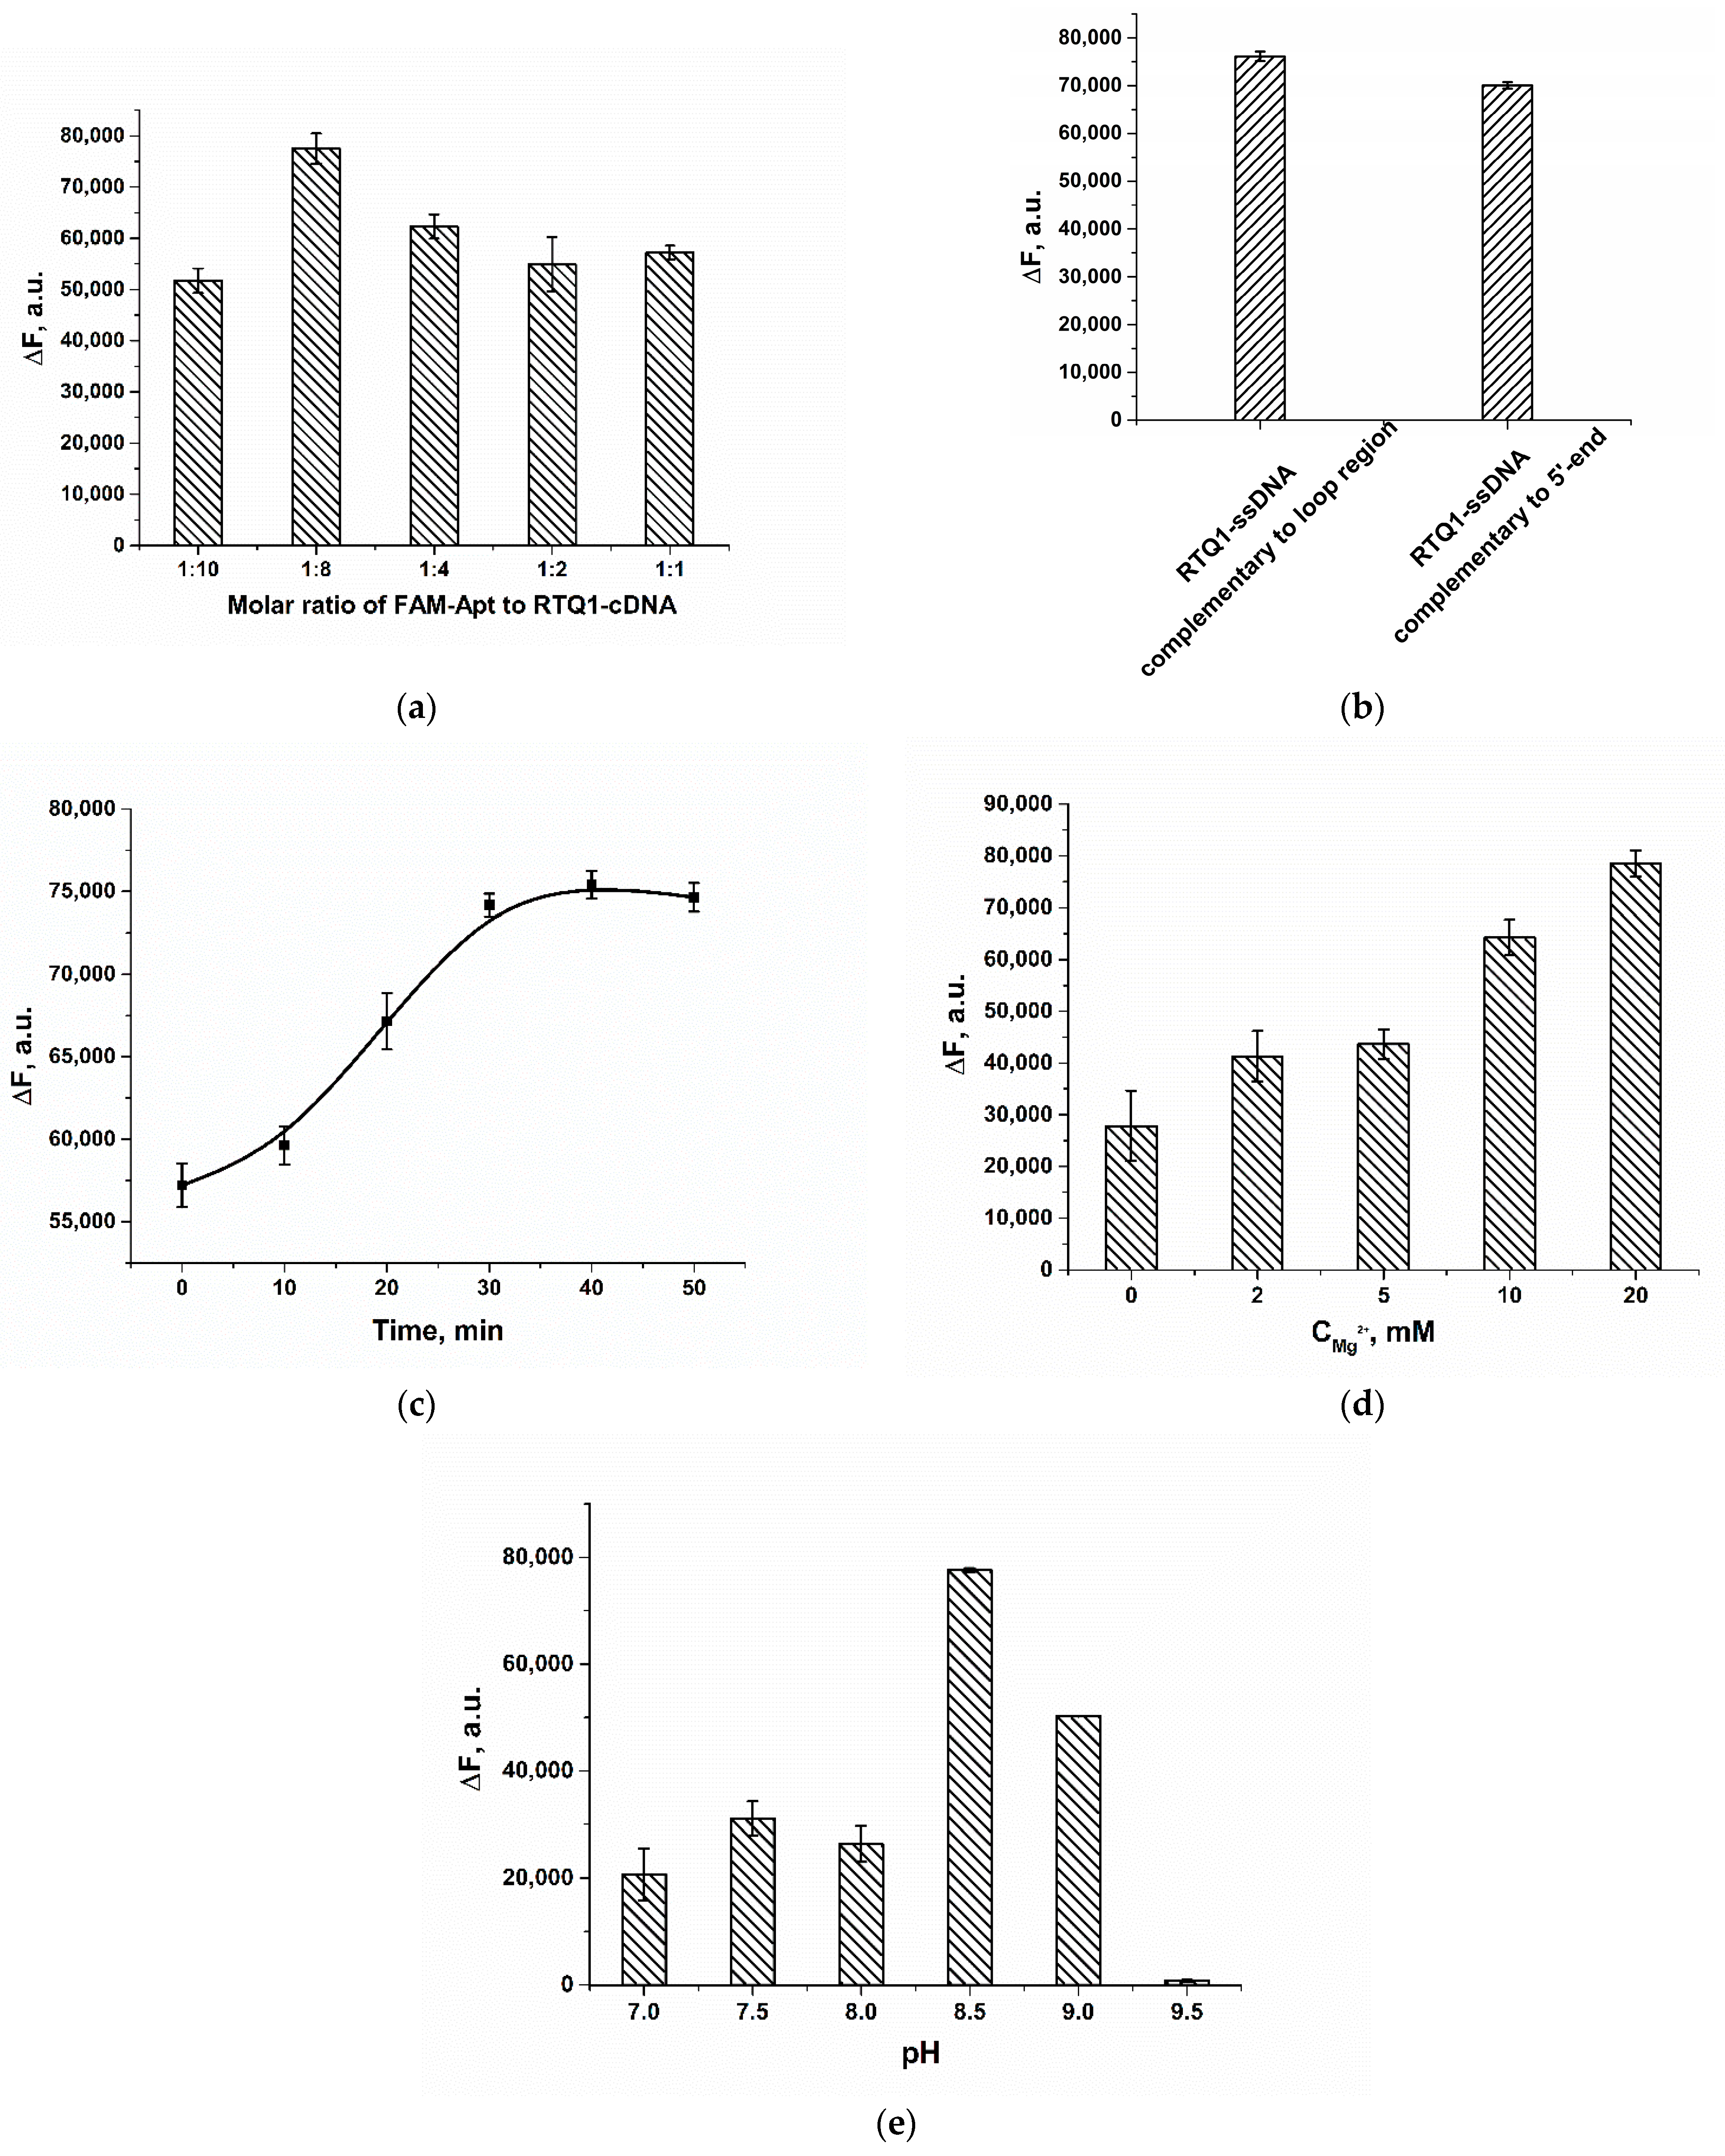
2.2. Optimization of Assay Conditions

To optimize the sensing performance, the ratios of the RTQ1-cDNA and FAM-Apt, the time of assay, the concentration of Mg2+ and the pH of the working buffer (WB) were varied. As shown in Figure 3a, as the molar ratio increases, the recovered fluorescence of FAM-Apt in the presence of the analyte gradually increases. However, the opposite effect is observed at a molar ratio of 1:10, which could be explained by the high stability of the FAM-Apt/ RTQ1-cDNA complex and a decrease in the binding of the aptamer to the analyte. Therefore, for further experiments, a molar ratio of 1:8 was chosen, which provides the maximum recovered fluorescence, whereas the concentrations of FAM-Apt and RTQ1-cDNA were 5 and 40 nM, respectively.
The recovered fluorescence of FAM-Apt using ssDNA complementary to the 5′ end of the aptamer (5′-ACA ACA CGT G-(RTQ1)-3′) was also studied to compare the quenching effectiveness between the usually used quencher-labeled-cDNA to the terminal region and the chosen cDNA to the loop region. The terminal cDNA–FAM-Apt ratio was optimized, and a ratio of 4:1 was selected. As shown in Figure 3b, both RTQ1-labeled cDNAs to the 5′ end and loop of the aptamer provide the equal change in FAM fluorescence in the presence of 200 nM of AFB1, thereby no significant decrease in FRET efficiency using cDNA complementary to the loop region was observed.
The time for the target-induced fluorescence recovery was also investigated. As can be seen in Figure 3c, fluorescence was restored for up to 30 min, after which the ∆F within an error remained constant. In this regard, fluorescence was measured 30 min after the reaction was initiated by adding AFB1 to the mixture of the FAM-Apt and RTQ1-cDNA.
The absence of natrium ions influence on the aptamer–AFB1 interaction was pinpointed previously [31]. Therefore, the next key parameters affecting the formation of the aptamer/cDNA duplex and the binding of the aptamer to the analyte, were the concentration of Mg2+ and buffer pH. Increasing the magnesium acetate concentration in the range of 1–20 mM caused a gradual increase in the restored fluorescence (Figure 3d). Here, the optimal Mg2+ concentration in WB was determined to be 20 mM. Previously published studies also showed the effectiveness of using Mg2+ at a concentration of 20 mM [31,39]. Finally, the restored fluorescence was tested in buffers over the pH range of 7–9 to determine the optimum acidity. As shown in Figure 3e, the maximum response for 200 nM AFB1 was observed at pH 8.5. The low fluorescence at acidic and neutral conditions is consistent with the pH optimum of fluorescein fluorescence. Under strong alkali conditions, the signal is absent, which is governed by intermolecular interaction in the aptamer-ligand–cDNA system. Thus, the FAM-Apt/RTQ1-cDNA molar ratio of 1:8, the reaction time of 30 min, and a WB containing 20 mM of Mg2+, pH 8.5 were determined to be optimal.

2.3. Aflatoxin B1 Detection Performance

A quantitative fluorescence assay of AFB1 was performed under optimized conditions. As shown in Figure 4a, the fluorescence intensity increased with increasing AFB1 concentration and reached a plateau when the analyte concentration exceeded 1000 nM. The dependence of the fluorescence intensity on the AFB1 concentration was described through the use of the following equation:
F I = 175,465 + 50,022 175,465 ( 1 + ( C 103 ) 0.7
where F I is the fluorescence intensity of FAM-Apt, a.u.; C is AFB1 concentration, nM. The limit of detection, calculated as three times the standard deviation of the fluorescence intensity of the blank sample, was 0.7 nM (0.2 ng/mL).
Since the accuracy of the analysis decreases at the upper and lower plateaus, we limited the use of the sigmoid dependence to the evaluation of the dynamic range. The dynamic range (Figure 4b) varied from 4.8 to 588.2 nM and was described through the use of the following linear equation: F I = 19,219 C + 46,199 ( F I is the fluorescence intensity of FAM-Apt, a.u.; C is AFB1 concentration, nM) with a correlation coefficient of 0.996.

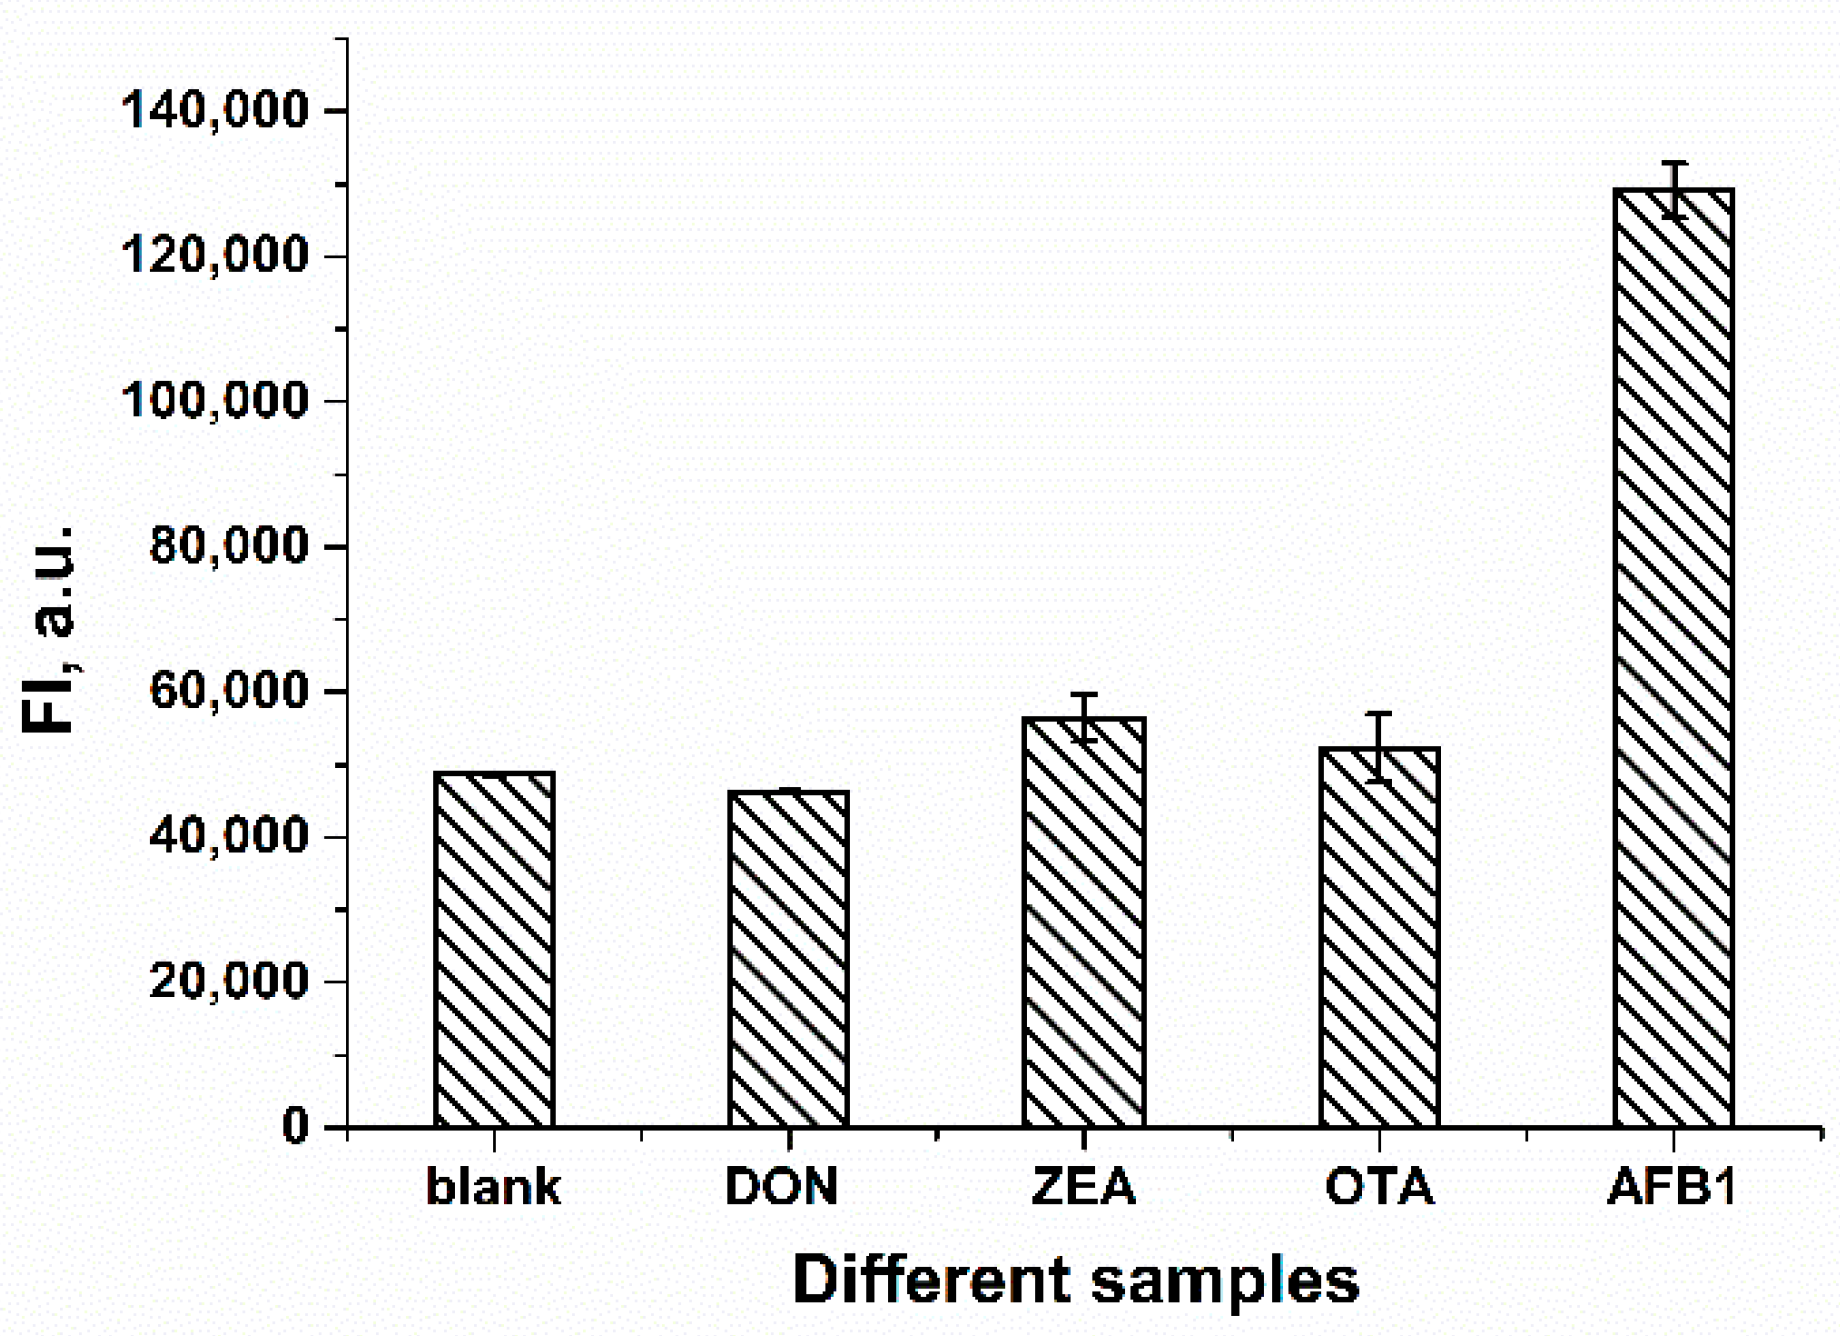
2.4. Selectivity of the FRET-Based Aptasensor in AFB1 Detection

To evaluate the selectivity of the proposed FRET-based aptasensor for AFB1, several other mycotoxins were also tested. For the experiment, 62.4 ng/mL (200 nM) AFB1 and an excess of other mycotoxins amounting to 403.8 ng/mL OTA, 318.4 ng/mL ZEA and 296.3 ng/mL of DON were added to the mixture of FAM-Apt and RTQ1-cDNA, respectively. Molar concentrations of mycotoxins for selectivity testing were 200 nM for AFB1 and 1 µM for other interfering mycotoxins. The excess of the non-specific concentration of toxins was chosen to emphasize the lack of their effect on fluorescence intensity. As shown in Figure 5, the fluorescence intensity of other mycotoxins did not change compared to the blank. At the same time, the addition of AFB1 led to a significant restoration in terms of the fluorescence of FAM-Apt. The results confirm that the FRET-based aptasensor has a high selectivity for AFB1.

2.5. Detection of AFB1 in Food Samples

To assess the practical applicability and reliability of the developed FRET-based aptasensor, AFB1 spiked samples of food matrixes were analyzed. Since the extraction of contaminated corn flour was carried out using methanol, this extractant formed the basis of the final extract. To avoid solvent interference, samples were diluted before testing. As for the wine samples, they were diluted with a buffer since the wine initially contained alcohol in its composition. This simple preparation allowed us to minimize the influence of the sample on the analysis result. In addition, a calibration curve in the buffer was used for the fortified sample analysis.
As shown in Table 1, the recovery of AFB1 in white wine ranged from 76.7 to 91.9%, whereas the AFB1 recovery in corn flour samples ranged from 84.0 to 86.5%. These results indicate the feasibility of the developed aptasensor for the detection of aflatoxin B1 in food samples.

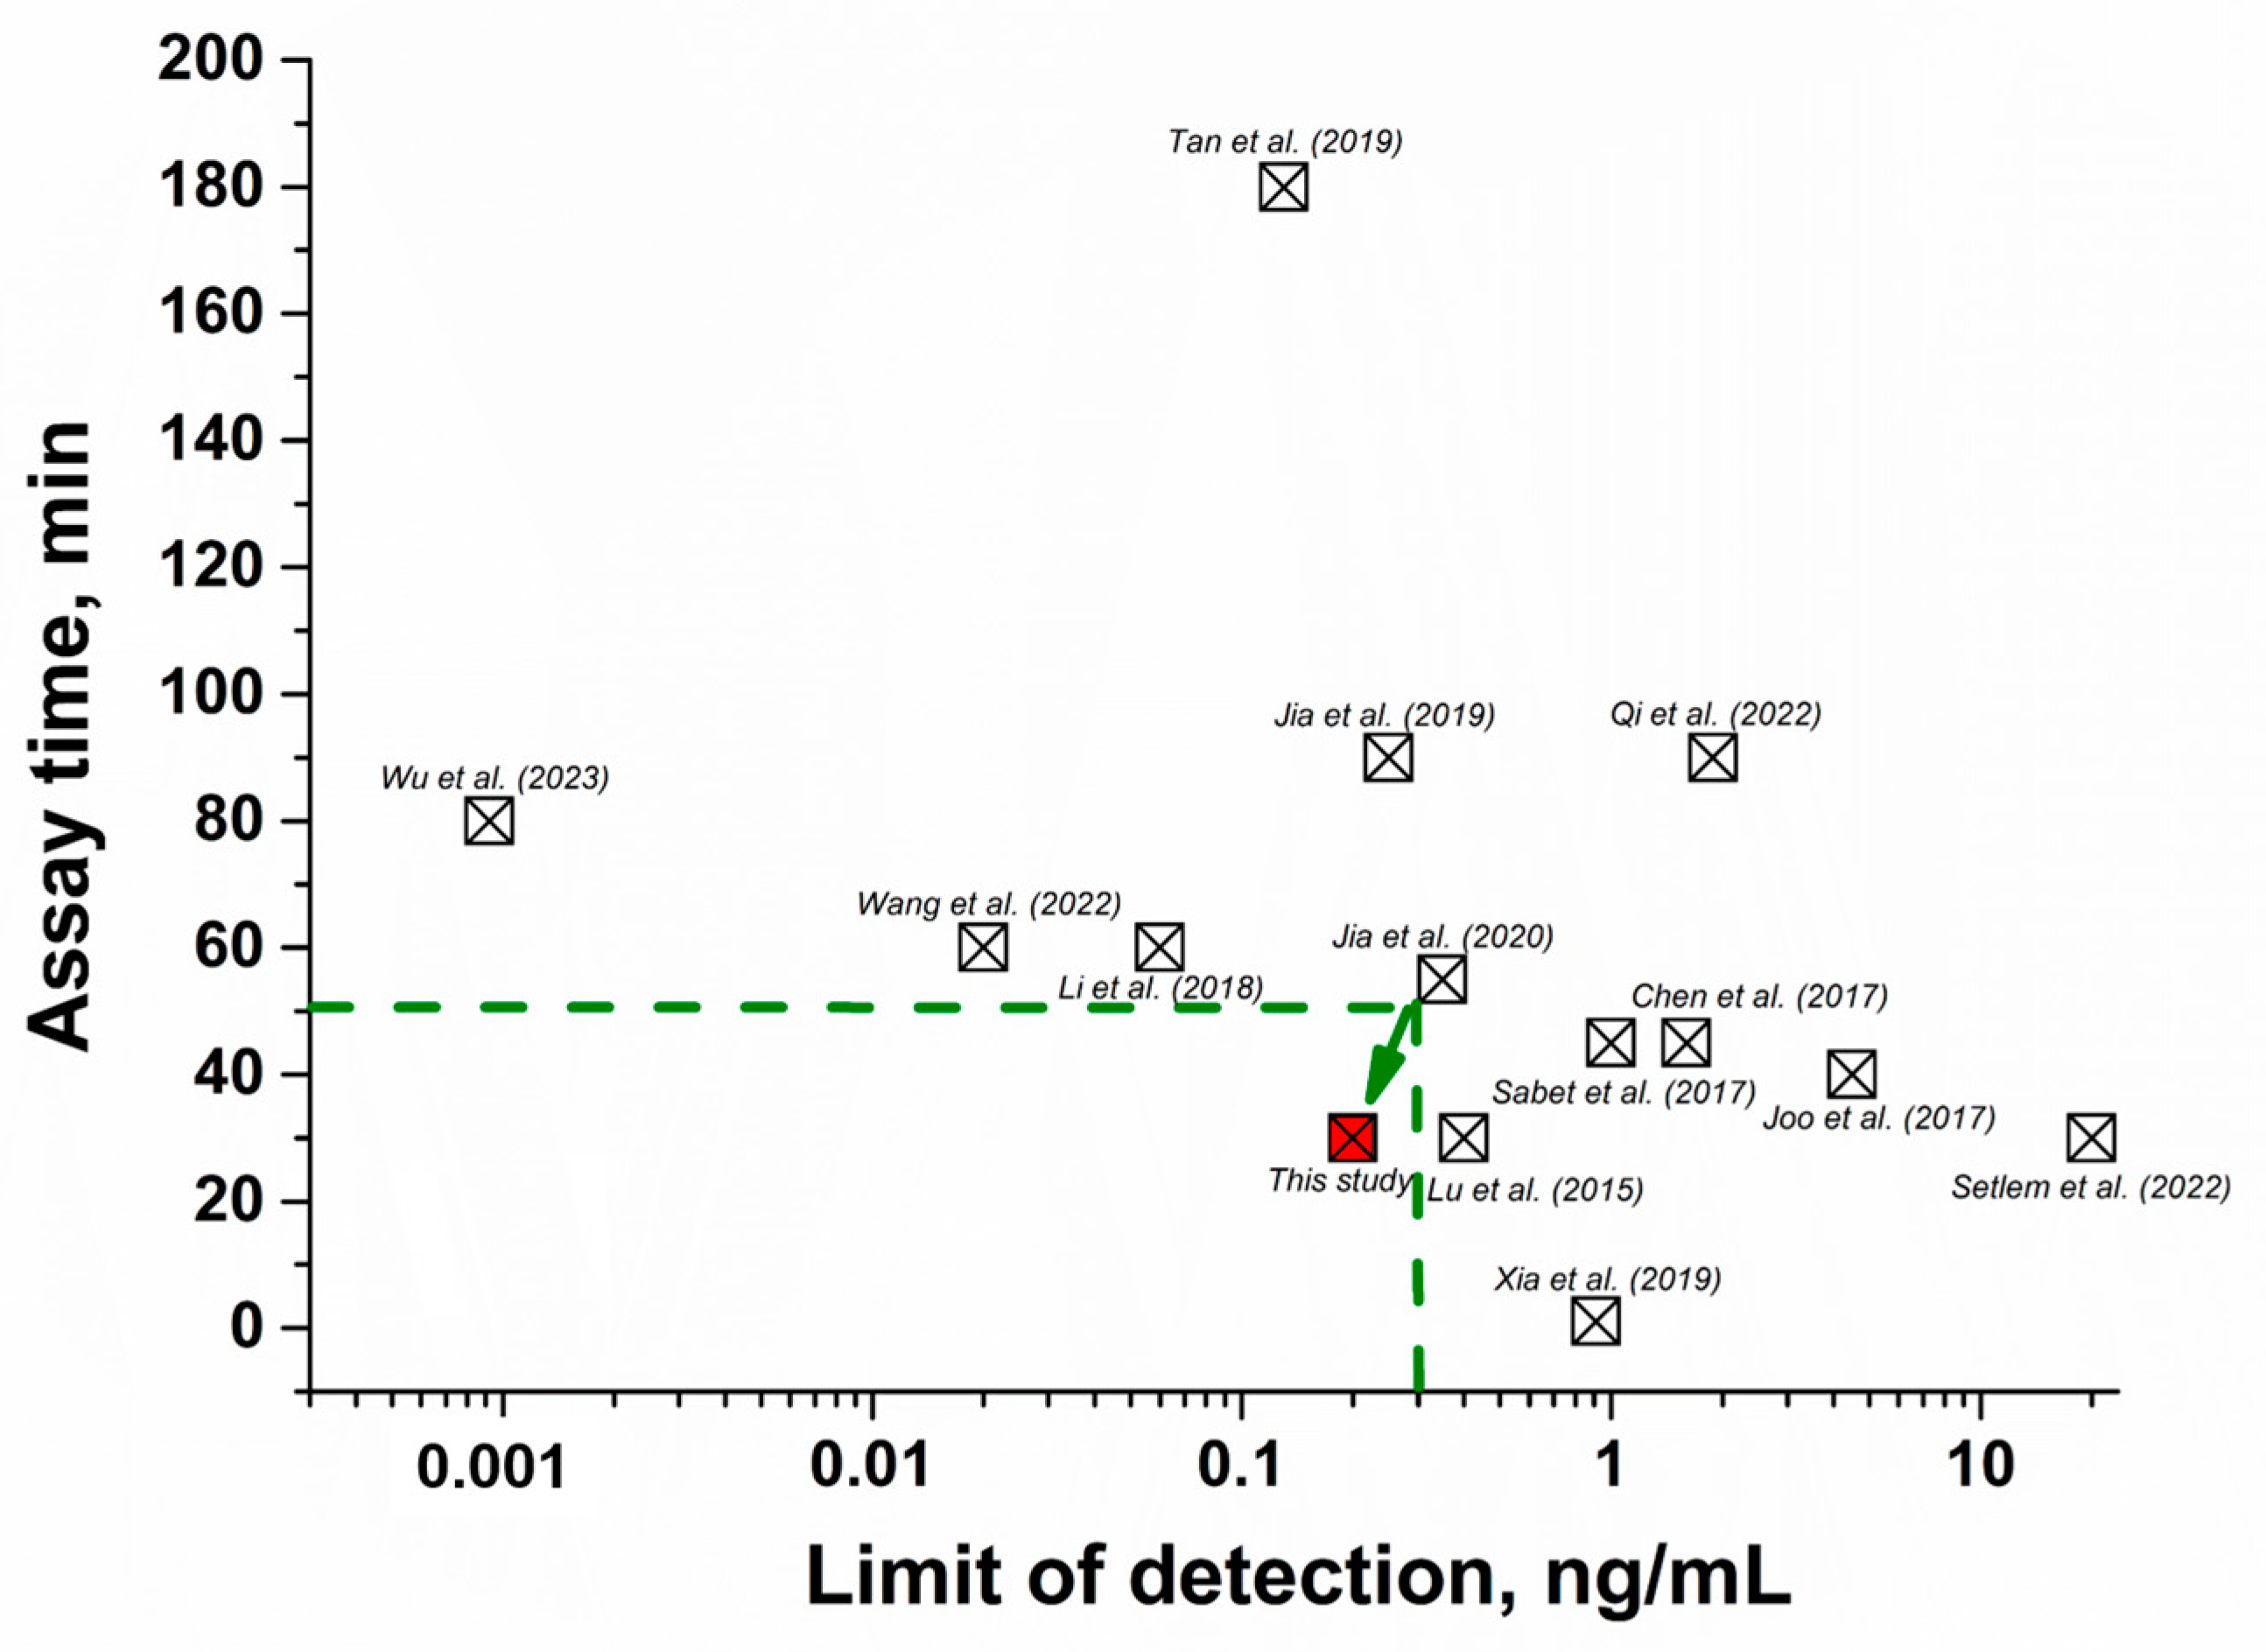
2.6. Comparison of the Developed FRET Aptasensor with Other Methods

The performance of the given aptasensor was compared with other FRET-based assays in terms of linear range, detection limit, and time. As shown in Table 2, previously proposed FRET aptasensors are characterized either by high sensitivity but a long time required to perform the assay [31,34,40,41,42,43,44] or rapid testing with low sensitivity [45,46,47,48,49,50]. Thus, by comparing existing FRET aptasensors in terms of sensitivity and analysis time (Figure 6), our aptasensor demonstrated the optimal combination of these parameters and allowed us to consider its development as a potential tool for the determination of AFB1 in food.

3. Conclusions

In summary, a homogeneous fluorescent method for the determination of aflatoxin B1 was developed by designing a donor–acceptor pair of a truncated AFB1-specific aptamer labeled with FAM and RTQ1-labeled ssDNA complementary to the loop region of the aptamer to implement an analysis based on the FRET process. This FRET-based aptasensor has the following obvious advantages: (1) the aptasensor allows one-step detection of aflatoxin B1; (2) the time required for analysis is short being equal to 30 min; (3) high sensitivity and specificity of the aptasensor; (4) applicability to different food samples. Thus, the excellent performance of the developed FRET-based aptasensor makes it an effective method for the simple determination of aflatoxin B1.

4. Materials and Methods

4.1. Reagents and Materials

The standard solutions of aflatoxin B1 (AFB1), ochratoxin A (OTA), zearalenone (ZEA), and deoxynivalenol (DON) were obtained from Chimmed (Moscow, Russia). AFB1 aptamer 5′-(FAM)-AT CAC GTG TTG TCT CTC TGT GTC TCG TG-3′, as well as its complementary ssDNAs 5′-CAG AGA GAC-(RTQ1)-3′ and 5′-ACA ACA CGT G-(RTQ1)-3′ were custom-synthesized and purified by Syntol (Moscow, Russia). Real-Time Quencher-1 (RTQ1) is a low molecular organic quencher produced by Syntol (Moscow, Russia) with λmax(abs) = 520 nm and a quenching operating range of 470–570 nm, with the absorption of FAM-fluorescence being 2 times better than BHQ1 [51,52]. Tris(hydroxymethyl)aminomethane, magnesium acetate, polyvinylpyrrolidone (PVP-10) and sodium acetate were obtained from Sigma Aldrich (St. Louis, MO, USA). Amicon Ultra-15 centrifuge filter units (3 kDa cutoff) were purchased from Merck Millipore (Carrigtwohill, Ireland). All reagents applied in experiments were of analytical grade.
All aqueous solutions were prepared in ultrapure water obtained via a Simplicity Milli-Q® system from Millipore (Burlington, MA, USA). All interactions were carried out in a working buffer (WB; Tris-acetate containing 20 mM Mg-acetate and 100 mM Na-acetate, pH 8.5) at 25 °C. Stock solutions of the aptamer and oligonucleotide were prepared by dissolving lyophilized DNA in deionized water to the concentration of 200 µM. Fluorescence measurements were performed in black 96-well plates (NUNC Maxisorp) obtained from Thermo Fisher Scientific (Waltham, MD, USA). A corn flour negative sample was provided by Trilogy Reference Material (Washington, DC, USA). White wine was purchased from the local market.

4.2. Apparatus

Fluorescence intensity was measured using the multi-mode microplate reader CLARIOstar Plus (BMG Labtech, Ortenberg, Germany) in the “fluorescence intensity” or “kinetic slow” mode using an excitation filter (482 ± 16 nm), dichroic mirror (504 nm), and emission filter (520 ± 10 nm) with an automatic adjustable focal length. Aptamer and oligonucleotide concentrations were verified using a NanoDrop2000 microvolume spectrophotometer by examining the optical density at 260 nM (Thermo Scientific, Waltham, MA, USA). All experiments were carried out under the same constant temperature—25 °C.

4.3. Optimization of Assay Conditions

To determine the optimal concentration of RTQ1-cDNA, a series of RTQ1-cDNA dilutions in WB from a concentration of 50 nM with a dilution step of 2 were mixed with 5 nM FAM-Apt in the presence and absence of 200 nM AFB1.
To obtain the optimal reaction time, 5 nM FAM-Apt was mixed with 40 nM RTQ1-cDNA in the presence and absence of 200 nM AFB1, followed by measurement of fluorescence intensity in kinetic mode for 50 min after gentle agitation of the plate for 5 min.
The optimal concentration of Mg2+ was established by mixing 5 nM FAM-Apt and 40 nM RTQ1-cDNA with WB, containing Mg2+ in the concentration range from 2 mM to 20 mM in the presence and absence of 200 nM AFB1.
The optimal pH was determined via the fluorescence measurements of the FAM-Apt/RTQ1-cDNA complex in WB with pH varied in the range of 7–9 in the presence and absence of 200 nM AFB1.
Optimization data are presented as a dependence of ∆F = FI200nM − FIblank on the parameter under study, where FI200nM is the intensity value in the presence of 200 nM AFB1, and FIblank is the fluorescence intensity in the absence of the analyte. The values of the varied parameters under which the restored fluorescence (∆F) reached its maxima were chosen as optimal ones.

4.4. Aflatoxin B1 Detection with FRET-Based Aptasensor

For competitive detection of AFB1, 100 µL of AFB1 standards were added to the microplate wells in the concentration range from 1 µM to 0.1 nM. Then, 50 μL aliquots of FAM-Apt and RTQ1-cDNA were added, followed by 30 min incubation at room temperature. Before measuring fluorescence, the microplate was stirred for 30 s with the CLARIOstar option of the reader to ensure equilibrium. The analysis was carried out in triplicate. Calibration curves were obtained by plotting the fluorescence intensity of the FAM-Apt versus the logarithm of AFB1 concentration using Origin 9.0 software (OriginLab Corp., Northampton, MA, USA). The limit of detection was calculated as the concentration according to the triple standard deviation above the blank mean.

4.5. Selectivity Testing

The selectivity of the developed FRET-based aptasensor was evaluated using the following mycotoxins: ochratoxin A (OTA), zearalenone (ZEA), and deoxynivalenol (DON). Mycotoxins were diluted in WB to a final concentration of 1 µM and added to microplate wells with the following possibility to interact with the added FAM-Apt and RTQ1-cDNA as described in Section 4.4.

4.6. Sample Preparation

Before the pretreatment of samples, wine and corn flour were spiked with different concentrations of AFB1, taking into account further dilution of food samples. White wine was processed according to a previously described protocol [53,54]. Briefly, 0.02 g/mL PVP-10 was added to an aliquot of wine to decolorize the sample. After 5 min of stirring, the sample was filtered on Amicon Ultra-15 centrifuge filter units for 30 min at 15,000× g. After adjusting the pH to 8.5 with 1 M potassium hydroxide, magnesium acetate was added to the final concentration of 20. To remove the precipitate, the sample was centrifuged at 4000× g for 15 min.
The corn flour was pretreated according to the protocol [55,56]. Briefly, corn flour was extracted with a mixture of methanol and water in a ratio of 30:70. The resulting mixture was filtered through 0.45 μm membrane filters and centrifuged for 15 min at 2500× g to remove the precipitate.
Wine and corn extracts were diluted with WB 10 and 25 times, respectively, prior to their testing.

Author Contributions

Conceptualization, K.V.S. and A.V.S.; validation, K.V.S.; formal analysis, A.V.S. and K.V.S.; investigation, A.V.S. and K.V.S.; resources, K.V.S.; writing—original draft preparation, K.V.S. and A.V.S.; writing—review and editing, K.V.S., A.V.S., A.V.Z. and B.B.D.; visualization, K.V.S.; supervision, A.V.Z. and B.B.D.; project administration, A.V.Z. and B.B.D.; funding acquisition, K.V.S. and B.B.D. All authors have read and agreed to the published version of the manuscript.

Funding

This work was financially supported by the Russian Science Foundation (grant № 21-74-20155).

Institutional Review Board Statement

Not applicable.

Informed Consent Statement

Not applicable.

Data Availability Statement

The data that support the findings of this study are available from the corresponding author upon request.

Acknowledgments

The measurements were carried out on the equipment of the Shared-Access Equipment Centre “Industrial Biotechnology” of A.N. Bach Institute of Biochemistry, Research Center of Biotechnology of the Russian Academy of Sciences.

Conflicts of Interest

The authors declare no conflict of interest.

References

  1. Sweeney, M.J.; Dobson, A.D.W. Mycotoxin production by Aspergillus, Fusarium and Penicillium species. Int. J. Food Microbiol. 1998, 43, 141–158. [Google Scholar] [CrossRef] [PubMed]
  2. Okeke, C.A.; Ezekiel, C.N.; Sulyok, M.; Ogunremi, O.R.; Ezeamagu, C.O.; Šarkanj, B.; Warth, B.; Krska, R. Traditional processing impacts mycotoxin levels and nutritional value of ogi—A maize-based complementary food. Food Control 2018, 86, 224–233. [Google Scholar] [CrossRef]
  3. Mokhtarian, M.; Tavakolipour, H.; Bagheri, F.; Fernandes Oliveira, C.A.; Corassin, C.H.; Khaneghah, A.M. Aflatoxin B1 in the Iranian pistachio nut and decontamination methods: A systematic review. Qual. Assur. Saf. Crops Foods 2020, 12, 15–25. [Google Scholar] [CrossRef]
  4. Commission Regulation (EU). Commission Regulation (EU) 2023/915 of 25 April 2023 on Maximum Levels for Certain Contaminants in Food and Repealing Regulation (EC) No 1881/2006 (Text with EEA Relevance). Off. J. Eur. Union 2023. Available online: https://eur-lex.europa.eu/eli/reg/2023/915/oj (accessed on 25 October 2023).
  5. Wang, Y.; Zhao, G.; Li, X.; Liu, L.; Cao, W.; Wei, Q. Electrochemiluminescent competitive immunosensor based on polyethyleneimine capped SiO2 nanomaterials as labels to release Ru(bpy)32+ fixed in 3D Cu/Ni oxalate for the detection of aflatoxin B1. Biosens. Bioelectron. 2018, 101, 290–296. [Google Scholar] [CrossRef]
  6. Hamad, G.M.; Mehany, T.; Simal-Gandara, J.; Abou-Alella, S.; Esua, O.J.; Abdel-Wahhab, M.A.; Hafez, E.E. A review of recent innovative strategies for controlling mycotoxins in foods. Food Control 2023, 144, 109350. [Google Scholar] [CrossRef]
  7. Eaton, D.L.; Gallagher, E.P. Mechanisms of aflatoxin carcinogenesis. Annu. Rev. Pharmacol. Toxicol. 1994, 34, 135–172. [Google Scholar] [CrossRef]
  8. Henry, S.H.; Bosch, F.X.; Troxell, T.C.; Bolger, P.M. Policy forum: Public health. Reducing liver cancer—Global control of aflatoxin. Science 1999, 286, 2453–2454. [Google Scholar] [CrossRef]
  9. Warth, B.; Petchkongkaew, A.; Sulyok, M.; Krska, R. Utilising an LC-MS/MS-based multi-biomarker approach to assess mycotoxin exposure in the Bangkok metropolitan area and surrounding provinces. Food Addit. Contam. Part A 2014, 31, 2040–2046. [Google Scholar] [CrossRef]
  10. Afsah-Hejri, L.; Rajaram, P.; O’Leary, J.; McGivern, J.; Baxter, R.; Mesbah, A.; Maboudian, R.; Ehsani, R. Identification of volatile organic compounds (VOCs) by SPME-GC-MS to detect Aspergillus flavus infection in pistachios. Food Control 2023, 154, 110033. [Google Scholar] [CrossRef]
  11. Xiong, Y.; Pei, K.; Wu, Y.; Duan, H.; Lai, W.; Xiong, Y. Plasmonic ELISA based on enzyme-assisted etching of Au nanorods for the highly sensitive detection of aflatoxin B1 in corn samples. Sens. Actuators B Chem. 2018, 267, 320–327. [Google Scholar] [CrossRef]
  12. Shao, Y.; Duan, H.; Guo, L.; Leng, Y.; Lai, W.; Xiong, Y. Quantum dot nanobead-based multiplexed immunochromatographic assay for simultaneous detection of aflatoxin B1 and zearalenone. Anal. Chim. Acta 2018, 1025, 163–171. [Google Scholar] [CrossRef]
  13. Duo, Y.; Xiang, Z.; Gao, G.; Luo, G.; Tang, B.Z. Biomedical application of aggregation-induced emission luminogen-based fluorescent sensors. TrAC Trends Anal. Chem. 2023, 167, 117252. [Google Scholar] [CrossRef]
  14. Wang, J.-X.; Yin, J.; Shekhah, O.; Bakr, O.M.; Eddaoudi, M.; Mohammed, O.F. Energy Transfer in Metal–Organic Frameworks for Fluorescence Sensing. ACS Appl. Mater. Interfaces 2022, 14, 9970–9986. [Google Scholar] [CrossRef] [PubMed]
  15. Amirjani, A.; Tsoulos, T.V.; Sajjadi, S.H.; Antonucci, A.; Wu, S.-J.; Tagliabue, G.; Haghshenas, D.F.; Boghossian, A.A. Plasmon-induced near-infrared fluorescence enhancement of single-walled carbon nanotubes. Carbon 2022, 194, 162–175. [Google Scholar] [CrossRef]
  16. Nazarzadeh Zare, E.; Khorsandi, D.; Zarepour, A.; Yilmaz, H.; Agarwal, T.; Hooshmand, S.; Mohammadinejad, R.; Ozdemir, F.; Sahin, O.; Adiguzel, S.; et al. Biomedical applications of engineered heparin-based materials. Bioact. Mater. 2024, 31, 87–118. [Google Scholar] [CrossRef] [PubMed]
  17. Ye, H.; Lu, Q.; Duan, N.; Wang, Z. GO-amplified fluorescence polarization assay for high-sensitivity detection of aflatoxin B1 with low dosage aptamer probe. Anal. Bioanal. Chem. 2019, 411, 1107–1115. [Google Scholar] [CrossRef]
  18. Li, Y.; Zhao, Q. Aptamer structure switch fluorescence anisotropy assay for aflatoxin B1 using tetramethylrhodamine-guanine interaction to enhance signal change. Chin. Chem. Lett. 2020, 31, 1982–1985. [Google Scholar] [CrossRef]
  19. Li, Y.; Yu, H.; Zhao, Q. Aptamer fluorescence anisotropy assays for detection of aflatoxin B1 and adenosine triphosphate using antibody to amplify signal change. RSC Adv. 2022, 12, 7464–7468. [Google Scholar] [CrossRef] [PubMed]
  20. Wu, L.; Huang, C.; Emery, B.P.; Sedgwick, A.C.; Bull, S.D.; He, X.-P.; Tian, H.; Yoon, J.; Sessler, J.L.; James, T.D. Förster resonance energy transfer (FRET)-based small-molecule sensors and imaging agents. Chem. Soc. Rev. 2020, 49, 5110–5139. [Google Scholar] [CrossRef]
  21. Cunningham, P.D.; Khachatrian, A.; Buckhout-White, S.; Deschamps, J.R.; Goldman, E.R.; Medintz, I.L.; Melinger, J.S. Resonance energy transfer in DNA duplexes labeled with localized dyes. J. Phys. Chem. B 2014, 118, 14555–14565. [Google Scholar] [CrossRef] [PubMed]
  22. Shaban, S.M.; Kim, D.H. Recent Advances in Aptamer Sensors. Sensors 2021, 21, 979. [Google Scholar] [CrossRef]
  23. Yu, H.; Alkhamis, O.; Canoura, J.; Liu, Y.; Xiao, Y. Advances and Challenges in Small-Molecule DNA Aptamer Isolation, Characterization, and Sensor Development. Angew. Chem. Int. Ed. Engl. 2021, 60, 16800–16823. [Google Scholar] [CrossRef] [PubMed]
  24. Monserud, J.H.; Macri, K.M.; Schwartz, D.K. Toehold-Mediated Displacement of an Adenosine-Binding Aptamer from a DNA Duplex by its Ligand. Angew. Chem. Int. Ed. 2016, 55, 13710–13713. [Google Scholar] [CrossRef] [PubMed]
  25. Wang, C.; Zhang, W.; Qian, J.; Wang, L.; Ren, Y.; Wang, Y.; Xu, M.; Huang, X. A FRET aptasensor for sensitive detection of aflatoxin B1 based on a novel donor–acceptor pair between ZnS quantum dots and Ag nanocubes. Anal. Methods 2021, 13, 462–468. [Google Scholar] [CrossRef]
  26. Aswani Kumar, Y.V.V.; Renuka, R.M.; Achuth, J.; Mudili, V.; Poda, S. Development of a FRET-based fluorescence aptasensor for the detection of aflatoxin B1 in contaminated food grain samples. RSC Adv. 2018, 8, 10465–10473. [Google Scholar] [CrossRef]
  27. Le, L.; Cruz-Aguado, J.A.; Penner, G.A. DNA Ligands for Aflatoxin and Zearalenone; Neoventures Biotechnology Inc.: London, ON, Canada, 2011. [Google Scholar]
  28. Sun, L.; Zhao, Q. Direct fluorescence anisotropy approach for aflatoxin B1 detection and affinity binding study by using single tetramethylrhodamine labeled aptamer. Talanta 2018, 189, 442–450. [Google Scholar] [CrossRef]
  29. Nasirian, V.; Chabok, A.; Barati, A.; Rafienia, M.; Arabi, M.S.; Shamsipur, M. Ultrasensitive aflatoxin B1 assay based on FRET from aptamer labelled fluorescent polymer dots to silver nanoparticles labeled with complementary DNA. Microchim. Acta 2017, 184, 4655–4662. [Google Scholar] [CrossRef]
  30. Lu, X.; Wang, C.; Qian, J.; Ren, C.; An, K.; Wang, K. Target-driven switch-on fluorescence aptasensor for trace aflatoxin B1 determination based on highly fluorescent ternary CdZnTe quantum dots. Anal. Chim. Acta 2019, 1047, 163–171. [Google Scholar] [CrossRef]
  31. Li, Y.; Sun, L.; Zhao, Q. Development of aptamer fluorescent switch assay for aflatoxin B1 by using fluorescein-labeled aptamer and black hole quencher 1-labeled complementary DNA. Anal. Bioanal. Chem. 2018, 410, 6269–6277. [Google Scholar] [CrossRef]
  32. Wang, L.; Yao, L.; Ma, Q.; Mao, Y.; Qu, H.; Zheng, L. Investigation on small molecule-aptamer dissociation equilibria based on antisense displacement probe. Food Sci. Hum. Wellness 2023, 12, 1257–1264. [Google Scholar] [CrossRef]
  33. Feng, B.; You, J.; Zhao, F.; Wei, M.; Liu, Y.; Yuan, K.; Suo, Z. A ratiometric fluorescent aptamer homogeneous biosensor based on hairpin structure aptamer for AFB1 detection. J. Fluoresc. 2022, 32, 1695–1701. [Google Scholar] [CrossRef] [PubMed]
  34. Wang, C.; Yu, H.; Zhao, Q. A Simple Structure-Switch Aptasensor Using Label-Free Aptamer for Fluorescence Detection of Aflatoxin B1. Molecules 2022, 27, 4257. [Google Scholar] [CrossRef] [PubMed]
  35. Zhao, L.; Liang, X.; Liu, Y.; Wei, M.; Jin, H. A Novel Fluorescent Aptasensor Based on Dual-labeled DNA Nanostructure for Simultaneous Detection of Ochratoxin A and Aflatoxin B1. J. Fluoresc. 2023, 33, 1641–1650. [Google Scholar] [CrossRef] [PubMed]
  36. Wang, C.; Zhu, K.; Yu, J.; Shi, P. Complementary DNA Significantly Enhancing Signal Response and Sensitivity of a Molecular Beacon Probe to Aflatoxin B1. Biosensors 2023, 13, 195. [Google Scholar] [CrossRef]
  37. Murphy, M.C.; Rasnik, I.; Cheng, W.; Lohman, T.M.; Ha, T. Probing Single-Stranded DNA Conformational Flexibility Using Fluorescence Spectroscopy. Biophys. J. 2004, 86, 2530–2537. [Google Scholar] [CrossRef]
  38. Samokhvalov, A.V.; Safenkova, I.V.; Eremin, S.A.; Bonchuk, A.N.; Maksimenko, O.G.; Sluchanko, N.N.; Zherdev, A.V.; Dzantiev, B.B. Modulation of Aptamer–Ligand-Binding by Complementary Oligonucleotides: A G-Quadruplex Anti-Ochratoxin A Aptamer Case Study. Int. J. Mol. Sci. 2022, 23, 4876. [Google Scholar] [CrossRef]
  39. Wang, C.; Li, Y.; Zhao, Q. A signal-on electrochemical aptasensor for rapid detection of aflatoxin B1 based on competition with complementary DNA. Biosens. Bioelectron. 2019, 144, 111641. [Google Scholar] [CrossRef]
  40. Jia, Y.; Wu, F.; Liu, P.; Zhou, G.; Yu, B.; Lou, X.; Xia, F. A label-free fluorescent aptasensor for the detection of Aflatoxin B1 in food samples using AIEgens and graphene oxide. Talanta 2019, 198, 71–77. [Google Scholar] [CrossRef]
  41. Tan, H.; Ma, L.; Guo, T.; Zhou, H.; Chen, L.; Zhang, Y.; Dai, H.; Yu, Y. A novel fluorescence aptasensor based on mesoporous silica nanoparticles for selective and sensitive detection of aflatoxin B1. Anal. Chim. Acta 2019, 1068, 87–95. [Google Scholar] [CrossRef]
  42. Jia, Y.; Zhou, G.; Wang, X.; Zhang, Y.; Li, Z.; Liu, P.; Yu, B.; Zhang, J. A metal-organic framework/aptamer system as a fluorescent biosensor for determination of aflatoxin B1 in food samples. Talanta 2020, 219, 121342. [Google Scholar] [CrossRef] [PubMed]
  43. Wu, Z.; Sun, D.-W.; Pu, H.; Wei, Q. A novel fluorescence biosensor based on CRISPR/Cas12a integrated MXenes for detecting Aflatoxin B1. Talanta 2023, 252, 123773. [Google Scholar] [CrossRef]
  44. Qi, X.; Lv, L.; Wei, D.; Lee, J.J.; Niu, M.; Cui, C.; Guo, Z.J.A.; Chemistry, B. Detection of aflatoxin B1 with a new label-free fluorescence aptasensor based on PVP-coated single-walled carbon nanohorns and SYBR Gold. Anal. Bioanal. Chem. 2022, 414, 3087–3094. [Google Scholar] [CrossRef] [PubMed]
  45. Joo, M.; Baek, S.H.; Cheon, S.A.; Chun, H.S.; Choi, S.-W.; Park, T.J. Development of aflatoxin B1 aptasensor based on wide-range fluorescence detection using graphene oxide quencher. Colloids Surf. B Biointerfaces 2017, 154, 27–32. [Google Scholar] [CrossRef] [PubMed]
  46. Chen, L.; Wen, F.; Li, M.; Guo, X.; Li, S.; Zheng, N.; Wang, J. A simple aptamer-based fluorescent assay for the detection of Aflatoxin B1 in infant rice cereal. Food Chem. 2017, 215, 377–382. [Google Scholar] [CrossRef]
  47. Lu, Z.; Chen, X.; Wang, Y.; Zheng, X.; Li, C.M. Aptamer based fluorescence recovery assay for aflatoxin B1 using a quencher system composed of quantum dots and graphene oxide. Microchim. Acta 2015, 182, 571–578. [Google Scholar] [CrossRef]
  48. Sabet, F.S.; Hosseini, M.; Khabbaz, H.; Dadmehr, M.; Ganjali, M.R. FRET-based aptamer biosensor for selective and sensitive detection of aflatoxin B1 in peanut and rice. Food Chem. 2017, 220, 527–532. [Google Scholar] [CrossRef]
  49. Xia, X.; Wang, Y.; Yang, H.; Dong, Y.; Zhang, K.; Lu, Y.; Deng, R.; He, Q. Enzyme-free amplified and ultrafast detection of aflatoxin B1 using dual-terminal proximity aptamer probes. Food Chem. 2019, 283, 32–38. [Google Scholar] [CrossRef]
  50. Setlem, S.K.; Mondal, B.; Ramlal, S. A fluorescent aptasensor for the detection of Aflatoxin B1 by graphene oxide mediated quenching and release of fluorescence. J. Microbiol. Methods 2022, 193, 106414. [Google Scholar] [CrossRef]
  51. Terekhov, S.S.; Smirnov, I.V.; Stepanova, A.V.; Bobik, T.V.; Mokrushina, Y.A.; Ponomarenko, N.A.; Belogurov, A.A., Jr.; Rubtsova, M.P.; Kartseva, O.V.; Gomzikova, M.O.; et al. Microfluidic droplet platform for ultrahigh-throughput single-cell screening of biodiversity. Proc. Natl. Acad. Sci. USA 2017, 114, 2550–2555. [Google Scholar] [CrossRef]
  52. Masgutov, R.; Masgutova, G.; Mukhametova, L.; Garanina, E.; Arkhipova, S.S.; Zakirova, E.; Mukhamedshina, Y.O.; Margarita, Z.; Gilazieva, Z.; Syromiatnikova, V.; et al. Allogenic Adipose Derived Stem Cells Transplantation Improved Sciatic Nerve Regeneration in Rats: Autologous Nerve Graft Model. Front. Pharmacol. 2018, 9, 86. [Google Scholar] [CrossRef]
  53. Serebrennikova, K.V.; Samokhvalov, A.V.; Zherdev, A.V.; Dzantiev, B.B. A fluorescence immunosensor for ochratoxin A based on resonance energy transfer between fluorescein derivative and gold nanoparticles. J. Food Compos. Anal. 2022, 114, 104806. [Google Scholar] [CrossRef]
  54. Nan, M.; Bi, Y.; Xue, H.; Xue, S.; Long, H.; Pu, L.; Fu, G. Rapid Determination of Ochratoxin A in Grape and Its Commodities Based on a Label-Free Impedimetric Aptasensor Constructed by Layer-by-Layer Self-Assembly. Toxins 2019, 11, 71. [Google Scholar] [CrossRef] [PubMed]
  55. Bartosh, A.V.; Urusov, A.E.; Petrakova, A.V.; Kuang, H.; Zherdev, A.V.; Dzantiev, B.B. Highly sensitive lateral flow test with indirect labelling for zearalenone in baby food. Food Agric. Immunol. 2020, 31, 653–666. [Google Scholar] [CrossRef]
  56. Wang, D.; Zhu, J.; Zhang, Z.; Zhang, Q.; Zhang, W.; Yu, L.; Jiang, J.; Chen, X.; Wang, X.; Li, P. Simultaneous Lateral Flow Immunoassay for Multi-Class Chemical Contaminants in Maize and Peanut with One-Stop Sample Preparation. Toxins 2019, 11, 56. [Google Scholar] [CrossRef]
Figure 1. (a) Scheme of FRET-based aptasensor for AFB1 detection. (b) Representation of aptamer-cDNA binding site.
Molecules 28 07889 g001
Figure 2. Overlap between absorption spectrum of RTQ1-cDNA (1) and the fluorescence emission of FAM-Apt (2).
Molecules 28 07889 g002
Figure 3. Optimization of assay parameters, given in terms of the difference (∆F) between fluorescence intensity in the presence of 200 nM AFB1 and in the absence of analyte (blank). (a) Variation in FAM-Apt: RTQ1–cDNA molar ratio. (b) The recovered fluorescence of FAM-Apt in the presence of 200 nM AFB1 obtained using ssDNAs complementary to different regions of Apt. (c) The recovered fluorescence of FAM-Apt in the presence of 200 nM AFB1 obtained after different incubation time. (d) Effect of different concentrations of Mg-acetate in WB on the recovered fluorescence. (e) Effect of buffer pH on the recovered fluorescence of FAM-Apt. The error bars represent the standard deviation of the triplicate measurements.
Molecules 28 07889 g003
Figure 4. (a) Calibration curve for AFB1 (n = 3) obtained in WB. (b) Linearity of fluorescence intensity with respect to AFB1 concentrations.
Molecules 28 07889 g004
Figure 5. Fluorescence intensities in the absence (blank) and presence of various mycotoxins (n = 3). The concentration of AFB1 was 200 nM, and the concentration of other mycotoxins was 1 µM.
Molecules 28 07889 g005
Figure 6. Comparison of FRET aptasensors for AFB1 (listed in Table 2) in terms of detection limit and analysis time [31,34,40,41,42,43,44,45,46,47,48,49,50]. The red square highlights the data obtained in this study. The green dotted line indicates the area of optimal characteristics of FRET aptasensors (rapidity and sensitivity of the analysis), where the detection limit of mycotoxin is up to 0.3 ng/mL, and the assay duration is up to 50 min.
Molecules 28 07889 g006
Table 1. Detection of AFB1 in white wine and corn flour (n = 3).
SamplesAdded *, ng/gFound, ng/gRecovery, %
Wine32.3 ± 0.576.7
86.4 ± 1.580.0
2623.9 ± 4.691.9
Corn7.56.3 ± 2.584.0
2017.3 ± 2.586.5
6555.3 ± 1.885.1
* The spiked wine was diluted 10 times; the spiked corn flour was diluted 25 times.
Table 2. Comparison of the analytical performance of the FRET-based aptasensors for AFB1 detection.
Sensor ComponentsLinear RangeLimit of DetectionAssay TimeSample/
Dilution
Minimum Detectable ConcentrationReference
FAM-Apt/RTQ1-cDNA2.5–208.3 ng/mL0.2 ng/mL30 minWine and corn flour/10 and 25 times7.5 ng/g for corn and 3 ng/g for wineThis study
A fluorescein amidite (FAM)-labeled AFB1-specific aptamer/graphene oxide4.5–300 ng/mL4.5 ng/mL40 minRice seeds/no dilution4.5 ng/mL[45]
AFB1 aptamer modified with quaternized tetraphenylethene salt/graphene oxide0–3 ng/mL0.25 ng/mL90 minmilk, corn and rice/3 times1.92 ng/mL[40]
Aptamers-modified mesoporous silica nanoparticles loaded with Rh6G0.5–50 ng/mL0.13 ng/mL3 hCorn oil, corn/not mentioned1 ng/g[41]
FAM-labeled AFB1 aptamer/cDNA modified with carboxytetramethylrhodamine5–100 ng/mL1.6 ng/mL45 minInfant rice cereal samples/5 times5 ng/mL[46]
Label-free aptamer/fluorescein-labeled complementary strand/quencher (BHQ1)-labeled complementary strand0.02–1000 ng/mL0.02 ng/mL60 minBeer and corn flour/20 timesNot mentioned[34]
TAMRA-labeled aptamer/metal-organic frameworks UiO-66-NH20–180 ng/mL0.35 ng/mL55 minmilk, corn and rice powder/3 times1.52 ng/mL[42]
Aptamer modified with CdTe quantum dots/graphene oxide0.5 ng/mL to 50 µg/mL0.4 ng/mL30 minPeanut oil/no dilution0.5 ng/mL[47]
Aptamer-conjugated quantum dots adsorbed to Au nanoparticles3–125 ng/mL1 ng/mL45 minPeanut and rice/not mentioned≈1.6 ng/mL[48]
Two FAM-labeled aptamer/two black hole quencher-labeled anti-aptamer1–200 ng/mL0.91 ng/mL1 minPeanut oil and broad bean paste/no dilution50 ng/mL[49]
FAM-labeled aptamer/BHQ1-labeled cDNA0.06–156 ng/mL0.06 ng/mL1 hWine and maize flour/100 times0.2 ng/g for wine and 0.4 ng/g for maize[31]
Alexa Fluor 488 labeled aptamer/graphene oxide sheets0.2–200 ng/mL20 ng/mL30 minGroundnut/no dilution20 ng/mL[50]
dual-AFB1 aptamers/Cas12a-crRNA/ssDNA-FAM/MXenes-Ti3C2Tx0.001–80 ng/mL0.92 pg/mL80 minPeanut/no dilution1 ng/mL[43]
SYBR Gold/aptamer/single-walled carbon nanohorns5–200 ng/mL1.89 ng/mL1.5 hSoybean sauce/100 times10 ng/mL[44]
Disclaimer/Publisher’s Note: The statements, opinions and data contained in all publications are solely those of the individual author(s) and contributor(s) and not of MDPI and/or the editor(s). MDPI and/or the editor(s) disclaim responsibility for any injury to people or property resulting from any ideas, methods, instructions or products referred to in the content.

