

Development of a HPLC-MS/MS Method to Assess the Pharmacokinetics and Tumour Distribution of the Dimethylarginine Dimethylaminohydrolase 1 Inhibitors ZST316 and L-257 in a Xenograft Model of Triple-Negative Breast Cancer in Mice
 ,
, 
Abstract
:1. Introduction
2. Results
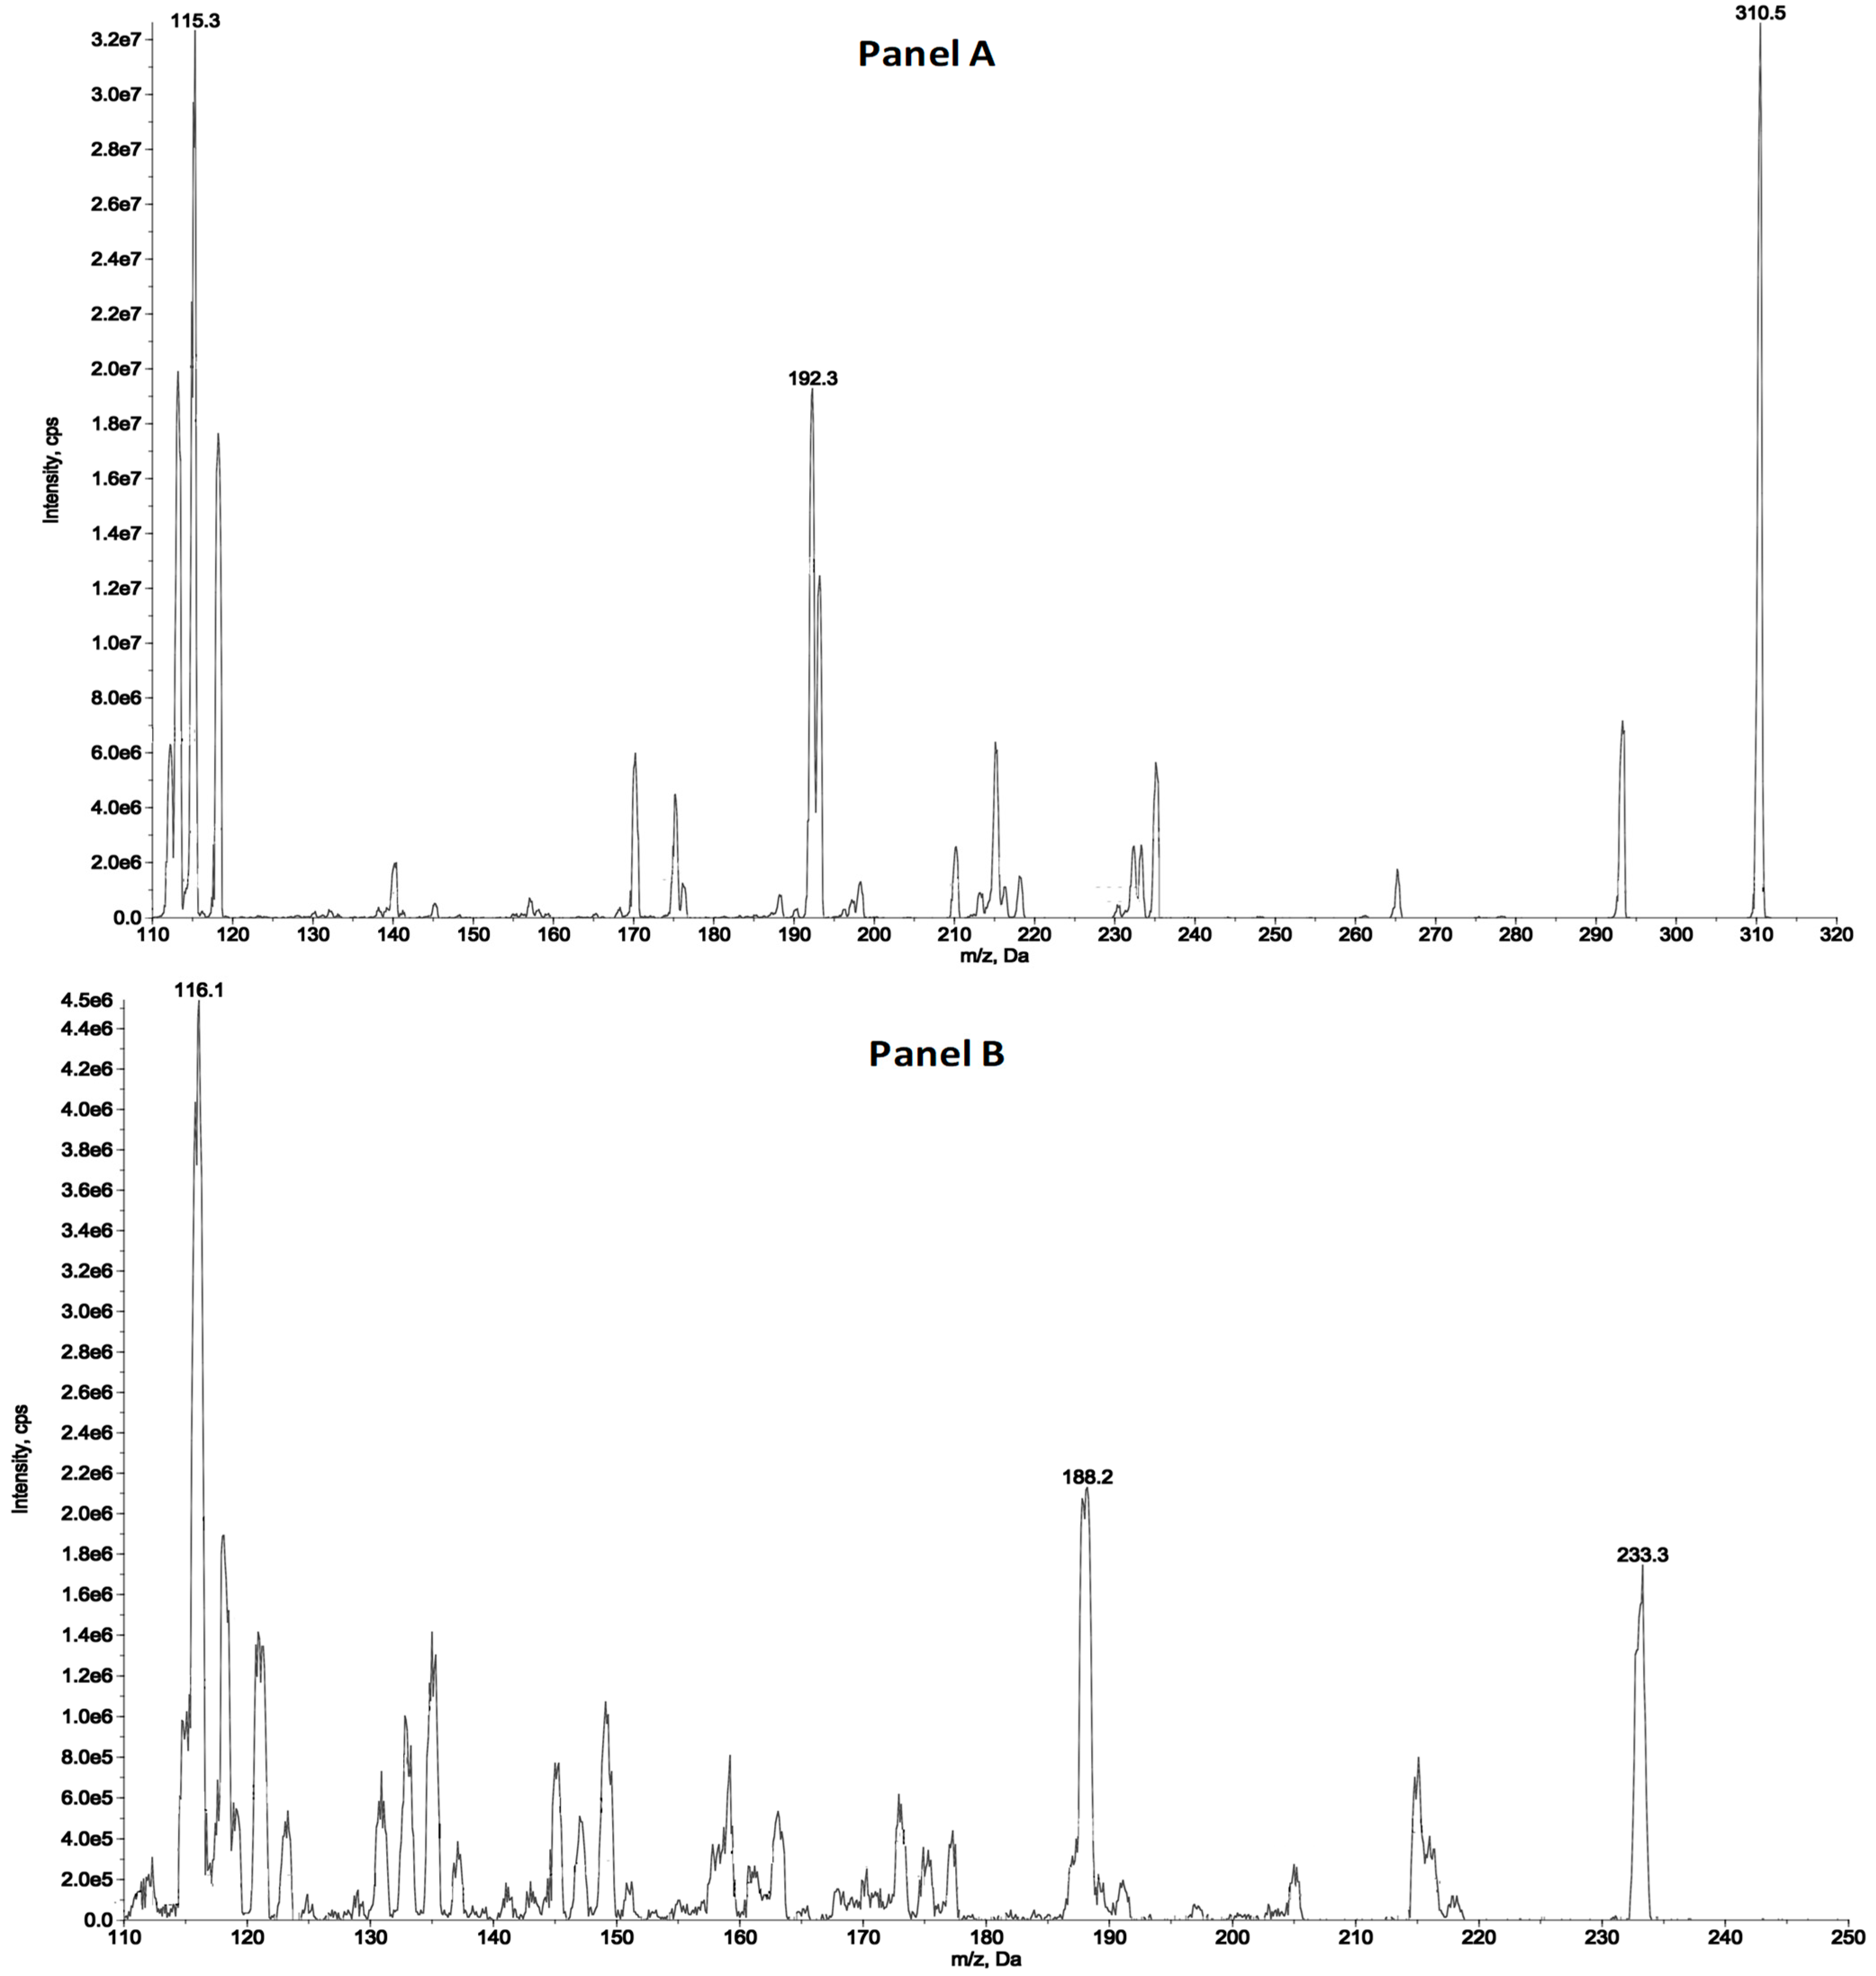
2.1. HPLC-MS/MS
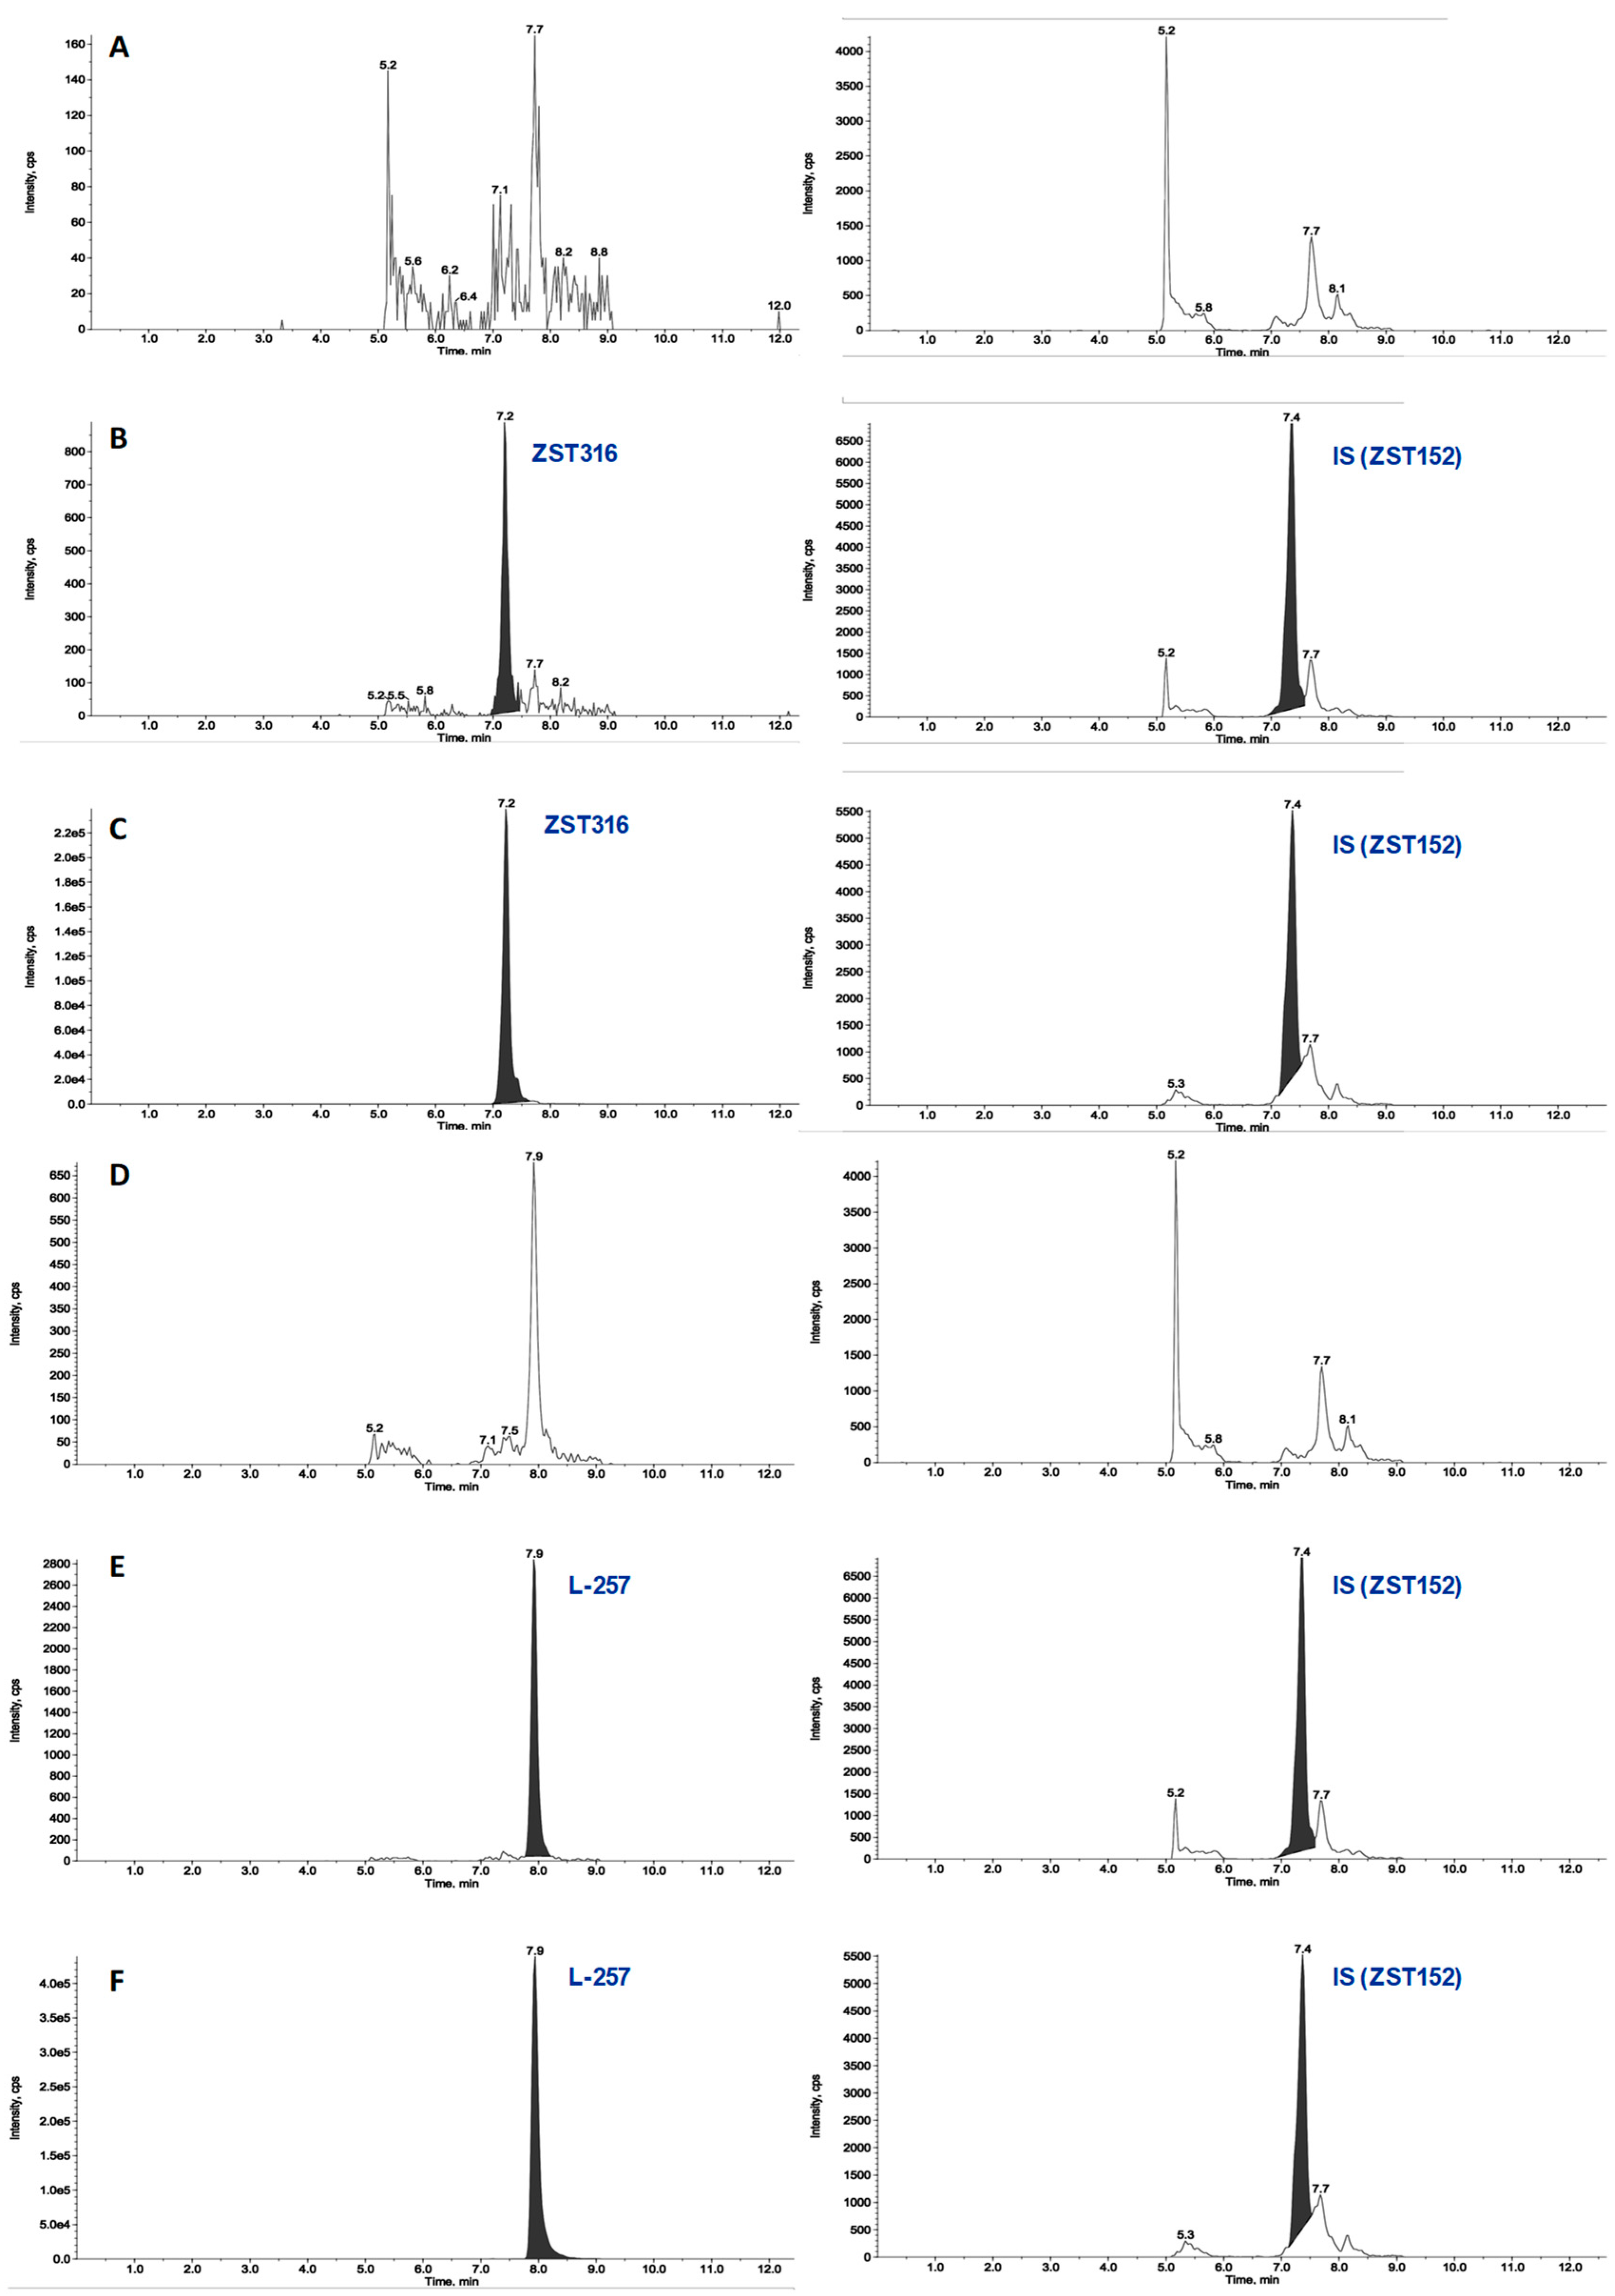
2.1.1. Plasma Sample Analysis
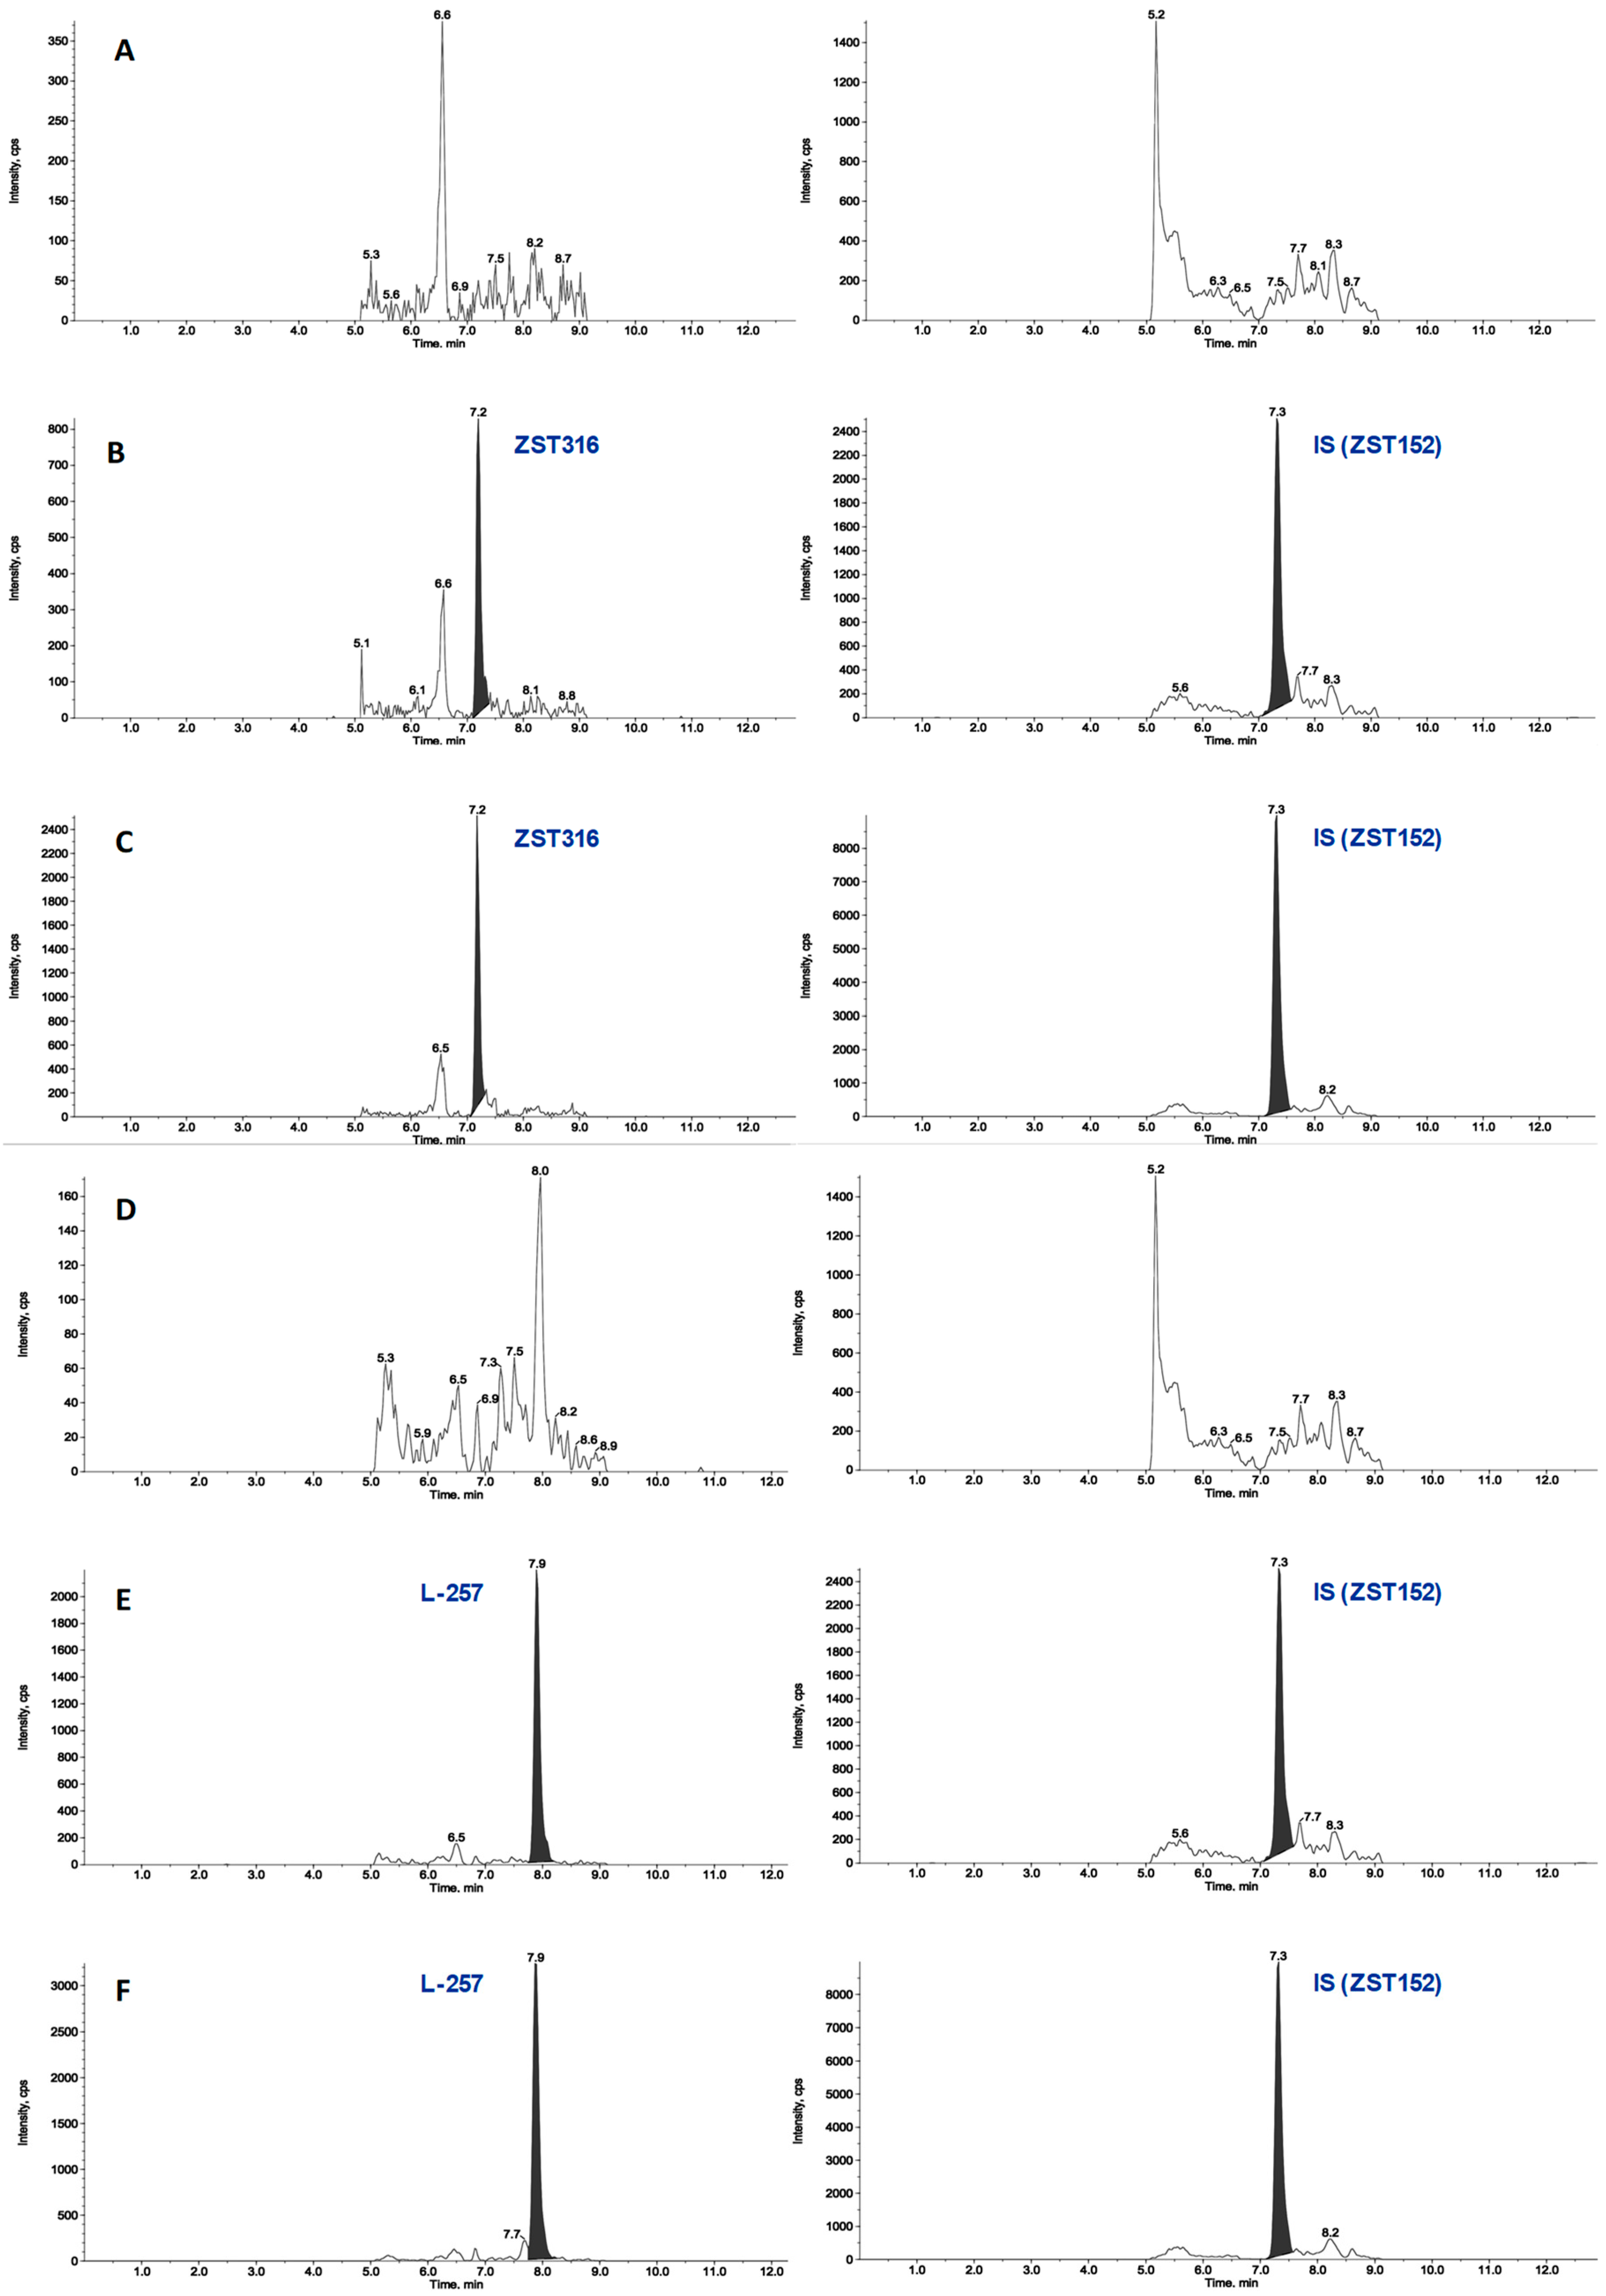
2.1.2. Tumour Tissue
2.2. Pharmacokinetics and Tumour Distribution
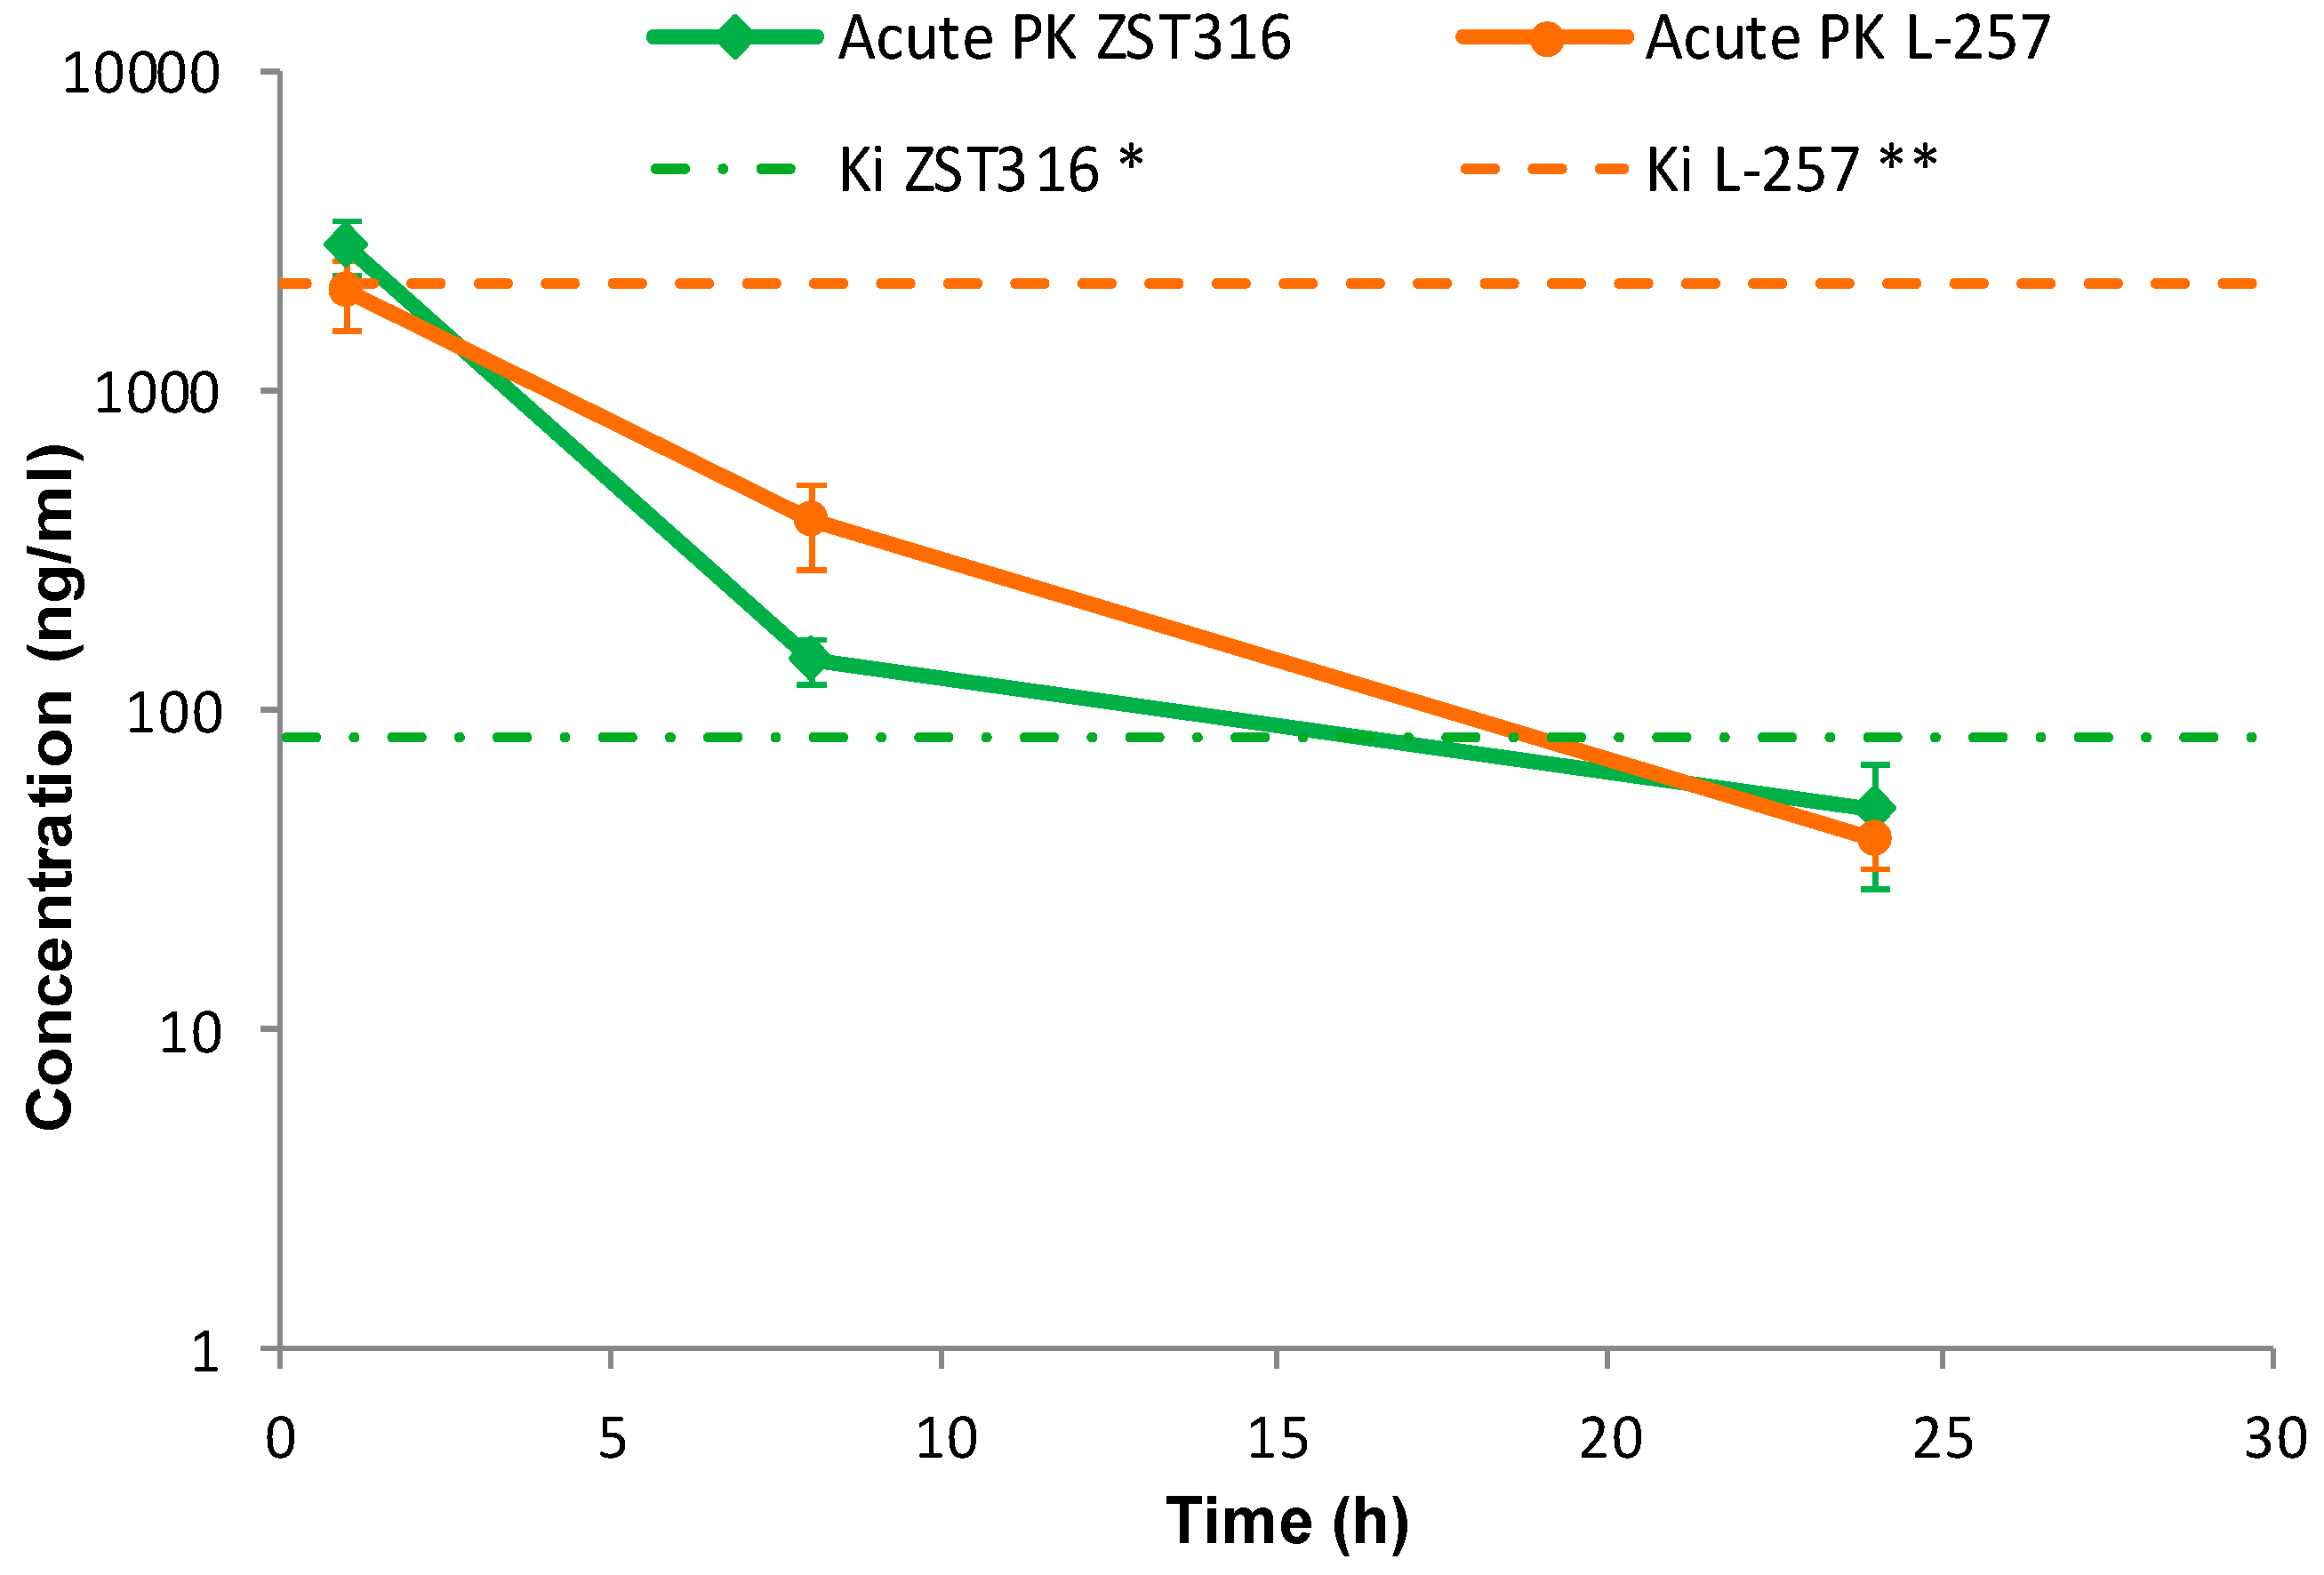
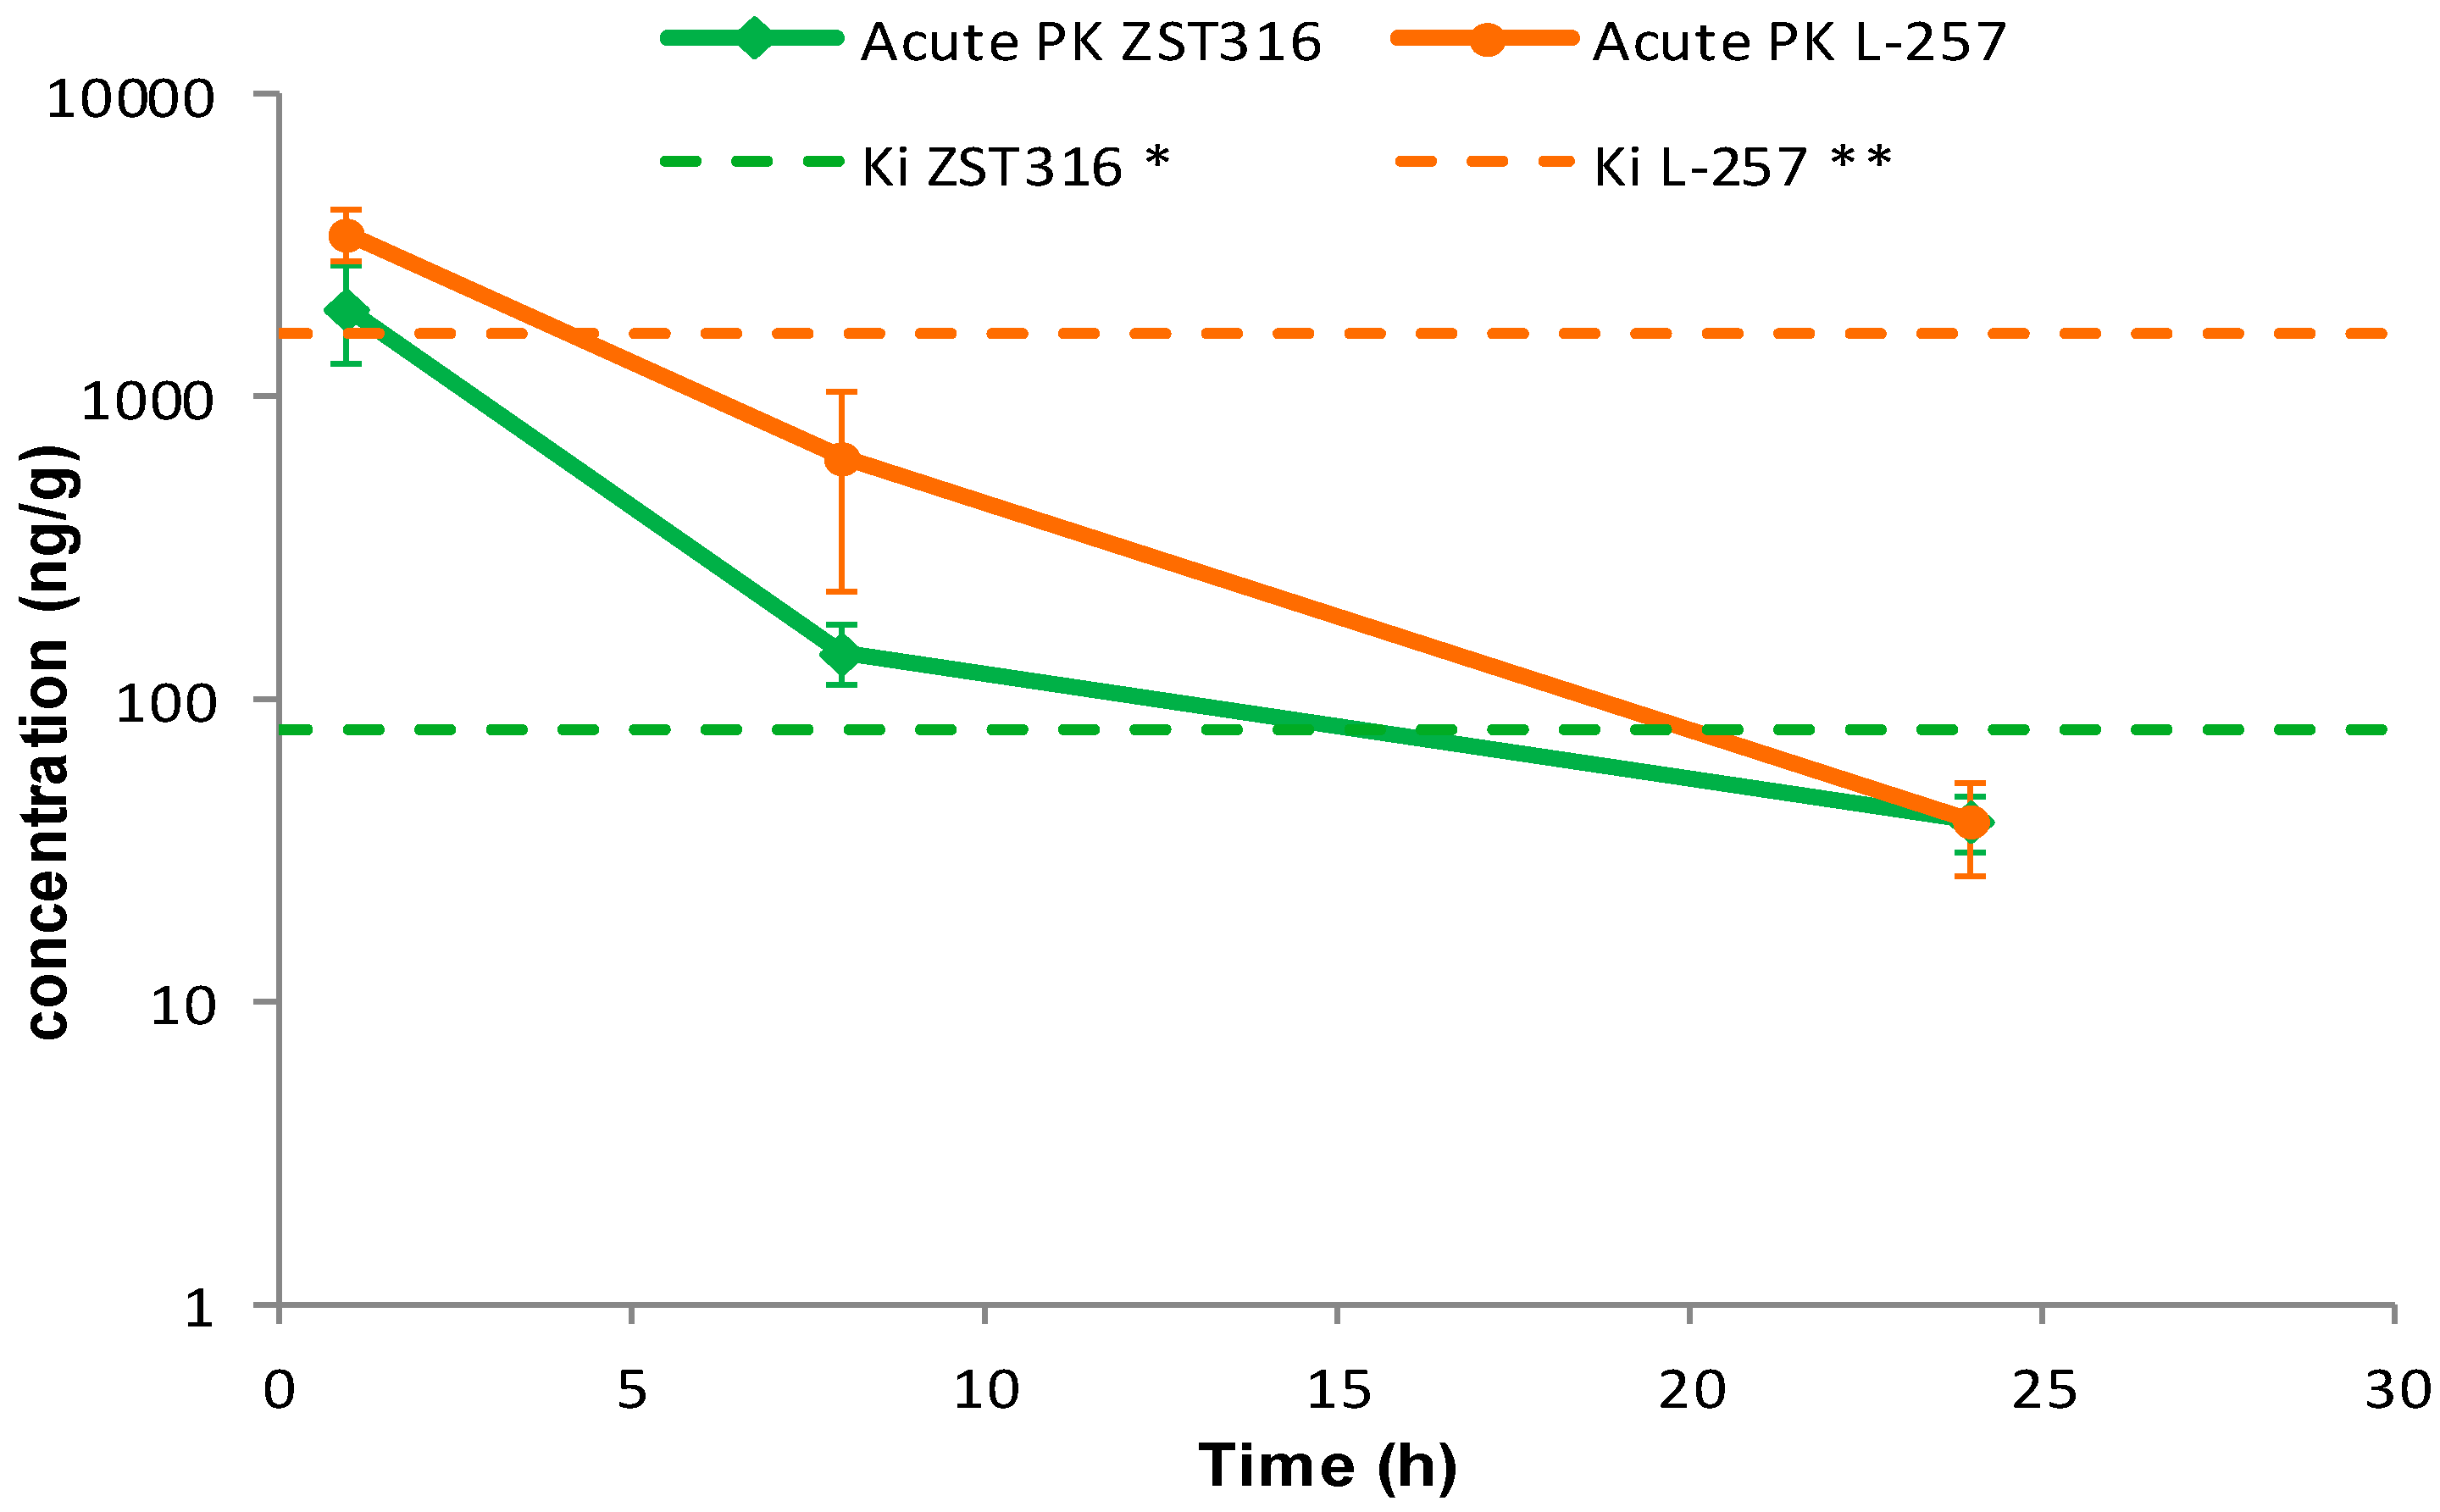
2.2.1. Acute Treatment with ZST316
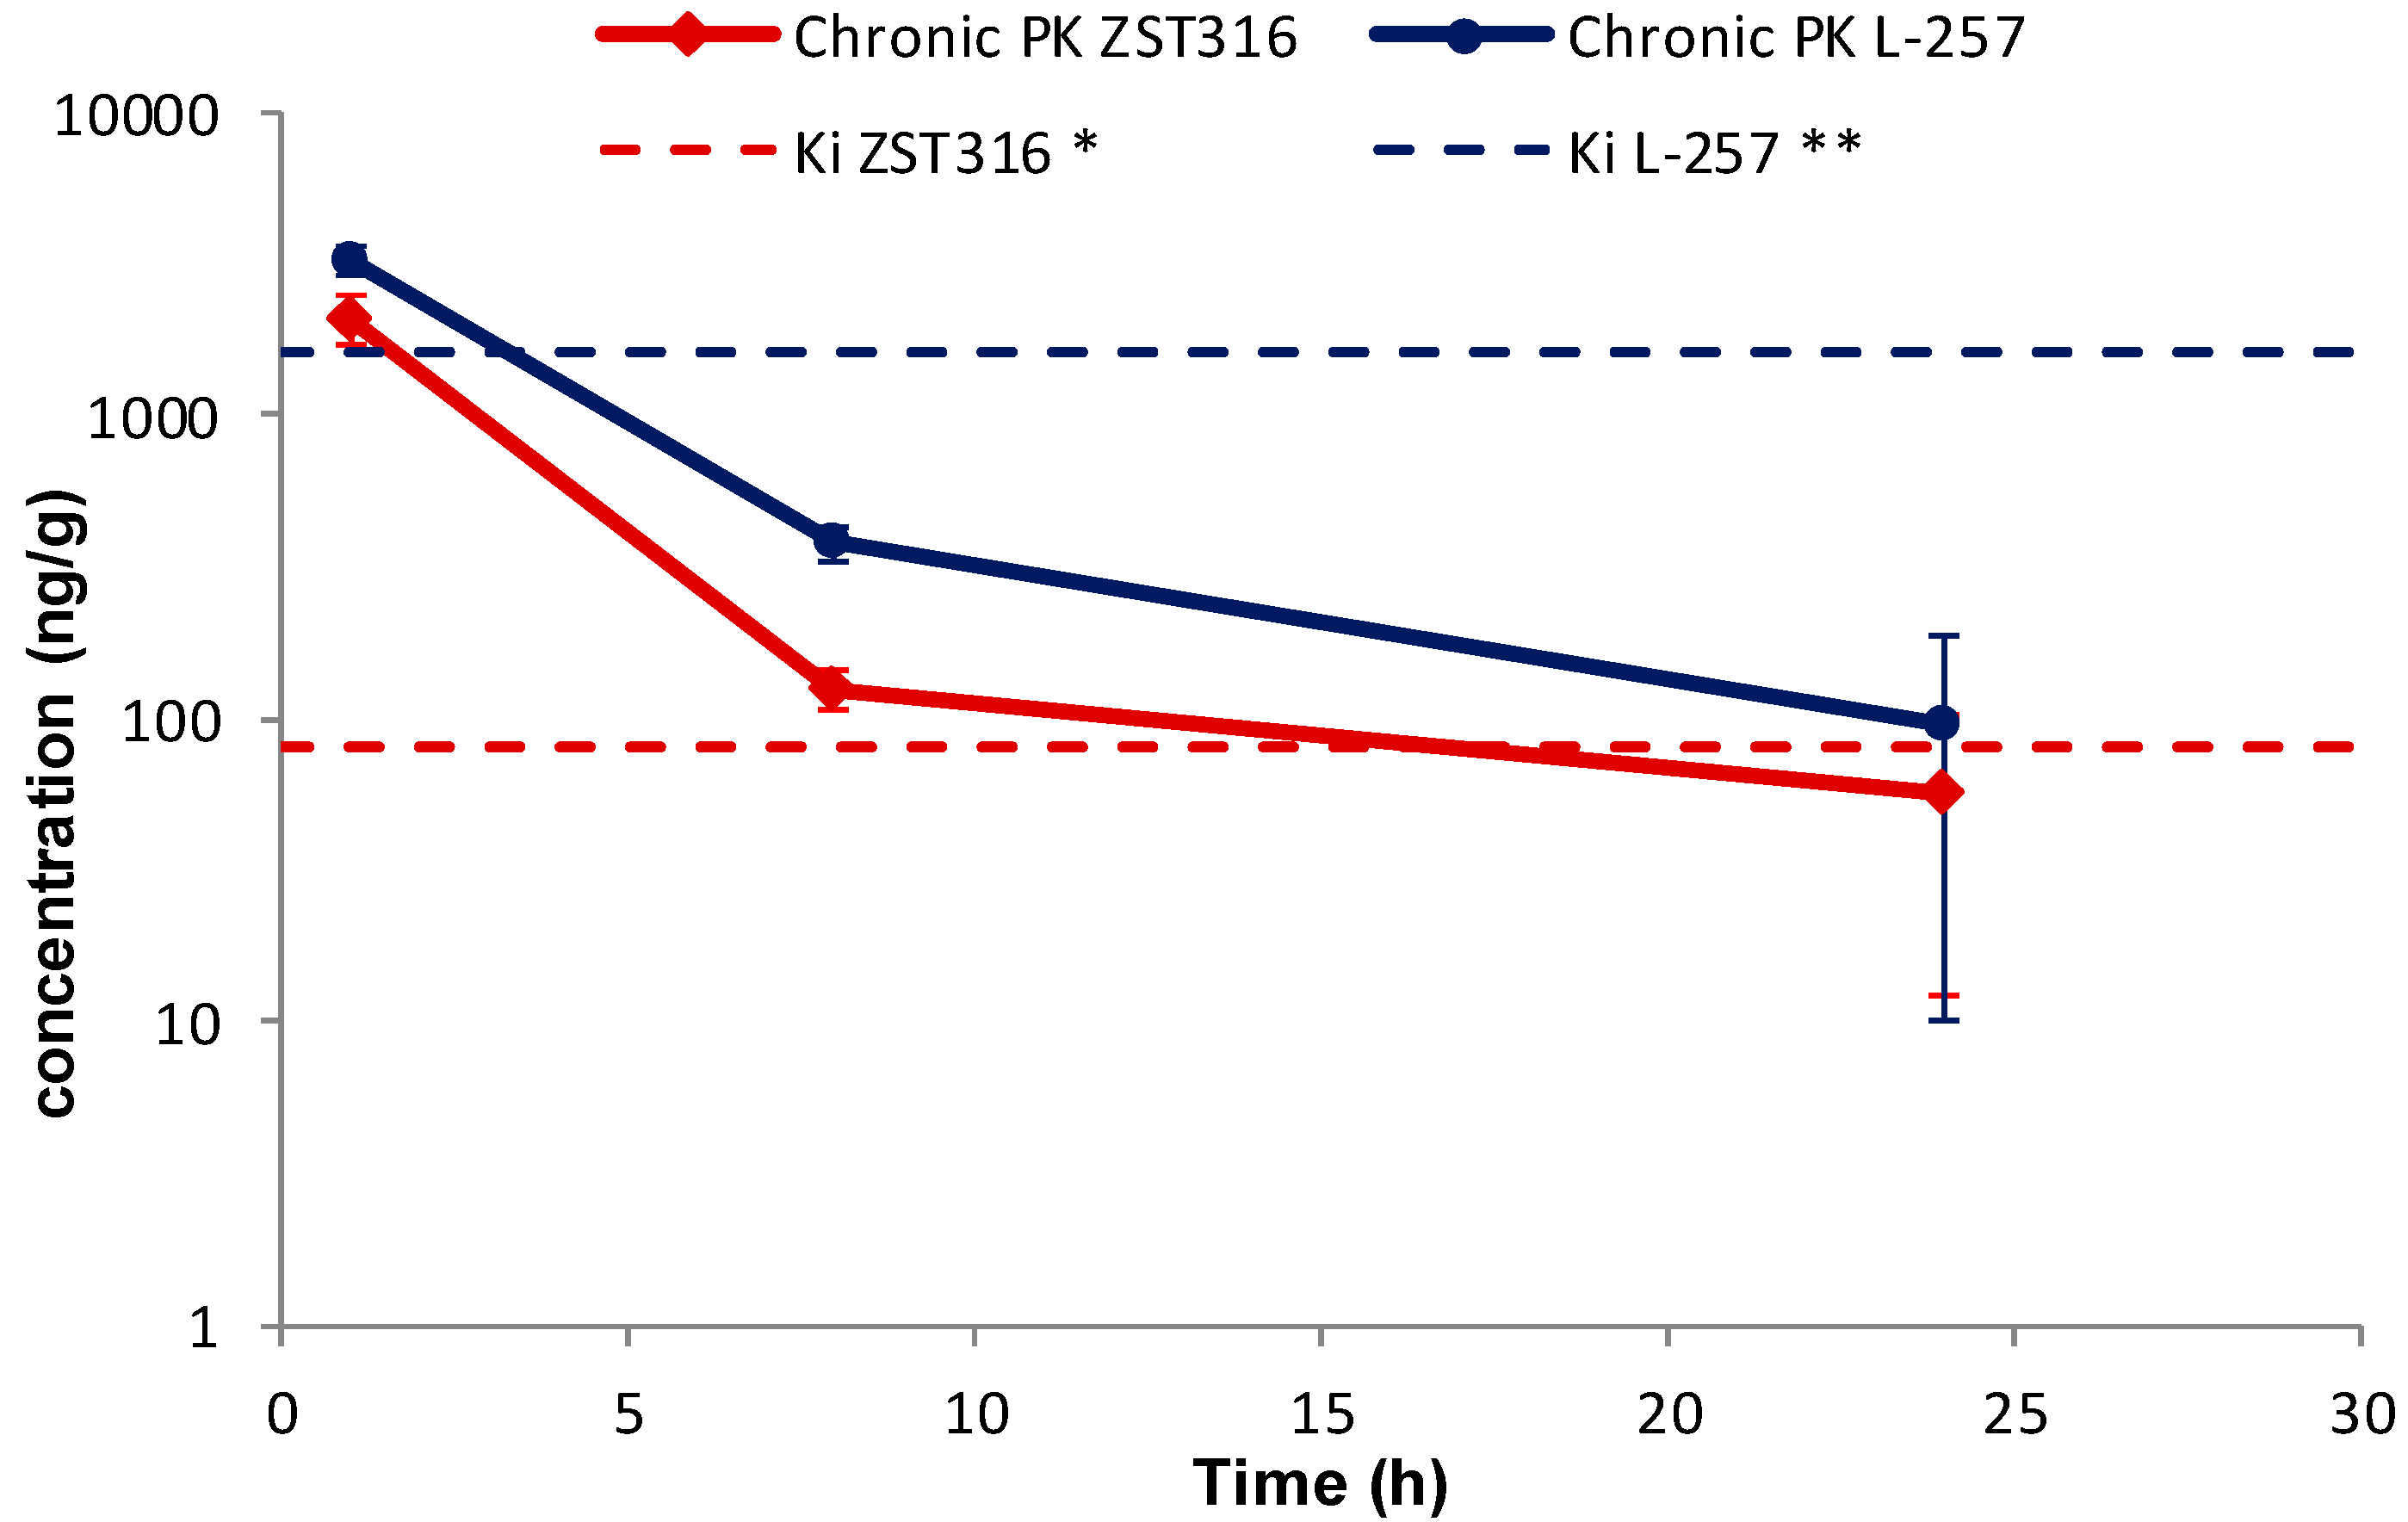
2.2.2. Chronic Treatment with ZST316
3. Materials and Methods
3.1. Compounds
3.2. Pharmacokinetic Study
3.3. Analytical Method Development
3.3.1. Preparation of Standard and Quality Control Plasma Samples
3.3.2. Extraction Procedure for ZST316 and L-257 in Plasma
3.3.3. Stability of ZST316 and L-257 in Frozen Plasma
3.3.4. Preparation of Standard and Quality Control Tumour Samples
3.3.5. Extraction Procedure for ZST316 and L-257 in Homogenate Tumour Study Samples, Standards, and Quality Controls
3.3.6. Recovery of ZST316 and L-257 in Tumour Tissue
3.3.7. HPLC-MS/MS Conditions
4. Discussion
5. Conclusions
Supplementary Materials
Author Contributions
Funding
Institutional Review Board Statement
Informed Consent Statement
Data Availability Statement
Conflicts of Interest
References
- Tran, C.T.; Leiper, J.M.; Vallance, P. The DDAH/ADMA/NOS pathway. Atheroscler. Suppl. 2003, 4, 33–40. [Google Scholar] [CrossRef] [PubMed]
- Leiper, J.; Nandi, M.; Torondel, B.; Murray-Rust, J.; Malaki, M.; O’Hara, B.; Rossiter, S.; Anthony, S.; Madhani, M.; Selwood, D.; et al. Disruption of methylarginine metabolism impairs vascular homeostasis. Nat. Med. 2007, 13, 198–203. [Google Scholar] [CrossRef] [PubMed]
- Hu, X.; Atzler, D.; Xu, X.; Zhang, P.; Guo, H.; Lu, Z.; Fassett, J.; Schwedhelm, E.; Boger, R.H.; Bache, R.J.; et al. Dimethylarginine dimethylaminohydrolase-1 is the critical enzyme for degrading the cardiovascular risk factor asymmetrical dimethylarginine. Arterioscler. Thromb. Vasc. Biol. 2011, 31, 1540–1546. [Google Scholar] [CrossRef] [PubMed]
- Wadham, C.; Mangoni, A.A. Dimethylarginine dimethylaminohydrolase regulation: A novel therapeutic target in cardiovascular disease. Expert. Opin. Drug Metab. Toxicol. 2009, 5, 303–319. [Google Scholar] [CrossRef]
- Mangoni, A.A.; Rodionov, R.N.; McEvoy, M.; Zinellu, A.; Carru, C.; Sotgia, S. New horizons in arginine metabolism, ageing and chronic disease states. Age Ageing 2019, 48, 776–782. [Google Scholar] [CrossRef]
- Jarzebska, N.; Mangoni, A.A.; Martens-Lobenhoffer, J.; Bode-Boger, S.M.; Rodionov, R.N. The Second Life of Methylarginines as Cardiovascular Targets. Int. J. Mol. Sci. 2019, 20, 4592. [Google Scholar] [CrossRef]
- Mangoni, A.A.; Tommasi, S.; Sotgia, S.; Zinellu, A.; Paliogiannis, P.; Piga, M.; Cauli, A.; Pintus, G.; Carru, C.; Erre, G.L. Asymmetric Dimethylarginine: A Key Player in the Pathophysiology of Endothelial Dysfunction, Vascular Inflammation and Atherosclerosis in Rheumatoid Arthritis? Curr. Pharm. Des. 2021, 27, 2131–2140. [Google Scholar] [CrossRef]
- Ragavan, V.N.; Nair, P.C.; Jarzebska, N.; Angom, R.S.; Ruta, L.; Bianconi, E.; Grottelli, S.; Tararova, N.D.; Ryazanskiy, D.; Lentz, S.R.; et al. A multicentric consortium study demonstrates that dimethylarginine dimethylaminohydrolase 2 is not a dimethylarginine dimethylaminohydrolase. Nat. Commun. 2023, 14, 3392. [Google Scholar] [CrossRef]
- Dayoub, H.; Rodionov, R.N.; Lynch, C.; Cooke, J.P.; Arning, E.; Bottiglieri, T.; Lentz, S.R.; Faraci, F.M. Overexpression of dimethylarginine dimethylaminohydrolase inhibits asymmetric dimethylarginine-induced endothelial dysfunction in the cerebral circulation. Stroke 2008, 39, 180–184. [Google Scholar] [CrossRef]
- Rodionov, R.N.; Dayoub, H.; Lynch, C.M.; Wilson, K.M.; Stevens, J.W.; Murry, D.J.; Kimoto, M.; Arning, E.; Bottiglieri, T.; Cooke, J.P.; et al. Overexpression of dimethylarginine dimethylaminohydrolase protects against cerebral vascular effects of hyperhomocysteinemia. Circ. Res. 2010, 106, 551–558. [Google Scholar] [CrossRef]
- Kopaliani, I.; Jarzebska, N.; Billoff, S.; Kolouschek, A.; Martens-Lobenhoffer, J.; Bornstein, S.R.; Bode-Boger, S.M.; Ragavan, V.N.; Weiss, N.; Mangoni, A.A.; et al. Overexpression of dimethylarginine dimethylaminohydrolase 1 protects from angiotensin II-induced cardiac hypertrophy and vascular remodeling. Am. J. Physiol. Heart Circ. Physiol. 2021, 321, H825–H838. [Google Scholar] [CrossRef] [PubMed]
- Wang, Y.; Hu, S.; Gabisi, A.M., Jr.; Er, J.A.; Pope, A.; Burstein, G.; Schardon, C.L.; Cardounel, A.J.; Ekmekcioglu, S.; Fast, W. Developing an irreversible inhibitor of human DDAH-1, an enzyme upregulated in melanoma. ChemMedChem 2014, 9, 792–797. [Google Scholar] [CrossRef] [PubMed]
- Buijs, N.; Oosterink, J.E.; Jessup, M.; Schierbeek, H.; Stolz, D.B.; Houdijk, A.P.; Geller, D.A.; van Leeuwen, P.A. A new key player in VEGF-dependent angiogenesis in human hepatocellular carcinoma: Dimethylarginine dimethylaminohydrolase 1. Angiogenesis 2017, 20, 557–565. [Google Scholar] [CrossRef] [PubMed]
- Reddy, K.R.K.; Dasari, C.; Duscharla, D.; Supriya, B.; Ram, N.S.; Surekha, M.V.; Kumar, J.M.; Ummanni, R. Dimethylarginine dimethylaminohydrolase-1 (DDAH1) is frequently upregulated in prostate cancer, and its overexpression conveys tumor growth and angiogenesis by metabolizing asymmetric dimethylarginine (ADMA). Angiogenesis 2018, 21, 79–94. [Google Scholar] [CrossRef] [PubMed]
- Papaevangelou, E.; Boult, J.K.R.; Whitley, G.S.; Robinson, S.P.; Howe, F.A. Assessment of the direct effects of DDAH I on tumour angiogenesis in vivo. Angiogenesis 2018, 21, 737–749. [Google Scholar] [CrossRef] [PubMed]
- Leiper, J.; Nandi, M. The therapeutic potential of targeting endogenous inhibitors of nitric oxide synthesis. Nat. Rev. Drug Discov. 2011, 10, 277–291. [Google Scholar] [CrossRef] [PubMed]
- Wang, Z.; Lambden, S.; Taylor, V.; Sujkovic, E.; Nandi, M.; Tomlinson, J.; Dyson, A.; McDonald, N.; Caddick, S.; Singer, M.; et al. Pharmacological inhibition of DDAH1 improves survival, haemodynamics and organ function in experimental septic shock. Biochem. J. 2014, 460, 309–316. [Google Scholar] [CrossRef]
- Murphy, R.B.; Tommasi, S.; Lewis, B.C.; Mangoni, A.A. Inhibitors of the Hydrolytic Enzyme Dimethylarginine Dimethylaminohydrolase (DDAH): Discovery, Synthesis and Development. Molecules 2016, 21, 615. [Google Scholar] [CrossRef]
- Hulin, J.A.; Tommasi, S.; Elliot, D.; Hu, D.G.; Lewis, B.C.; Mangoni, A.A. MiR-193b regulates breast cancer cell migration and vasculogenic mimicry by targeting dimethylarginine dimethylaminohydrolase 1. Sci. Rep. 2017, 7, 13996. [Google Scholar] [CrossRef]
- Hulin, J.A.; Gubareva, E.A.; Jarzebska, N.; Rodionov, R.N.; Mangoni, A.A.; Tommasi, S. Inhibition of Dimethylarginine Dimethylaminohydrolase (DDAH) Enzymes as an Emerging Therapeutic Strategy to Target Angiogenesis and Vasculogenic Mimicry in Cancer. Front. Oncol. 2019, 9, 1455. [Google Scholar] [CrossRef]
- Zolner, J.; Lambden, S.; Nasri, N.M.; Johnson, M.R.; Leiper, J. Inhibition of Dimethylarginine Dimethylaminohydrolase 1 Improves the Outcome of Sepsis in Pregnant Mice. Shock 2020, 54, 498–506. [Google Scholar] [CrossRef] [PubMed]
- Tommasi, S.; Zanato, C.; Lewis, B.C.; Nair, P.C.; Dall’Angelo, S.; Zanda, M.; Mangoni, A.A. Arginine analogues incorporating carboxylate bioisosteric functions are micromolar inhibitors of human recombinant DDAH-1. Org. Biomol. Chem. 2015, 13, 11315–11330. [Google Scholar] [CrossRef]
- Hulin, J.A.; Tommasi, S.; Elliot, D.; Mangoni, A.A. Small molecule inhibition of DDAH1 significantly attenuates triple negative breast cancer cell vasculogenic mimicry in vitro. Biomed. Pharmacother. 2019, 111, 602–612. [Google Scholar] [CrossRef] [PubMed]
- Morales-Guadarrama, G.; Garcia-Becerra, R.; Mendez-Perez, E.A.; Garcia-Quiroz, J.; Avila, E.; Diaz, L. Vasculogenic Mimicry in Breast Cancer: Clinical Relevance and Drivers. Cells 2021, 10, 1758. [Google Scholar] [CrossRef] [PubMed]
- Andreucci, E.; Peppicelli, S.; Ruzzolini, J.; Bianchini, F.; Calorini, L. Physicochemical aspects of the tumour microenvironment as drivers of vasculogenic mimicry. Cancer Metastasis Rev. 2022, 41, 935–951. [Google Scholar] [CrossRef] [PubMed]
- Chavoshi, H.; Poormolaie, N.; Vahedian, V.; Kazemzadeh, H.; Mir, A.; Nejabati, H.R.; Behroozi, J.; Isazadeh, A.; Hajezimian, S.; Nouri, M.; et al. Vascular mimicry: A potential therapeutic target in breast cancer. Pathol. Res. Pract. 2022, 234, 153922. [Google Scholar] [CrossRef] [PubMed]
- Dudley, A.C.; Griffioen, A.W. Pathological angiogenesis: Mechanisms and therapeutic strategies. Angiogenesis 2023, 26, 313–347. [Google Scholar] [CrossRef]
- Ma, X.; Geng, Z.; Wang, S.; Yu, Z.; Liu, T.; Guan, S.; Du, S.; Zhu, C. The driving mechanism and targeting value of mimicry between vascular endothelial cells and tumor cells in tumor progression. Biomed. Pharmacother. 2023, 165, 115029. [Google Scholar] [CrossRef]
- Mangoni, A.A.; Hulin, J.-A.; Weerakoon, L.; Tommasi, S. Targeting dimethylarginine dimethylaminohydrolase 1 to suppress vasculogenic mimicry in breast cancer: Current evidence and future directions. In Nitric Oxide in Health and Disease; Cambridge University Press: Cambridge, UK, 2023; pp. 117–133. [Google Scholar]
- Tommasi, S.; Elliot, D.J.; Hulin, J.A.; Lewis, B.C.; McEvoy, M.; Mangoni, A.A. Human dimethylarginine dimethylaminohydrolase 1 inhibition by proton pump inhibitors and the cardiovascular risk marker asymmetric dimethylarginine: In vitro and in vivo significance. Sci. Rep. 2017, 7, 2871. [Google Scholar] [CrossRef]
- Mangoni, A.A.; Ceruti, T.; Frapolli, R.; Russo, M.; Fichera, S.; Zucchetti, M.; Tommasi, S. Pharmacokinetic Characterization of the DDAH1 Inhibitors ZST316 and ZST152 in Mice Using a HPLC-MS/MS Method. Molecules 2022, 27, 1017. [Google Scholar] [CrossRef]
- Rossiter, S.; Smith, C.L.; Malaki, M.; Nandi, M.; Gill, H.; Leiper, J.M.; Vallance, P.; Selwood, D.L. Selective substrate-based inhibitors of mammalian dimethylarginine dimethylaminohydrolase. J. Med. Chem. 2005, 48, 4670–4678. [Google Scholar] [CrossRef]
- European Medicine Agency. Guideline on Bioanalytical Method Validation; European Medicine Agency: London, UK, 2011; pp. 1–23. [Google Scholar]
- Food and Drug Administration. Bioanalytical Method Validation—Guidance for Industry; Office of Communications, Division of Drug Information Center for Drug Evaluation and Research; Food and Drug Administration: Silver Spring, MD, USA, 2018; pp. 1–41. [Google Scholar]
- Holen, I.; Speirs, V.; Morrissey, B.; Blyth, K. In vivo models in breast cancer research: Progress, challenges and future directions. Dis. Models Mech. 2017, 10, 359–371. [Google Scholar] [CrossRef]
- Park, M.K.; Lee, C.H.; Lee, H. Mouse models of breast cancer in preclinical research. Lab. Anim. Res. 2018, 34, 160–165. [Google Scholar] [CrossRef] [PubMed]
- Roarty, K.; Echeverria, G.V. Laboratory Models for Investigating Breast Cancer Therapy Resistance and Metastasis. Front. Oncol. 2021, 11, 645698. [Google Scholar] [CrossRef] [PubMed]
- Nakamura, A.; Yamada, T.; Asaki, T. Synthesis and evaluation of N-acylsulfonamide and N-acylsulfonylurea prodrugs of a prostacyclin receptor agonist. Bioorg. Med. Chem. 2007, 15, 7720–7725. [Google Scholar] [CrossRef] [PubMed]
- Doman, A.J.; Tommasi, S.; Perkins, M.V.; McKinnon, R.A.; Mangoni, A.A.; Nair, P.C. Chemical similarities and differences among inhibitors of nitric oxide synthase, arginase and dimethylarginine dimethylaminohydrolase-1: Implications for the design of novel enzyme inhibitors modulating the nitric oxide pathway. Bioorg. Med. Chem. 2022, 72, 116970. [Google Scholar] [CrossRef]
- Steiner, K.; Schwab, H. Recent advances in rational approaches for enzyme engineering. Comput. Struct. Biotechnol. J. 2012, 2, e201209010. [Google Scholar] [CrossRef]


| ZST316 | L-257 | |||||
|---|---|---|---|---|---|---|
| Actual concentration (ng/mL) | 15.0 | 75.0 | 250.0 | 15.0 | 75.0 | 250.0 |
| Mean concentration (ng/mL) | 15.1 | 71.6 | 257.7 | 14.7 | 75.2 | 259.3 |
| Accuracy (%) | 100.7 | 95.5 | 103.1 | 98.0 | 100.3 | 103.7 |
| Precision (%) | 7.6 | 9.9 | 7.8 | 2.4 | 2.1 | 5.3 |
| # N | 3 | 3 | 3 | 3 | 3 | 3 |
| ZST316 | L-257 | |||||||||||
|---|---|---|---|---|---|---|---|---|---|---|---|---|
| Fresh (T0) | Stability −20 °C | Fresh (T0) | Stability −20 °C | |||||||||
| Actual value (ng/mL) | 15.00 | 75.00 | 250.00 | 15.00 | 75.00 | 250.00 | 15.00 | 75.00 | 250.00 | 15.00 | 75.00 | 250.00 |
| Found value (ng/mL) | 13 | 68.3 | 244 | 14.2 | 70.7 | 234.5 | 16 | 74.9 | 265 | 15.5 | 77.1 | 263.5 |
| 12.8 | 69.2 | 258 | 14.6 | 75.0 | 234.1 | 14.9 | 83 | 262 | 15.7 | 75.5 | 242.0 | |
| 13.6 | 73 | 245 | 14.1 | 71.5 | 251.3 | 16.4 | 81.8 | 256 | 16.3 | 74.6 | 273.1 | |
| N | 3 | 3 | 3 | 3 | 3 | 3 | 3 | 3 | 3 | 3 | 3 | 3 |
| Mean | 13.1 | 70.2 | 249.0 | 14.3 | 72.4 | 240.0 | 15.8 | 79.9 | 261.0 | 15.8 | 75.7 | 259.5 |
| SD | 0.42 | 2.49 | 7.81 | 0.24 | 2.25 | 9.81 | 0.78 | 4.37 | 4.58 | 0.37 | 1.25 | 15.92 |
| Precision (%) | 3.17 | 3.56 | 3.14 | 1.68 | 3.11 | 4.09 | 4.93 | 5.47 | 1.76 | 2.34 | 1.65 | 6.14 |
| Accuracy (%) | 87.6 | 93.6 | 99.6 | 95.4 | 96.5 | 96.0 | 105.1 | 106.5 | 104.4 | 105.6 | 101.0 | 103.8 |
| QC 75 ng/g | QC 375 ng/g | QC 1250 ng/g | |
|---|---|---|---|
| Sample No. | Recovery % | ||
| 1 | 86.5 | 112.6 | 95.6 |
| 2 | 81.8 | 98.0 | 86.9 |
| 3 | 86.5 | 98.6 | 84.9 |
| 4 | 89.5 | 98.7 | 82.4 |
| 5 | 77.6 | 81.7 | 85.7 |
| N | 5 | 5 | 5 |
| Mean | 84.4 | 97.9 | 87.1 |
| SD | 4.7 | 10.9 | 5.0 |
| CV% | 5.5 | 11.2 | 5.8 |
| QC 75 ng/g | QC 375 ng/g | QC 1250 ng/g | |
|---|---|---|---|
| Sample No. | Recovery% | ||
| 1 | 98.4 | 102.5 | 94.4 |
| 2 | 104.4 | 100.1 | 90.0 |
| 3 | 99.7 | 91.5 | 90.8 |
| 4 | 91.0 | 92.4 | 90.0 |
| 5 | 76.1 | 90.0 | 89.9 |
| N | 5 | 5 | 5 |
| Mean | 93.9 | 95.3 | 91.0 |
| SD | 11.1 | 5.6 | 1.9 |
| CV% | 11.8 | 5.9 | 2.1 |
| Actual concentration (ng/g) | 25.0 (LOQ) | 75.0 | 375.0 | 1250.0 |
| Mean concentration found (ng/g) | 25.7 | 81.5 | 382 | 1281 |
| Accuracy (%) | 102.7 | 108.7 | 101.8 | 102.5 |
| Precision (%) | 3.3 | 5.7 | 8.5 | 4.1 |
| Number of samples | 5 | 5 | 5 | 5 |
| Actual concentration (ng/g) | 25.0 (LOQ) | 75.0 | 375.0 | 1250.0 |
| Mean concentration found (ng/g) | 27.6 | 80.2 | 397 | 1356 |
| Accuracy (%) | 110.5 | 106.9 | 105.7 | 108.5 |
| Precision (%) | 4.6 | 6.8 | 4.4 | 3.9 |
| Number of samples | 5 | 5 | 5 | 5 |
| ZST316 Acute | ZST316 Chronic | L-257 Acute | L-257 Chronic | |
|---|---|---|---|---|
| Plasma AUC1–24 h (μg/mL·h) | 15.3 (0.050 μM/mL·h) | 12.4 (0.040 μM/mL·h) | 14.1 (0.061 μM/mL·h) | 10.3 (0.044 μM/mL·h) |
| Tumour AUC1–24 h (μg/mL·h) | 11.4 (0.037 μM/mL·h) | 11.8 (0.038 μM/mL·h) | 23.9 (0.103 μM/mL·h) | 20.3 (0.087 μM/mL·h) |
| AUCtum/AUCpl | 0.75 | 0.95 | 1.7 | 2.0 |
| Cmax plasma (μg/mL) | 2.79 (9.03 μM) | 2.22 (7.18 μM) | 2.02 (8.70 μM) | 1.60 (6.89 μM) |
| Cmax tumour (μg/g) | 2.00 (6.47 μM) | 2.09 (6.76 μM) | 3.50 (15.08 μM) | 3.24 (13.96 μM) |
| * half-life plasma (h) | 4.4 | 7.1 | 4.2 | 5.3 |
| * half-life tumour (h) | 4.5 | 5.0 | 3.6 | 4.9 |
Disclaimer/Publisher’s Note: The statements, opinions and data contained in all publications are solely those of the individual author(s) and contributor(s) and not of MDPI and/or the editor(s). MDPI and/or the editor(s) disclaim responsibility for any injury to people or property resulting from any ideas, methods, instructions or products referred to in the content. |
© 2023 by the authors. Licensee MDPI, Basel, Switzerland. This article is an open access article distributed under the terms and conditions of the Creative Commons Attribution (CC BY) license (https://creativecommons.org/licenses/by/4.0/).
Share and Cite
Ceruti, T.; Frapolli, R.; Ghilardi, C.; Decio, A.; Dellavedova, G.; Tommasi, S.; Zucchetti, M.; Mangoni, A.A. Development of a HPLC-MS/MS Method to Assess the Pharmacokinetics and Tumour Distribution of the Dimethylarginine Dimethylaminohydrolase 1 Inhibitors ZST316 and L-257 in a Xenograft Model of Triple-Negative Breast Cancer in Mice. Molecules 2023, 28, 8056. https://doi.org/10.3390/molecules28248056
Ceruti T, Frapolli R, Ghilardi C, Decio A, Dellavedova G, Tommasi S, Zucchetti M, Mangoni AA. Development of a HPLC-MS/MS Method to Assess the Pharmacokinetics and Tumour Distribution of the Dimethylarginine Dimethylaminohydrolase 1 Inhibitors ZST316 and L-257 in a Xenograft Model of Triple-Negative Breast Cancer in Mice. Molecules. 2023; 28(24):8056. https://doi.org/10.3390/molecules28248056
Chicago/Turabian StyleCeruti, Tommaso, Roberta Frapolli, Carmen Ghilardi, Alessandra Decio, Giulia Dellavedova, Sara Tommasi, Massimo Zucchetti, and Arduino A. Mangoni. 2023. "Development of a HPLC-MS/MS Method to Assess the Pharmacokinetics and Tumour Distribution of the Dimethylarginine Dimethylaminohydrolase 1 Inhibitors ZST316 and L-257 in a Xenograft Model of Triple-Negative Breast Cancer in Mice" Molecules 28, no. 24: 8056. https://doi.org/10.3390/molecules28248056
APA StyleCeruti, T., Frapolli, R., Ghilardi, C., Decio, A., Dellavedova, G., Tommasi, S., Zucchetti, M., & Mangoni, A. A. (2023). Development of a HPLC-MS/MS Method to Assess the Pharmacokinetics and Tumour Distribution of the Dimethylarginine Dimethylaminohydrolase 1 Inhibitors ZST316 and L-257 in a Xenograft Model of Triple-Negative Breast Cancer in Mice. Molecules, 28(24), 8056. https://doi.org/10.3390/molecules28248056