Article

Study on the Influence of CaO on the Electrochemical Reduction of Fe2O3 in NaCl-CaCl2 Molten Salt

1
Key Laboratory of Modern Metallurgical Technology, Ministry of Education, College of Metallurgy and Energy, North China University of Science and Technology, Tangshan 063210, China
2
College of Mechanical Engineering, North China University of Science and Technology, Tangshan 063210, China
*
Authors to whom correspondence should be addressed.
Molecules 2023, 28(24), 8103; https://doi.org/10.3390/molecules28248103
Submission received: 27 October 2023 / Revised: 1 December 2023 / Accepted: 12 December 2023 / Published: 15 December 2023
(This article belongs to the Section Applied Chemistry)

Abstract

:
The presence of calcium-containing molten salts in the electrolysis of oxides for metal production can lead to the formation of CaO and, subsequently, the generation of intermediate products, affecting the reduction of metals. To investigate the impact of CaO on the reduction process, experiments were conducted using a Fe2O3-CaO cathode and a graphite anode in a NaCl-CaCl2 molten salt electrolyte at 800 °C. The electrochemical reduction kinetics of the intermediate product Ca2Fe2O5 were studied using cyclic voltammetry and I-t curve analysis. The phase composition and morphology of the electrolysis products were analyzed using XRD, SEM-EDS, and XPS. The experimental results demonstrate that upon addition of CaO to the Fe2O3 cathode, Ca2Fe2O5 is formed instantly in the molten salt upon the application of an electrical current. Research conducted at different voltages, combined with electrochemical analysis, indicates that the reduction steps of Ca2Fe2O5 in the NaCl-CaCl2 molten salt are as follows: Ca2Fe2O5 ⟶ Fe3O4 ⟶ FeO ⟶ Fe. The presence of CaO accelerates the electrochemical reduction rate, promoting the formation of Fe. At 0.6 V and after 600 min of electrolysis, all of the Ca2Fe2O5 is converted into Fe, coexisting with CaCO3. With an increase in the electrolysis voltage, the electrolysis product Fe particles visibly grow larger, exhibiting pronounced agglomeration effects. Under the conditions of a 1 V voltage, a study was conducted to investigate the influence of time on the reduction process of Ca2Fe2O5. Gradually, it resulted in the formation of CaFe3O5, CaFe5O7, FeO, and metallic Fe. With an increased driving force, one gram of Fe2O3-CaO mixed oxide can completely turn into metal Fe by electrolysis for 300 min.

1. Introduction

The traditional method of iron ore reduction and smelting relies on carbon thermal reduction, a process that emits a significant amount of greenhouse gases. This poses a substantial challenge to achieving carbon neutrality and peak carbon goals [1,2]. Consequently, there is widespread interest in seeking a more environmentally friendly and efficient method for iron production. Hydrogen, as the most promising clean energy source, has garnered attention as a reducing agent in metal smelting processes [3]. Its utilization in metal production is considered an effective pathway toward achieving green and sustainable development [4,5,6,7,8,9]. Furthermore, electrochemical technologies driven by low-carbon electrical energy, generated from renewable sources such as wind energy [10], nuclear energy [11], and solar energy [12], play a vital role in energy conversion. Therefore, electrochemical metallurgy, which relies on these technologies, has become a key element in the steel industry’s efforts to reduce carbon emissions [13,14,15].
The Molten Oxide Electrolysis (MOE) method involves the reduction of iron oxides to liquid metallic iron, along with the release of O2, in a molten oxide system at high temperatures, using an inert anode. However, due to the elevated process temperatures, some metals can be corroded during the anodic polarization process, making the selection of appropriate inert anodes a critical factor limiting their development [16,17]. The FFC Cambridge Process [18] proposes the use of solid TiO2 as the cathode in a CaCl2 molten salt system to electro-deoxidize and produce metallic titanium. In comparison to the MOE method, this process achieves the direct electrolytic production of metals and alloys at lower temperatures ranging from 800 °C to 850 °C [19,20]. The use of solid metal oxides as cathodes in chloride molten salts for a direct electrochemical reduction to produce elemental metals has been applied in the extraction of various metals, including Fe [21,22], Ti [23], Cr [24,25], Al [26], V [27,28], Se [29], titanium-based [30,31,32,33,34], aluminum-based alloys [35,36], high-entropy alloys [37], etc. Research has shown that the addition of a small amount of CaO to CaCl2 can significantly increase the rate of reduction and deoxidation [38,39,40]. Therefore, it is believed that the primary factor influencing the reduction process in CaCl2 molten salt is CaO. This is due to the fact that CaO dissolves in CaCl2 molten salt and enables O2− ion transport under electrolytic conditions [41]. During electrolysis, Ca2+ ions can combine with nearby O2− ions to form CaO, which can then react with metal oxides to produce intermediate phases that are subsequently reduced during the electrolysis process [42,43,44,45,46,47,48,49]. In the electrolytic production of metallic titanium in a CaCl2-NaCl mixture, CaO reacts with TiO2 to form an intermediate phase, CaTiO3. The use of sintered CaTiO3 as a precursor material has been found to reduce the electrolysis time [50,51]. However, in experiments involving the electrolytic synthesis of SiC in molten CaCl2, the interaction between SiO2 and CaO can lead to the formation of intermediate phases that are difficult to remove, thereby hindering the progress of the reaction [52]. Therefore, the influence of CaO on the formation of intermediate products and the reduction process is a topic that warrants further research.
To investigate the influence of intermediate phases generated during the electrolytic production of metals in CaCl2-containing molten salts, this study focuses on the reduction of metallic iron (Fe). Constant voltage electrolysis experiments were conducted using Fe2O3-CaO as the cathode in a NaCl-CaCl2 mixed molten salt system. The research examined the effects of electrolysis voltage and electrolysis time on the reduction behavior of Fe2O3-CaO. Through the study of the formation of the intermediate product Ca2Fe2O5 and its impact on the reduction process, in conjunction with electrochemical analysis methods, the electrode re-action mechanism was elucidated. This research aims to provide a theoretical basis for the preparation of other metals in calcium-containing molten salts.

2. Results and Discussion

2.1. Impact of Electrolysis Voltage

Voltage, acting as the driving force in the electrolysis process, exerts control over the formation of the final products and determines the thermodynamic conditions. The constant cell voltage electrolysis experiment was carried out at 800 °C by applying different voltages (0.5 V, 0.6 V, 0.8 V, 1.0 V, respectively), and the electrolysis time of each group was 600 min. The XRD (X-ray diffraction spectrum) patterns of the electrolysis products are depicted in Figure 1a. At a voltage of 0.5 V for the constant cell voltage electrolysis, the primary products of the electrolysis were CaFe5O7, accompanied by minor quantities of Ca2Fe2O5 and FeO. As the voltage for the constant cell voltage electrolysis experiment was increased, iron oxides were entirely reduced to metallic iron. The heightened driving force led to an accelerated deoxidation rate, with CO2 generated by anodic discharge dissolving in the molten salt to form CaCO3. With the application of a voltage of 1.0 V for the constant cell voltage electrolysis, Ca2Fe2O5 was completely electrolyzed, and the increased driving force allowed ample time for CO32− ions to diffuse toward the anode, resulting in metallic iron as the ultimate product. According to the experimental results in reference [21], Fe2O3 is electrolyzed to metal Fe after 600 min at an electrolytic voltage greater than 1.2 V. In comparison, the presence of CaO reduces the electrolytic driving force and speeds up the electrolytic rate. Figure 1b,c shows the SEM and EDS images of the products obtained after 600 min of electrolysis at 1.0 V, which reveal well-defined particle clusters as the predominant components, primarily consisting of metallic iron.
To clarify the phases of Ca2Fe2O5 and CaFe5O7 generated during constant-voltage electrolysis of Fe2O3-CaO at 0.5 V, Fe2O3 and prepared Fe2O3-CaO cathodes were immersed in NaCl-CaCl2 molten salt and maintained for 10 min. The XRD results are shown in Figure 2a. The results indicate that Fe2O3 does not react with the molten salt without adding CaO. However, when adding CaO, Fe2O3 primarily forms the new phase Ca2Fe2O5. During the initial stages of constant-voltage piezoelectric electrolysis of Fe2O3, Ca2Fe2O5 is formed by the chemical reaction between CaO and Fe2O3 [53]. According to the thermodynamic calculations shown in Figure 2b, it can be inferred that at 800 °C, CaO undergoes a chemical reaction with Fe2O3 to produce Ca2Fe2O5, while Fe3O4 does not react with FeO or CaO to form CaFe5O7. The presence of CaFe5O7 observed in the XRD results is likely due to the reaction of reduced Fe3O4 and FeO with CaO at room temperature.

2.2. Cyclic Voltammetry Measurements

Due to the formation of Ca2Fe2O5 from Fe2O3-CaO at 800 °C, to investigate the electrochemical reduction mechanism of Fe2O3-CaO, Fe electrodes coated with Fe2O3 and Ca2Fe2O5 were subjected to cyclic voltammetry tests in a NaCl-CaCl2 molten salt at a scan rate of 0.1 V/s, as shown in Figure 3. The dashed line in the figure represents the cyclic voltammetry curve for the blank salt, with a scanning range from −2.5 V to 0.5 V. The solid blue line represents the cyclic voltammetry curve for the FCE-Fe2O3, and three reduction peaks, denoted as R1, R2, and R3, corresponding to the three-step reduction of Fe, were observed [21]. The solid red line in the figure represents the cyclic voltammetry curve for the FCE-Ca2Fe2O5 with a scanning range from −2.0 V to −0.3 V. The reduction peaks R1’, R2’, and R3’ exhibit an overall positive shift, which is attributed to the faster reaction rate resulting from the addition of CaO. In comparison to FCE-Fe2O3, the reduction peaks in FCE-Ca2Fe2O5 appear weaker during the scan. This is because of the fact that although the electrode areas are the same, there are fewer active particles participating in the reduction reaction in FCE-Ca2Fe2O5, leading to smaller peak intensities. Additionally, narrowing the scan potential range results in a decrease in peak intensities. Combining XRD phase analysis of the products of Fe2O3-CaO at different voltages, it can be concluded that the reduction steps of Ca2Fe2O5 are as follows: Ca2Fe2O5 ⟶ Fe3O4 ⟶ FeO ⟶ Fe.

2.3. Constant Voltage Electrolysis and Phase Characterization

To further investigate the phase evolution process of CaO’s reduction of Fe2O3 during the electrolysis process, and to analyze the deoxidation kinetics, the experiment was conducted at 1.0 V for the constant cell voltage electrolysis for different durations (5~300 min). Figure 4a presents the XRD patterns of the electrolysis products. When the constant cell voltage electrolysis time ranged from 5 min to 10 min, the primary phases detected were Ca2Fe2O5, along with small amounts of CaFe3O5 and CaFe5O7. This indicates that under the applied voltage, Fe2O3 rapidly formed Ca2Fe2O5. At 30 min, FeO and Fe started to appear, while CaFe3O5 and CaFe5O7 disappeared. With the extension of the electrolysis time, the diffraction peaks of Ca2Fe2O5 gradually weakened and disappeared at 240 min. Simultaneously, the diffraction peaks of Fe intensified, and at 300 min, Fe was completely reduced to metallic Fe.
During the electrolytic reduction process of Fe2O3-CaO for iron production, Ca2Fe2O5 is initially formed. The phase evolution process leading to the reduction of metallic iron from Ca2Fe2O5 involves the intermediate phases CaFe3O5, CaFe5O7, FeO, and ultimately Fe. Based on the E-pO2 diagram of the Fe-O-Ca system shown in Figure 4b, it can be observed that at certain oxygen partial pressures, the reduction sequence of Ca2Fe2O5 in molten salt is Ca2Fe2O5 ⟶ Fe3O4 ⟶ FeO ⟶ Fe. When the oxygen partial pressure is low, Fe3O4 and FeO phases are not detected during the reduction process of Ca2Fe2O5. In Figure 4a, the absence of Fe3O4 and FeO at 5 min to 10 min of constant cell voltage electrolysis is attributed to the fact that in the early stages of electrolysis, the electrochemical reaction rate is higher than the diffusion rate of O2− to the anode. Consequently, O2− generated during electrolysis accumulates near the cathode. When the sample is removed, O2− forms CaO with Ca2+ in the molten salt. At room temperature, CaO reacts with Fe3O4 to produce CaFe3O5, and Fe3O4, FeO and CaO react to produce CaFe5O7, as shown in Figure 4b. The theoretical decomposition voltage for the reduction of Fe3O4 (−0.96 V) is lower than that for the reduction of FeO (−1.01 V). As the electrolysis time increases, Fe3O4 is reduced to FeO, and the phases CaFe3O5 and CaFe5O7 disappear. The thermodynamic calculation results of Equations (1), (3) and (5) show that the theoretical decomposition potential of Ca2Fe2O5 is higher than the theoretical decomposition potential of Fe3O4 and FeO, and the reduction rate of Ca2Fe2O5 is lower than that of Fe3O4 and FeO. Therefore, after 60~120 min of constant cell voltage electrolysis, the products are mainly Ca2Fe2O5 and Fe. The ion migration during electrolysis is shown in Figure 5a. The reaction process is shown in Equations (1)–(5).
6Ca2Fe2O5 = 4Fe3O4 + 12CaO + O2(g) E = −1.49 V, T = 800 °C
Fe3O4 + CaO = CaFe3O5 ΔGΘ = −35.08 kJ·mol−1, T = 20 °C
2Fe3O4 = 6FeO + O2(g) E = −0.96 V, T = 800 °C
Fe3O4 + 2FeO + CaO = CaFe5O7 ΔGΘ = −24.63 kJ·mol−1, T = 20 °C
2FeO = 2Fe + O2(g) E = −1.01 V, T = 800 °C
When combining the I-t curve during the electrolysis process, it can be observed that when a voltage is applied to the cathode of Fe2O3-CaO, there is an initial high current due to the double-layer charging process [36]. In the stage I, the current rapidly decreases, reflecting the fast deoxidation of Ca2Fe2O5 on the cathode surface. As the three-phase reaction interface extends toward the cathode’s interior, the diffusion of O2− to the cathode surface, hindered by the blocking effect, causes fluctuations in the current curve. In the stage Ⅱ, Fe3+ gradually reduces to Fe, and dissolved CO2 in the molten salt near the cathode reacts with O2− to form CO32−, further impeding the diffusion of O2−. Consequently, the current decreases. During the stage Ⅲ, an accumulation of O2− near the cathode increases, and the concentration gradient between the cathode and anode accelerates the diffusion rate of O2−. The electrochemical rate becomes the limiting step in the reaction, leading to an increase in slope. In the stage Ⅳ, most of the Ca2Fe2O5 has been reduced to Fe, and the reduction in active particles leads to a reduction in the removal of O2− during electrolysis, causing the current curve to level off. Figure 5c illustrates the gradual reduction process of the cathode plate along the three-phase interface towards the interior.
Figure 6 depicts SEM-EDS images and XPS analyses of the products obtained after 10 min and 300 min of constant cell voltage electrolysis. After 10 min of constant cell voltage electrolysis, the products consist of large, flat plate-like particles of Ca2Fe2O5, measuring approximately 10–20 μm in size. Surrounding these, there are smaller particles of CaFe3O5 and CaFe5O7, with sizes of around 4–5 μm. Small FeO particles are also observed on the surface of Ca2Fe2O5 particles. The XPS results in Figure 6g indicate that the peaks at binding energies of 709.0 eV and 722.4 eV correspond to Fe(Ⅱ) 2p3/2 and Fe(Ⅱ) 2p1/2, respectively, while the peaks at binding energies of 711.0 eV and 724.4 eV correspond to Fe(Ⅲ) 2p3/2 and Fe(Ⅲ) 2p1/2, respectively. This suggests that some of the Fe(Ⅲ) has been reduced to Fe(Ⅱ) after 10 min of constant cell voltage electrolysis. Upon extending the electrolysis time to 300 min, the products consist of irregular particles with sizes of around 5 μm. Agglomeration between individual grains is observed, as shown in Figure 6e,f. The results in Figure 6h reveal the presence of metallic Fe and Fe(Ⅱ) in the products obtained after 300 min of electrolysis. The presence of metallic Fe aligns with the XRD results, while the appearance of Fe(Ⅱ) can be attributed to the ease of oxidation of metallic iron particles in the presence of air [50].

3. Experimental Section and Methods

3.1. Materials and Precursor Preparation

The experiments were carried out by using analytically pure Fe2O3, CaO, NaCl and CaCl2 (Sinopharm Chemical Regent Co., Ltd., Shanghai, China, ≥99.95%). The high-purity graphite sheet (≥99.99%, 15 mm × 100 mm × 3 mm) was polished sequentially on 1000#, 1500#, and 2000# sandpaper to achieve a smooth surface, and its surface was repeatedly washed with deionized water and absolute ethanol. This process aims to minimize the detachment of carbon particles from the surface and prevent short-circuiting during the electrolysis process. A nickel wire (Φ1.5 mm) was used to connect the graphite sheet to a stainless steel conductor rod, serving as the anode. Fe2O3 and CaO (molar ratio 1:2) were mixed with 30 g of anhydrous ethanol in a ball mill. The mixture was blended at 160 r·min−1 for 300 min to achieve uniform mixing. The uniformly mixed samples were examined by XRD, and the results are shown in Figure 7. The mixture was then dried at 160 °C for 480 min to completely evaporate the anhydrous ethanol. A total of 1 g of the mixed oxide was taken and compressed into a cylindrical cathode (Φ15 mm, 1.9~2.0 mm in thickness) under a pressure of 10 MPa. The cathode was wrapped with a stainless steel mesh (1000#), and a stainless steel wire (Φ0.5 mm) was used to connect it to the stainless steel conductor rod, serving as the cathode.

3.2. Constant Voltage Electrolysis and Cyclic Voltammetry Testing

A molten salt was formulated with a molar ratio of 48:52 (NaCl-CaCl2), which had a eutectic point of 504 °C. An electrolysis temperature of 800 °C was chosen to ensure the full melting of NaCl-CaCl2 and the low viscosity and fast reaction rate of the molten salt. The mixed molten salt (180 g) was dried at 250 °C for 600 min. The molten salt was heated at a rate of 4 °C/min to the experimental temperature and held for 60 min. Subsequently, a cathode nickel foil (40 mm × 40 mm × 1 mm) and an anode high-purity graphite sheet (120 mm × 40 mm × 5 mm) were used for pre-electrolysis at a voltage of 2.8 V. The reason for pre-electrolysis is to remove the residue moisture and metallic impurities from the molten salt and to decompose oxides and other compounds such as CaOHCl [54]. The experimental process was conducted under argon atmosphere, and the schematic diagram of the electrolysis setup is shown in Figure 8. The constant voltage electrolysis experiment was carried out at 800 °C. After the electrolysis, the obtained cathodic product was subjected to ultrasonic cleaning with deionized water and vacuum drying. Finally, the product was characterized.
Cyclic voltammetry testing was performed using NaCl-CaCl2 as the electrolyte at 800 °C. A high-purity graphite sheet served as the auxiliary electrode. A Fe wire (Φ1 mm) coated electrode Fe2O3-CaO and Fe2O3 (FCE-Ca2Fe2O5, FCE-Fe2O3) was used as the working electrode. An Ag/Ag+ reference electrode was prepared by filling a mullite tube (Φ5 mm) with a molar ratio of NaCl:CaCl2:AgCl = 49:49:2 and silver wire (Φ0.5 mm, 99.99%). The experiments were conducted under argon atmosphere.

3.3. Characterization

The X-ray diffraction spectrum (XRD, X-ray 6000 with Cu Kα1 radiation λ = 1.5405 Å, scanning speed 10 °/min, Rigaku Corporation, Tokyo, Japan) was used for phase detection of the cathodic product. The microscopic morphology (SEM, JEM-2900F, Japan Electronics Co., Ltd., Tokyo, Japan) and elemental composition of the product were analyzed using a scanning electron microscope and an energy dispersive spectroscopy (EDS). X-ray photoelectron spectroscopy (XPS, Ulvac-Phi, Chigasaki, Japan) was employed to obtain information about the types of elements, the binding states of material atoms, and the distribution of charges. The equipment used for electrochemical testing was an electrochemical workstation model CHI660e (Shanghai Chenhua Co., Ltd., Shanghai, China).

4. Conclusions

By adding CaO to Fe2O3 for the preparation of a metal oxide cathode, two-electrode electrolysis experiments were conducted in NaCl-CaCl2 molten salt at 800 °C. The influence of different voltages and durations on the phase composition, morphology, and valence state of the electrolysis products was studied. Combined with three-electrode cyclic voltammetry tests, the electrochemical deoxidation and reduction mechanisms of Fe2O3 in the presence of CaO were analyzed, leading to the following conclusions:
(1)
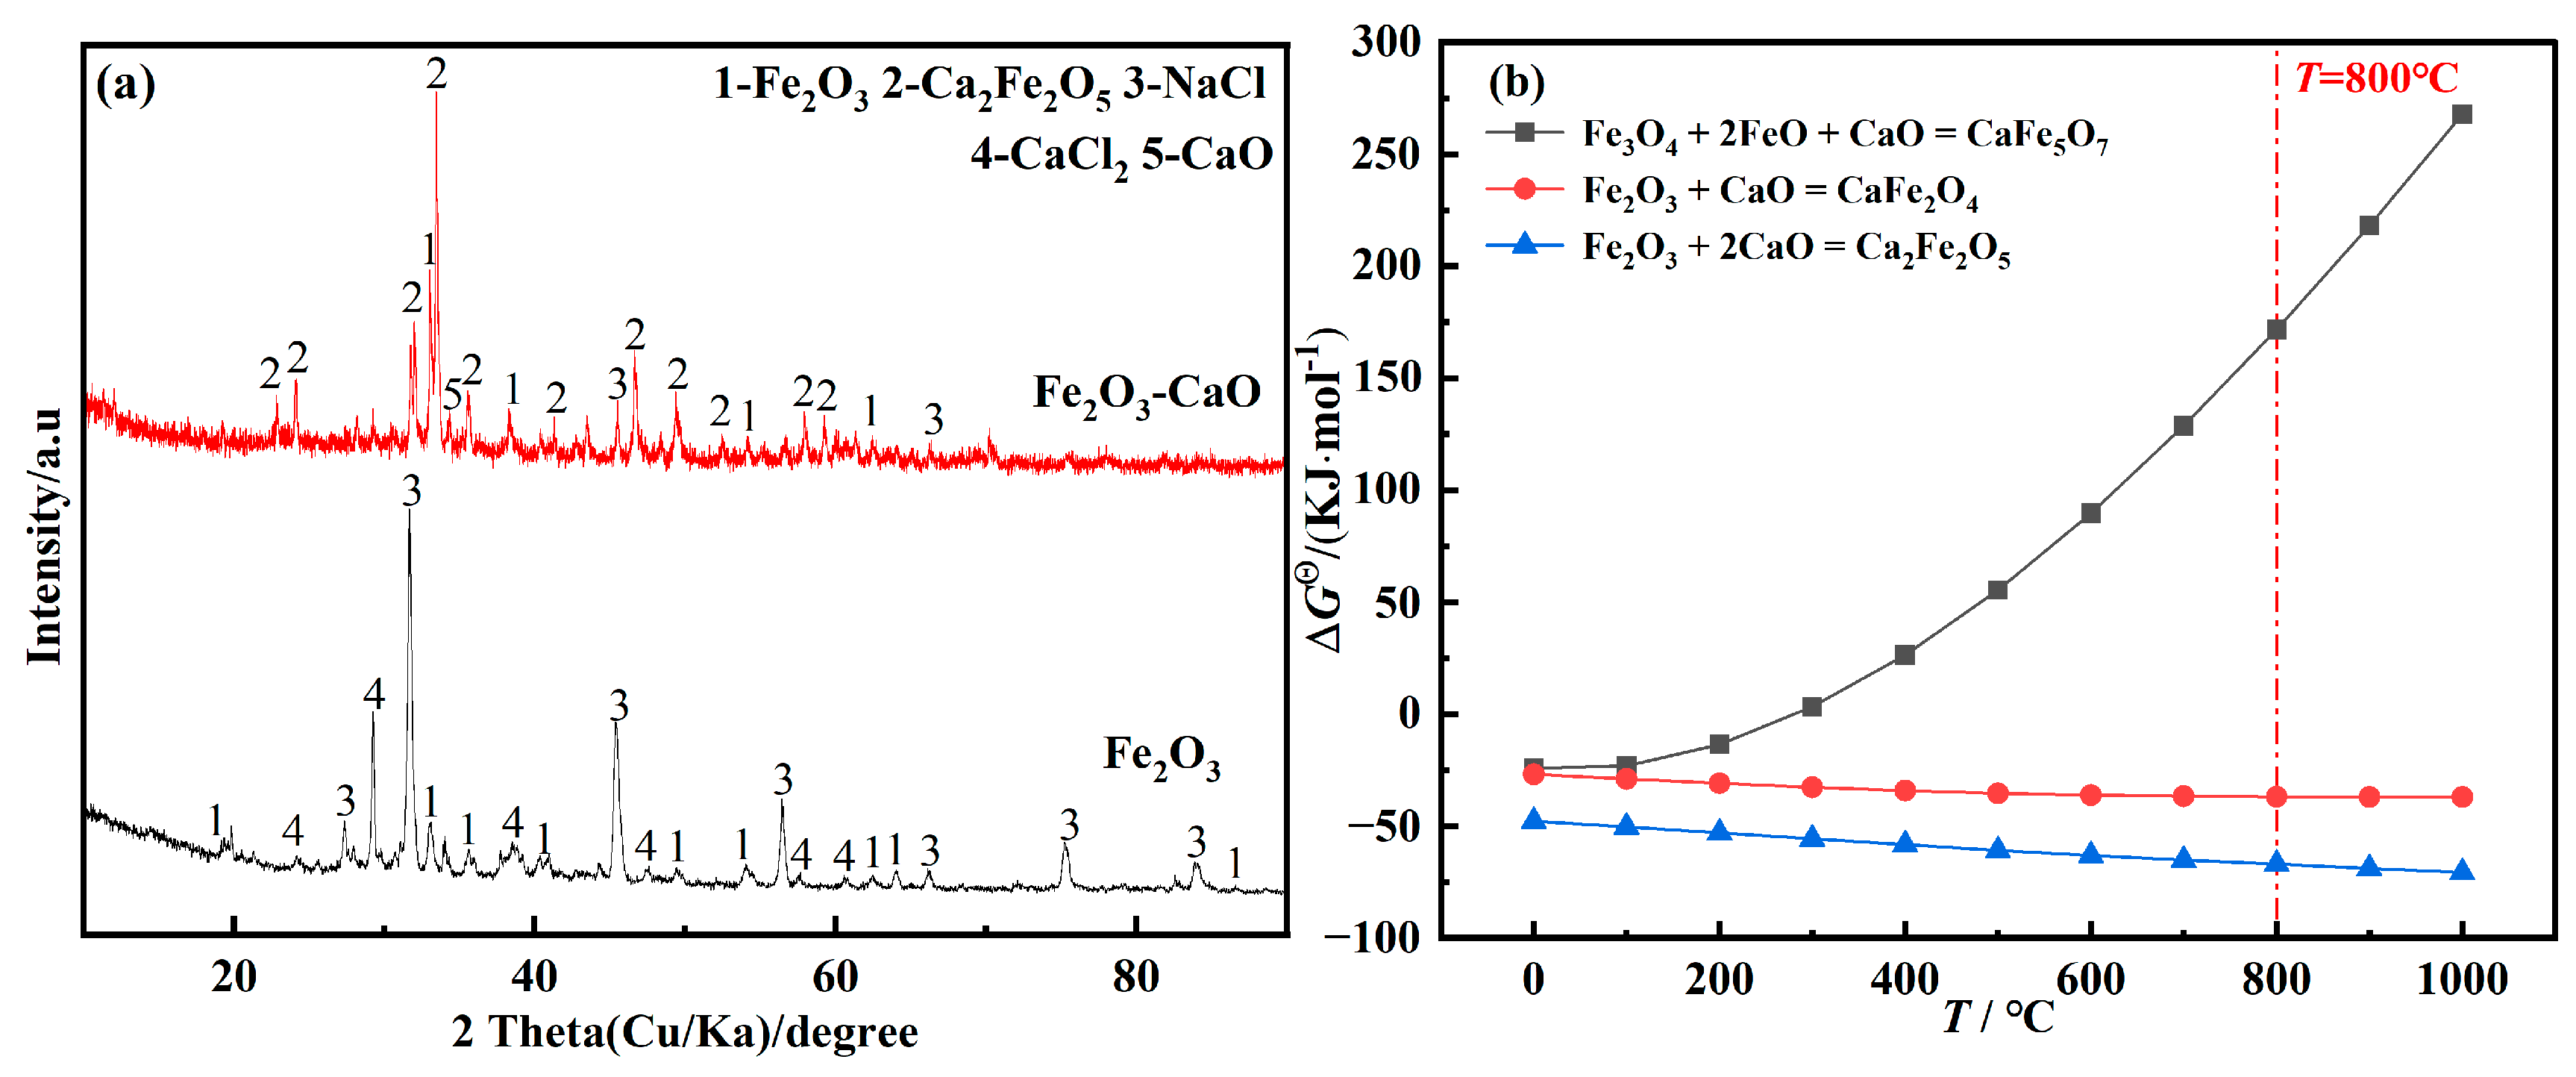
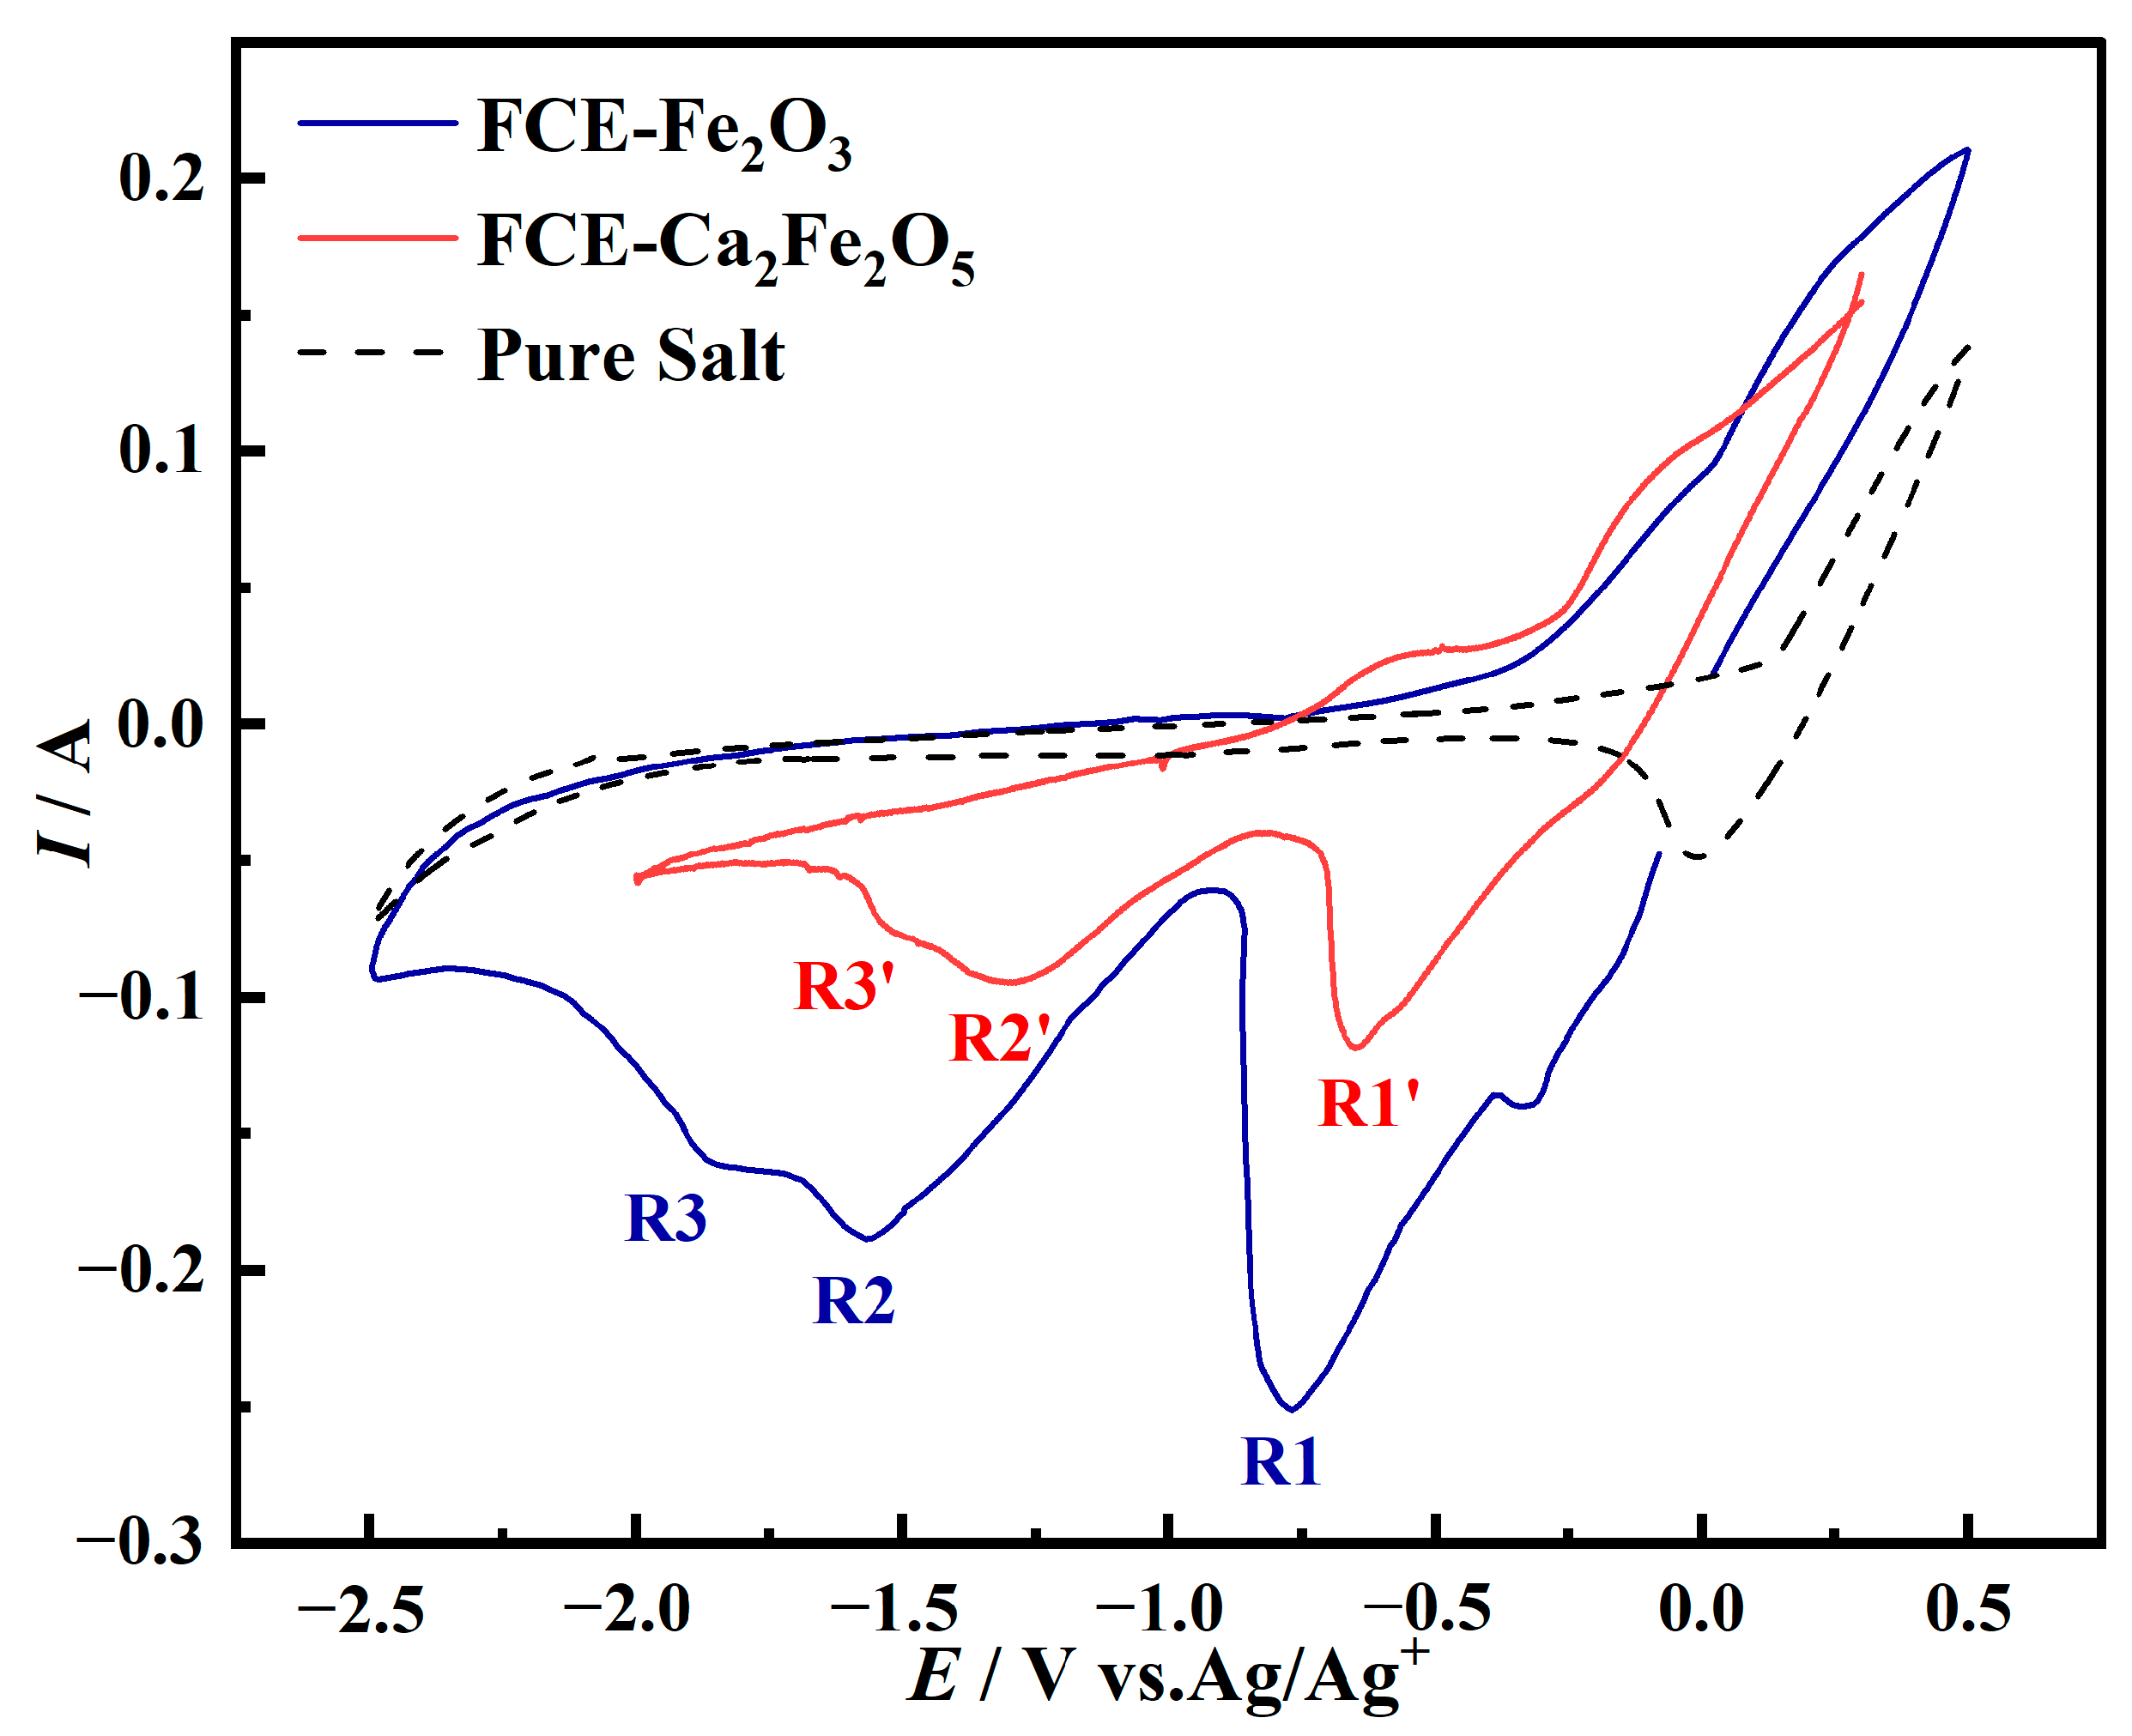
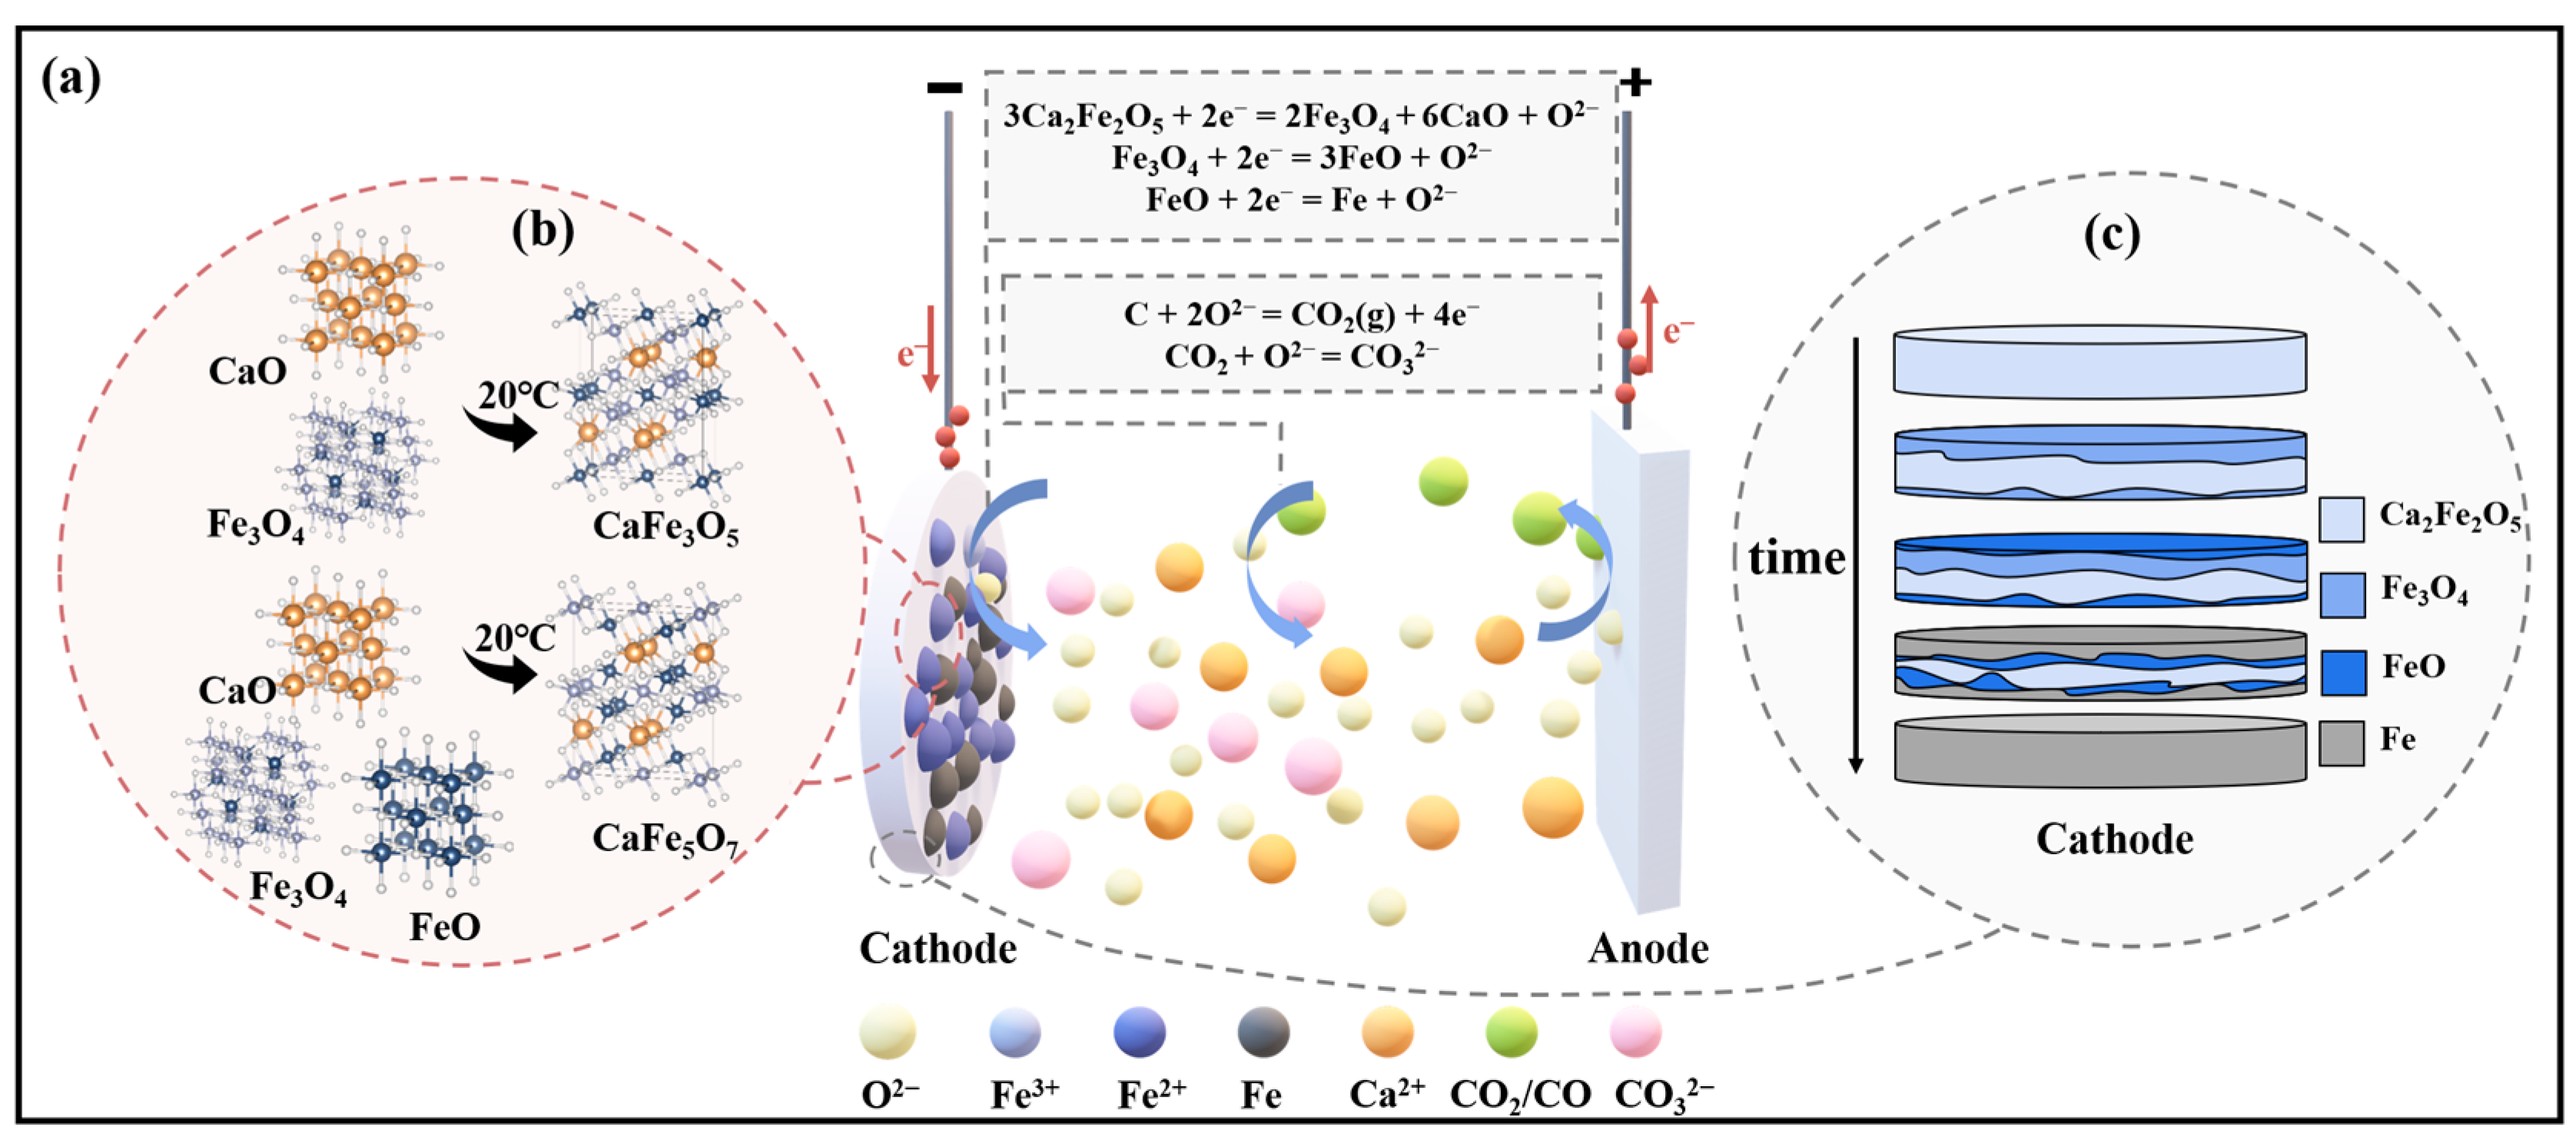
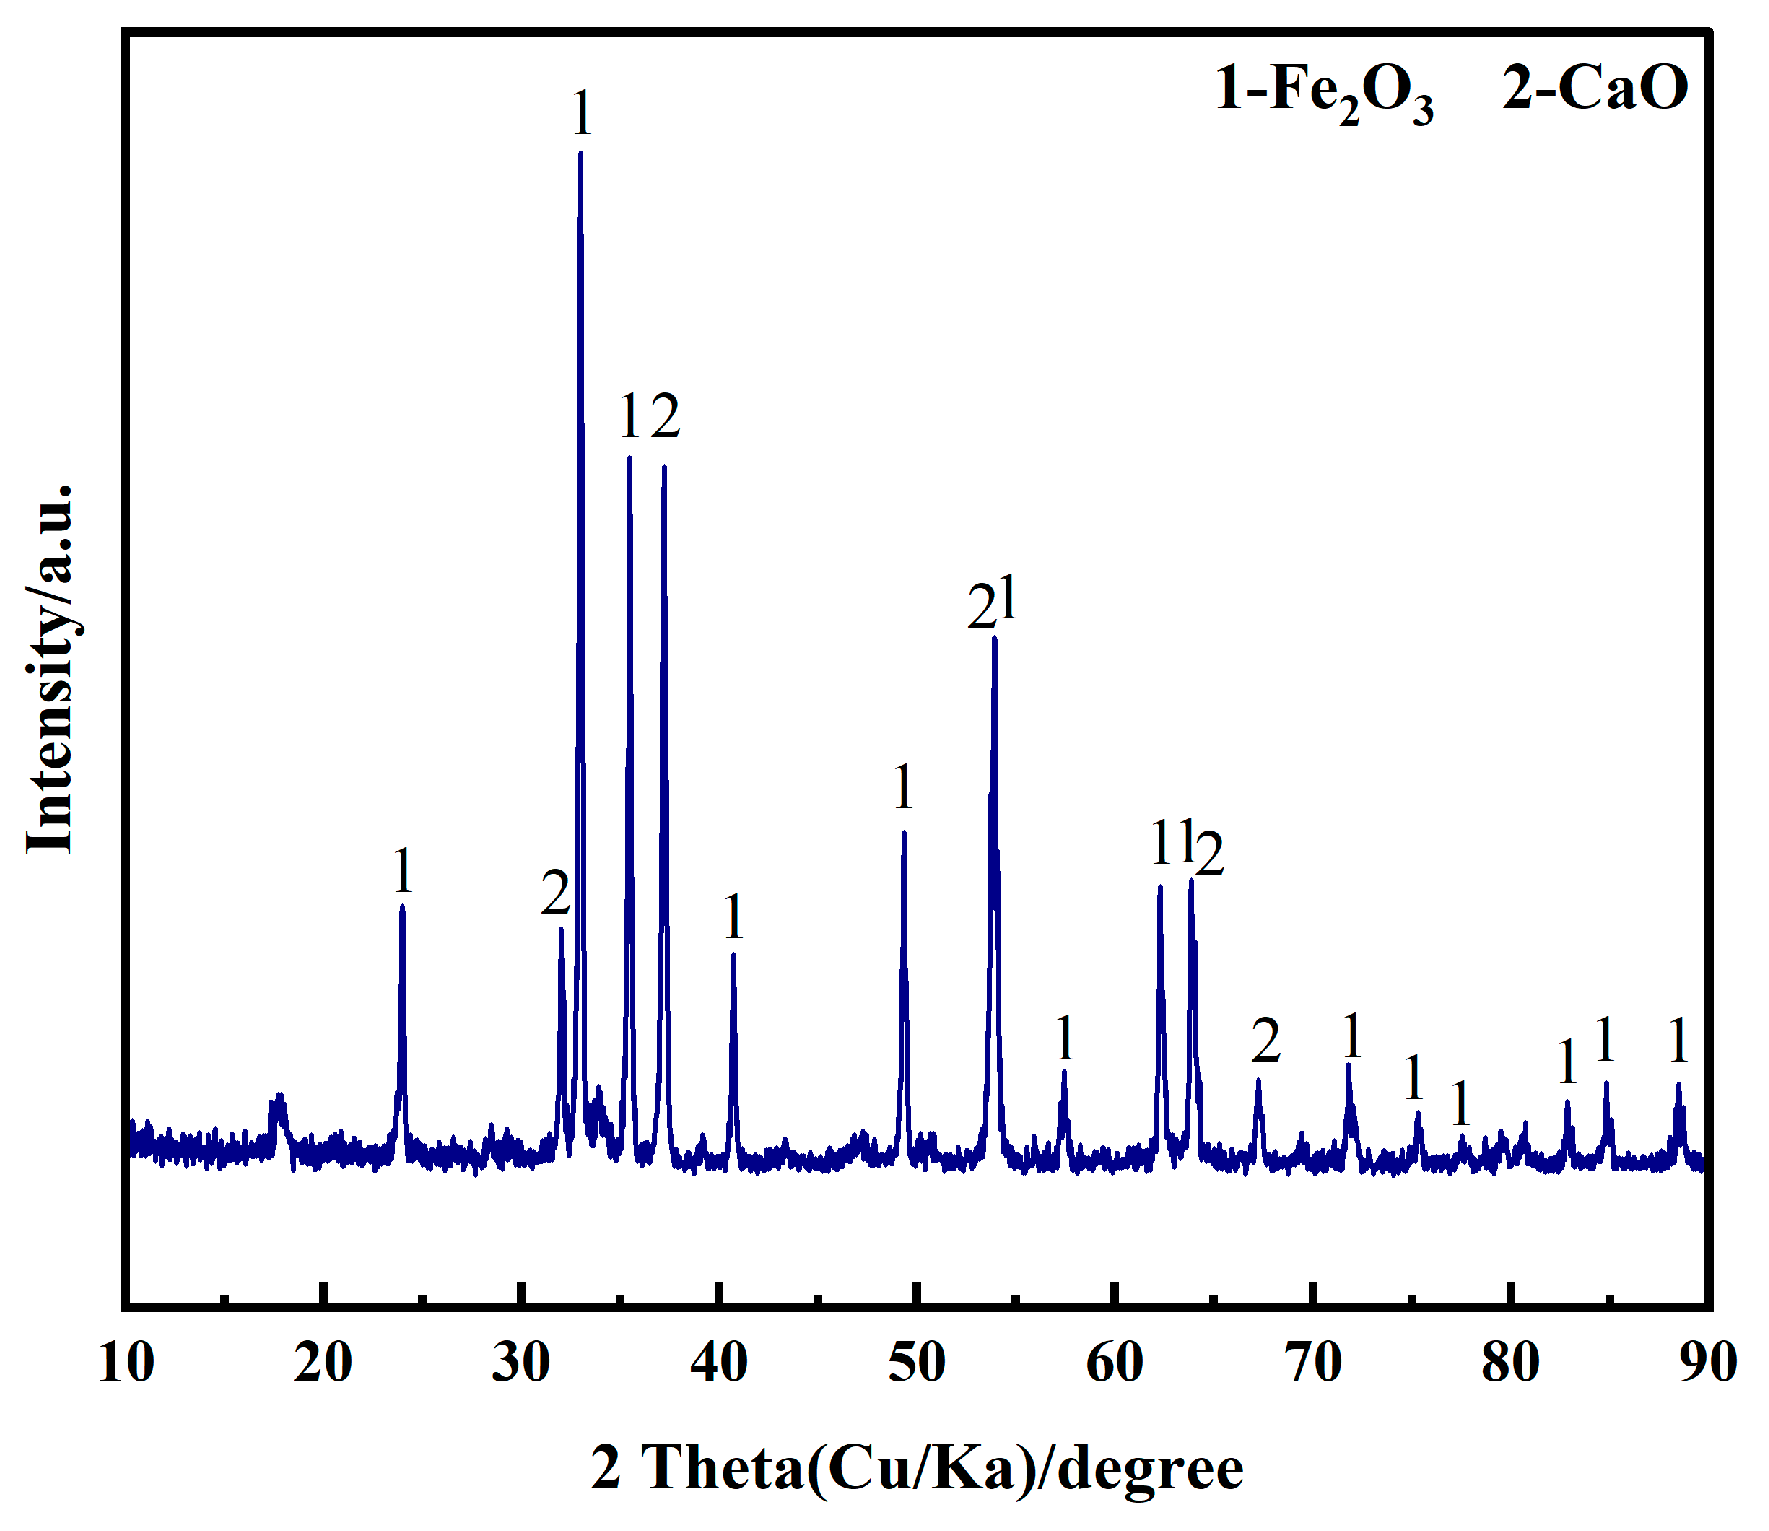
In NaCl-CaCl2 molten salt, Fe2O3 and CaO can spontaneously undergo a chemical reaction to generate Ca2Fe2O5 at 800 °C without applying electrolytic voltage. The reduction steps of Ca2Fe2O5 are Ca2Fe2O5 ⟶ Fe3O4 ⟶ FeO ⟶ Fe. Compared to the reduction of Fe2O3 alone, the addition of CaO reduces the electrolysis voltage required for the reduction to metallic Fe, facilitating the progress of the electrolysis process. Metallic Fe and CaCO3 can be generated after electrolysis at 0.6 V for 600 min.
(2)
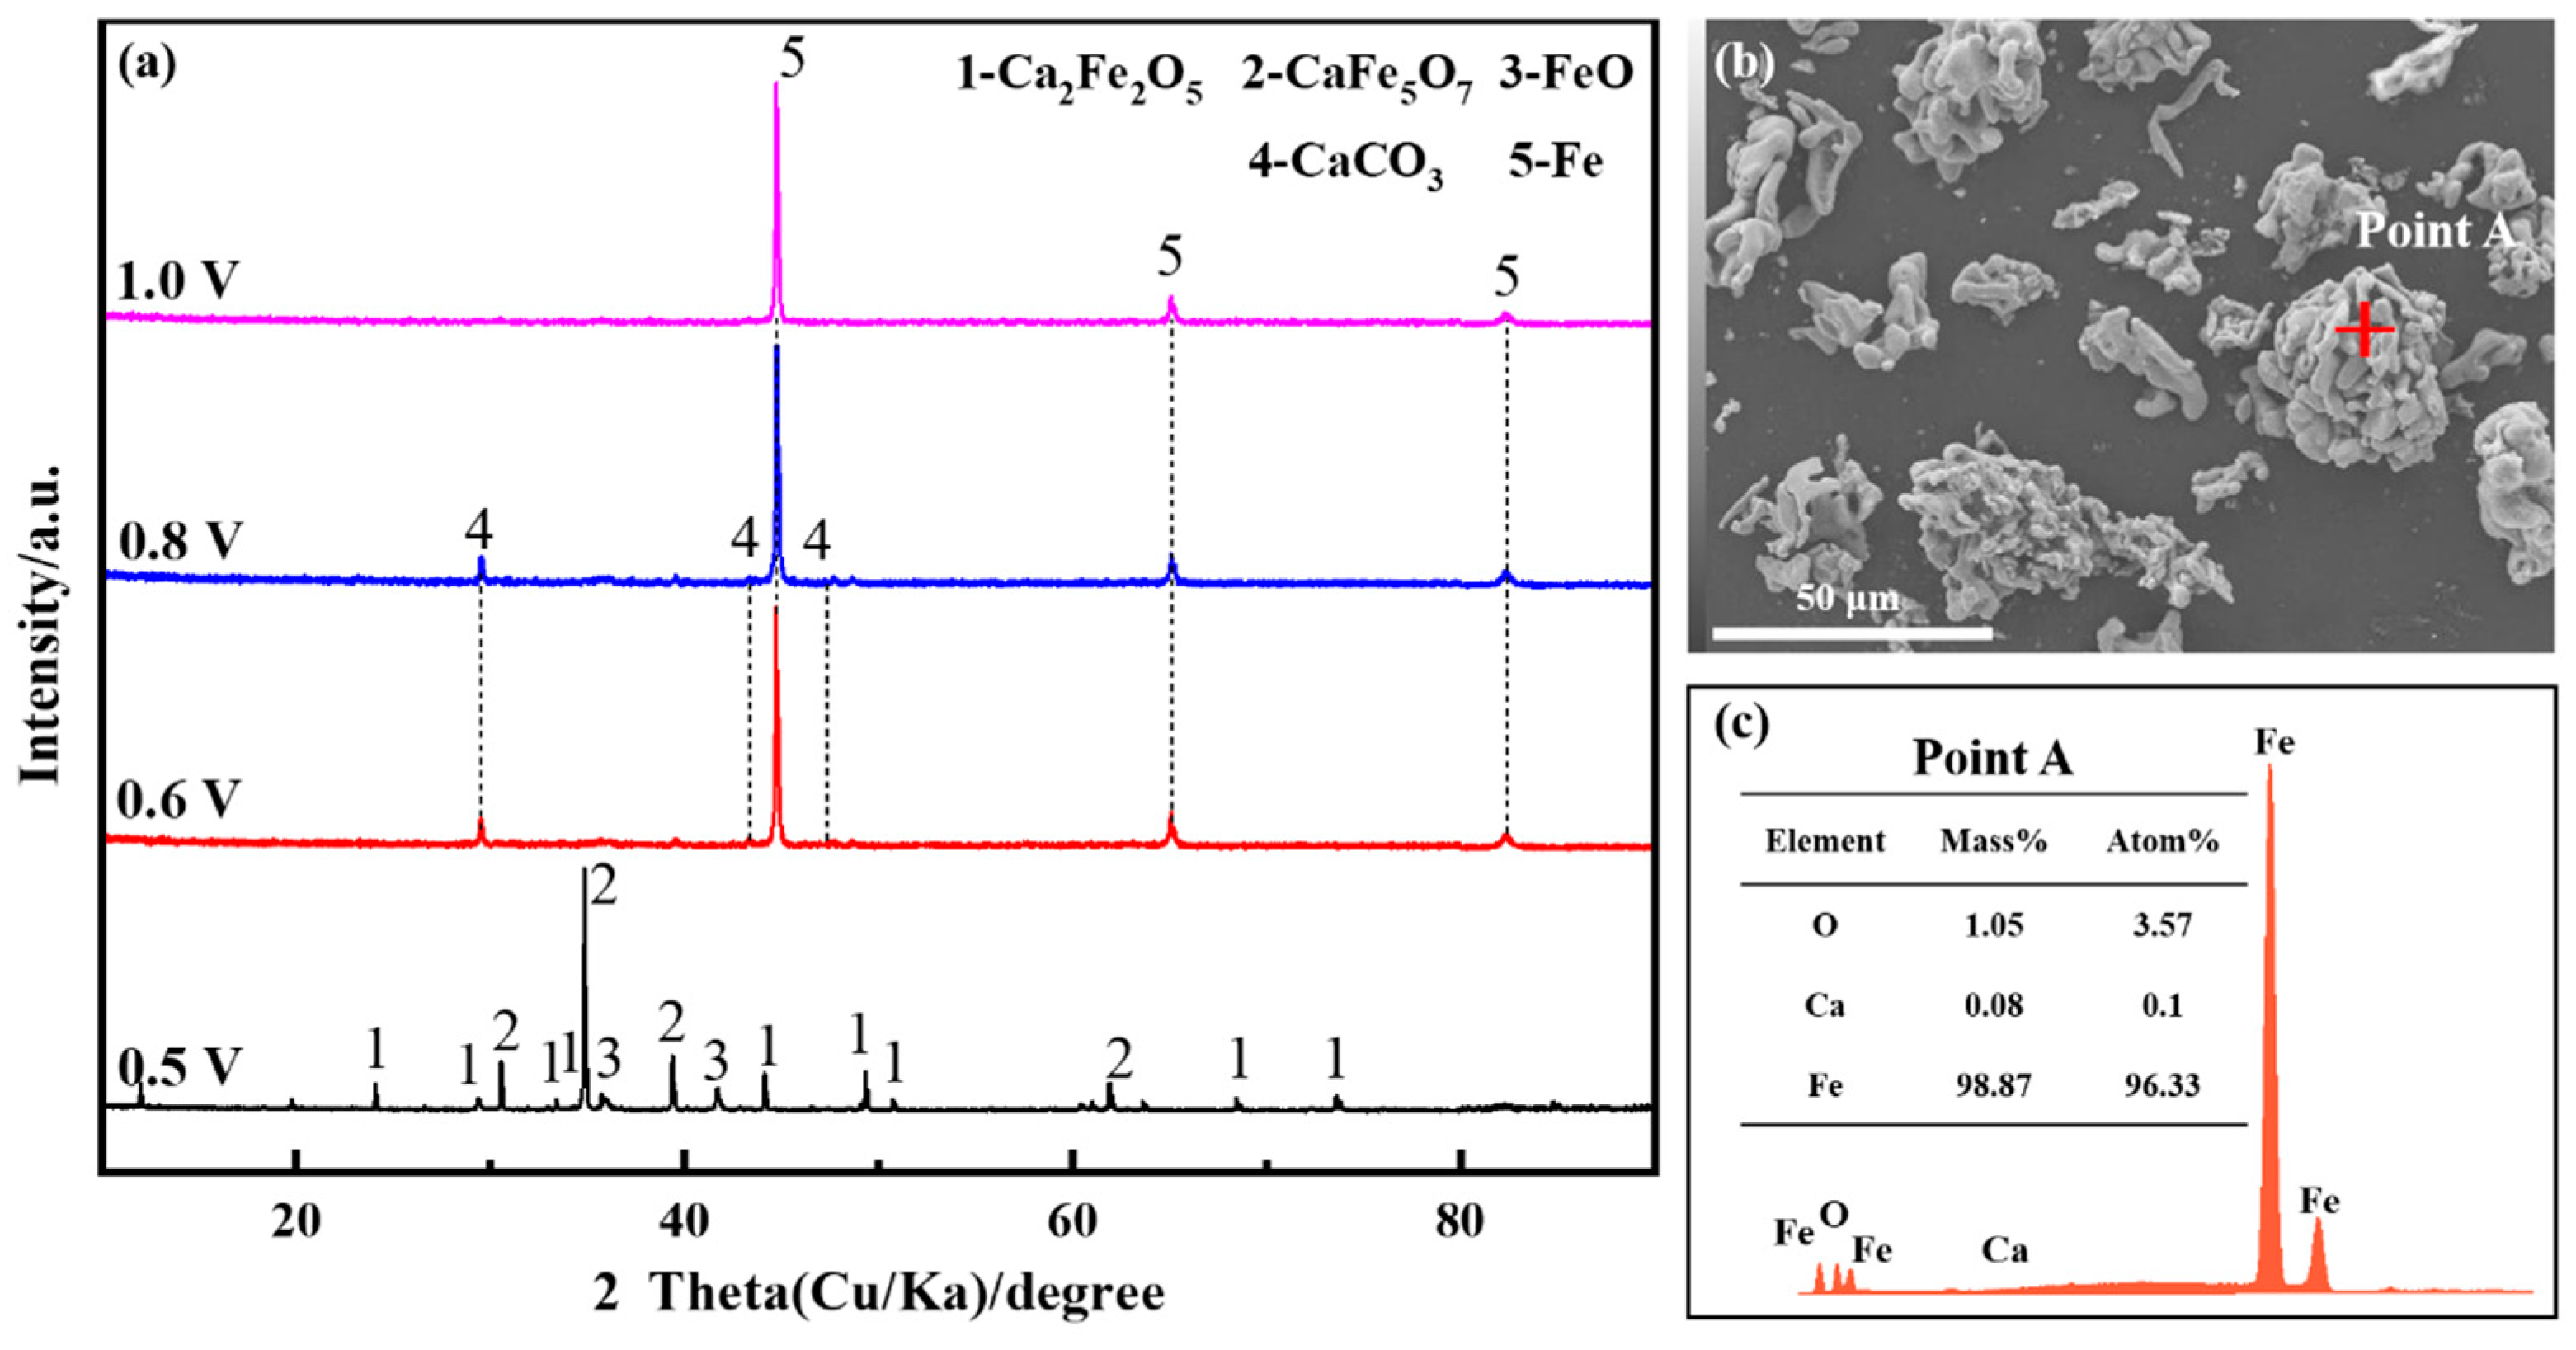
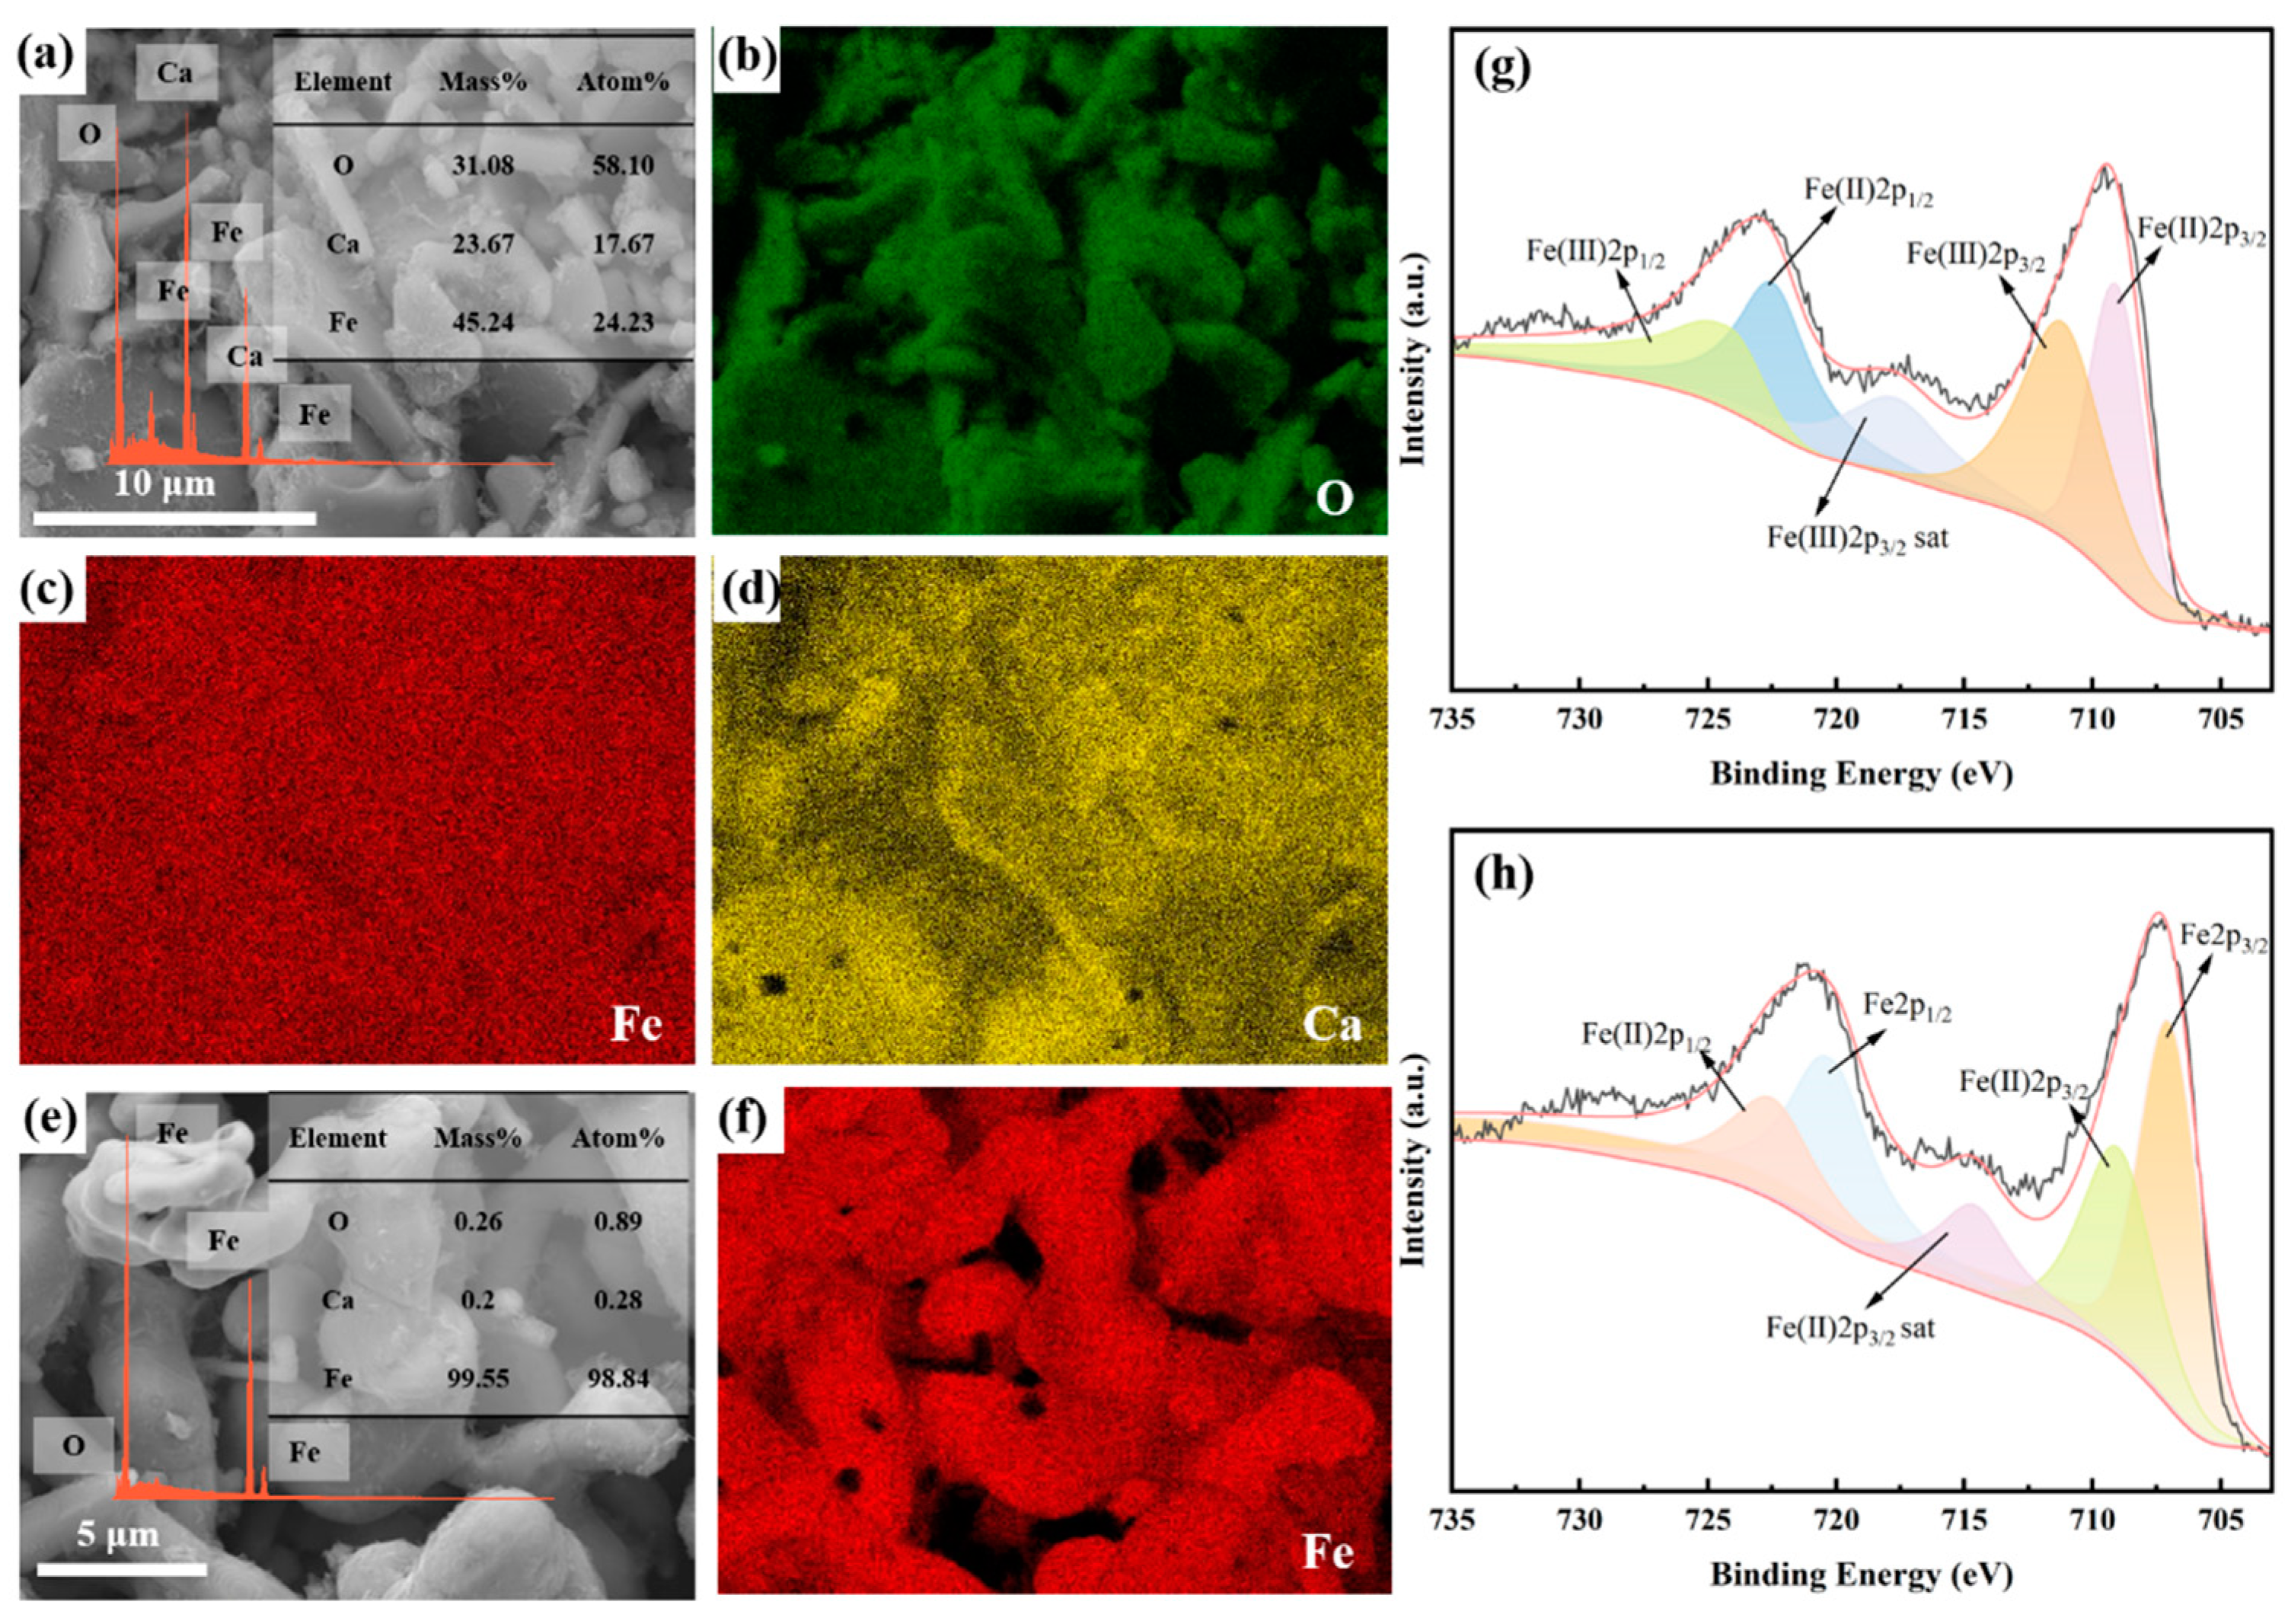
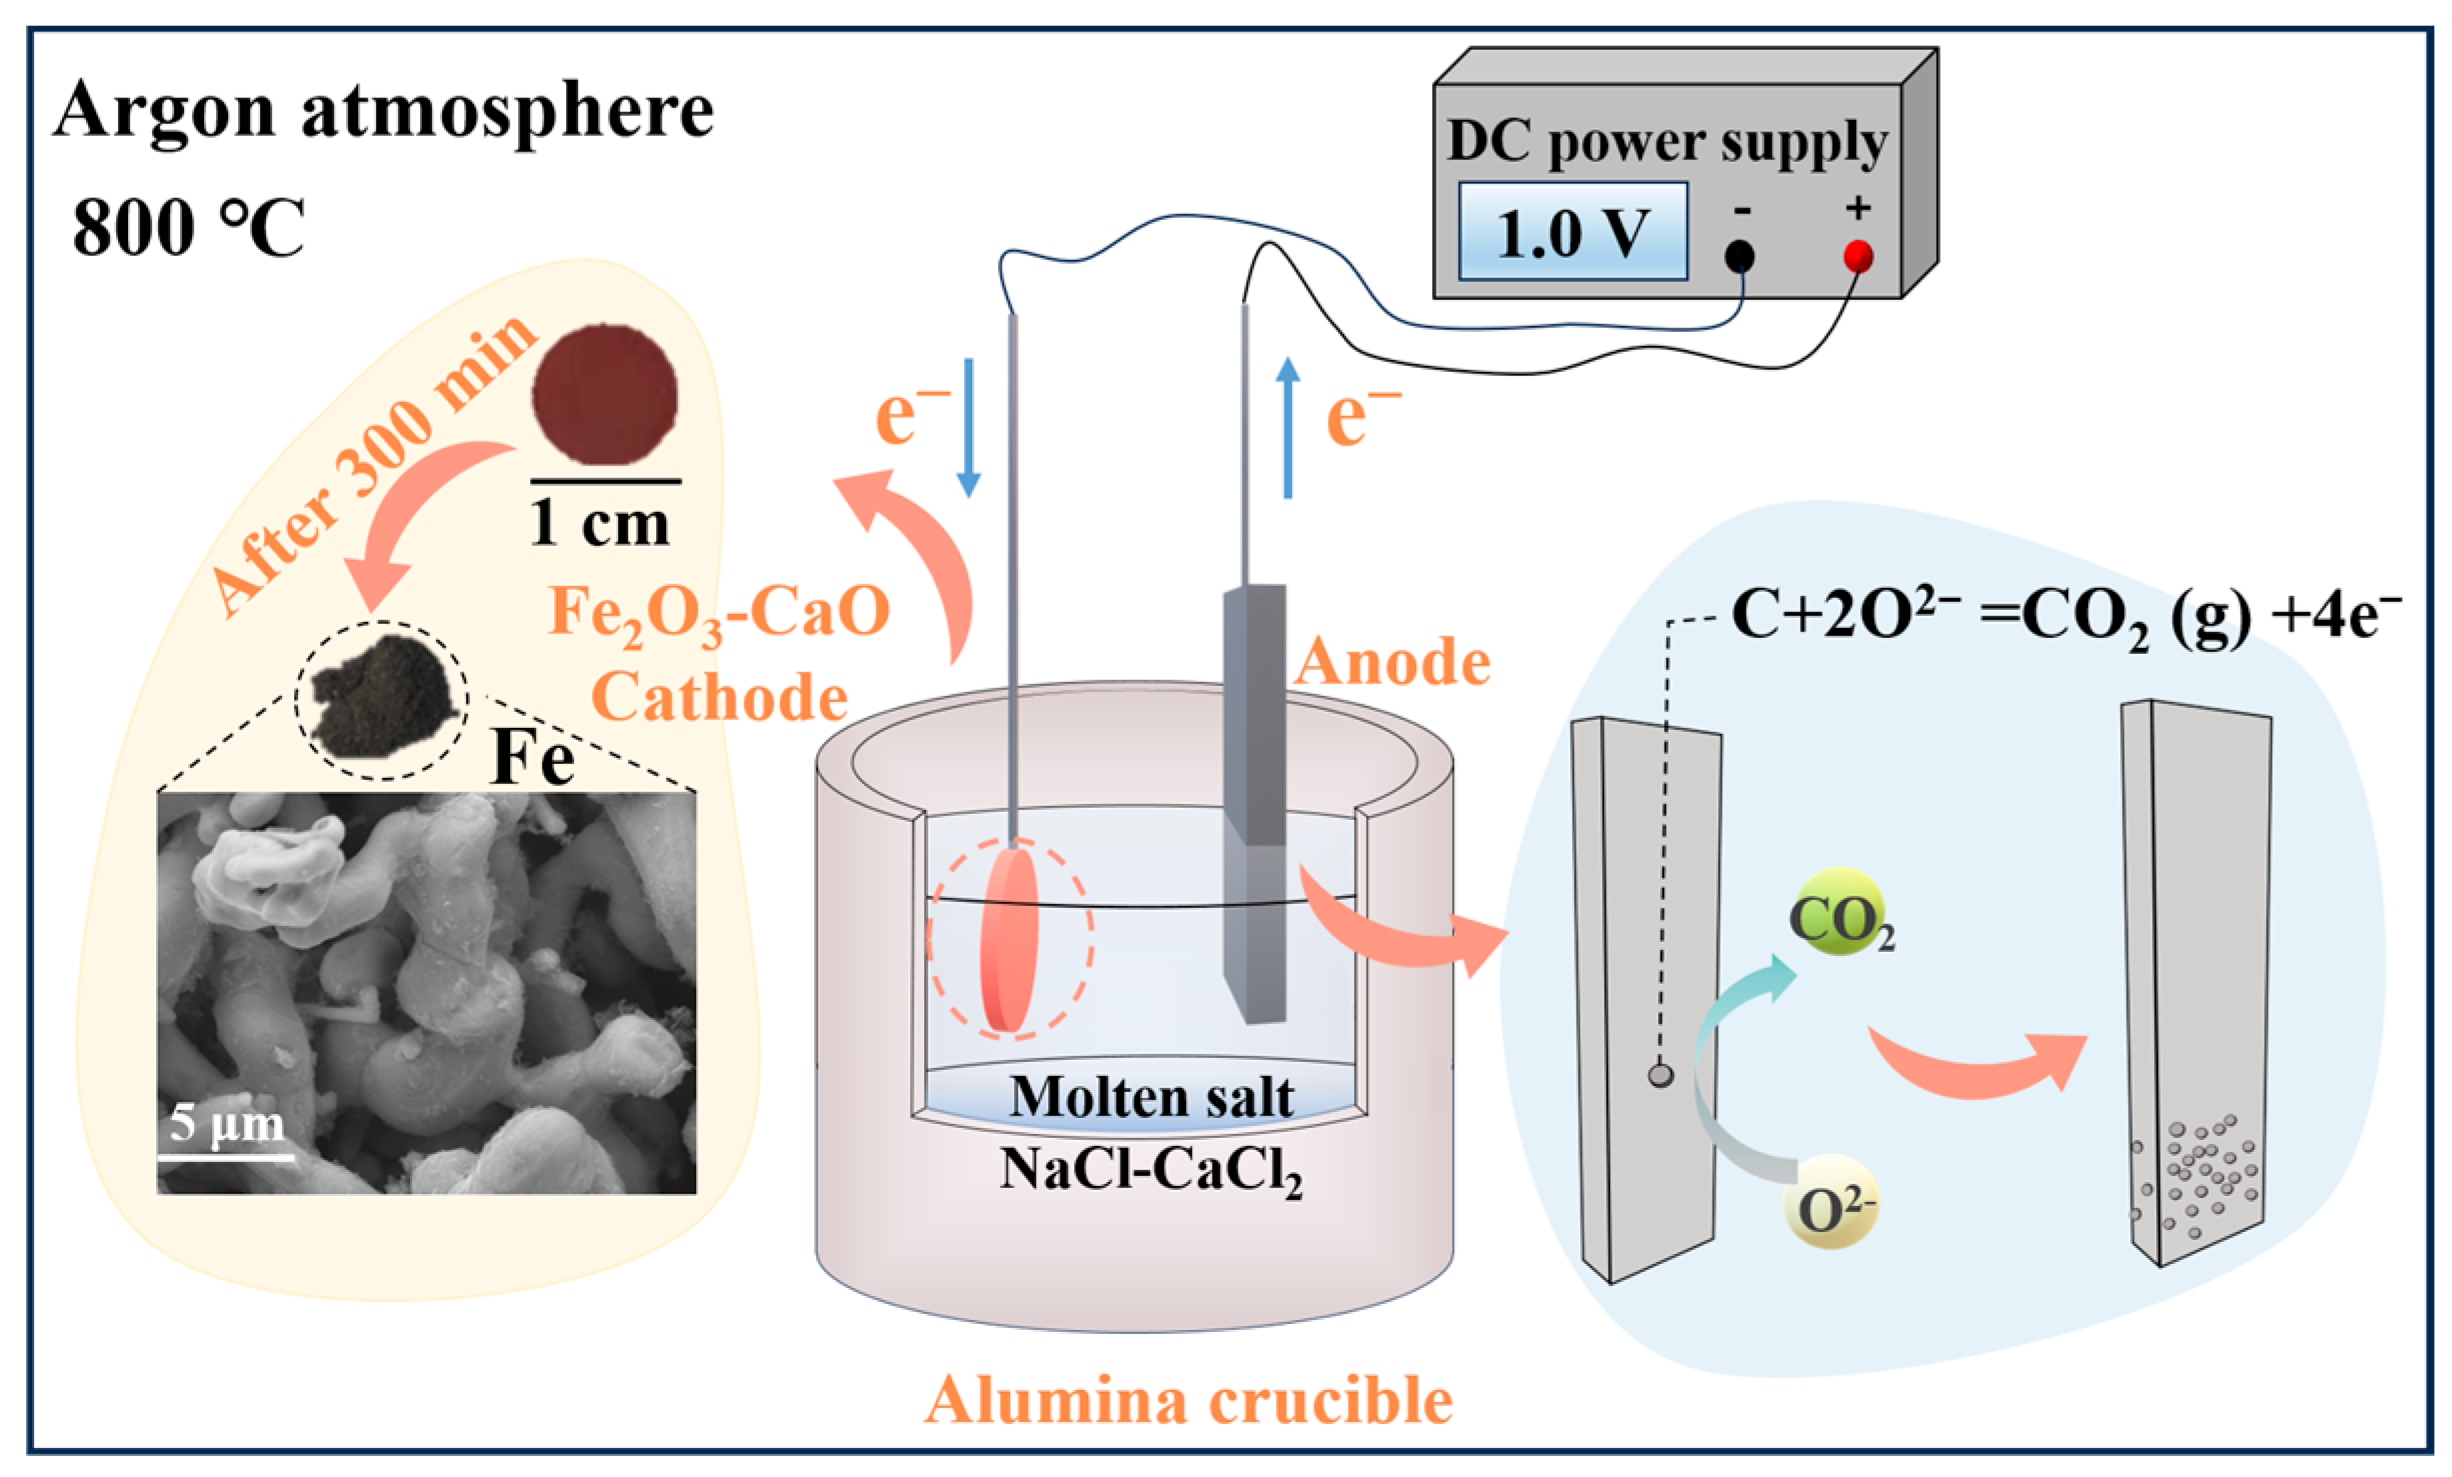
Under the condition of 1 V electrolysis, the cathodic deoxidation process of Fe2O3-CaO for the production of metallic iron results in the formation of CaFe3O5, CaFe5O7, FeO, and Fe phases over time. The appearance of CaFe3O5 and CaFe5O7 phases is attributed to the interaction of Fe3O4, Ca2+, and O2− generated during the electrolysis process, as well as the subsequent reaction of Fe3O4, FeO, Ca2+, and O2− at room temperature. Under the high driving force of 1 V, the reaction time for the electrolysis of Fe2O3-CaO to Fe is reduced, and after 300 min of electrolysis, it is entirely converted to metallic Fe.

Author Contributions

Conceptualization, H.L. and J.L.; Methodology, L.S. and C.L.; Validation, W.C.; Formal analysis, D.H.; Investigation, L.S.; Data curation, L.S., D.H. and J.L.; Writing—original draft, J.L.; Supervision, H.L. All authors have read and agreed to the published version of the manuscript.

Funding

This research was supported by the National Natural Science Foundation of China (No. 52174315), Tangshan Science and Technology Innovation Team Training Program Project (No. 21130207D), and North China University of Science and Technology graduate innovation project (No. 2024B04).

Institutional Review Board Statement

Not applicable.

Informed Consent Statement

Not applicable.

Data Availability Statement

Data is contained within the article.

Conflicts of Interest

The authors declare no conflict of interest.

References

  1. Yu, X.; Tan, C. China’s pathway to carbon neutrality for the iron and steel industry. Glob. Environ. Chang. 2022, 76, 102574. [Google Scholar] [CrossRef]
  2. Wang, Y.X.; Liu, J.; Tang, X.L.; Wang, Y.; An, H.W.; Yi, H.H. Decarbonization pathways of China’s iron and steel industry toward carbon neutrality. Resour. Conserv. Recycl. 2023, 194, 106994. [Google Scholar] [CrossRef]
  3. Chang, Y.F.; Wan, F.; Yao, X.L.; Wang, J.X.; Han, Y.F.; Li, H. Influence of hydrogen production on the CO2 emissions reduction of hydrogen metallurgy transformation in iron and steel industry. Energy Rep. 2023, 9, 3057–3071. [Google Scholar] [CrossRef]
  4. Liu, L.T.; Zhai, R.R.; Hu, Y.D. Performance evaluation of wind-solar-hydrogen system for renewable energy generation and green hydrogen generation and storage: Energy, exergy, economic, and enviroeconomic. Energy 2023, 276, 127386. [Google Scholar] [CrossRef]
  5. Al-Ghussain, L.; Ahmad, A.D.; Abubaker, A.M.; Hassan, M.A. Exploring the feasibility of green hydrogen production using excess energy from a country-scale 100% solar-wind renewable energy system. Int. J. Hydrogen Energy 2022, 47, 21612–21633. [Google Scholar] [CrossRef]
  6. Najjar, Y.S. Hydrogen safety: The road toward green technology. Int. J. Hydrogen Energy 2013, 38, 10716–10728. [Google Scholar] [CrossRef]
  7. Acar, C.; Dincer, I. Review and evaluation of hydrogen production options for better environment. J. Clean. Prod. 2019, 218, 835–849. [Google Scholar] [CrossRef]
  8. Wang, Z.; Zhang, X.; Rezazadeh, A. Hydrogen fuel and electricity generation from a new hybrid energy system based on wind and solar energies and alkaline fuel cell. Energy Rep. 2021, 7, 2594–2604. [Google Scholar] [CrossRef]
  9. Tang, J.; Chu, M.S.; Li, F.; Feng, C.; Liu, Z.G.; Zhou, Y.S. Development and progress on hydrogen metallurgy. Int. J. Miner. Metall. Mater. 2020, 27, 712–723. [Google Scholar] [CrossRef]
  10. Sun, L.; Yin, J.; Bilal, A.R. Green financing and wind power energy generation: Empirical insights from China. Rebew. Energy 2023, 206, 820–827. [Google Scholar] [CrossRef]
  11. Nian, V.; Chou, S.K. The state of nuclear power two years after Fukushima–The ASEAN perspective. Appl. Energy 2014, 136, 838–848. [Google Scholar] [CrossRef]
  12. Nian, V.; Mignacca, B.; Locatelli, G. Policies toward net-zero: Benchmarking the economic competitiveness of nuclear against wind and solar energy. Appl. Energy 2014, 320, 119275. [Google Scholar] [CrossRef]
  13. Allanore, A. Features and challenges of molten oxide electrolytes for metal extraction. J. Electrochem. Soc. 2014, 162, E13. [Google Scholar] [CrossRef]
  14. Allanore, A.; Lavelaine, H.; Valentin, G.; Birat, J.P.; Lapicque, F. Iron Metal Production by Bulk Electrolysis of Iron Ore Particles in Aqueous Media. J. Electrochem. Soc. 2008, 155, 125–129. [Google Scholar] [CrossRef]
  15. Tang, D.; Yin, H.; Xiao, W.; Zhu, H.; Mao, X.; Wang, D. Reduction mechanism and carbon content investigation for electrolytic production of iron from solid Fe2O3 in molten K2CO3–Na2CO3 using an inert anode. J. Electroanal. Chem. 2013, 689, 109–116. [Google Scholar] [CrossRef]
  16. Sadoway, D.R. New opportunities for metals extraction and waste treatment by electrochemical processing in molten salts. J. Mater. Res. 1995, 10, 487–492. [Google Scholar] [CrossRef]
  17. Zhang, K.; Jiao, H.; Zhou, Z.; Jiao, S.; Zhu, H. Electrochemical behavior of Fe (III) ion in CaO-MgO-SiO2-Al2O3-NaF-Fe2O3 melts at 1673 K. J. Electrochem. Soc. 2016, 163, 710. [Google Scholar] [CrossRef]
  18. Chen, G.Z.; Fray, D.J.; Farthing, T.W. Direct electrochemical reduction of titanium dioxide to titanium in molten calcium chloride. Nature 2000, 407, 361–364. [Google Scholar] [CrossRef]
  19. Xi, X.L.; Feng, M.; Zhang, L.W.; Nie, Z.R. Applications of molten salt and progress of molten salt electrolysis in secondary metal resource recovery. Int. J. Miner. Metall. Mater. 2020, 27, 1599–1617. [Google Scholar] [CrossRef]
  20. Li, M.; Liu, C.Y.; Ding, A.T.; Xiao, C.L. A review on the extraction and recovery of critical metals using molten salt electrolysis. J. Environ. Chem. Eng. 2023, 11, 109746. [Google Scholar] [CrossRef]
  21. Li, H.; Jia, L.; Liang, J.L.; Yan, H.Y.; Cai, Z.Y.; Reddy, R.G. Study on the Direct Electrochemical Reduction of Fe2O3 in NaCl-CaCl2 Melt. Int. J. Electrochem. Sci. 2019, 14, 11267–11278. [Google Scholar] [CrossRef]
  22. Li, H.; Jia, L.; Cao, W.G.; Liang, J.L.; Wang, L.; Yan, H.Y. The electrochemical reduction mechanism of Fe3O4 in NaCl-CaCl2 melts. Int. J. Chem. React. Eng. 2021, 19, 43–52. [Google Scholar] [CrossRef]
  23. Fray, D.; Schwandt, C. Aspects of the application of electrochemistry to the extraction of titanium and its applications. Mater. Trans. 2017, 58, 306–312. [Google Scholar] [CrossRef]
  24. Chen, G.Z.; Gordo, E.; Fray, D.J. Direct electrolytic preparation of chromium powder. Metall. Mater. Trans. B 2004, 35, 223–233. [Google Scholar] [CrossRef]
  25. Liu, Z.W.; Zhang, H.L.; Pei, L.L.; Shi, Y.L.; Cai, Z.H.; Xu, H.B.; Zhang, Y. Direct electrolytic preparation of chromium metal in CaCl2–NaCl eutectic salt. Trans. Nonferrous Met. Soc. China 2018, 28, 376–384. [Google Scholar] [CrossRef]
  26. Huan, S.X.; Wang, Y.W.; Peng, J.P.; Di, Y.Z.; Li, B.; Zhang, L.D. Recovery of aluminum from waste aluminum alloy by low-temperature molten salt electrolysis. Miner. Eng. 2020, 154, 106396. [Google Scholar] [CrossRef]
  27. Chen, Y.F.; Wang, M.Y.; Lv, A.J.; Zhao, Z.H.; An, J.L.; Zhang, J.T.; Tu, J.G.; Jiao, S.Q. Green preparation of vanadium carbide through one-step molten salt electrolysis. Ceram Int. 2021, 47, 28203–28209. [Google Scholar] [CrossRef]
  28. An, J.L.; Wang, M.Y.; Jia, Y.Z.; Chen, Y.F.; Jiao, S.Q. Facile preparation of metallic vanadium from consumable V2CO solid solution by molten salt electrolysis. Sep. Purif. Technol. 2022, 295, 121361. [Google Scholar] [CrossRef]
  29. Chang, C.; Tu, J.G.; Chen, Y.F.; Wang, M.Y.; Jiao, S.J. Electro-deoxidation behavior of solid SeO2 in a low-temperature molten salt. Chem. Commun. 2022, 58, 9108–9111. [Google Scholar] [CrossRef]
  30. Zhu, X.; Li, L.; Song, W.C.; Zhang, D.F.; Ma, S.R.; Qiu, K.H. Electrochemical synthesis of Ti–Al–V alloy by chlorination of Ti2O3 and V2O3 in AlCl3-containing molten chloride salt. J. Mater. Res. Technol. 2021, 13, 1243–1253. [Google Scholar] [CrossRef]
  31. Cao, X.Z.; Li, Q.Y.; Shi, Y.Y.; Wu, D.; Xue, X.X. Preparation of V-4Cr-4Ti Alloys from Mixed Oxides via Electro-Deoxidation Process in Molten Salt. Metals 2022, 10, 1067. [Google Scholar] [CrossRef]
  32. Li, S.S.; Zou, X.L.; Zheng, K.; Lu, X.G.; Chen, C.Y.; Li, X.; Xu, Q.; Zhou, Z.F. Electrosynthesis of Ti5Si3, Ti5Si3/TiC and Ti5Si3/Ti3SiC2 from Ti-bearing blast furnace slag in molten CaCl2. Metall. Mater. Trans. B 2018, 49, 790–802. [Google Scholar] [CrossRef]
  33. Sure, J.; Vishnu, D.S.M.; Kumar, R.V.; Schwandt, C. Molten salt electrochemical synthesis, heat treatment and microhardness of Ti-5Ta-2Nb alloy. Mater. Trans. 2019, 60, 391–399. [Google Scholar] [CrossRef]
  34. Hu, D.; Xiao, W.; Chen, G.Z. Near-net-shape production of hollow titanium alloy components via electrochemical reduction of metal oxide precursors in molten salts. Metall. Mater. Trans. B 2013, 44, 272–282. [Google Scholar] [CrossRef]
  35. Yang, X.; Jiao, H.; Wang, M.Y.; Jiao, S.Q. Direct preparation of V–Al alloy by molten salt electrolysis of soluble NaVO3 on a liquid Al cathode. J. Alloys Compd. 2019, 779, 22–29. [Google Scholar]
  36. Zhua, F.X.; Li, K.H.; Song, W.C.; Li, L.; Zhang, D.F.; Qiu, K.H. Composition and structure of Ti–Al alloy powders formed by electrochemical co-deposition in KCl–LiCl–MgCl2–TiCl3–AlCl3 molten salt. Intermetallics 2021, 139, 107341. [Google Scholar] [CrossRef]
  37. Sure, J.; Vishnu, D.S.M.; Schwandt, C. Direct electrochemical synthesis of high-entropy alloys from metal oxides. Appl. Mater. Today 2017, 9, 111–121. [Google Scholar] [CrossRef]
  38. Schwandt, C.; Doughty, G.R.; Fray, D.J. The FFC-Cambridge Process for Titanium Metal Winning; Trans Tech Publications Ltd.: Stafa-Zurich, Switzerland, 2010; Volume 436, pp. 13–25. [Google Scholar]
  39. Jiang, K.; Hu, X.; Ma, M.; Wang, D.; Qiu, G.; Jin, X.; Chen, G.Z. “Perovskitization”-Assisted electrochemical reduction of solid TiO2 in Molten CaCl2. Angew. Chemie. 2006, 118, 442–446. [Google Scholar] [CrossRef]
  40. Descallar-Arriesgado, R.F.; Kobayashi, N.; Kikuchi, T.; Suzuki, R.O. Calciothermic reduction of NiO by molten salt electrolysis of CaO in CaCl2 melt. Electrochim. Acta 2011, 56, 8422–8429. [Google Scholar] [CrossRef]
  41. Schwandt, C. On the nature of the current and the absence of an IR-drop in an FFC-Cambridge-type electro-deoxidation cell. Electrochim. Acta 2018, 280, 114–120. [Google Scholar] [CrossRef]
  42. Pang, Z.Y.; Li, X.; Zhang, X.Q.; Li, J.J.; Wang, S.J.; Xiong, X.L.; Li, G.S.; Qian., X.; Zhou, Z.F.; Zou, X.L.; et al. Molten salt electrosynthesis of silicon carbide nanoparticles and their photoluminescence property. Trans. Nonferrous Met. Soc. China 2022, 32, 3790–3800. [Google Scholar] [CrossRef]
  43. Schwandt, C.; Fray, D.J. Determination of the kinetic pathway in the electrochemical reduction of titanium dioxide in molten calcium chloride. Electrochim. Acta 2005, 51, 66–76. [Google Scholar] [CrossRef]
  44. Liang, J.L.; Wang, D.B.; Wang, L.; Li, H.; Cao, W.G.; Yan, H.Y. Electrochemical process for recovery of metallic Mn from waste LiMn2O4-based Li-ion batteries in NaCl−CaCl2 melts. Int. J. Min. Met. Mater. 2022, 29, 473–478. [Google Scholar] [CrossRef]
  45. Li, H.; Xue, C.L.; Yang, Y.; Liang, J.L. Preparation of Fe3Si and FeSi intermetallic compounds from copper slag by electrochemical method. J. Iron Steel Res. Int. 2023, 30, 213–221. [Google Scholar] [CrossRef]
  46. Zhou, Z.G.; Hua, Y.X.; Xu, C.Y.; Li, J.; Li, Y.; Zhang, Q.B.; Zhang, Y.D.; Kuang, W.H. Synthesis of micro-FeTi powders by direct electrochemical reduction of ilmenite in CaCl2-NaCl molten salt. Ionics 2016, 23, 213–221. [Google Scholar] [CrossRef]
  47. Wu, T.; Ma, X.; Jin, X. Preparation of vanadium powder and vanadium-titanium alloys by the electroreduction of V2O3 and TiO2 powders. Mater. Res. 2016, 31, 405–417. [Google Scholar] [CrossRef]
  48. Abdelkader, A.M.; Fray, D.L. Electro-deoxidization of hafnium dioxide and niobia-doped hafnium dioxide in molten calcium chloride. Electrochim. Acta 2012, 64, 10–16. [Google Scholar] [CrossRef]
  49. Lee, M.J.; Noh, J.S.; Kim, K.Y.; Lee, J.H. Electrochemical deoxidization of ZrSiO4 in molten calcium chloride. Phys. Met. Metallogr. 2014, 115, 1356–1361. [Google Scholar] [CrossRef]
  50. Bagus, P.S.; Nelin, C.J.; Brundle, C.R.; Vincent Crist, B.; Lahiri, N.; Rosso, K.M. Combined multiplet theory and experiment for the Fe 2p and 3p XPS of FeO and Fe2O3. Chem. Phys. 2021, 154, 094709. [Google Scholar] [CrossRef]
  51. Qu, Z.F.; Hu, M.L.; Gao, L.Z.; Lai, P.S.; Bai, C.G. Preparation of Titanium Foams Through Direct Electrolysis of the Sintered CaO-TiO2 in Molten Salt CaCl2. In 9th International Symposium on High-Temperature Metallurgical Processing; Springer International Publishing: Berlin/Heidelberg, Germany, 2018; pp. 225–232. [Google Scholar]
  52. Xu, Y.; Zhao, G.; Cai, Y. Preparation of Titanium by Electro-deoxidation of CaTiO3 in a Molten CaCl2-NaCl Salt. Int. J. Electrochem. Sci. 2021, 16, 211022. [Google Scholar] [CrossRef]
  53. Chen, G.Z.; Fray, D.J. Understanding the electro-reduction of metal oxides in molten salts. In Light Metals-Warrendale-Proceedings; TMS: Charlotte, NC, USA, 2004; pp. 881–886. [Google Scholar]
  54. Yan, X.Y.; Fray, D.J. Production of niobium powder by direct electrochemical reduction of solid Nb2O5 in a eutectic CaCl2-NaCl melt. Metall. Mater. Trans. B 2002, 33, 685–693. [Google Scholar] [CrossRef]
Figure 1. Fe2O3-CaO in NaCl-CaCl2 molten salt at different voltages for 600 min; (a) XRD patterns and (b,c) SEM and EDS image at 1.0 V for the constant cell voltage electrolysis.
Molecules 28 08103 g001
Figure 2. (a) XRD patterns of products of Fe2O3/Fe2O3-CaO immersed in NaCl-CaCl2 molten salt for 10 min; (b) temperature dependence of standard Gibbs free energy for the reaction of Fe2O3 with CaO.
Molecules 28 08103 g002
Figure 3. Cyclic voltammetry curves of blank electrodes, FCE-Fe2O3 and FCE-Ca2Fe2O5 in NaCl-CaCl2 molten salt (scan rate: 0.1 V/s, temperature: 800 °C).
Molecules 28 08103 g003
Figure 4. (a) XRD patterns of the products of Fe2O3-CaO in NaCl-CaCl2 molten salt under constant voltage electrolysis at 1.0 V for different durations; (b) E-pO2 diagram of the Fe-O-Ca system at 800 °C; (c) I-t curve.
Molecules 28 08103 g004
Figure 5. (a) Schematic of ion migration during the electrolysis process; (b) schematic illustration of intermediate product formation at room temperature; (c) diagram depicting the diffusion mechanism at the cathode plate three-phase interface.
Molecules 28 08103 g005
Figure 6. (ad) SEM-EDS spectra of the products of Fe2O3-CaO cathode under 1.0 V electrolysis at 800 °C for 10 min; (e,f) SEM-EDS spectra of the products of Fe2O3-CaO cathode under 1.0 V electrolysis at 800 °C for 300 min; (g) XPS spectrum of the products obtained after 10 min of electrolysis; (h) XPS spectrum of the products obtained after 300 min of electrolysis.
Molecules 28 08103 g006
Figure 7. XRD pattern of Fe2O3-CaO mixed oxides ball-milled for 300 min.
Molecules 28 08103 g007
Figure 8. Schematic diagram of electrolysis device.
Molecules 28 08103 g008
Disclaimer/Publisher’s Note: The statements, opinions and data contained in all publications are solely those of the individual author(s) and contributor(s) and not of MDPI and/or the editor(s). MDPI and/or the editor(s) disclaim responsibility for any injury to people or property resulting from any ideas, methods, instructions or products referred to in the content.

