
Method Validation for Multi-Pesticide Residue Determination in Chrysanthemum


 ,
,
Abstract
:1. Introduction
2. Results and Discussion
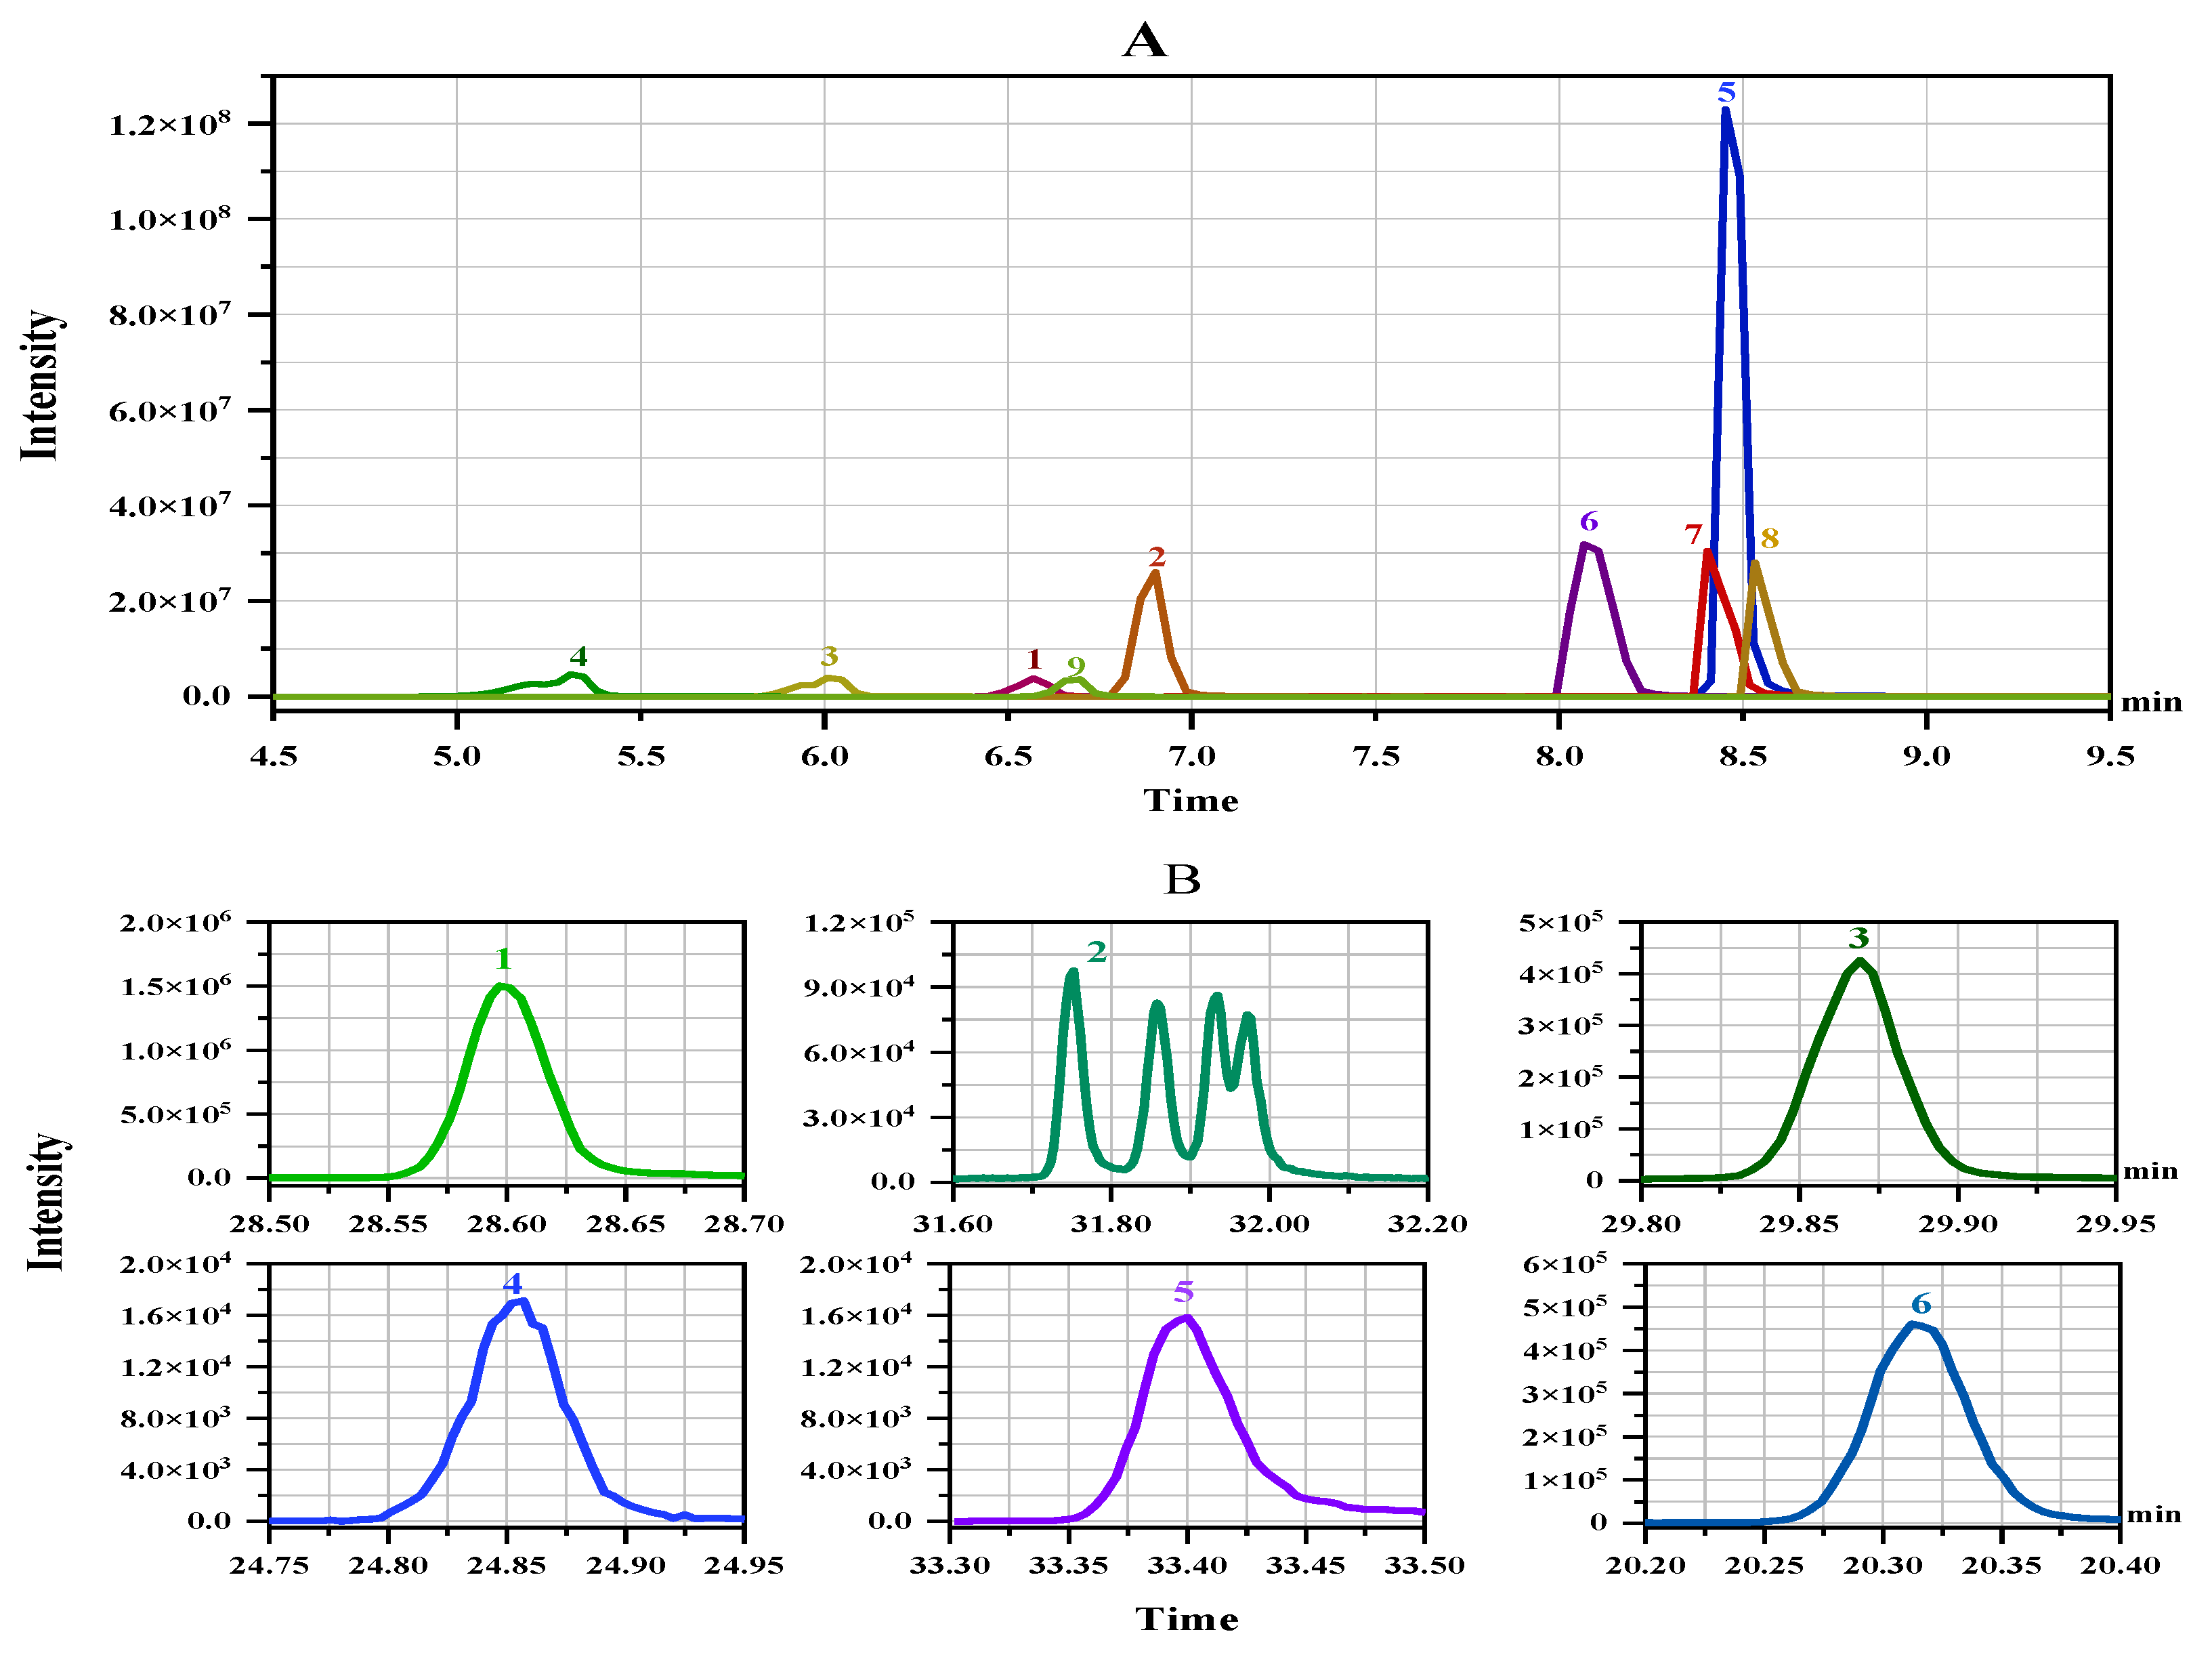
2.1. Optimisation of the Instrument Conditions
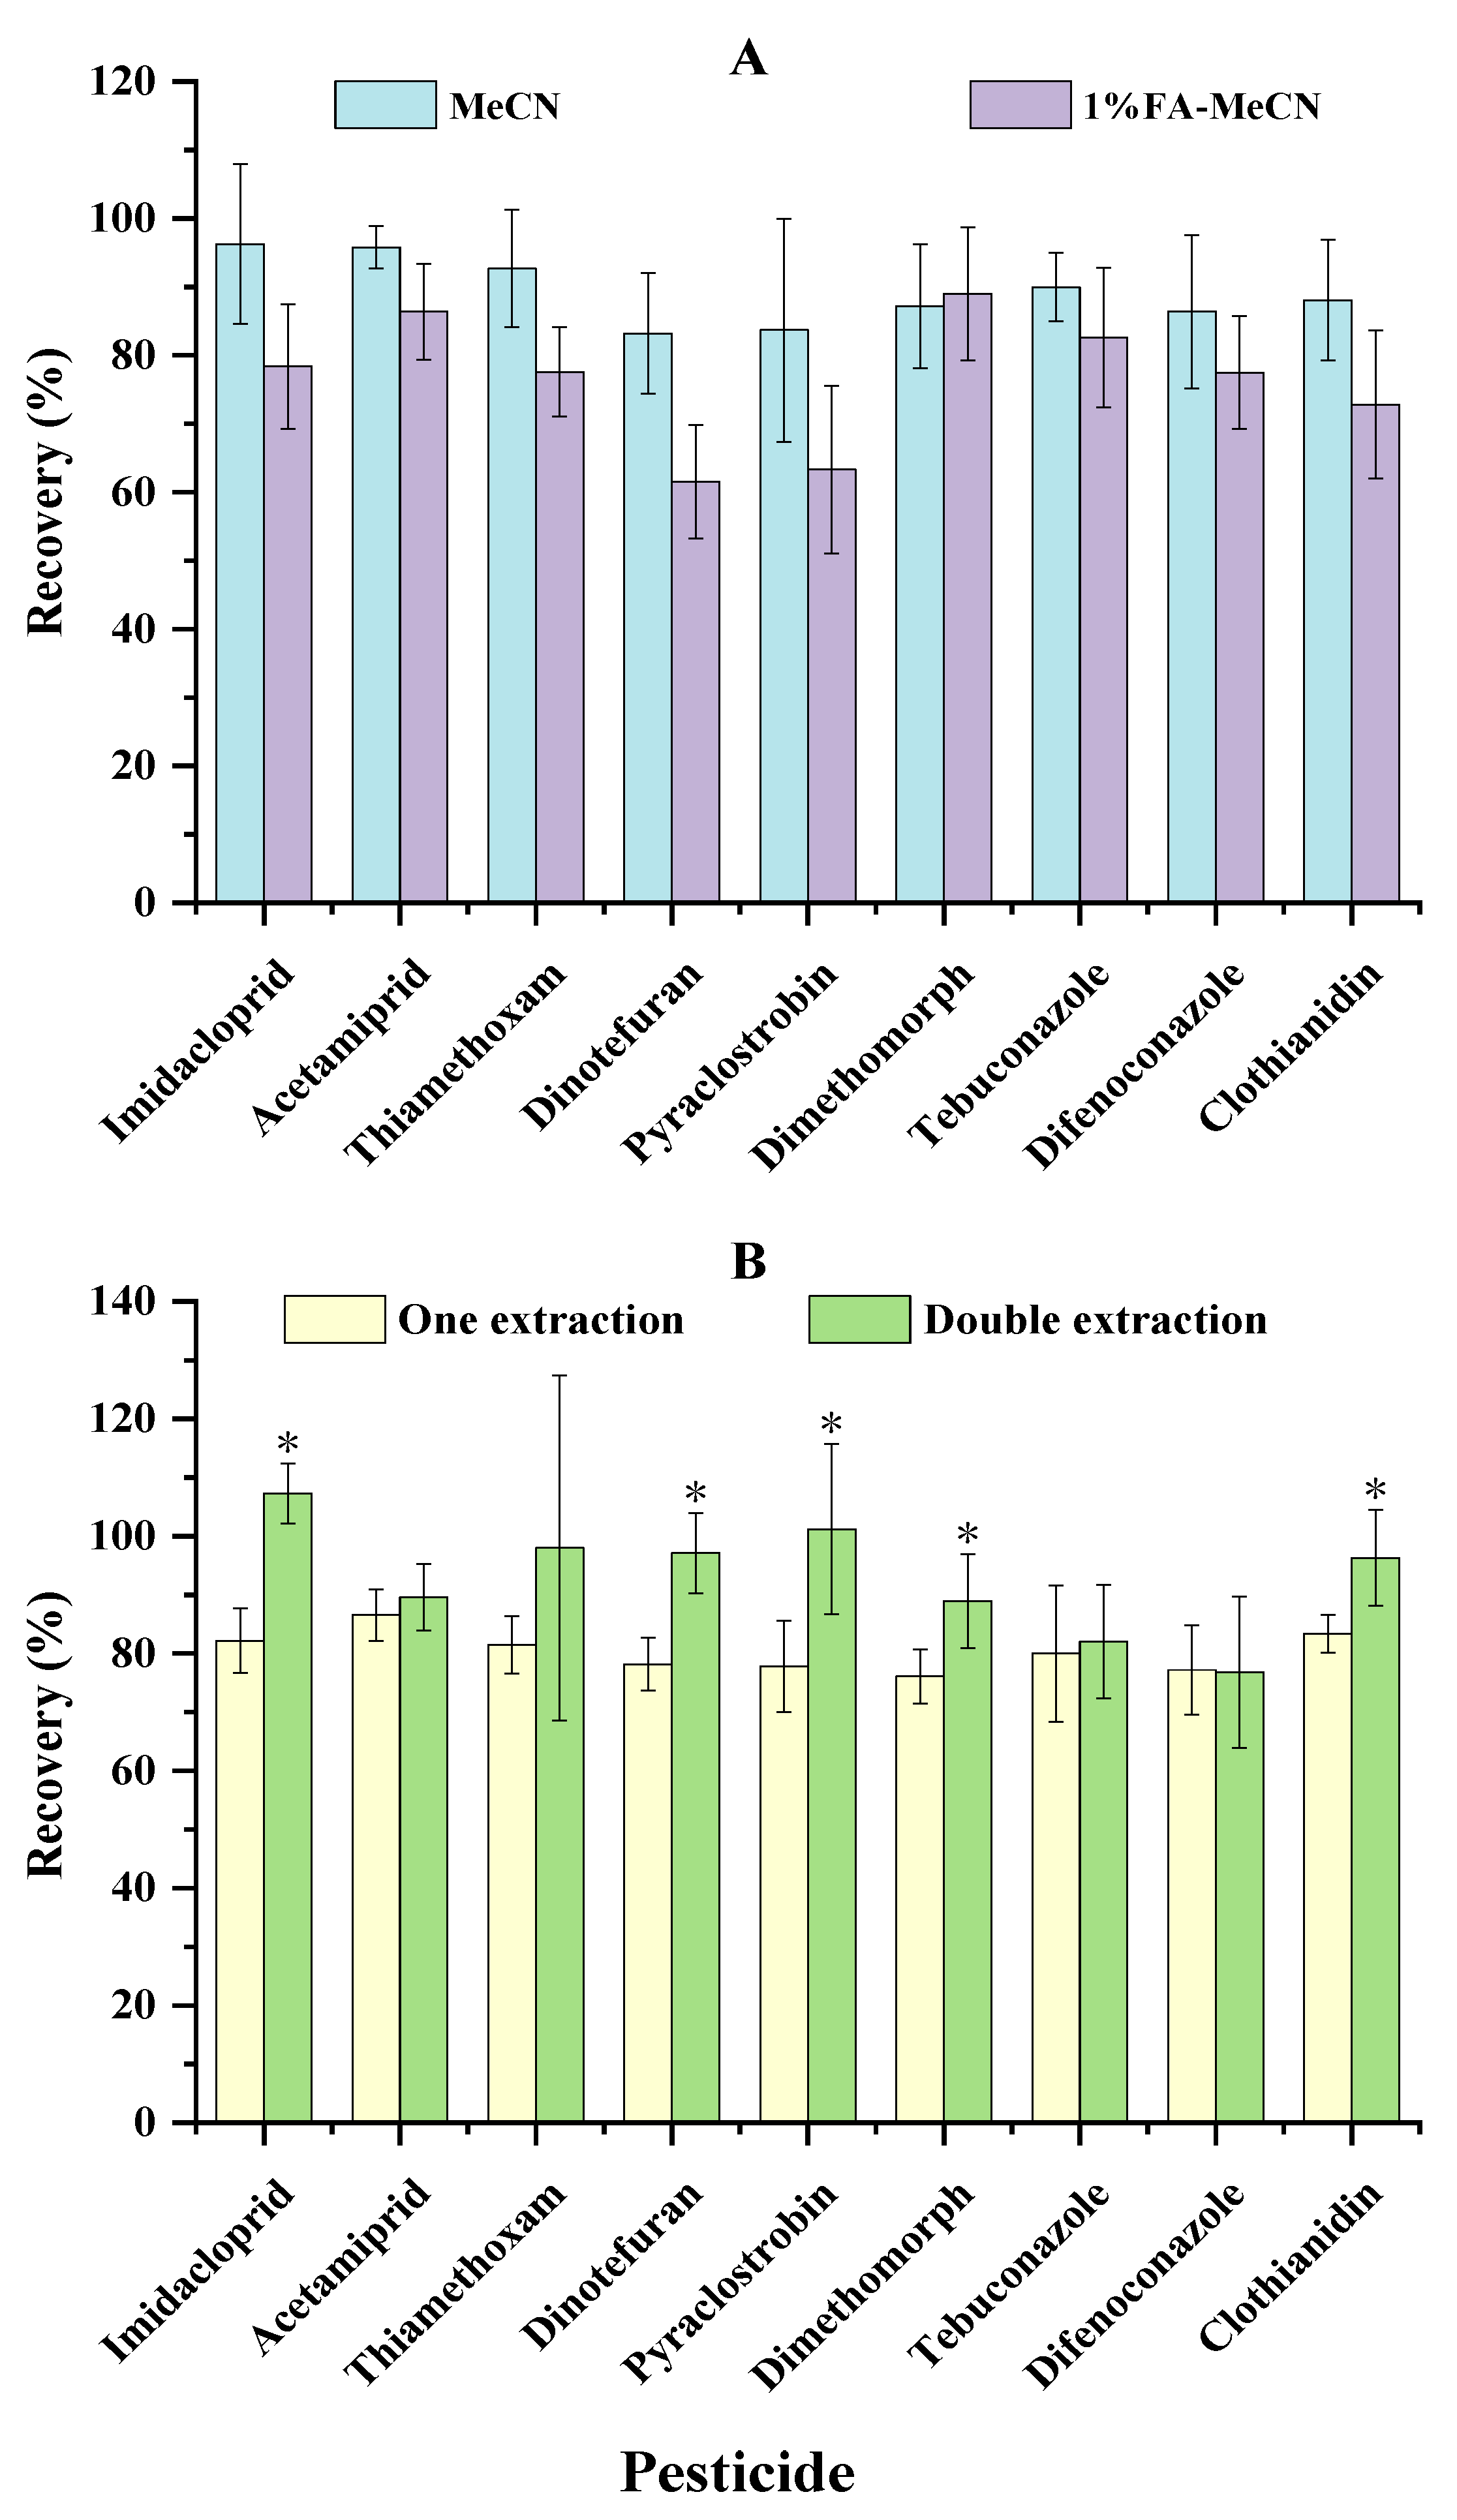
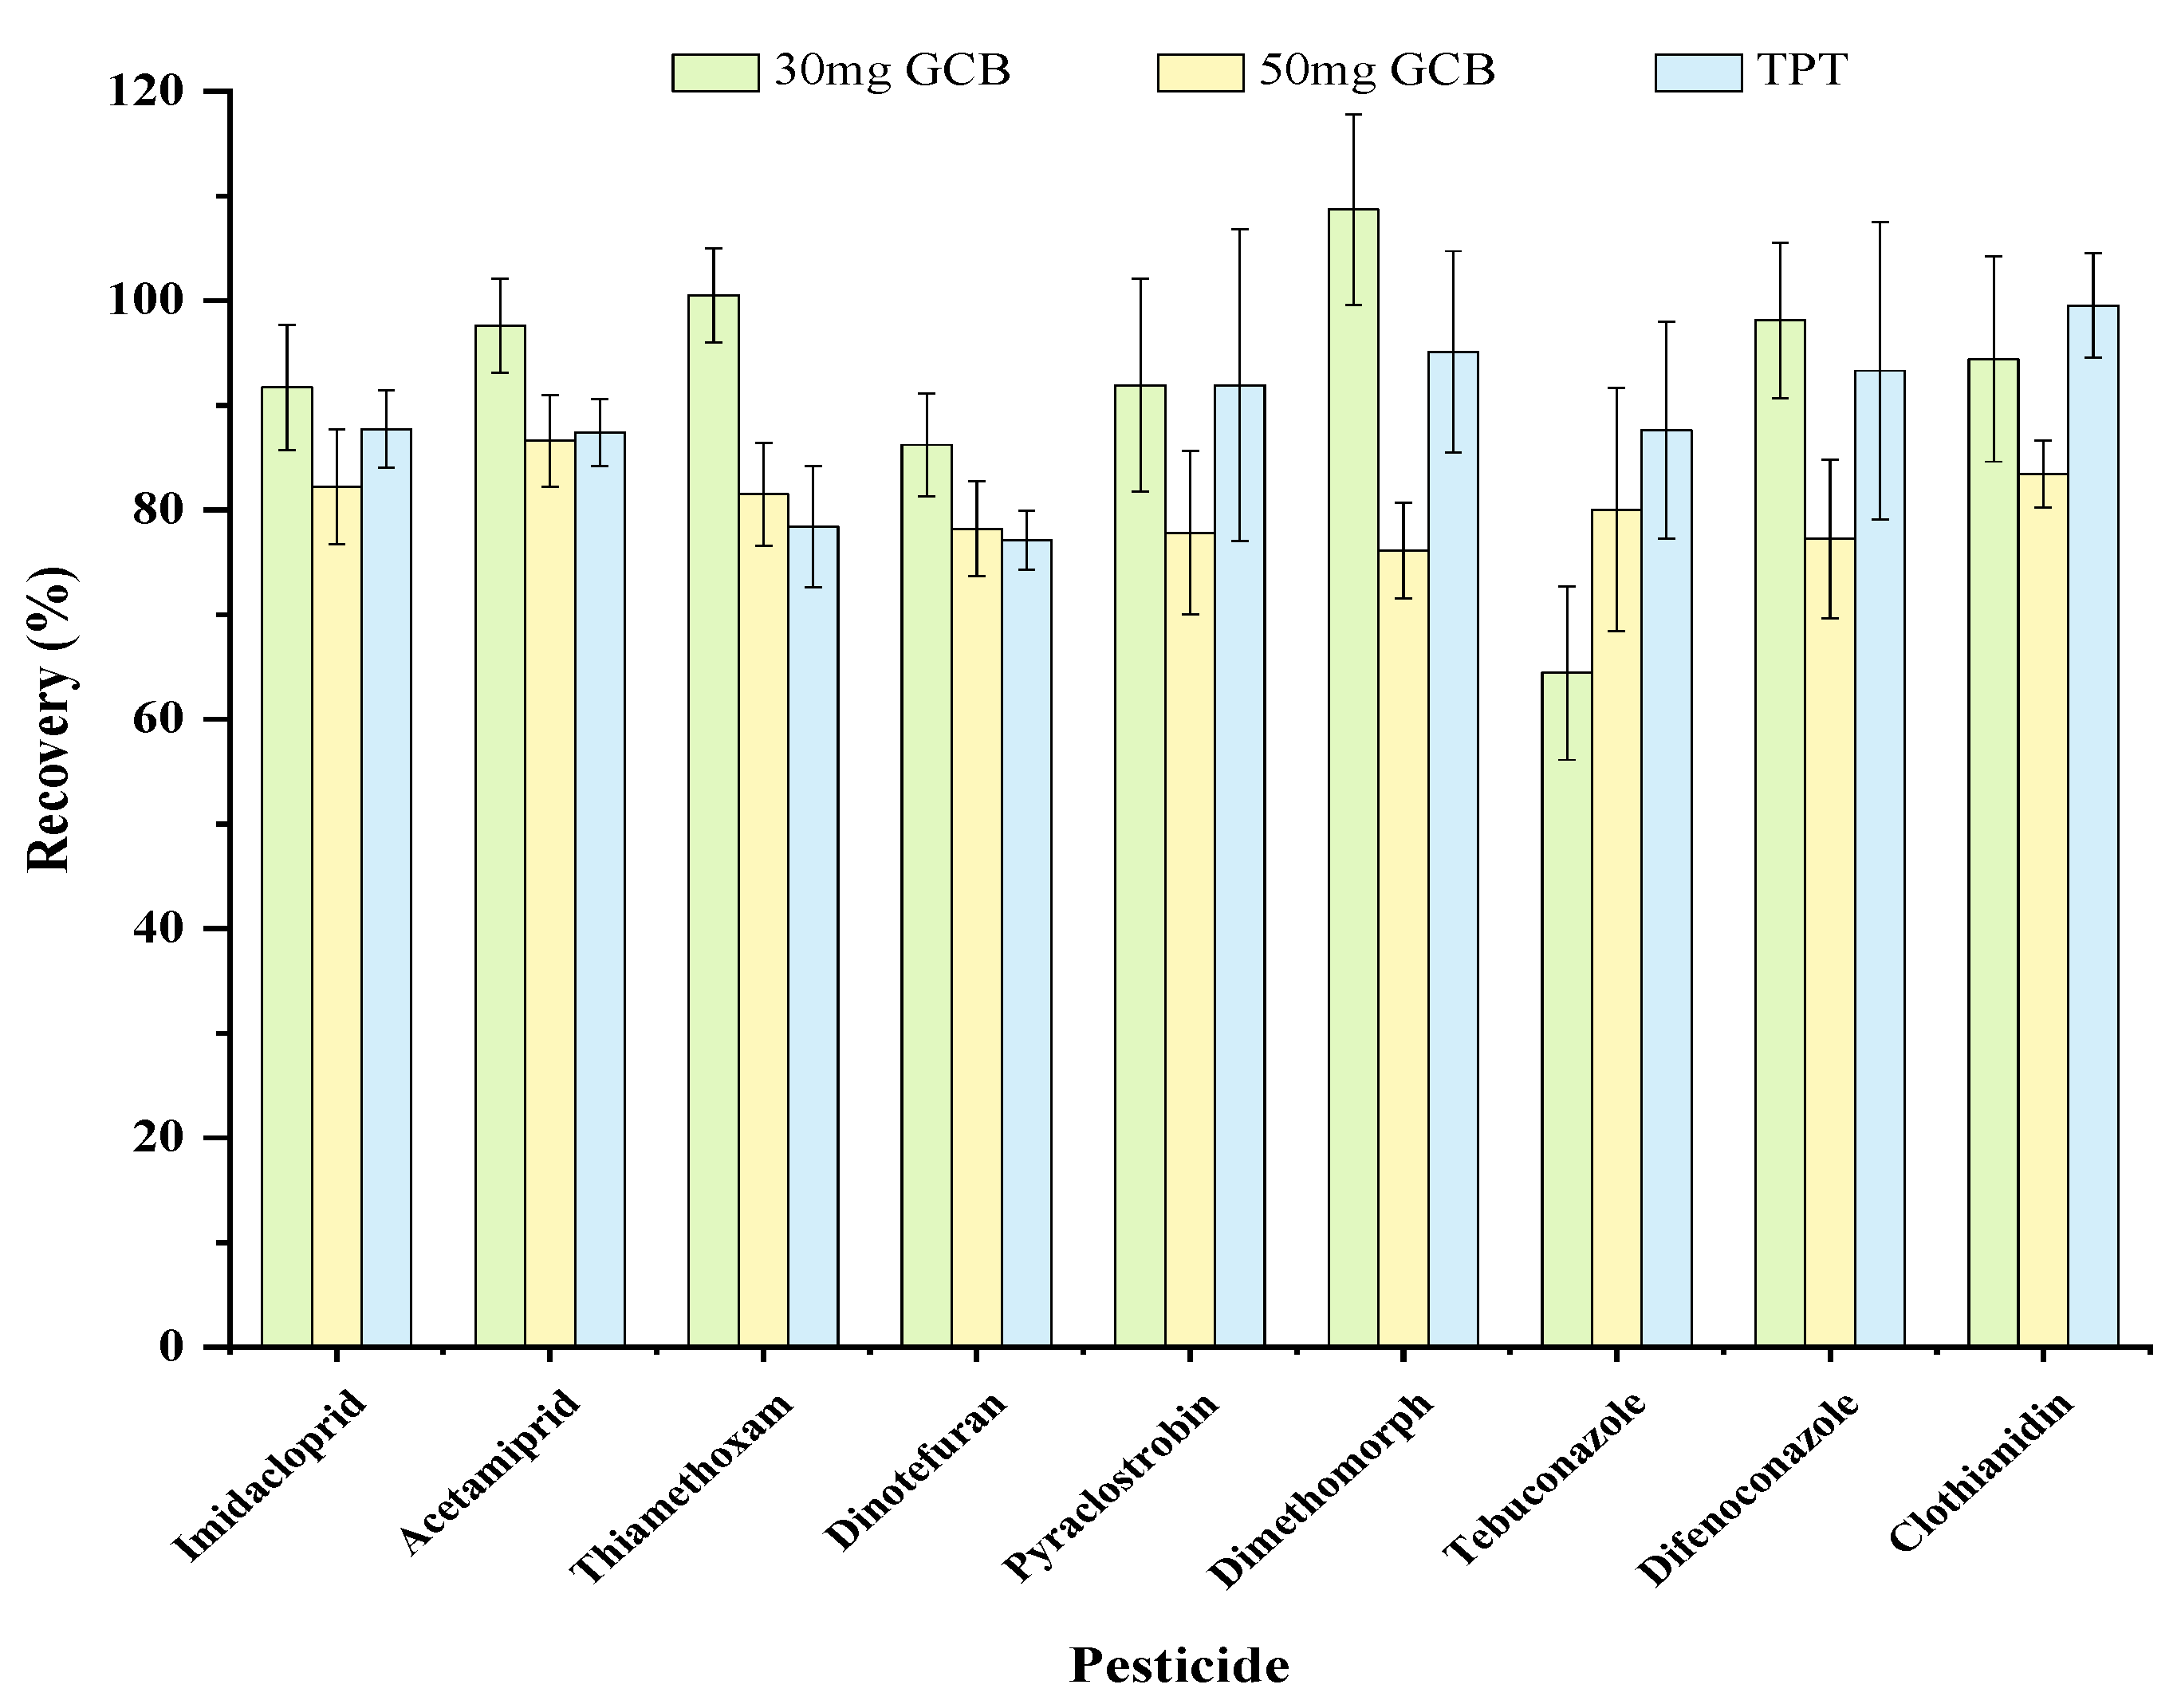
2.2. Optimisation of Sample Extraction and Clean-Up Procedure
2.3. Method Validation
2.3.1. Linearity, Matrix Effects and Limit of Detection
2.3.2. The Accuracy, Precision, and Limit of Quantification
2.4. Method Application
3. Materials and Methods
3.1. Materials and Reagents
3.2. Sample Preparations
3.3. UPLC-MS/MS Analytical Conditions
3.4. GC-MS/MS Analytical Conditions
3.5. Method Validation
4. Conclusions
Author Contributions
Funding
Institutional Review Board Statement
Informed Consent Statement
Data Availability Statement
Conflicts of Interest
Sample Availability
References
- Chan, K. Some aspects of toxic contaminants in herbal medicines. Chemosphere 2003, 52, 1361–1371. [Google Scholar] [CrossRef] [PubMed] [Green Version]
- Harris, E.S.; Cao, S.; Littlefield, B.A.; Craycroft, J.A.; Scholten, R.; Kaptchuk, T.; Fu, Y.L.; Wang, W.Q.; Liu, Y.; Chen, H.; et al. Heavy metal and pesticide content in commonly prescribed individual raw Chinese Herbal Medicines. Sci. Total Environ. 2011, 409, 4297–4305. [Google Scholar] [CrossRef] [Green Version]
- Wu, T.Y.; Khor, T.O.; Saw, C.L.L.; Loh, S.C.; Chen, A.I.; Lim, S.S.; Park, J.H.Y.P.; Cai, L.; Kong, A.N.T. Anti-inflammatory/Anti-oxidative stress activities and differential regulation of Nrf2-mediated genes by non-polar fractions of tea Chrysanthemum zawadskii and licorice Glycyrrhiza uralensis. AAPS J. 2011, 13, 1–13. [Google Scholar] [CrossRef] [Green Version]
- Ukiya, M.; Akihisa, T.; Tokuda, H.; Suzuki, H.; Mukainaka, T.; Ichiishi, E.; Yasukawa, K.; Kasahara, Y.; Nishino, H. Constituents of Compositae plants: III. Anti-tumor promoting effects and cytotoxic activity against human cancer cell lines of triterpene diols and triols from edible chrysanthemum flowers. Cancer Lett. 2002, 177, 7–12. [Google Scholar] [CrossRef] [PubMed]
- Xue, J.; Li, H.; Liu, F.; Xue, J.; Chen, X.; Zhan, J. Transfer of difenoconazole and azoxystrobin residues from chrysanthemum flower tea to its infusion. Food Addit. Contam. 2014, 31, 666–675. [Google Scholar] [CrossRef] [PubMed]
- Wang, Y.; Meng, Z.; Su, C.; Fan, S.; Li, Y.; Liu, H.; Zhang, X.; Chen, P.P.; Geng, Y.Y.; Li, Q. Rapid Screening of 352 Pesticide Residues in Chrysanthemum Flower by Gas Chromatography Coupled to Quadrupole-Orbitrap Mass Spectrometry with Sin-QuEChERS Nanocolumn Extraction. J. Anal. Methods Chem. 2022, 2022, 7684432. [Google Scholar] [CrossRef] [PubMed]
- Xiao, J.J.; Li, Y.; Fang, Q.K.; Shi, Y.H.; Liao, M.; Wu, X.W.; Hua, R.M.; Cao, H.Q. Factors affecting transfer of pyrethroid residues from herbal teas to infusion and influence of physicochemical properties of pesticides. Int. J. Environ. Res. Public Health 2017, 14, 1157. [Google Scholar] [CrossRef] [Green Version]
- Jiang, M.; Zhang, W.; Zhang, T.; Liang, G.; Hu, B.; Han, P.; Gong, W. Assessing transfer of pesticide residues from chrysanthemum flowers into tea solution and associated health risks. Ecotoxicol. Environ. Saf. 2020, 187, 109859. [Google Scholar] [CrossRef]
- Chen, Z.M.; Wan, H.B. Factors affecting residues of pesticides in tea. Pestic. Sci. 1988, 23, 109–118. [Google Scholar] [CrossRef]
- Sood, C.; Jaggi, S.; Kumar, V.; Ravindranath, S.D.; Shanker, A. How manufacturing processes affect the level of pesticide residues in tea. J. Sci. Food Agric. 2004, 84, 2123–2127. [Google Scholar] [CrossRef]
- Arcega, R.D.; Hou, C.Y.; Hsu, S.C.; Lin, C.M.; Chang, W.H.; Chen, H.L. Reduction of pesticide residues in Chrysanthemum morifolium by nonthermal plasma-activated water and impact on its quality. J. Hazard. Mater. 2022, 434, 128610. [Google Scholar] [CrossRef]
- Toumi, K.; Vleminckx, C.; Van Loco, J.; Schiffers, B. Pesticide residues on three cut flower species and potential exposure of florists in Belgium. Int. J. Environ. Res. Public Health 2016, 13, 943. [Google Scholar] [CrossRef] [Green Version]
- Tong, Y.; Xue, J.; Wu, X. Multi-residue pesticide determination in flos chrysanthemi by mixed mode SPE purification with GC-MS/MS analysis. Anal. Lett. 2013, 46, 615–629. [Google Scholar] [CrossRef]
- Feng, C.; Xu, Q.; Qiu, X.; Ji, J.; Lin, Y.; Le, S.; Xue, L.; Chen, Y.; She, J.; Xiao, P.; et al. Profiling of pesticides and pesticide transformation products in Chinese herbal teas. Food Chem. 2022, 383, 132431. [Google Scholar] [CrossRef] [PubMed]
- Kanu, A.B. Recent developments in sample preparation techniques combined with high-performance liquid chromatography: A critical review. J. Chromatogr. A 2021, 1654, 462444. [Google Scholar] [CrossRef] [PubMed]
- Wang, Z.; Wang, X.; Wang, M.; Li, Z.; Zhang, X.; Zhou, L.; Sun, H.; Yang, M.; Lou, Z.; Chen, Z.; et al. Establishment of a QuEChERS-UPLC-MS/MS Method for Simultaneously Detecting Tolfenpyrad and Its Metabolites in Tea. Agronomy 2022, 12, 2324. [Google Scholar] [CrossRef]
- Song, N.E.; Lee, J.Y.; Mansur, A.R.; Jang, H.W.; Lim, M.C.; Lee, Y.; Yoo, M.; Nam, T.G. Determination of 60 pesticides in hen eggs using the QuEChERS procedure followed by LC-MS/MS and GC-MS/MS. Food Chem. 2019, 298, 125050. [Google Scholar] [CrossRef]
- Li, Y.; An, Q.; Zhang, C.; Pan, C.; Zhang, Z. Comparison of Sin-QuEChERS Nano and d-SPE Methods for Pesticide Multi-Residues in Lettuce and Chinese Chives. Molecules 2020, 25, 3391. [Google Scholar] [CrossRef]
- Anastassiades, M.; Lehotay, S.J.; Štajnbaher, D.; Schenck, F.J. Fast and easy multiresidue method employing acetonitrile extraction/partitioning and “dispersive solid-phase extraction” for the determination of pesticide residues in produce. J. AOAC Int. 2003, 86, 412–431. [Google Scholar] [CrossRef] [Green Version]
- Lehotay, S.J.; Son, K.A.; Kwon, H.; Koesukwiwat, U.; Fu, W.; Mastovska, K.; Hoh, E.; Leepipatpiboon, N. Comparison of QuEChERS sample preparation methods for the analysis of pesticide residues in fruits and vegetables. J. Chromatogr. A 2010, 1217, 2548–2560. [Google Scholar] [CrossRef]
- Xiu-Ping, Z.; Lin, M.; Lan-Qi, H.; Jian-Bo, C.; Li, Z. The optimization and establishment of QuEChERS-UPLC-MS/MS method for simultaneously detecting various kinds of pesticides residues in fruits and vegetables. J. Chromatogr. B 2017, 1060, 281–290. [Google Scholar] [CrossRef]
- Cieślik, E.; Sadowska-Rociek, A.; Ruiz, J.M.M.; Surma-Zadora, M. Evaluation of QuEChERS method for the determination of organochlorine pesticide residues in selected groups of fruits. Food Chem. 2011, 125, 773–778. [Google Scholar] [CrossRef]
- Śniegocki, T.; Sell, B.; Giergiel, M.; Posyniak, A. QuEChERS and HPLC-MS/MS combination for the determination of chloramphenicol in twenty two different matrices. Molecules 2019, 24, 384. [Google Scholar] [CrossRef] [PubMed] [Green Version]
- Kim, S.W.; Lim, D.J.; Kim, I.S. Simultaneous Analysis of Fenpropimorph and Fenpropimorph Acid in Six Different Livestock Products Using a Single-Sample Preparation Method Followed by Liquid Chromatography-Tandem Mass Spectrometry. Molecules 2021, 26, 5791. [Google Scholar] [CrossRef] [PubMed]
- Fan, X.; Tang, T.; Du, S.; Sang, N.; Huang, H.; Zhang, C.; Zhao, X. Simultaneous Determination of 108 Pesticide Residues in Three Traditional Chinese Medicines Using a Modified QuEChERS Mixed Sample Preparation Method and HPLC-MS/MS. Molecules 2022, 27, 7636. [Google Scholar] [CrossRef]
- Han, Y.; Zou, N.; Song, L.; Li, Y.; Qin, Y.; Liu, S.; Li, X.; Pan, C. Simultaneous determination of 70 pesticide residues in leek, leaf lettuce and garland chrysanthemum using modified QuEChERS method with multi-walled carbon nanotubes as reversed-dispersive solid-phase extraction materials. J. Chromatogr. B 2015, 1005, 56–64. [Google Scholar] [CrossRef]
- Kadam, U.S.; Trinh, K.H.; Kumar, V.; Lee, K.W.; Cho, Y.; Can, M.H.T.; Lee, H.; Kim, Y.; Kang, J.; Kim, J.; et al. Identification and structural analysis of novel malathion-specific DNA aptameric sensors designed for food testing. Biomaterials 2022, 121617. [Google Scholar] [CrossRef]
- Huang, Y.; Shi, T.; Luo, X.; Xiong, H.; Min, F.; Chen, Y.; Nie, S.; Xie, M. Determination of multi-pesticide residues in green tea with a modified QuEChERS protocol coupled to HPLC-MS/MS. Food Chem. 2019, 275, 255–264. [Google Scholar] [CrossRef]
- Li, S.; Yu, P.; Zhou, C.; Tong, L.; Li, D.; Yu, Z.; Zhao, Y. Analysis of pesticide residues in commercially available chenpi using a modified QuEChERS method and GC-MS/MS determination. J. Pharm. Anal. 2020, 10, 60–69. [Google Scholar] [CrossRef]
- Chen, H.; Pan, M.; Pan, R.; Zhang, M.; Liu, X.; Lu, C. Transfer rates of 19 typical pesticides and the relationship with their physicochemical property. J. Agric. Food Chem. 2015, 63, 723–730. [Google Scholar] [CrossRef] [PubMed]
- Lozowicka, B.; Ilyasova, G.; Kaczynski, P.; Jankowska, M.; Rutkowska, E.; Hrynko, I.; Mojsak, P.; Szabunko, J. Multi-residue methods for the determination of over four hundred pesticides in solid and liquid high sucrose content matrices by tandem mass spectrometry coupled with gas and liquid chromatograph. Talanta 2016, 151, 51–61. [Google Scholar] [CrossRef] [PubMed]
- Tang, H.; Ma, L.; Huang, J.; Li, Y.; Liu, Z.; Meng, D.; Wen, G.; Dong, M.; Zhao, L. Residue behavior and dietary risk assessment of six pesticides in pak choi using QuEChERS method coupled with UPLC-MS/MS. Ecotoxicol. Environ. Saf. 2021, 213, 112022. [Google Scholar] [CrossRef] [PubMed]


| UPLC-MS/MS | ||||||||
|---|---|---|---|---|---|---|---|---|
| Group No. | No. | Pesticide | Retention Time | Cone voltage | Quantification | Confirmation | ||
| (min) | (V) | Ion transitions (m/z) | CE/V | Ion transitions (m/z) | CE/V | |||
| 1 | 1 | Imidacloprid | 6.57 | 28 | 256 > 175 | 20 | 256 > 209 | 15 |
| 2 | Acetamiprid | 6.90 | 30 | 223 > 126 | 20 | 223 > 56 | 15 | |
| 3 | Thiamethoxam | 6.01 | 20 | 292 > 211 | 12 | 292 > 181 | 28 | |
| 4 | Dinotefuran | 5.31 | 15 | 203 > 129 | 12 | 203 > 157 | 8 | |
| 5 | Pyraclostrobin | 8.45 | 25 | 388 > 194 | 10 | 388 > 163 | 20 | |
| 6 | Dimethomorph | 8.07 | 35 | 388 > 301 | 20 | 388 > 164 | 40 | |
| 7 | Tebuconazole | 8.40 | 32 | 308 > 70 | 25 | 308 > 125 | 35 | |
| 8 | Difenoconazole | 8.53 | 35 | 406 > 251 | 30 | 406 > 337 | 15 | |
| 9 | Clothianidin | 6.70 | 15 | 250 > 169 | 15 | 250 > 132 | 20 | |
| GC-MS/MS | ||||||||
| Group No. | No. | Pesticide | Retention time | Quantification | Confirmation | |||
| (min) | Ion transitions(m/z) | CE/eV | Ion transitions (m/z) | CE/eV | ||||
| 2 | 1 | Bifenthrin | 28.60 | 181.2 > 165.2 | 25 | 181.2 > 166.2 | 10 | |
| 2 | Cypermethrin | 31.75 | 181.0 > 152.1 | 25 | 163.0 > 91.0 | 10 | ||
| 3 | Cyhalothrin | 29.87 | 181.1 > 152.0 | 25 | 197.0 > 141.0 | 10 | ||
| 4 | Chlorfenapyr | 24.84 | 362.6 > 247.0 | 30 | 362.6 > 308.0 | 36 | ||
| 5 | Deltamethrin | 33.40 | 250.7 > 172.0 | 5 | 181.0 > 152.1 | 25 | ||
| 6 | Chlorpyrifos | 20.32 | 196.6 > 169.0 | 15 | 198.9 > 171.0 | 15 | ||
| Pesticide | Matrix | Linear Range (mg L−1) | Regression Equation | R2 | MEs | LODs (mg kg−1, mg L−1) |
|---|---|---|---|---|---|---|
| Imidacloprid | Fresh flower | 0.01–1 | y = 139,567x + 2881 | 0.9909 | −71.2 | 0.006 |
| Dry tea | y = 72,481x + 2032 | 0.9990 | −80.2 | |||
| Infusion | y = 289,810x + 7562 | 0.9988 | −26.1 | |||
| Acetamiprid | Fresh flower | 0.01–1 | y = 781,946x + 26,204 | 0.9951 | −73.9 | 0.0004 |
| Dry tea | y = 368,802x + 18,433 | 0.9999 | −87.7 | |||
| Infusion | y = 2,018,129x + 66,236 | 0.9911 | −17.4 | |||
| Thiamethoxam | Fresh flower | 0.01–1 | y = 330,845x + 22,513 | 0.9974 | −51.7 | 0.002 |
| Dry tea | y = 139,527x + 1150 | 0.9987 | −77.9 | |||
| Infusion | y = 647,351x + 12,317 | 0.9985 | −4.7 | |||
| Dinotefuran | Fresh flower | 0.01–1 | y = 601,655x + 23,365 | 0.9970 | −37.6 | 0.0009 |
| Dry tea | y = 427,799x + 14,629 | 0.9988 | −53.5 | |||
| Infusion | y = 816,026x + 54,288 | 0.9915 | −1.6 | |||
| Pyraclostrobin | Fresh flower | 0.01–1 | y = 867,185x + 5502 | 0.9958 | −83.5 | 0.01 |
| Dry tea | y = 95,703x + 2706 | 0.9983 | −90.4 | |||
| Infusion | y = 9,628,154x − 39,671 | 0.9938 | −13.2 | |||
| Dimethomorph | Fresh flower | 0.01–1 | y = 778,443x + 13,553 | 0.9917 | −80.5 | 0.002 |
| Dry tea | y = 226,589x + 3247 | 0.9977 | −95.5 | |||
| Infusion | y = 2,268,069x + 8124 | 0.9994 | −45.2 | |||
| Tebuconazole | Fresh flower | 0.01–1 | y = 510,990x + 1532 | 1.0000 | −74.5 | 0.01 |
| Dry tea | y = 73,211x − 1524 | 0.9997 | −92.7 | |||
| Infusion | y = 1,748,172x + 8566 | 0.9997 | −33.5 | |||
| Difenoconazole | Fresh flower | 0.01–1 | y = 238,114x + 1088 | 0.9992 | −76.2 | 0.018 |
| Dry tea | y = 68,335x + 1954 | 0.9913 | −91.4 | |||
| Infusion | y = 2,051,773x + 1066 | 09989 | 0.4 | |||
| Clothianidin | Fresh flower | 0.01–1 | y = 114,447x − 1445 | 0.9977 | −68.8 | 0.003 |
| Dry tea | y = 72,440x + 39,324 | 0.9963 | −82.0 | |||
| Infusion | y = 160,687x + 273,688 | 0.9948 | −53.9 | |||
| Bifenthrin | Fresh flower | 0.01–1 | y = 7,594,842x − 97,294 | 0.9954 | 14.7 | 0.003 |
| Dry tea | y = 7,049,790x − 87,718 | 0.9954 | 6.5 | |||
| Infusion | y = 6,873,310x + 14,630 | 1.0000 | 3.8 | |||
| Cypermethrin | Fresh flower | 0.01–1 | y = 1,231,236x + 622 | 0.9991 | 46.6 | 0.04 |
| Dry tea | y = 165,641x − 247 | 0.9998 | 97.3 | |||
| Infusion | y = 140,052x − 298 | 1.0000 | 66.8 | |||
| Cyhalothrin | Fresh flower | 0.01–1 | y = 773,949x − 4788 | 0.9998 | 83.0 | 0.01 |
| Dry tea | y = 777,851x + 358 | 0.9999 | 83.9 | |||
| Infusion | y = 774,970x − 5280 | 0.9997 | 83.2 | |||
| Chlorfenapyr | Fresh flower | 0.01–1 | y = 47,735x − 918 | 0.9948 | 44.1 | 0.01 |
| Dry tea | y = 49,690x − 985 | 0.9911 | 50.0 | |||
| Infusion | y = 49,240x − 644 | 0.9983 | 48.7 | |||
| Deltamethrin | Fresh flower | 0.01–1 | y = 22,081x − 19 | 1.0000 | 17.6 | 0.012 |
| Dry tea | y = 36,047x + 33 | 1.0000 | 92.0 | |||
| Infusion | y = 27,163x − 116 | 0.9998 | 44.7 | |||
| Chlorpyrifos | Fresh flower | 0.01–1 | y = 1,276,562x + 5532 | 0.9999 | 93.7 | 0.004 |
| Dry tea | y = 1,006,677x + 12,749 | 0.9994 | 52.8 | |||
| Infusion | y = 1,062,913x + 689 | 0.9999 | 61.3 |
| Pesticide | Fresh Flower | Dry Tea | Infusion | |||||||||
|---|---|---|---|---|---|---|---|---|---|---|---|---|
| SL (mg kg−1) | AR (%) | RSD (%) | LOQ | SL (mg kg−1) | AR (%) | RSD (%) | LOQ | SL (mg L−1) | AR (%) | RSD (%) | LOQ | |
| Imidacloprid | 0.01 | 84.3 | 11.5 | 0.01 | 0.05 | 92.8 | 12.3 | 0.05 | 0.001 | 95.2 | 16.6 | 0.001 |
| 0.1 | 93.4 | 10.5 | 0.1 | 91.8 | 8.2 | 0.01 | 95.4 | 7.1 | ||||
| 1 | 100.8 | 8.5 | 1 | 90.9 | 7.4 | 0.1 | 91.4 | 6.9 | ||||
| Acetamiprid | 0.01 | 88.3 | 3.4 | 0.01 | 0.05 | 96.2 | 3.6 | 0.05 | 0.001 | 93.8 | 10.8 | 0.001 |
| 0.1 | 90.3 | 6.4 | 0.1 | 99.7 | 3.7 | 0.01 | 98.2 | 3.0 | ||||
| 1 | 93.4 | 8.2 | 1 | 89.9 | 5.5 | 0.1 | 96.2 | 4.7 | ||||
| Thiamethoxam | 0.01 | 89.7 | 6.0 | 0.01 | 0.05 | 93.7 | 10.8 | 0.05 | 0.001 | 95.0 | 15.3 | 0.001 |
| 0.1 | 105.1 | 5.7 | 0.1 | 95.7 | 4.7 | 0.01 | 91.1 | 5.3 | ||||
| 1 | 97.3 | 10.0 | 1 | 83.8 | 4.2 | 0.1 | 92.0 | 4.8 | ||||
| Dinotefuran | 0.01 | 75.9 | 2.2 | 0.01 | 0.05 | 85.4 | 4.3 | 0.05 | 0.001 | 89.6 | 12.5 | 0.001 |
| 0.1 | 88.5 | 8.3 | 0.1 | 92.9 | 6.8 | 0.01 | 87.5 | 6.4 | ||||
| 1 | 79.0 | 5.1 | 1 | 82.2 | 6.4 | 0.1 | 86.2 | 6.7 | ||||
| Pyraclostrobin | 0.01 | 93.3 | 9.4 | 0.01 | 0.05 | 79.4 | 5.0 | 0.05 | 0.001 | 101.5 | 7.0 | 0.001 |
| 0.1 | 101.1 | 7.8 | 0.1 | 93.6 | 15.7 | 0.01 | 97.8 | 4.0 | ||||
| 1 | 93.2 | 6.3 | 1 | 78.5 | 3.1 | 0.1 | 96.2 | 3.8 | ||||
| Dimethomorph | 0.01 | 96.5 | 10.7 | 0.01 | 0.05 | 87.0 | 9.4 | 0.05 | 0.001 | 92.4 | 11.3 | 0.001 |
| 0.1 | 90.8 | 11.7 | 0.1 | 97.7 | 8.3 | 0.01 | 99.0 | 3.8 | ||||
| 1 | 92.6 | 3.9 | 1 | 75.7 | 12.1 | 0.1 | 99.7 | 1.8 | ||||
| Tebuconazole | 0.01 | 86.1 | 15.2 | 0.01 | 0.05 | 106.6 | 18.2 | 0.05 | 0.001 | 94.3 | 4.3 | 0.001 |
| 0.1 | 100.0 | 2.6 | 0.1 | 88.2 | 15.7 | 0.01 | 102.2 | 5.7 | ||||
| 1 | 92.8 | 6.1 | 1 | 97.3 | 13.5 | 0.1 | 97.7 | 2.8 | ||||
| Difenoconazole | 0.01 | 103.6 | 3.7 | 0.01 | 0.05 | 102.4 | 8.3 | 0.05 | 0.001 | 91.8 | 9.0 | 0.001 |
| 0.1 | 102.5 | 5.0 | 0.1 | 97.6 | 6.5 | 0.01 | 102.3 | 6.0 | ||||
| 1 | 93.4 | 10.1 | 1 | 88.4 | 5.6 | 0.1 | 99.2 | 4.0 | ||||
| Clothianidin | 0.01 | 81.2 | 18.8 | 0.01 | 0.05 | 82.0 | 17.8 | 0.05 | 0.001 | 76.6 | 12.7 | 0.001 |
| 0.1 | 92.2 | 8.4 | 0.1 | 87.7 | 8.6 | 0.01 | 106.1 | 3.2 | ||||
| 1 | 99.6 | 4.3 | 1 | 91.2 | 18.7 | 0.1 | 101.4 | 4.3 | ||||
| Bifenthrin | 0.05 | 118.0 | 0.6 | 0.05 | 0.05 | 94.8 | 6.3 | 0.05 | 0.005 | 95.3 | 4.3 | 0.005 |
| 0.5 | 84.5 | 7.7 | 0.1 | 94.3 | 7.5 | 0.01 | 107.5 | 6.2 | ||||
| 1 | 90.5 | 11.3 | 1 | 107.4 | 8.6 | 0.1 | 100.2 | 3.9 | ||||
| Cypermethrin | 0.05 | 109.2 | 1.0 | 0.05 | 0.05 | 97.0 | 1.5 | 0.05 | 0.005 | 90.8 | 5.7 | 0.005 |
| 0.5 | 95.5 | 8.8 | 0.1 | 113.2 | 8.8 | 0.01 | 111.7 | 5.0 | ||||
| 1 | 88.3 | 13.1 | 1 | 111.3 | 6.9 | 0.1 | 88.8 | 5.9 | ||||
| Cyhalothrin | 0.05 | 118.2 | 1.5 | 0.05 | 0.05 | 104.1 | 6.6 | 0.05 | 0.005 | 88.2 | 4.5 | 0.005 |
| 0.5 | 103.6 | 19.2 | 0.1 | 97.5 | 4.4 | 0.01 | 105.5 | 6.8 | ||||
| 1 | 88.9 | 15.8 | 1 | 108.2 | 9.8 | 0.1 | 97.3 | 4.3 | ||||
| Chlorfenapyr | 0.05 | 115.1 | 2.6 | 0.05 | 0.05 | 88.0 | 18.8 | 0.05 | 0.005 | 100.7 | 8.3 | 0.005 |
| 0.5 | 77.1 | 8.6 | 0.1 | 95.7 | 7.2 | 0.01 | 109.6 | 7.8 | ||||
| 1 | 85.7 | 13.6 | 1 | 106.8 | 8.4 | 0.1 | 98.1 | 3.8 | ||||
| Deltamethrin | 0.05 | 104.9 | 7.8 | 0.05 | 0.05 | 103.8 | 12.9 | 0.05 | 0.005 | 78.2 | 8.0 | 0.005 |
| 0.5 | 81.7 | 18.1 | 0.1 | 100.2 | 7.2 | 0.01 | 110.5 | 8.3 | ||||
| 1 | 79.4 | 6.4 | 1 | 90.3 | 16.2 | 0.1 | 86.6 | 6.7 | ||||
| Chlorpyrifos | 0.05 | 116.0 | 2.4 | 0.05 | 0.05 | 98.8 | 10.8 | 0.05 | 0.005 | 91.8 | 1.0 | 0.005 |
| 0.5 | 79.9 | 13.8 | 0.1 | 96.0 | 4.6 | 0.01 | 107.6 | 10.2 | ||||
| 1 | 87.8 | 14.2 | 1 | 107.7 | 8.9 | 0.1 | 95.8 | 3.1 | ||||
| Pesticide | CN MRL | Detected Frequencies | Range | Exceeding MRL Frequencies |
|---|---|---|---|---|
| (mg kg−1) | (%) | (mg kg−1) | (%) | |
| Imidacloprid | 2 | 56 | <LOQ −2.00 | 2 |
| Acetamiprid | 10 * | 56 | <LOQ −2.80 | 0 |
| Thiamethoxam | 2 | 42 | <LOQ −3.32 | 2 |
| Dinotefuran | 20 * | 4 | <LOQ −0.41 | 0 |
| Pyraclostrobin | 10 * | 54 | <LOQ −6.45 | 0 |
| Dimethomorph | - | 16 | <LOQ −3.73 | - |
| Tebuconazole | - | 40 | <LOQ −3.54 | - |
| Difenoconazole | 10 * | 46 | <LOQ −2.22 | 0 |
| Clothianidin | 10 * | 28 | <LOQ −0.64 | 0 |
| Bifenthrin | 5 * | 56 | <LOQ −2.80 | 0 |
| Cypermethrin | 20 * | 64 | <LOQ −1.37 | 0 |
| Cyhalothrin | 15 * | 38 | <LOQ −0.41 | 0 |
| Chlorfenapyr | 20 * | 28 | <LOQ −1.14 | 0 |
| Deltamethrin | 10 * | 8 | <LOQ −1.40 | 0 |
| Chlorpyrifos | 2 * | 32 | <LOQ −5.02 | 8 |
Disclaimer/Publisher’s Note: The statements, opinions and data contained in all publications are solely those of the individual author(s) and contributor(s) and not of MDPI and/or the editor(s). MDPI and/or the editor(s) disclaim responsibility for any injury to people or property resulting from any ideas, methods, instructions or products referred to in the content. |
© 2023 by the authors. Licensee MDPI, Basel, Switzerland. This article is an open access article distributed under the terms and conditions of the Creative Commons Attribution (CC BY) license (https://creativecommons.org/licenses/by/4.0/).
Share and Cite
Wang, X.; Wang, Z.; Yu, J.; Wu, L.; Zhang, X.; Luo, F.; Chen, Z.; Zhou, L. Method Validation for Multi-Pesticide Residue Determination in Chrysanthemum. Molecules 2023, 28, 1291. https://doi.org/10.3390/molecules28031291
Wang X, Wang Z, Yu J, Wu L, Zhang X, Luo F, Chen Z, Zhou L. Method Validation for Multi-Pesticide Residue Determination in Chrysanthemum. Molecules. 2023; 28(3):1291. https://doi.org/10.3390/molecules28031291
Chicago/Turabian StyleWang, Xinru, Zihan Wang, Jiawei Yu, Luchao Wu, Xinzhong Zhang, Fengjian Luo, Zongmao Chen, and Li Zhou. 2023. "Method Validation for Multi-Pesticide Residue Determination in Chrysanthemum" Molecules 28, no. 3: 1291. https://doi.org/10.3390/molecules28031291