Abstract
Producers of milk and dairy products have been faced with the challenge of responding to European society’s demand for guaranteed animal welfare production. In recent years, measures have been taken to improve animal welfare conditions on farms and evaluation systems have been developed to certify them, such as the Welfare Quality® protocol. Among the markers used for this purpose, acute phase proteins stand out, with haptoglobin being one of the most relevant. However, the diagnostic power of these tools is limited and more sensitive and specific technologies are required to monitor animal health status. Different factors such as diet, stress, and diseases modify the metabolism of the animals, altering the composition of the milk in terms of oligosaccharides, proteins, and lipids. Thus, in order to study oxidative-stress-associated lipids, a collection of well-characterized milk samples, both by veterinary diagnosis and by content of the acute stress biomarker haptoglobin, was analyzed by mass spectrometry and artificial intelligence. Two lipid species (sphingomyelin and phosphatidylcholine) were identified as potential biomarkers of health status in dairy cows. Both lipids allow for the discrimination of milk from sick animals and also milk from those with stress. Moreover, lipidomics revealed specific lipid profiles depending on the origin of the samples and the degree of freedom of the animals on the farm. These data provide evidence for specific lipid changes in stressed animals and open up the possibility that haptoglobin could also affect lipid metabolism in cow’s milk.
1. Introduction
Cattle are the main producers of milk for human consumption, as well as for the production of dairy products in the European Union (EU) and in Spain [1]. Due to the high energy supply, the contribution of essential minerals and vitamins that it provides and the high-quality protein that it contains, bovine milk is a basic, complete, and balanced food [2]. Regarding the composition of cow’s milk, it is composed mostly of water, constituting around of 87% of the total. It also contains 4–5% of lactose, around 3% of protein, 3–4% of fat, 0.8% of minerals, and 0.1% of vitamins [3,4]. Milk fat contains thousands of lipid species [5]. Precisely, milk fat is composed of three classes of associated substances: neutral lipids, which are mostly triacylglycerides (TAG) (98%); polar lipids, mainly phospholipids of a complex nature (1%); and unsaponifiable substances (<1%) [5,6,7]. TAGs are the most abundant lipid species of milk fat and are an essential energy source for humans [5]. Their structures have a great influence on the physicochemical properties of milk fat, the quality of dairy products, and milk´s absorption efficiency in humans [8,9,10,11]. They are synthetized from around 400 different fatty acids (FAs) [12]. This factor makes cow´s milk contain the most complex fat of other natural fats [4]. Due to its importance, Giannuzzi et al. observed in a recent study that FA fingerprint could be a cow´s metabolic status indicator [13].
Nevertheless, milk fat also contains minor components such as glycerophospholipids (GPL), sphingolipids (SL), and glycolipids (GL). These are the main components that constitute milk fat’s globule membrane, which is the responsible for ensuring the stability of the oil in water (o/w) emulsion of milk [14,15]. Furthermore, in a recent study, researchers found that some glycerophospholipid species present in milk may be used as potential biomarkers for cow’s health [16].
In addition to potential lipidic biomarkers, there are also protein biomarkers, such as acute phase proteins (APP), for which the blood concentration varies in response to various inflammatory processes. APPs are classified into two groups, positive and negative, depending on whether their concentration increases or decreases in animals´ blood for animals suffering from a disturbance of their immune system [17,18,19]. Haptoglobin is the APP that suffers greater change in cattle´s milk and serum, and its concentration increases between 10 to 100 times with respect to the basal level. Haptoglobin presence in blood and milk has been frequently associated with cows´ different pathologies, determining that it is a non-specific marker of disease, inflammation, or stress [18,20]. This has aroused interest in the dairy industry, since the determination of haptoglobin could become a biomarker of well-being and, therefore, of milk quality [20,21,22,23].
Milk’s composition is not always constant as it continuously undergoes changes. The causes for these changes are numerous and with a relative weight, yet to be determined. Some of the most relevant are genetics, animal´s feed, the state of the lactation cycle and accumulated lactations, and the physiological state of the animals (pathologies or animal welfare) [2,7,24]. Specific actions, such as free access to pasture, increase lipid synthesis [25]. For example, due to pasture feeding, concentrations of unsaturated fatty acids, including conjugated linoleic acid (CLA), α-linolenic (LNA, 18:3n-3), and oleic acids, could be improved in milk [26]. On the other hand, due to the genetics of the animals, a higher incidence of certain diseases can be found compared to others, with the most common diseases being mastitis, lameness, metritis, and displacement of the abomasum [27]. Between them, mastitis is the most common disease, with an incidence that reaches up to 54.5% during the lactation period and that can also occur during the dry period [28]. The mastitis process has a negative impact on different aspects as it causes a decrease in milk yield, requires the removal of animals from the productive routine, and involves treatment and prevention costs and changes in milk composition that affect its quality [29]. Animals with a high milk yield have a greater predisposition to develop mastitis and suffer greater losses in milk production than those with a lower production [30].
Evaluation systems that integrate all of the factors that influence the welfare state of animals are complex to elaborate, and in the attempt to achieve this, hundreds of evaluation systems have been developed, with different strengths and weaknesses. The most widely accepted and applied programs in the respective territories are the European Welfare Quality® Assessment Protocol for dairy cattle (WQ), applicable in the European Union, the Dairy Farmers Assuring Responsible Management Program (FARM), applicable in the United States, and the Code of Welfare: Dairy Cattle (The Code), applicable in New Zealand. These three programs were created according to the most important needs and factors in each type of production [31]. The Welfare Quality® project is the largest cross-sectional study in the area of well-being developed by the European Commission to date and includes research from forty European and four Latin American research centers [32]. Obtaining a good result in the audits of this protocol grants a widely recognized recognition of quality, but it is not a mandatory regulation, even if it comes from studies financed by the European Union [31,33].
Hence, the aim of this work is to demonstrate that the acute stress protein haptoglobin is related to certain lipids in cows’ milk, supporting its use as a biomarker of stress and inflammatory and pathological processes. It is estimated that it is possible to identify subclinical or asymptomatic processes in the early stages of the course of a disease through the detection of haptoglobin in milk and that these processes involve a specific and identifiable alteration in the composition of milk´s fat. Despite the importance of FA in cow´s milk composition, due to the technology we used (MALDI) to detect possible biomarkers we have focused on GPLs, because of their abundance in bovine milk and their sensibility and precision to the mentioned technology. In the case of being able to identify these molecules, it would be possible to determine new biomarkers for the early detection of pathologies in dairy cattle.
2. Results
2.1. Identification of Lipid Compounds Positively or Negatively Correlated with Milk Haptoglobin Concentration
After determination of haptoglobin concentration by ELISA (Table A1), a set of milk samples was studied by mass spectrometry using an Autoflex III (Bruker, Billerica, MA, USA) supplied with MALDI source to find out whether there is a correlation between any lipid and haptoglobin concentrations. Several peaks displayed relatively high correlations with haptoglobin concentrations (Table 1). Lipid species were assigned to each m/z according to Liu et al.´s article “Comprehensive Characterization of Bovine Milk Lipids: Phospholipids, Sphingolipids, Glycolipids, and Ceramides” [34], as has previously been carried out in other works [35]. Figure 1 shows two notable examples of positive and negative correlations.

Table 1.
List of the seven peaks that present significant correlations with haptoglobin, its lipid assignment, and their isomers. The species found in this table are ionized with Cs.
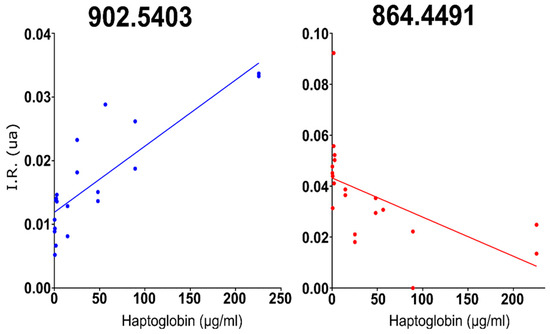
Figure 1.
The two peaks with the best positive and negative correlations to haptoglobin concentration in milk: 902.5403 (in blue) and 864.449 (in red).
2.2. Estimation of the Prevalence of Haptoglobin in Healthy Animals, Pathological Animals, and in the Milk Tanks of Different Farms
The assayed animals (n = 39) were distributed into three groups, one group with healthy animals (Figure 2A), another group with stressed animals (Figure 2B), and another group with animals suffering chronic stress (Figure 2C). The results of individual cows obtained in the Haptokit test for the detection of haptoglobin can be seen in Table A2. The results of each group obtained in the Haptokit test are shown in Figure 2. A higher prevalence of positive results in the Haptokit test was observed in pathological animals than in the other groups, with 50% (7/14) of the cows being positive. In the group of healthy animals, 24% (6/25) of the animals obtained a positive result in the test. Finally, all of the animals suffering chronic stress obtained a negative result in the Haptokit test, as haptoglobin is an acute phase protein.
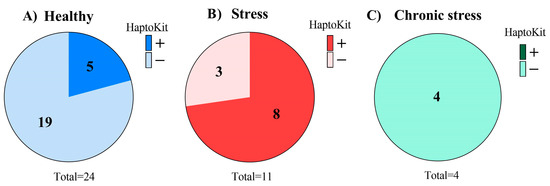
Figure 2.
Results of the Haptokit analysis on different milk samples. (A–C) Pie charts of the Haptokit results. The 39 animals were distributed into three groups, one with healthy animals (A), one with acutely stressed animals (B), and one with animals suffering from chronic stress (C).
To obtain additional information about the farms, haptoglobin detection was also carried out in the milk tanks of all of the farms (four farms in Aragón and five in Navarra) (Table 2). Two positive results were obtained in the milk tanks, which was of great interest due to the high capacity of the tanks.
Table 2.
Haptoglobin detection results in the milk tank samples.
In the case of the Fitero farm, they obtained a “good” rating in the last Welfare Quality audit (Table A3). On the other hand, Alfajarín farm is smaller than Fitero farm, with it containing 70 animals. This means that with a lower number of animals with haptoglobin in their milk, this manifests itself in an increase in the mixture of the entire farm. The weight of each individual’s contribution is greater in a smaller herd.
2.3. Lipidomic Analysis of the Milk Samples
The lipid profiles of the milk samples were obtained by mass spectrometry. Two spectra were made for each animal’s milk sample and also for the samples that were extracted from the milk storage tank.
The generated spectrums were normalized, smoothed, and aligned with each other, generating spectrums such as those in Figure 3.
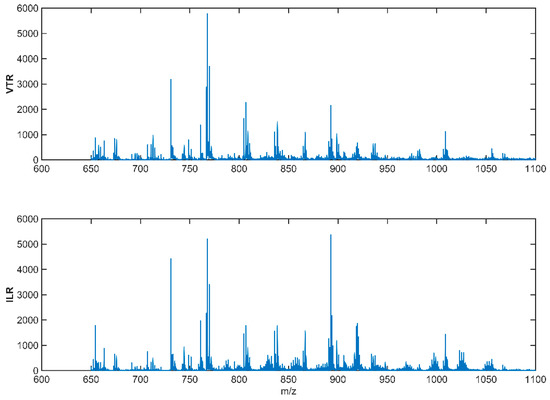
Figure 3.
Normalized, baseline-corrected, smoothed, and aligned spectra of two milk tank samples: Valtierra (VTR) tank sample above and Ilarregi (ILR) tank sample below. These spectra have been obtained in a range of 600–2000 Da mass range in positive ionization mode (MS + ) using a Bruker Autoflex mass spectrometer fitted with a MALDI source.
After processing the data, 248 peaks above the background noise and different from the matrix interferences were identified. The signal/noise ratio in all of the peaks that were screened was always greater than three. The peaks were tentatively assigned to the lipid species that could present an ionization with the mass/charge ratio detected, identifying species of phosphatidylcholines, phosphatidylserines, sphingomyelins, and glycerides.
2.4. Classification of the Milk Samples Based on Their Haptoglobin Concentration and Lipid Biomarkers
Despite the large deviations between the values of some of the variables, the lipidomic analysis performed led to the identification of a set of mass channels that displayed significant differences between haptoglobin-positive and -negative milk. Figure 4 shows a box plot with the differences between the 25 most significant peaks.
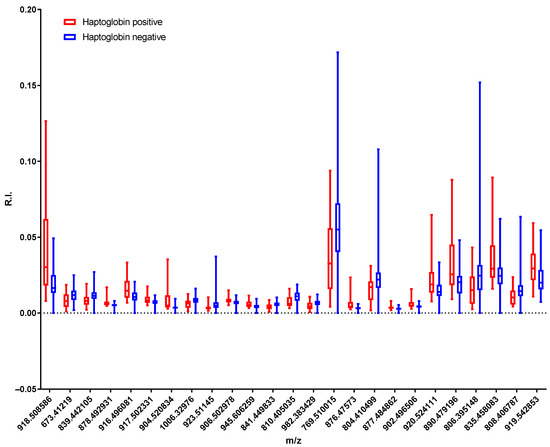
Figure 4.
Box plot of the 25 most significant peaks of all of the samples found in the t-test. The box extends from the 25th to 75th percentiles and the whiskers go down to the smallest value and up to the largest.
Principal component analysis (PCA) was performed using the 25 most significant peaks as variables in order to discriminate between the positive samples in the haptoglobin test and the negative ones. These peaks were selected based on the level of significance as a result of a Student’s t-test for this sample set (Table A4). The distribution generated by the PCA is shown in Figure 5.
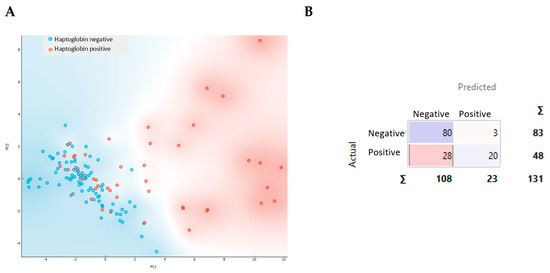
Figure 5.
Principal component analysis with the projection of components one and two for the samples according to haptoglobin results, in red for positive and in blue for negative (A), and the confusion matrix obtained (B).
The negative resultant samples for the haptoglobin test were clustered in the region between the coordinates (-2,-2) and (4,4). Samples with less than 2 µg/mL haptoglobin in milk were in this range, while most of the positive samples were found at higher values. PCA revealed that this group of positive samples are clearly different from the negative ones (Figure 5A). This finding was also observed when using a k-nearest neighbors (kNN) classifier, which achieved an accuracy of 78.8% and a Recall of 76.3% (Figure 5B and Figure A1).
3. Discussion
The presence of the acute phase protein haptoglobin in blood and milk has been frequently associated with different pathologies in cows, such as mastitis, with the haptoglobin considered as a non-specific marker of stress, inflammation, or disease [18,20]. Subclinical cases of mastitis are responsible for the most of the economic losses associated with this pathology [36,37,38,39]. In this regard, a positive result in the Haptokit test was obtained for two of the nine farms under study. In the case of Fitero farm, this could be due to the serious mastitis problems it was suffering with several sick cows (whose milk was not collected in the tank) and numerous animals that had recently overcome infections at the time of sampling. Therefore, it is possible that among the herd there would have been animals in an initial phase of the development of mastitis as a result of transmissibility between animals that were sharing facilities and generating a concentration of haptoglobin in the tank. Thus, early identification of pathologies in asymptomatic stages can significantly contribute to reducing these burdens by improving the economic situation of the farmers and the welfare of the animals. The decision-making that farmers have to make daily in the management of their animals is a highly relevant factor in the economic impact of pathological processes [40]. Therefore, the possibility of having information that backs up and supports decision-making is of great value, since it could be applied to reduce the period in which the animal is not productive and diminish the number of disease courses suffered by each animal and the treatment time in each of them. All of this incurs a positive effect for the welfare of the animals.
For this reason, the availability of biomarkers and assays to identify these situations or animal states has become one of the hot lines in the field. In this sense, the analysis of lipid biomarkers performed in this study clearly identified a cluster of haptoglobin-positive samples demonstrating the power of this technique to detect animals under acute stress. This methodology can be combined with microarrays to determine lipid fingerprints in a standardized and fast way providing a robust analysis that can be used to identify lipid-to-lipid or even protein-to-lipid relationships [41]. Lipidomic analyses has been widely used to study and also to identify lipidic biomarkers in several cancers such as melanoma or diseases and psychopathologies such as motivational deficits [42,43]. Moreover, dietary supplementation with certain lipids at the right time may prevent some of the symptoms occurring. For example, n-3 PUFA supplementation starting at birth, but not at weaning, seems to counteract the motivational deficits observed in mice with developmental deficiency in n-3 PUFA lipid species [42].
In the present study, the lipidomic analysis of cow’s milk samples performed by MALDI mass spectrometry revealed a set of biomarkers that strongly correlate with the presence of the acute phase protein haptoglobin. Phosphatidylcholines [PC_34:2], [PC_36:2] and [PC_36:3] were positively correlated with haptoglobin concentration, while [PC_28:0] and [PC_30:0] were negatively correlated. According to the bibliography on cow’s milk, the PC species [PC_28:0], [PC_30:0], [PC_34:2], [PC_36:2], and [PC_36:3] that correlate with haptoglobin concentration could correspond to PC (14:0/14:0), PC (16:0/14:0), PC (C16:0/C18:2), PC (C18:1/C18:1), and PC (C18:1/C18:2), respectively [44]. These data suggest that the presence of acute stress evoked a substitution of short-chain saturated phosphatidylcholines by longer-chain unsaturated ones in the cow’s milk that could anticipate prepathological stages. In this regard, Liu and coworkers describe in a lipidomic study performed on heat-stressed cow’s milk that TAG groups containing predominantly short- and medium-chain fatty acids were substituted by those containing mainly long-chain fatty acids, while the level of some polar lipid classes, especially LPC, were significantly reduced [16]. Heat stress can also be involved in our results as all the extractions of the samples were taken during the summer season, with maximum temperatures above 40 °C in the surroundings of the Ebro Valley. In fact, the concentrations of PCs that could be affected by heat stress in our results could correspond to PC (14:0/14:0), PC (16:0/14:0), PC (16:0/16:1), PC (16:0/18:2), PC (18:1/18:2), and PC (18:1/18:1) [16]. Different authors have indicated along the years that cattle are very sensitive to weather conditions, especially temperature and humidity [45,46,47,48]. High temperatures cause thermal stress in animals, which, when prolonged over time, has physiological effects and even clinical symptoms that can be seen with the naked eye [46]. Therefore, it is expected that one of the reasons why high haptoglobin levels were found in a significant percentage of healthy animals is the thermal stress to which animals were subjected during the dates on which the samples were taken [49]. Some previous studies have also proposed that exposure to heat stress can affect the milk fatty acid (FA) profile. In that sense, the abovementioned authors, Liu and coworkers, supplemented their lipidomic study with a global FA profile in a reduced cow’s cohort [16]. They described an increase in the content of long chain fatty acids (LCFA) accompanied by a reduction in short- and medium- chain fatty acids, similarly to other studies which also strictly controlled diet composition and feed [50] while others noted changes in unsaturated FA [51]. A limitation of the present research might be not including the milk FA profile, although some information can be obtained from a recent study [13]. These authors conducted a comprehensive analysis of the milk FA profile performed on a large number of cows (n = 297) and found no significant association between milk fatty acid (FA) and measured plasma haptoglobin levels [13]. In view of controversial outcomes, further experiments could be proposed in order to clarify these variations and other factors involved.
Another hypothesis that justifies the results obtained is that the animals classified as healthy were found to be suffering from a subclinical pathology without apparent symptoms, either because it was in the first phases or because it was a subclinical course. The prevalence of subclinical mastitis around the world is around 42%. Regarding the continental analysis, a high prevalence of subclinical mastitis was indicated in North America (46%), in Africa (44%)m and in Asia (42%). However, the prevalence of this subclinical pathology is lower in Europe (37%), in Oceania (36%), and in Latin America (34%) [52]. Despite not having official records or studies in Spain on the prevalence of diseases or injuries in dairy cattle farms, studies carried out in other countries are indicative. For example, in Finland, although there has been a sustained decline in the prevalence of subclinical mastitis over the last few decades, it endures at 19% [53]. Therefore, it is likely that a certain percentage of animals with a positive result for haptoglobin in milk is in a subclinical process.
Thus, the combination of acute stress haptoglobin with the lipid species identified in this study could be of great interest as a pathology marker in dairy cattle, allowing diagnosis to be anticipated after the development of symptoms and allowing the evolution of a disease to be monitored through specific biomarkers. This action would reduce non-productive periods and minimize treatments with a subsequent reduction in the associated economic losses [30].
4. Materials and Methods
4.1. Samples
Cow’s fresh milk samples were taken from nine different farms in the north of Spain: five farms from Navarra and four from Aragón. In all of the farms from Navarra, milk samples were taken from five healthy or pathological cows that were in the herd and were part of the milking rotation. At the same time, in some of these Navarrese farms, samples also were taken from some of the animals separated from the herd, which were suffering from an inflammatory process. A total of 25 milk samples were directly taken from the udders of supposedly healthy cows and a total of 14 milk samples from those in pathological process, collecting in both cases a volume of 50 mL. In addition, at the nine farms, samples were also taken from milk storage tanks after milking of the cows. The milking of the cows was carried out between 24 and 48 h before sampling; for this reason they were considered representative samples of the farm. All of the samples were frozen and kept at −20 °C until processing.
During sampling, information on the farm and the animals was collected, such as the location and size (number of cattle) of the farm, the feed of the animals, the Welfare Quality® score or rating from the last audit, the farm’s internal registration tag number, the age (years/months) of the animals, the number of lactations of the animals, and the type of pathology in the case of sick animals.
At the time of processing, samples were thawed at room temperature to prevent thermal damage to haptoglobin and coagulation of fat globules.
4.2. Haptokit
Haptokit is a sandwich-type immunoassay developed by the company IMG Pharma Biotech S.L. (Derio, Spain) which aids in the detection of haptoglobin through its specific binding to two antibodies at two different epitopes of the protein, with the limit of detection being 3 µg/mL.
The primary antibody is printed on a solid surface on which the incubation of the milk without previous treatment takes place (Figure 6). Subsequently, it is washed in a saline solution to remove the milk and it is incubated again with the antibody mixture. The second incubation solution is prepared prior, and in it, the union of the two antibodies takes place which allows for the generation of a colored precipitate observable with the naked eye: anti-haptoglobin antibody 1 and anti-antibody 1 antibody 2. Antibody 2 is the one with a molecule linked to the heavy chain that reacts with the development solution generating a blue precipitate proportional to the amount of protein that has been retained by the printed antibody.
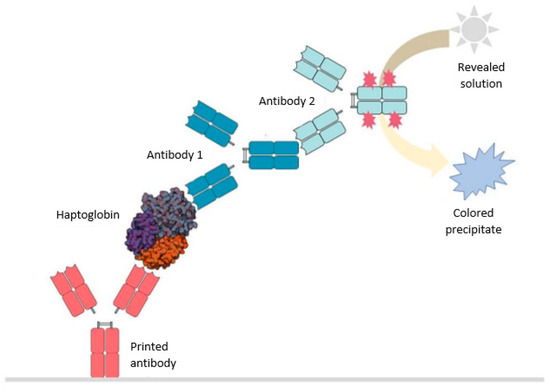
Figure 6.
Scheme of haptoglobin detection through the immunoassay developed in house at IMG Pharma Biotech S.L. for its use in fresh milk.
After incubation of the antibody mixture, another wash is performed in a saline solution to completely remove the antibodies that have not been retained by binding to haptoglobin, and this may generate a nonspecific signal. Finally, a final incubation process is carried out with the development solution that will cause the generation of the blue precipitate which will be considered as a positive result.
The test will be considered positive when the three points in which the blue-colored antibodies have been printed can be seen with the naked eye, with it normally being more comfortable to observe on a light-colored background (Figure 7). The results have been scanned in order to be able to compare the coloration under the same conditions, on the same background, and just after performing the test.
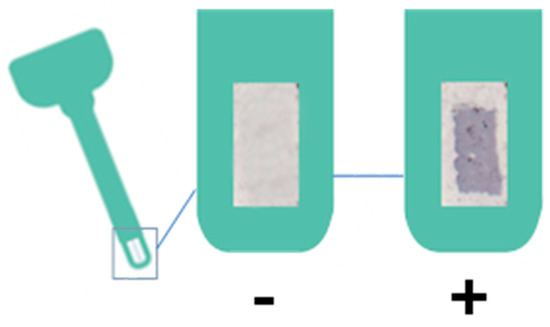
Figure 7.
Negative and positive result of the haptoglobin test.
4.3. MALDI-TOF Mass Spectrometry
Sample analysis was performed using an Autoflex III model mass spectrometer (Bruker, Billerica, MA, USA). This equipment has a solid-state laser that emits ultraviolet light at 355 nm. An average of 3000 shots per spectrum were made, avoiding the deposits of caseins and proteins that prevented the formation of crystals. Spectrums were acquired in the m/z interval from 600 to 2000 Da, the area in which lipids are expected to be found. The equipment has a flight tube as a mass analyzer, together with a multichannel plate (MCP) as an ion detector.
In this study, the “shotgun” strategy was followed for the application of spectrometry in the field of lipidomics. In this approach, the mass spectrum forms a lipid fingerprint of the analyzed sample, in which individual molecular species of most major and many minor lipid classes can be directly quantified without the need of chromatographic purification. This strategy is fast and highly sensitive and can identify hundreds of lipids missed by other methods using smaller amounts of sample; it is very useful to first determine differences in the lipid composition of the samples before identifying the species responsible for these changes. The objective of applying this technique is to observe variations in the lipid profiles of the distinct samples analyzed and to assess the similarities by applying different criteria for their grouping.
2-mercaptobenzothiazole (MBT) was used as a matrix for ionization in positive mode, with this being an ideal matrix for the detection of lipids that favor their ionization and presenting high stability under high vacuum conditions, an essential requirement for mass spectrometry.
The matrix was prepared in saturation in a buffer (IMG Pharma Biotech S.L.’s own development) that allows both optimal co-crystallization and ionization. The sample was diluted in the matrix solution 1:5 v/v (sample/matrix) performing a gentle homogenization to be later deposited on the conductive plate for analysis in the spectrometer.
A volume of 2 µL of the sample/matrix solution was deposited, allowing for crystallization by evaporation at room temperature. Each sample was analyzed in duplicate, including a matrix solution as a blank in order to remove interferences due to its ionization.
A Thermo LTQ Orbitrap XL mass spectrometer was used for fragmentation. An extract was prepared by mixing the three milk samples and the IPA protocol described by Iriondo et al. in 2019 [54] was used for lipid extraction. Once the lipid extraction was prepared, the MBT matrix was used as it was used when analyzing the samples in the Autoflex III model mass spectrometer (Bruker, Billerica, MA, USA). Firstly, a tentative identification of all the lipids detected in the full scan MS- was made and the peak corresponding to [PC 36:3–H]- was fragmented to confirm that the species were present in the milk and that the chains that compose it coincide with those of the article written by Liu et al. [34]. For this, a CID (collision-induced dissociation) with a collision energy of 90 was used.
4.4. Spectrum Processing
All the data generated in the mass spectrometer were processed through different computer applications developed by IMG Pharma Biotech S.L. using Matlab (MathWorks, Natick, MA, USA) as the main programming language. Before processing the data, all of the generated spectrums were exported from the files generated by the spectrometer and transformed into a format (.txt) in order to be able to work with the data in the previously mentioned applications.
Once the data were exported to .txt format, baseline correction was performed in order to adequately determine the intensity of the peaks. Alignment of all of the spectra was also performed by the method of correlation to the average spectrum. Subsequently, the data were smoothed using the Savitzky Golay algorithm for noise removal. Finally, normalization to total ionic current was performed and peaks with an S/N (signal/noise) ratio greater than three were selected.
The selected peaks were assigned by a database search using an algorithm owned by IMG Pharma Biotech S.L. in order to determine the lipid species corresponding to each m/z, taking into account the different ionizations they undergo.
4.5. Statistical Analyses
The homogeneity of the variances of the animals classified as healthy and pathological, and those that were positive in the haptoglobin detection test in milk versus the negative ones, was evaluated through the Fisher’s F test. On the other hand, to identify the peaks that present significant differences between the means of the healthy and pathological cows and, on the other hand, the positive and negative cows to the haptoglobin detection test in milk, t-test statistical analysis was used. Levene’s test was used to evaluate the hypothesis that the variances in the independent samples are similar, and its result allowed for validation of the possibility that they could be compared and considered as significant differences using the one-factor ANOVA test. One-factor analysis of variance was performed in cases where more than two groups were available (identification of the most relevant peaks to discern between the farms of origin of the samples). Pearson’s correlation coefficient was used to assess the correlation between the milk tanks of the farms and the respective samples of individual animals classified based on their status as pathological animals or healthy animals. In all of the statistical analyses, the confidence level used was 95%. All of the statistical analyses were performed using SPSS 26.0 (IBM, Endicott, NY, USA), Orange Biolab (University of Ljubljana), and Matlab.
4.6. Lipid Assignment
A tentative data assignment was made using a synthetic database and the Lipid Maps database. Some of the species found were confirmed using the database from the article written by Liu et al. on bovine milk [34]. To confirm that the lipid species identified in the article written by Liu et al. corresponded to those of the analyzed milk samples, MS/MS and MS3 analysis with MALDI was performed on the m/z corresponding to the adduct [PC 36:3-H]-(m/z 782.5), thus verifying its presence in the sample and that the majority of the isomers coincide with those indicated by Liu et al. in 2020 [34] (Figure A2).
Author Contributions
Conceptualization, D.R.-P., U.M., E.A., E.S., A.A. and G.B.-G.; methodology, R.F., S.C., E.N., M.G. and M.d.l.F.; software, R.F. and E.A.; validation, S.C., E.N. and M.d.l.F.; formal analysis, R.F.; investigation, Y.G.-A., D.R.-P. and G.B.-G.; resources, E.A. and U.M.; data curation, S.C.; writing—original draft preparation, Y.G.-A.; writing—review and editing, Y.G.-A., R.F., S.C., E.N., M.G., M.d.l.F., D.R.-P., U.M., E.A., E.S., A.A. and G.B.-G.; visualization, R.F.; supervision, G.B.-G.; project administration, E.A.; funding acquisition, E.A. and U.M. All authors have read and agreed to the published version of the manuscript.
Funding
This work is partially supported by the Basque Government, Bikaintek #010-B2/2021, and the Spanish Innovation Agency, AIE, Doctorados Industriales, #DIN2020-011349.
Institutional Review Board Statement
Not applicable.
Informed Consent Statement
Not applicable.
Data Availability Statement
The data presented in this study are available on request from the corresponding author. The data are not publicly available due to IPR.
Acknowledgments
The authors acknowledge R&D support from the University of the Basque Country and the University of Cantabria.
Conflicts of Interest
The authors declare no conflict of interest.
Appendix A
Table A1.
Milk control samples owned by IMG Pharma whose haptoglobin concentration was determined by ELISA.
Table A1.
Milk control samples owned by IMG Pharma whose haptoglobin concentration was determined by ELISA.
| Milk Sample | Haptoglobin Concentration (µg/mL) |
|---|---|
| 1 green | 14.71 |
| 2 green | 2.19 |
| 3 green | 89.2 |
| 1 blue | 1.81 |
| 2 blue | 0.37 |
| 3 blue | 56.4 |
| 1 red | 252.0 |
| 2 red | 225.6 |
| 3 red | 48.2 |
| Control | 2.86 |
Table A2.
Individual sample results for haptoglobin detection (>2 μg/mL) with the Haptokit test.
Table A2.
Individual sample results for haptoglobin detection (>2 μg/mL) with the Haptokit test.
| Animal Type | Farm’s Name | Samples | Results of the Haptokit Test | Prevalence of Positive Results in Each Animal Group |
|---|---|---|---|---|
| Healthy cows | Marcilla farm | 1 | − | |
| 2 | + | |||
| 3 | − | |||
| 4 | + | |||
| 5 | − | |||
| Valtierra farm | 6 | − | ||
| 7 | − | |||
| 8 | − | |||
| 9 | − | |||
| 10 | − | |||
| Murchante farm | 11 | − | 24% | |
| 12 | − | |||
| 13 | − | |||
| 14 | − | |||
| 15 | + | |||
| Fitero farm | 16 | - | ||
| 17 | − | |||
| 18 | − | |||
| 19 | + | |||
| 20 | + | |||
| Ilarregi farm | 21 | - | ||
| 22 | + | |||
| 23 | − | |||
| 24 | − | |||
| 25 | − | |||
| Pathological cows | Marcilla farm | 1 | + | 50% |
| 2 | − | |||
| 3 | − | |||
| Valtierra farm | 4 | + | ||
| Murchante farm | 5 | + | ||
| 6 | − | |||
| Fitero farm | 7 | + | ||
| 8 | − | |||
| 9 | + | |||
| 10 | + | |||
| Ilarregi farm | 11 | − | ||
| 12 | + | |||
| 13 | − | |||
| 14 | − |
Table A3.
Summary of the data obtained from the farms on which the samples were taken.
Table A3.
Summary of the data obtained from the farms on which the samples were taken.
| Farm’s Name | Reference | Healthy Animal Samples | Pathological Animal Samples | Tank’s Samples | Nº of Cattle | More Recent Welfare Quality® Qualification | Feed | Observations |
|---|---|---|---|---|---|---|---|---|
| Alfajarín | ALF | - | - | 1 | 70 | GOOD | - | Full tank of two milking batches. |
| Montañana | MNT | - | - | 1 | 50 | ENOUGH | - | Full tank of two milking batches. |
| Miralbueno | MRB | - | - | 1 | 60 | GOOD | - | Full tank of two milking batches. |
| Movera | MVR | - | - | 1 | 120 | GOOD | - | Full tank of two milking batches. |
| Marcilla | MAR | 5 | 3 | 1 | 90 | ENOUGH | 12 kg feed + 10 kg alfalfa silo + 12 kg ray grass silo + 4 kg fescue silo + 4 kg pea silo + 0.6 kg straw | Samples collected during afternoon milking. Temperatures above 40 °C. |
| Valtierra | VTR | 5 | 1 | 1 | 105 | GOOD | 11 kg feed + 10 kg silo ray grass + 13 kg silo corn + 10 kg pulp beetroot + 1 kg straw + 4 kg alfalfa silo | Samples collected during afternoon milking from a single batch. Heat and storm during the visit. |
| Murchante | MCH | 5 | 2 | 1 | 260 | ENOUGH | - | Samples taken during morning milking with the tank full from two milking runs. Sick animals have their own stables. |
| Fitero | FTR | 5 | 4 | 1 | 90 | GOOD | 12 kg feed + 10 kg ray grass silo + 26 kg corn silo | Tank sample from two milking batches, collected on an afternoon with temperatures above 40 °C. Farm with mastitis problems, active epidemic, and with numerous affected animals throughout the summer. |
| Ilarregi | ILR | 5 | 4 | 1 | 30 | GOOD | 10 kg feed + 15 kg silo local grass + sheepherding at discretion | Animals with freedom and sheepherding on hills, which has caused them to be subject to different accidents. Above all, limps and back injuries due to the interaction between them. Sampling during the morning and with the tank full from milking. |
Table A4.
Mass channels showing significant differences between negative and positive values for haptoglobin. The relative magnification is (intensity (+)−intensity (-))/intensity (-). The species found in this table are ionized with Cs.
Table A4.
Mass channels showing significant differences between negative and positive values for haptoglobin. The relative magnification is (intensity (+)−intensity (-))/intensity (-). The species found in this table are ionized with Cs.
| m/z | Lipid # | Issomer I # | Issomer II # | Issomer III # | Issomer IIII # | Bartlett p Value | Mean Comparison Method | p Value | Sig | Relative Increase |
|---|---|---|---|---|---|---|---|---|---|---|
| 673.4122 | NM | 0.9043 | T-test (Parametric) | 0.0000 | **** | −0.340 | ||||
| 677.3009 | NM | 0.5619 | t-test (Parametric) | 0.0006 | *** | −0.230 | ||||
| 722.3078 | NM | 0.0382 | Wilcoxon (Non-parametric) | 0.0056 | ** | −0.239 | ||||
| 728.5111 | NM | 0.0016 | Wilcoxon (Non-parametric) | 0.0175 | * | −0.188 | ||||
| 764.5491 | NM | 0.0607 | t-test (Parametric) | 0.0095 | ** | −0.176 | ||||
| 769.51 | NM | 0.0359 | Wilcoxon (Non-parametric) | 0.0003 | *** | −0.361 | ||||
| 781.4299 | NM | 0.0000 | Wilcoxon (Non-parametric) | 0.0234 | * | −0.193 | ||||
| 792.5595 | NM | 0.2846 | t-test (Parametric) | 0.0214 | * | −0.145 | ||||
| 804.4105 | PE-P 32:2 | 14:0p/18:2 | 16:1p/16:1 | 0.0000 | Wilcoxon (Non-parametric) | 0.0002 | *** | −0.350 | ||
| 806.3951 | PE-P32:1 | 14:0p/18:1 | 16:0p/16:1 | 0.0000 | Wilcoxon (Non-parametric) | 0.0002 | *** | −0.426 | ||
| 807.422 | NM | 0.3173 | t-test (Parametric) | 0.0053 | ** | −0.192 | ||||
| 808.4068 | PC 28:1 | 14:0/14:1 | 10:0/18:1 | 10:0/18:1 | 16:1/12:0 | 0.0000 | Wilcoxon (Non-parametric) | 0.0002 | *** | −0.328 |
| 809.46 | SM 32:0 | d16:0/16:0 | d18:0/14:0 | 0.2844 | t-test (Parametric) | 0.0016 | ** | −0.177 | ||
| 810.405 | PC 28:0 | 16:0/12:0 | 14:0/14:0 | 0.2296 | t-test (Parametric) | 0.0001 | **** | −0.275 | ||
| 821.4216 | SM 33:1 | d17:1/16:0 | d18:1/15:0 | 0.7195 | t-test (Parametric) | 0.0360 | * | −0.098 | ||
| 835.4581 | SM 34:1 | d16:1/18:0 | d18:1/16:0 | 0.0001 | Wilcoxon (Non-parametric) | 0.0002 | *** | 0.423 | ||
| 836.469 | NM | 0.0000 | Wilcoxon (Non-parametric) | 0.0008 | *** | 0.286 | ||||
| 837.4799 | SM 34:0 | d18:0/16:0 | d16:0/18:0 | 0.0001 | Wilcoxon (Non-parametric) | 0.0146 | * | 0.170 | ||
| 838.43 | PC 30:0 | 16:0/14:0 | 0.9789 | t-test (Parametric) | 0.0010 | ** | −0.250 | |||
| 839.4421 | NM | 0.9406 | t-test (Parametric) | 0.0000 | **** | −0.293 | ||||
| 841.4498 | NM | 0.1850 | t-test (Parametric) | 0.0000 | **** | −0.253 | ||||
| 843.4841 | NM | 0.4795 | t-test (Parametric) | 0.0008 | *** | −0.218 | ||||
| 845.4523 | NM | 0.8644 | t-test (Parametric) | 0.0316 | * | −0.118 | ||||
| 851.4923 | NM | 0.0000 | Wilcoxon (Non-parametric) | 0.0482 | * | −0.169 | ||||
| 865.4501 | NM | 0.7561 | t-test (Parametric) | 0.0103 | * | −0.098 | ||||
| 876.4757 | PC-P 34:1 | 16:0p/18:1 | 0.0000 | Wilcoxon (Non-parametric) | 0.0000 | **** | 0.803 | |||
| 877.4849 | NM | 0.3720 | t-test (Parametric) | 0.0001 | **** | 0.280 | ||||
| 878.4929 | NM | 0.0000 | Wilcoxon (Non-parametric) | 0.0000 | **** | 0.430 | ||||
| 879.478 | NM | 0.4485 | t-test (Parametric) | 0.0253 | * | 0.121 | ||||
| 890.4792 | PE 37:2 | 19:1/18:1 | 0.0000 | Wilcoxon (Non-parametric) | 0.0004 | *** | 0.729 | |||
| 891.4703 | NM | 0.0008 | Wilcoxon (Non-parametric) | 0.0033 | ** | 0.328 | ||||
| 892.4964 | NM | 0.7175 | t-test (Parametric) | 0.0023 | ** | 0.263 | ||||
| 893.4884 | NM | 0.6588 | t-test (Parametric) | 0.0178 | * | 0.188 | ||||
| 902.4965 | PC-P 36:2 | 18:0p/18:2 | 0.0000 | Wilcoxon (Non-parametric) | 0.0001 | **** | 0.433 | |||
| 904.5208 | PC-P 36:1 | 18:0p/18:1 | 0.0000 | Wilcoxon (Non-parametric) | 0.0000 | **** | 1.357 | |||
| 906.503 | PC 35:1 | 17:0/18:1 | 17:1/18:0 | 19:1/16:0 | 0.2284 | t-test (Parametric) | 0.0000 | **** | 0.213 | |
| 908.5696 | NM | 0.6146 | t-test (Parametric) | 0.0415 | * | −0.099 | ||||
| 911.596 | NM | 0.0654 | t-test (Parametric) | 0.0337 | * | −0.179 | ||||
| 916.4961 | PC 36:3 | 18:1/18:2 | 18:0/18:3 | 16:0/20:3 | 0.0000 | Wilcoxon (Non-parametric) | 0.0001 | **** | 0.530 | |
| 917.5023 | NM | 0.0007 | Wilcoxon (Non-parametric) | 0.0002 | *** | 0.344 | ||||
| 918.5086 | PC 36:2 | 18:1/18:1 | 18:0/18:2 | 0.0000 | Wilcoxon (Non-parametric) | 0.0000 | **** | 1.284 | ||
| 919.5429 | SM 40:1 | d16:1/24:0 | d17:1/23:0 | d18:1/22:0 | 0.0009 | Wilcoxon (Non-parametric) | 0.0003 | *** | 0.396 | |
| 920.5241 | PC 36:1 | 18:0/18:1 | 0.0000 | Wilcoxon (Non-parametric) | 0.0001 | *** | 0.599 | |||
| 921.5324 | NM | 0.0184 | Wilcoxon (Non-parametric) | 0.0009 | *** | 0.299 | ||||
| 922.5318 | NM | 0.4771 | t-test (Parametric) | 0.0058 | ** | 0.142 | ||||
| 923.5115 | NM | 0.0000 | Wilcoxon (Non-parametric) | 0.0000 | **** | −0.412 | ||||
| 925.504 | NM | 0.2278 | t-test (Parametric) | 0.0082 | ** | −0.153 | ||||
| 945.6063 | SM 42:2 | d18:1/24:1 | 0.0125 | Wilcoxon (Non-parametric) | 0.0000 | **** | 0.380 | |||
| 946.5717 | NM | 0.0000 | Wilcoxon (Non-parametric) | 0.0002 | *** | 0.585 | ||||
| 957.558 | NM | 0.0010 | Wilcoxon (Non-parametric) | 0.0199 | * | −0.197 | ||||
| 961.587 | NM | 0.2321 | t-test (Parametric) | 0.0140 | * | −0.171 | ||||
| 962.5731 | NM | 0.0021 | Wilcoxon (Non-parametric) | 0.0307 | * | −0.170 | ||||
| 979.516 | NM | 0.2131 | t-test (Parametric) | 0.0287 | * | −0.167 | ||||
| 980.3565 | NM | 0.8849 | t-test (Parametric) | 0.0005 | *** | −0.239 | ||||
| 982.3834 | NM | 0.4531 | t-test (Parametric) | 0.0001 | **** | −0.277 | ||||
| 1006.3298 | NM | 0.4139 | t-test (Parametric) | 0.0000 | **** | −0.265 | ||||
| 1009.4115 | NM | 0.9389 | t-test (Parametric) | 0.0017 | ** | −0.189 | ||||
| 1010.3477 | NM | 0.7787 | t-test (Parametric) | 0.0066 | ** | −0.165 | ||||
| 1070.4714 | NM | 0.0026 | Wilcoxon (Non-parametric) | 0.0278 | * | −0.196 | ||||
| 1093.3747 | NM | 0.2474 | t-test (Parametric) | 0.0072 | ** | −0.225 | ||||
| 1119.465 | NM | 0.3233 | t-test (Parametric) | 0.0350 | * | −0.272 | ||||
| 1128.4544 | NM | 0.0882 | t-test (Parametric) | 0.0488 | * | −0.177 | ||||
| 1130.4393 | NM | 0.3415 | t-test (Parametric) | 0.0058 | ** | −0.273 | ||||
| 1138.4385 | NM | 0.0190 | Wilcoxon (Non-parametric) | 0.0063 | ** | −0.249 | ||||
| 1147.4911 | NM | 0.0128 | Wilcoxon (Non-parametric) | 0.0116 | * | −0.235 | ||||
| 1151.5643 | NM | 0.0000 | Wilcoxon (Non-parametric) | 0.0052 | ** | −0.466 | ||||
| 1175.9367 | NM | 0.0342 | Wilcoxon (Non-parametric) | 0.0296 | * | −0.202 | ||||
| 1178.7439 | NM | 0.0071 | Wilcoxon (Non-parametric) | 0.0151 | * | −0.270 | ||||
| 1189.9013 | NM | 0.0055 | Wilcoxon (Non-parametric) | 0.0370 | * | −0.296 | ||||
| 1206.6016 | NM | 0.3981 | t-test (Parametric) | 0.0360 | * | −0.259 | ||||
| 1261.6735 | NM | 0.0000 | Wilcoxon (Non-parametric) | 0.0060 | ** | −0.377 | ||||
| 1384.1603 | NM | 0.0000 | Wilcoxon (Non-parametric) | 0.0002 | *** | −0.622 |
(*) p-value <0.05; (**) p-value <0.01; (***) p-value <0.001; (****) p-value <0.0001. # Confirmed lipid species by UHPLC-HESI MS2. Adapted with permission from Ref. [34]. Copyright 2020, American Chemical Society. NM: no match.

Figure A1.
ROC curve of kNN for the haptoglobin class (-).
Figure A1.
ROC curve of kNN for the haptoglobin class (-).


Figure A2.
MS/MS and MS3 analysis of the extract of the mixture of the three different types of milk with MALDI on the m/z corresponding to the adduct [PC 36:3 -H]- (782.5).
Figure A2.
MS/MS and MS3 analysis of the extract of the mixture of the three different types of milk with MALDI on the m/z corresponding to the adduct [PC 36:3 -H]- (782.5).

References
- Dirección General de Producciones y Mercados Agrarios. Subdirección General de Producciones Ganaderas y Cinegéticas Informe de Coyuntura del Sector Vacuno de Leche; Madrid Spain. Available online: https://cpage.mpr.gob.es/ (accessed on 7 July 2022).
- Pilarczyk, R.; Wójcik, J.; Sablik, P.; Czerniak, P. Fatty Acid Profile and Health Lipid Indices in the Raw Milk of Simmental and Holstein-Friesian Cows from an Organic Farm. South Afr. J. Anim. Sci. 2015, 45, 30–38. [Google Scholar] [CrossRef]
- Pereira, P.C. Milk Nutritional Composition and Its Role in Human Health. Nutrition 2014, 30, 619–627. [Google Scholar] [CrossRef] [PubMed]
- Lindmark Månsson, H. Fatty Acids in Bovine Milk Fat. SNF Swed. Nutr. Found. 2008, 52, 1821. [Google Scholar] [CrossRef] [PubMed]
- Liu, Z.; Rochfort, S.; Cocks, B. Milk Lipidomics: What We Know and What We Don’t. Prog. Lipid Res. 2018, 71, 70–85. [Google Scholar] [CrossRef] [PubMed]
- Haug, A.; Høstmark, A.T.; Harstad, O.M. Bovine Milk in Human Nutrition—A Review. Lipids Health Dis. 2007, 6, 25. [Google Scholar] [CrossRef] [PubMed]
- Jensen, R.G. The Composition of Bovine Milk Lipids: January 1995 to December 2000. J. Dairy Sci. 2002, 85, 295–350. [Google Scholar] [CrossRef]
- Vyssotski, M.; Bloor, S.J.; Lagutin, K.; Wong, H.; Williams, D.B.G. Efficient Separation and Analysis of Triacylglycerols: Quantitation of β-Palmitate (OPO) in Oils and Infant Formulas. J. Agric. Food Chem. 2015, 63, 5985–5992. [Google Scholar] [CrossRef]
- Smiddy, M.A.; Huppertz, T.; van Ruth, S.M. Triacylglycerol and Melting Profiles of Milk Fat from Several Species. Int. Dairy J. 2012, 24, 64–69. [Google Scholar] [CrossRef]
- Zou, X.; Huang, J.; Jin, Q.; Guo, Z.; Liu, Y.; Cheong, L.; Xu, X.; Wang, X. Lipid Composition Analysis of Milk Fats from Different Mammalian Species: Potential for Use as Human Milk Fat Substitutes. J. Agric. Food Chem. 2013, 61, 7070–7080. [Google Scholar] [CrossRef]
- Narine, S.S.; Marangoni, A.G. Relating Structure of Fat Crystal Networks to Mechanical Properties: A Review. Food Res. Int. 1999, 32, 227–248. [Google Scholar] [CrossRef]
- Chilliard, Y.; Ferlay, A.; Mansbridge, R.M.; Doreau, M. Ruminant Milk Fat Plasticity: Nutritional Control of Saturated, Polyunsaturated, Trans and Conjugated Fatty Acids. Anim. Res. 2000, 49, 181–205. [Google Scholar] [CrossRef]
- Giannuzzi, D.; Toscano, A.; Pegolo, S.; Gallo, L.; Tagliapietra, F.; Mele, M.; Minuti, A.; Trevisi, E.; Marsan, P.A.; Schiavon, S.; et al. Associations between Milk Fatty Acid Profile and Body Condition Score, Ultrasound Hepatic Measurements and Blood Metabolites in Holstein Cows. Animals 2022, 12, 1202. [Google Scholar] [CrossRef] [PubMed]
- Contarini, G.; Povolo, M. Phospholipids in Milk Fat: Composition, Biological and Technological Significance, and Analytical Strategies. Int. J. Mol. Sci. 2013, 14, 2808. [Google Scholar] [CrossRef] [PubMed]
- Rombaut, R.; Dewettinck, K. Properties, Analysis and Purification of Milk Polar Lipids. Int. Dairy J. 2006, 16, 1362–1373. [Google Scholar] [CrossRef]
- Liu, Z.; Ezernieks, V.; Wang, J.; Wanni Arachchillage, N.; Garner, J.B.; Wales, W.J.; Cocks, B.G.; Rochfort, S. Heat Stress in Dairy Cattle Alters Lipid Composition of Milk. Sci. Rep. 2017, 7, 961. [Google Scholar] [CrossRef]
- Manimaran, A.; Kumaresan, A.; Jeyakumar, S.; Mohanty, T.K.; Sejian, V.; Kumar, N.; Sreela, L.; Arul Prakash, M.; Mooventhan, P.; Anantharaj, A.; et al. Potential of Acute Phase Proteins as Predictor of Postpartum Uterine Infections during Transition Period and Its Regulatory Mechanism in Dairy Cattle. Vet. World 2016, 9, 91–100. [Google Scholar] [CrossRef]
- Alonso-Fauste, I.; Andrés, M.; Iturralde, M.; Lampreave, F.; Gallart, J.; Álava, M.A. Proteomic Characterization by 2-DE in Bovine Serum and Whey from Healthy and Mastitis Affected Farm Animals. J. Proteom. 2012, 75, 3015–3030. [Google Scholar] [CrossRef]
- Bagga, A.; Randhawa, S.S.; Sharma, S.; Bansal, B.K. Acute Phase Response in Lame Crossbred Dairy Cattle. Vet. World 2016, 9, 1204. [Google Scholar] [CrossRef]
- Huzzey, J.M.; Duffield, T.F.; LeBlanc, S.J.; Veira, D.M.; Weary, D.M.; von Keyserlingk, M.A.G. Short Communication: Haptoglobin as an Early Indicator of Metritis. J. Dairy Sci. 2009, 92, 621–625. [Google Scholar] [CrossRef]
- Åkerstedt, M.; Björck, L.; Persson Waller, K.; Sternesjö, Å. Biosensor Assay for Determination of Haptoglobin in Bovine Milk. J. Dairy Res. 2006, 73, 299–305. [Google Scholar] [CrossRef]
- Grönlund, U.; Hallén Sandgren, C.; Persson Waller, K. Haptoglobin and Serum Amyloid A in Milk from Dairy Cows with Chronic Sub-Clinical Mastitis. Vet. Res. 2005, 36, 191–198. [Google Scholar] [CrossRef]
- Hiss, S.; Mueller, U.; Neu-Zahren, A.; Sauerwein, H. Haptoglobin and Lactate Dehydrogenase Measurements in Milk for the Identification of Subclinically Diseased Udder Quarters. Vet. Med. (Praha) 2007, 52, 245–252. [Google Scholar] [CrossRef]
- Heck, J.M.L.; van valenberg, H.J.F.; Dijkstra, J.; van Hooijdonk, A.C.M. Seasonal Variation in the Dutch Bovine Raw Milk Composition. J. Dairy Sci. 2009, 92, 4745–4755. [Google Scholar] [CrossRef] [PubMed]
- Hernández-Rodríguez, R.; Ponce-Ceballo, P. Effect of Silvopastoral Production Systems on Composition of Milk from Cattle. Livest. Res. Rural Dev. 2004, 16, 43. [Google Scholar]
- Nantapo, C.T.W.; Muchenje, V.; Hugo, A. Atherogenicity Index and Health-Related Fatty Acids in Different Stages of Lactation from Friesian, Jersey and Friesian×Jersey Cross Cow Milk under a Pasture-Based Dairy System. Food Chem. 2014, 146, 127–133. [Google Scholar] [CrossRef] [PubMed]
- Oltenacu, P.A.; Broom, D.M. The Impact of Genetic Selection for Increased Milk Yield on the Welfare of Dairy Cows. Anim. Welf. 2010, 19, 39–49. [Google Scholar] [CrossRef]
- Ruegg, P.L. Management of Mastitis on Organic and Conventional Dairy Farms. J. Anim. Sci. 2009, 87, 43–55. [Google Scholar] [CrossRef]
- Gomes, F.; Henriques, M. Control of Bovine Mastitis: Old and Recent Therapeutic Approaches. Curr. Microbiol. 2016, 72, 377–382. [Google Scholar] [CrossRef]
- Heikkilä, A.M.; Liski, E.; Pyörälä, S.; Taponen, S. Pathogen-Specific Production Losses in Bovine Mastitis. J. Dairy Sci. 2018, 101, 9493–9504. [Google Scholar] [CrossRef]
- Krueger, A.; Cruickshank, J.; Trevisi, E.; Bionaz, M. Systems for Evaluation of Welfare on Dairy Farms. J. Dairy Res. 2020, 87, 13–19. [Google Scholar] [CrossRef]
- Blokhuis, H.J. International Cooperation in Animal Welfare: The Welfare Quality® Project. Acta Vet. Scand. 2008, 50, S10. [Google Scholar] [CrossRef]
- de Vries, M.; Bokkers, E.A.M.; van Schaik, G.; Botreau, R.; Engel, B.; Dijkstra, T.; de Boer, I.J.M. Evaluating Results of the Welfare Quality Multi-Criteria Evaluation Model for Classification of Dairy Cattle Welfare at the Herd Level. J. Dairy Sci. 2013, 96, 6264–6273. [Google Scholar] [CrossRef] [PubMed]
- Liu, Z.; Li, C.; Pryce, J.; Rochfort, S. Comprehensive Characterization of Bovine Milk Lipids: Phospholipids, Sphingolipids, Glycolipids, and Ceramides. J. Agric. Food Chem. 2020, 68, 6726–6738. [Google Scholar] [CrossRef] [PubMed]
- Arena, P.; Rigano, F.; Guarnaccia, P.; Dugo, P.; Mondello, L.; Trovato, E. Elucidation of the Lipid Composition of Hemp (Cannabis Sativa L.) Products by Means of Gas Chromatography and Ultra-High Performance Liquid Chromatography Coupled to Mass Spectrometry Detection. Molecules 2022, 27, 3358. [Google Scholar] [CrossRef]
- Huijps, K.; Lam, T.J.G.M.; Hogeveen, H. Costs of Mastitis: Facts and Perception. J. Dairy Res. 2008, 75, 113–120. [Google Scholar] [CrossRef]
- De Vliegher, S.; Fox, L.K.; Piepers, S.; McDougall, S.; Barkema, H.W. Invited Review: Mastitis in Dairy Heifers: Nature of the Disease, Potential Impact, Prevention, and Control. J. Dairy Sci. 2012, 95, 1025–1040. [Google Scholar] [CrossRef]
- Sinha, M.K.; Thombare, N.N.; Mondal, B. Subclinical Mastitis in Dairy Animals: Incidence, Economics, and Predisposing Factors. Sci. World J. 2014, 2014, 523984. [Google Scholar] [CrossRef]
- Wani, S.A.; Haq, U.; Parray, O.R.; Ul, Q.; Nazir, A.; Mushtaq, M.; Bhat, R.A.; Parrah, J.U.; Chakraborty, S.; Dhama, K.; et al. A Brief Analysis of Economic Losses Due to Mastitis in Dairy Cattle. Indian Vet. J. 2022, 90, 27–31. [Google Scholar]
- Halasa, T.; Huijps, K.; Østerås, O.; Hogeveen, H. Economic Effects of Bovine Mastitis and Mastitis Management: A Review. Vet. Q. 2007, 29, 18–31. [Google Scholar] [CrossRef]
- Fernández, R.; Garate, J.; Tolentino-Cortez, T.; Herraiz, A.; Lombardero, L.; Ducrocq, F.; Rodríguez-Puertas, R.; Trifilieff, P.; Astigarraga, E.; Barreda-Gómez, G.; et al. Microarray and Mass Spectrometry-Based Methodology for Lipid Profiling of Tissues and Cell Cultures. Anal. Chem. 2019, 91, 15967–15973. [Google Scholar] [CrossRef]
- Ducrocq, F.; Walle, R.; Contini, A.; Oummadi, A.; Caraballo, B.; van der Veldt, S.; Boyer, M.-L.; Aby, F.; Tolentino-Cortez, T.; Helbling, J.C.; et al. Causal Link between N-3 Polyunsaturated Fatty Acid Deficiency and Motivation Deficits. Cell Metab. 2020, 31, 755–772.e7. [Google Scholar] [CrossRef] [PubMed]
- Perez-Valle, A.; Abad-García, B.; Fresnedo, O.; Barreda-Gómez, G.; Aspichueta, P.; Asumendi, A.; Astigarraga, E.; Fernández, J.A.; Boyano, M.D.; Ochoa, B. A UHPLC-Mass Spectrometry View of Human Melanocytic Cells Uncovers Potential Lipid Biomarkers of Melanoma. Int. J. Mol. Sci. 2021, 22, 12061. [Google Scholar] [CrossRef] [PubMed]
- Liu, Z.; Moate, P.; Cocks, B.; Rochfort, S. Comprehensive Polar Lipid Identification and Quantification in Milk by Liquid Chromatography-Mass Spectrometry. J. Chromatogr. B Anal. Technol. Biomed Life Sci. 2015, 978–979, 95–102. [Google Scholar] [CrossRef] [PubMed]
- Lees, A.M.; Sejian, V.; Wallage, A.L.; Steel, C.C.; Mader, T.L.; Lees, J.C.; Gaughan, J.B. The Impact of Heat Load on Cattle. Animals 2019, 9, 322. [Google Scholar] [CrossRef] [PubMed]
- Herbut, P.; Angrecka, S.; Walczak, J. Environmental Parameters to Assessing of Heat Stress in Dairy Cattle-a Review. Int. J. Biometeorol. 2018, 62, 2089–2097. [Google Scholar] [CrossRef]
- Mader, T.L.; Griffin, D. Management of Cattle Exposed to Adverse Environmental Conditions. Vet. Clin. N. Am. Food Anim. Pract. 2015, 31, 247–258. [Google Scholar] [CrossRef]
- Belasco, E.J.; Cheng, Y.; Schroeder, T.C. The Impact of Extreme Weather on Cattle Feeding Profits. J. Agric. Resour. Econ. 2015, 40, 285–305. [Google Scholar]
- Kim, W.S.; Lee, J.S.; Jeon, S.W.; Peng, D.Q.; Kim, Y.S.; Bae, M.H.; Jo, Y.H.; Lee, H.G. Correlation between Blood, Physiological and Behavioral Parameters in Beef Calves under Heat Stress. Asian-Australas J. Anim. Sci. 2018, 31, 919. [Google Scholar] [CrossRef]
- Penev, T.; Naydenova, N.; Dimov, D.; Marinov, I. Influence of Heat Stress and Physiological Indicators Related to It on Health Lipid Indices in Milk of Holstein-Friesian Cows. J. Oleo Sci. 2021, 70, 745–755. [Google Scholar] [CrossRef]
- Dauria, B.D.; Sigdel, A.; Petrini, J.; Bóscollo, P.P.; Pilonetto, F.; Salvian, M.; Rezende, F.M.; Pedrosa, V.B.; Bittar, C.M.M.; Machado, P.F.; et al. Genetic Effects of Heat Stress on Milk Fatty Acids in Brazilian Holstein Cattle. J. Dairy Sci. 2022, 105, 3296–3305. [Google Scholar] [CrossRef]
- Krishnamoorthy, P.; Goudar, A.L.; Suresh, K.P.; Roy, P. Global and Countrywide Prevalence of Subclinical and Clinical Mastitis in Dairy Cattle and Buffaloes by Systematic Review and Meta-Analysis. Res. Vet. Sci. 2021, 136, 561–586. [Google Scholar] [CrossRef] [PubMed]
- Hiitiö, H.; Vakkamäki, J.; Simojoki, H.; Autio, T.; Junnila, J.; Pelkonen, S.; Pyörälä, S. Prevalence of Subclinical Mastitis in Finnish Dairy Cows: Changes during Recent Decades and Impact of Cow and Herd Factors. Acta Vet. Scand. 2017, 59, 22. [Google Scholar] [CrossRef] [PubMed]
- Iriondo, A.; Tainta, M.; Saldias, J.; Arriba, M.; Ochoa, B.; Goñi, F.M.; Martinez-Lage, P.; Abad-García, B. Isopropanol Extraction for Cerebrospinal Fluid Lipidomic Profiling Analysis. Talanta 2019, 195, 619–627. [Google Scholar] [CrossRef] [PubMed]


Disclaimer/Publisher’s Note: The statements, opinions and data contained in all publications are solely those of the individual author(s) and contributor(s) and not of MDPI and/or the editor(s). MDPI and/or the editor(s) disclaim responsibility for any injury to people or property resulting from any ideas, methods, instructions or products referred to in the content. |
© 2023 by the authors. Licensee MDPI, Basel, Switzerland. This article is an open access article distributed under the terms and conditions of the Creative Commons Attribution (CC BY) license (https://creativecommons.org/licenses/by/4.0/).