
Fabrication of Naturally Derived Chitosan and Ilmenite Sand-Based TiO2/Fe2O3/Fe-N-Doped Graphitic Carbon Composite for Photocatalytic Degradation of Methylene Blue under Sunlight

 , ,
, ,
Abstract
:1. Introduction
2. Results and Discussion
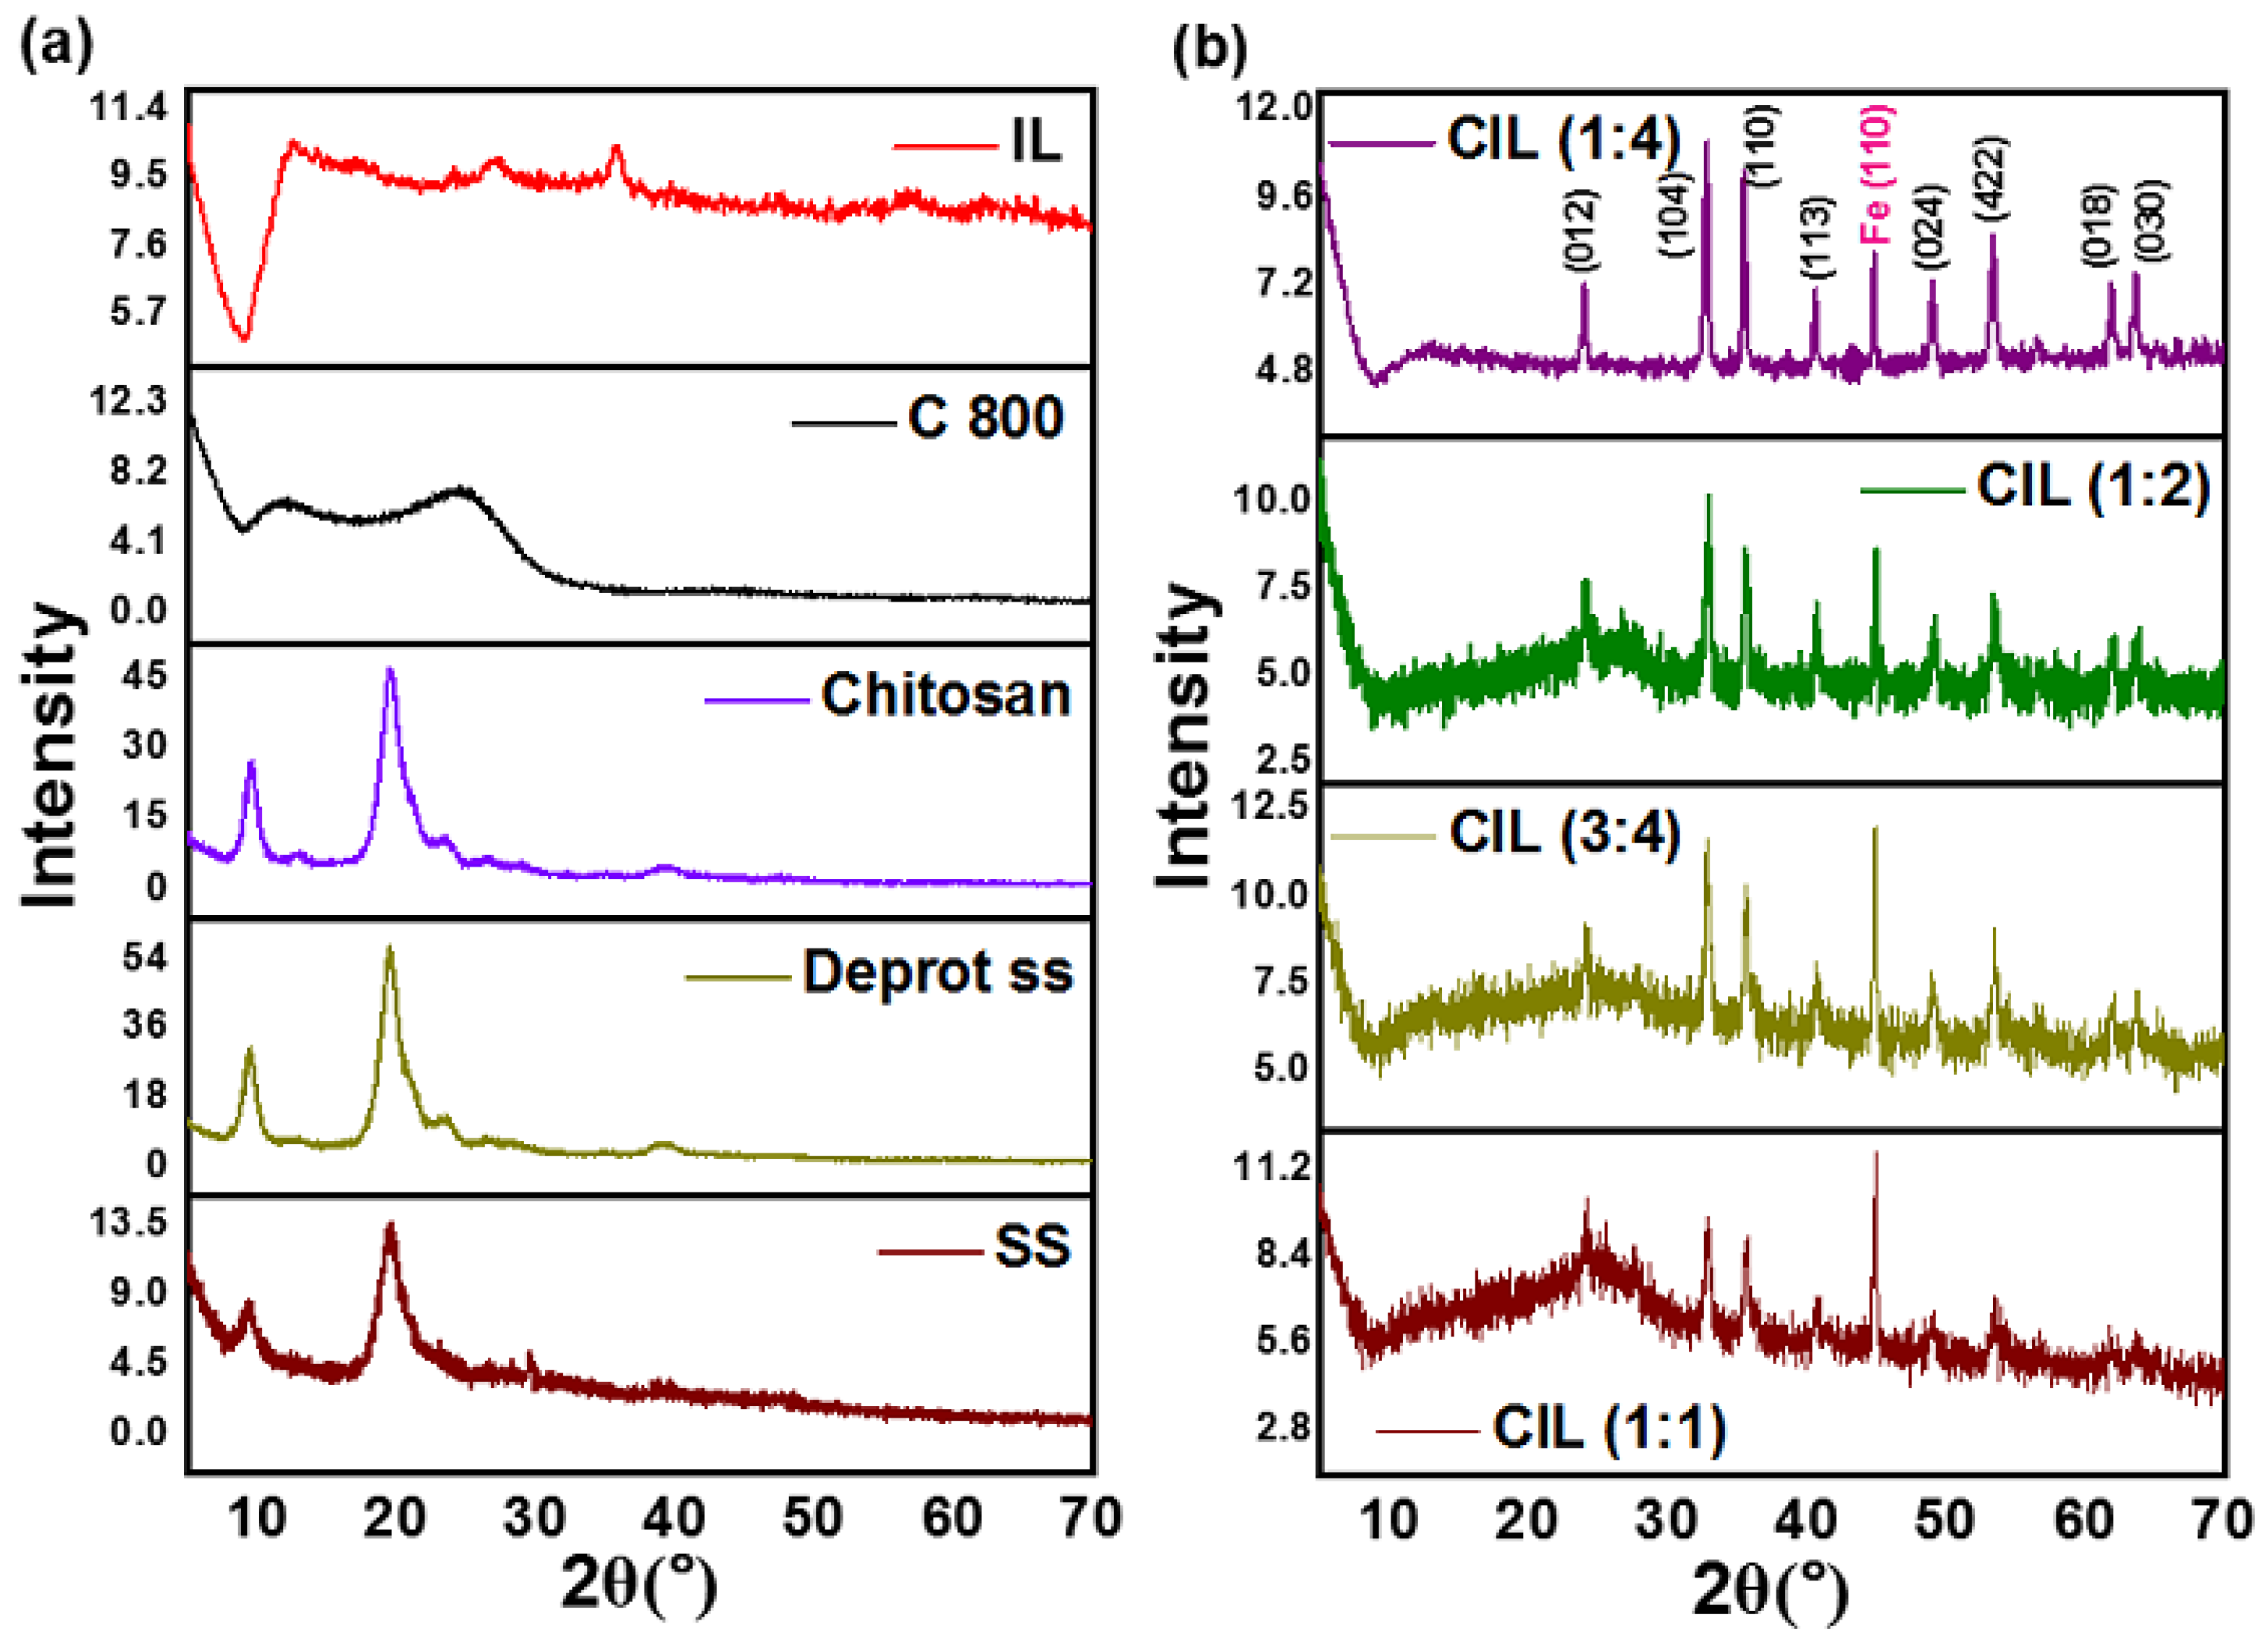
2.1. XRD Analysis
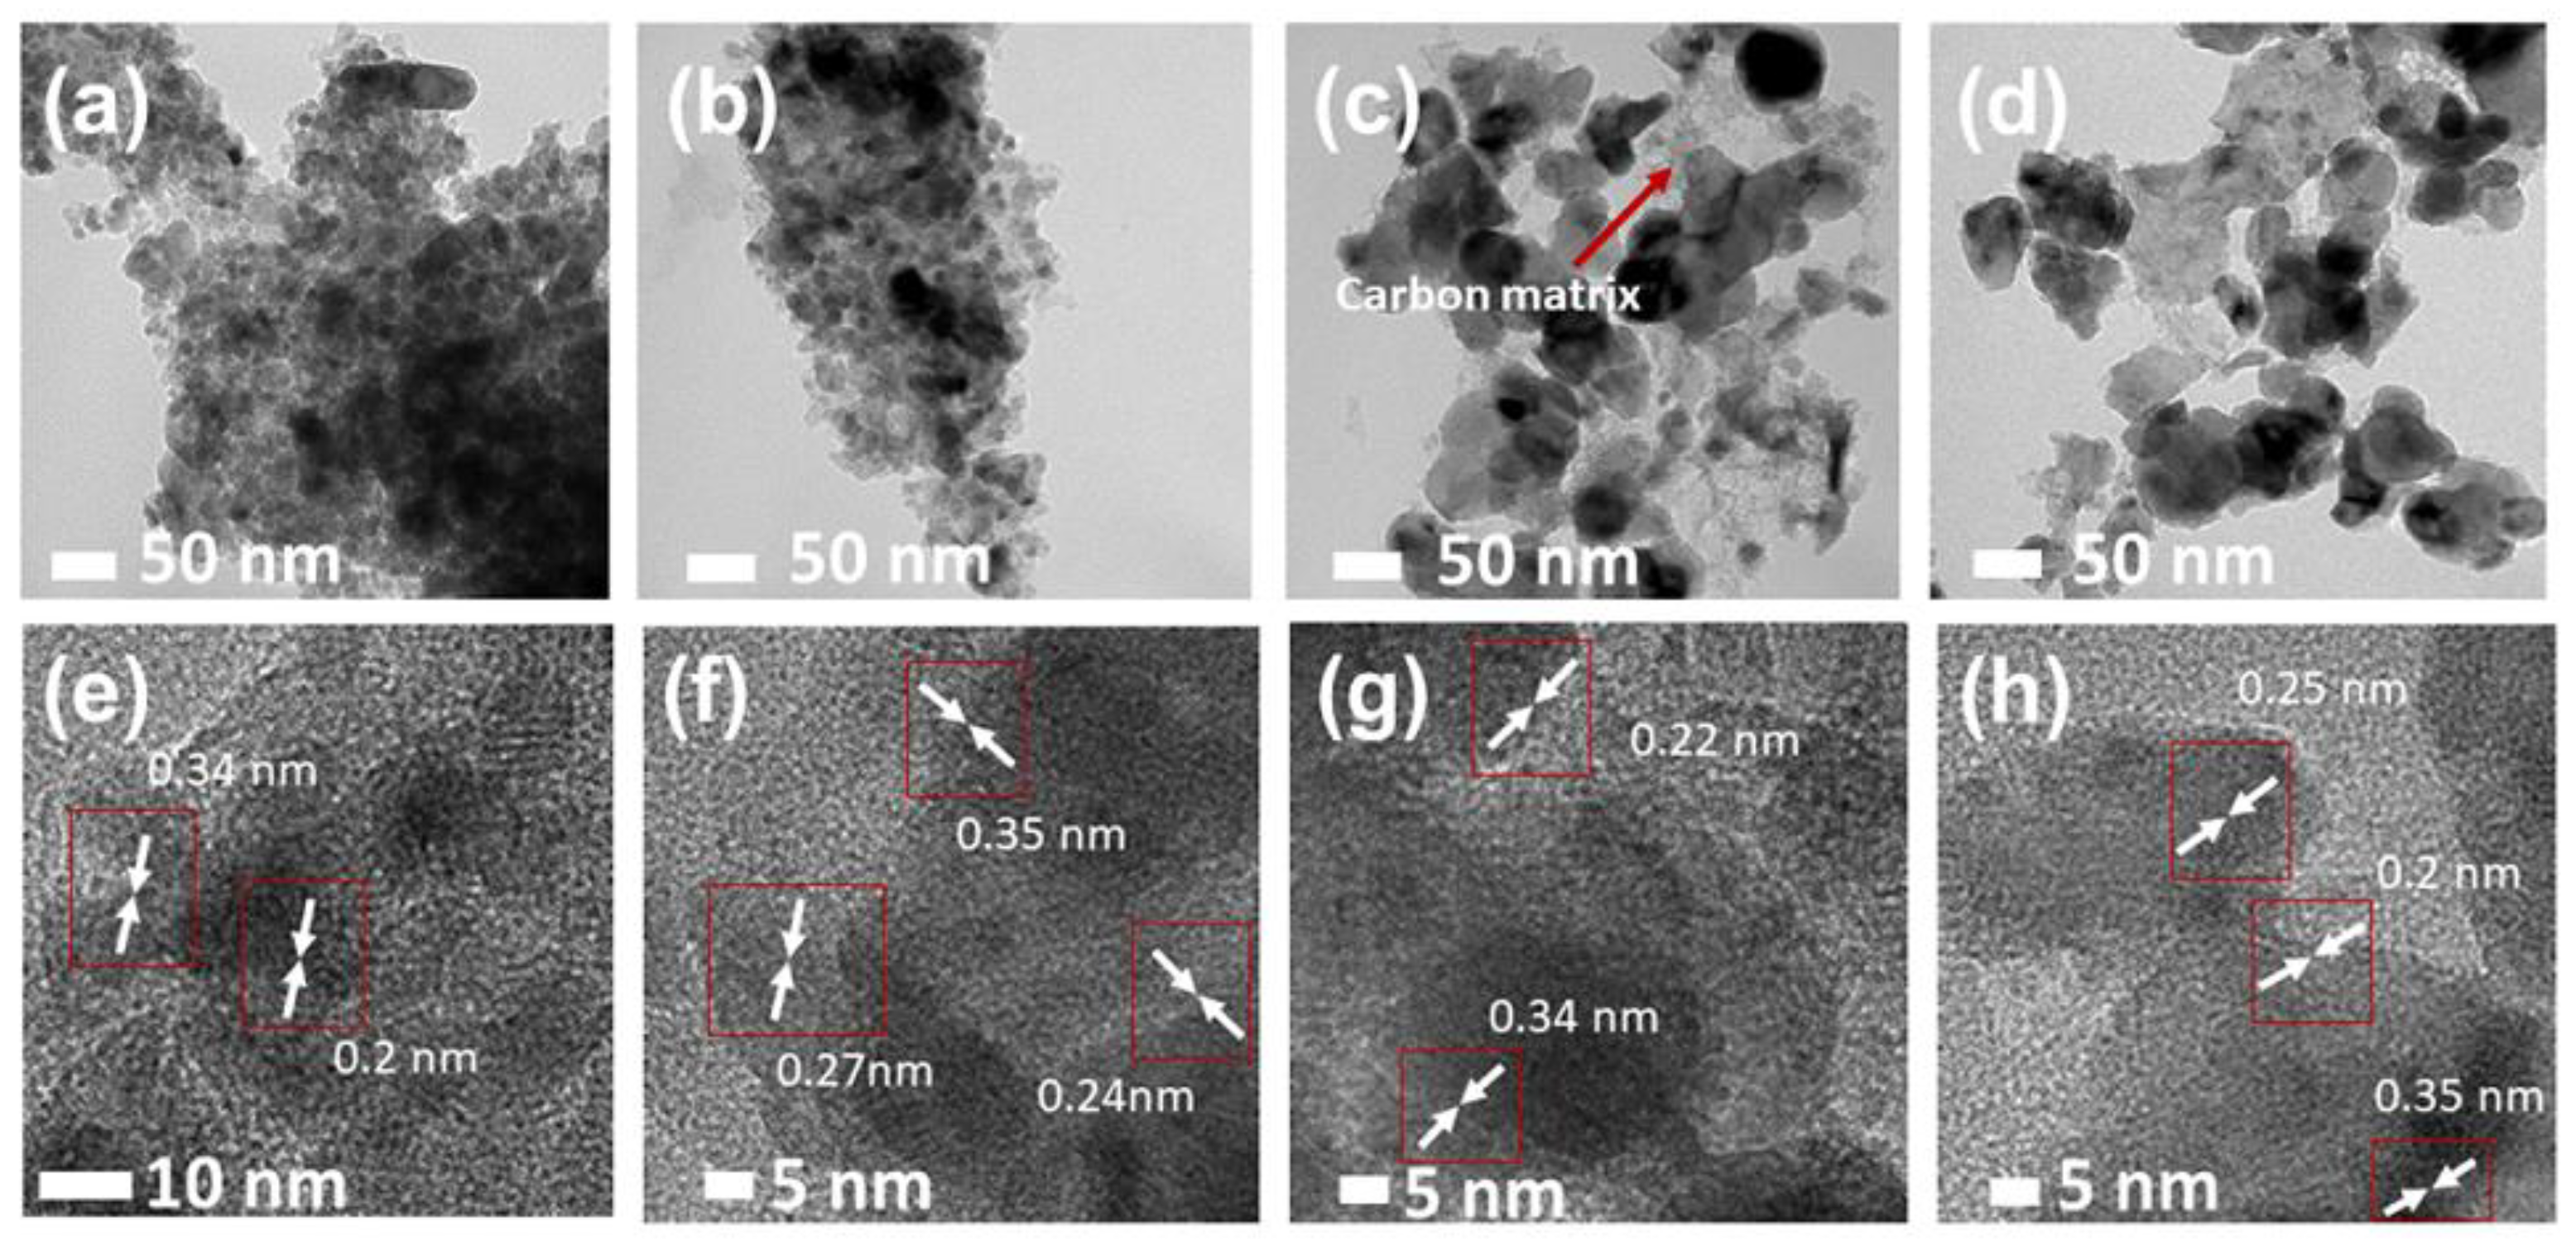
2.2. TEM Analysis
2.3. SEM Analysis
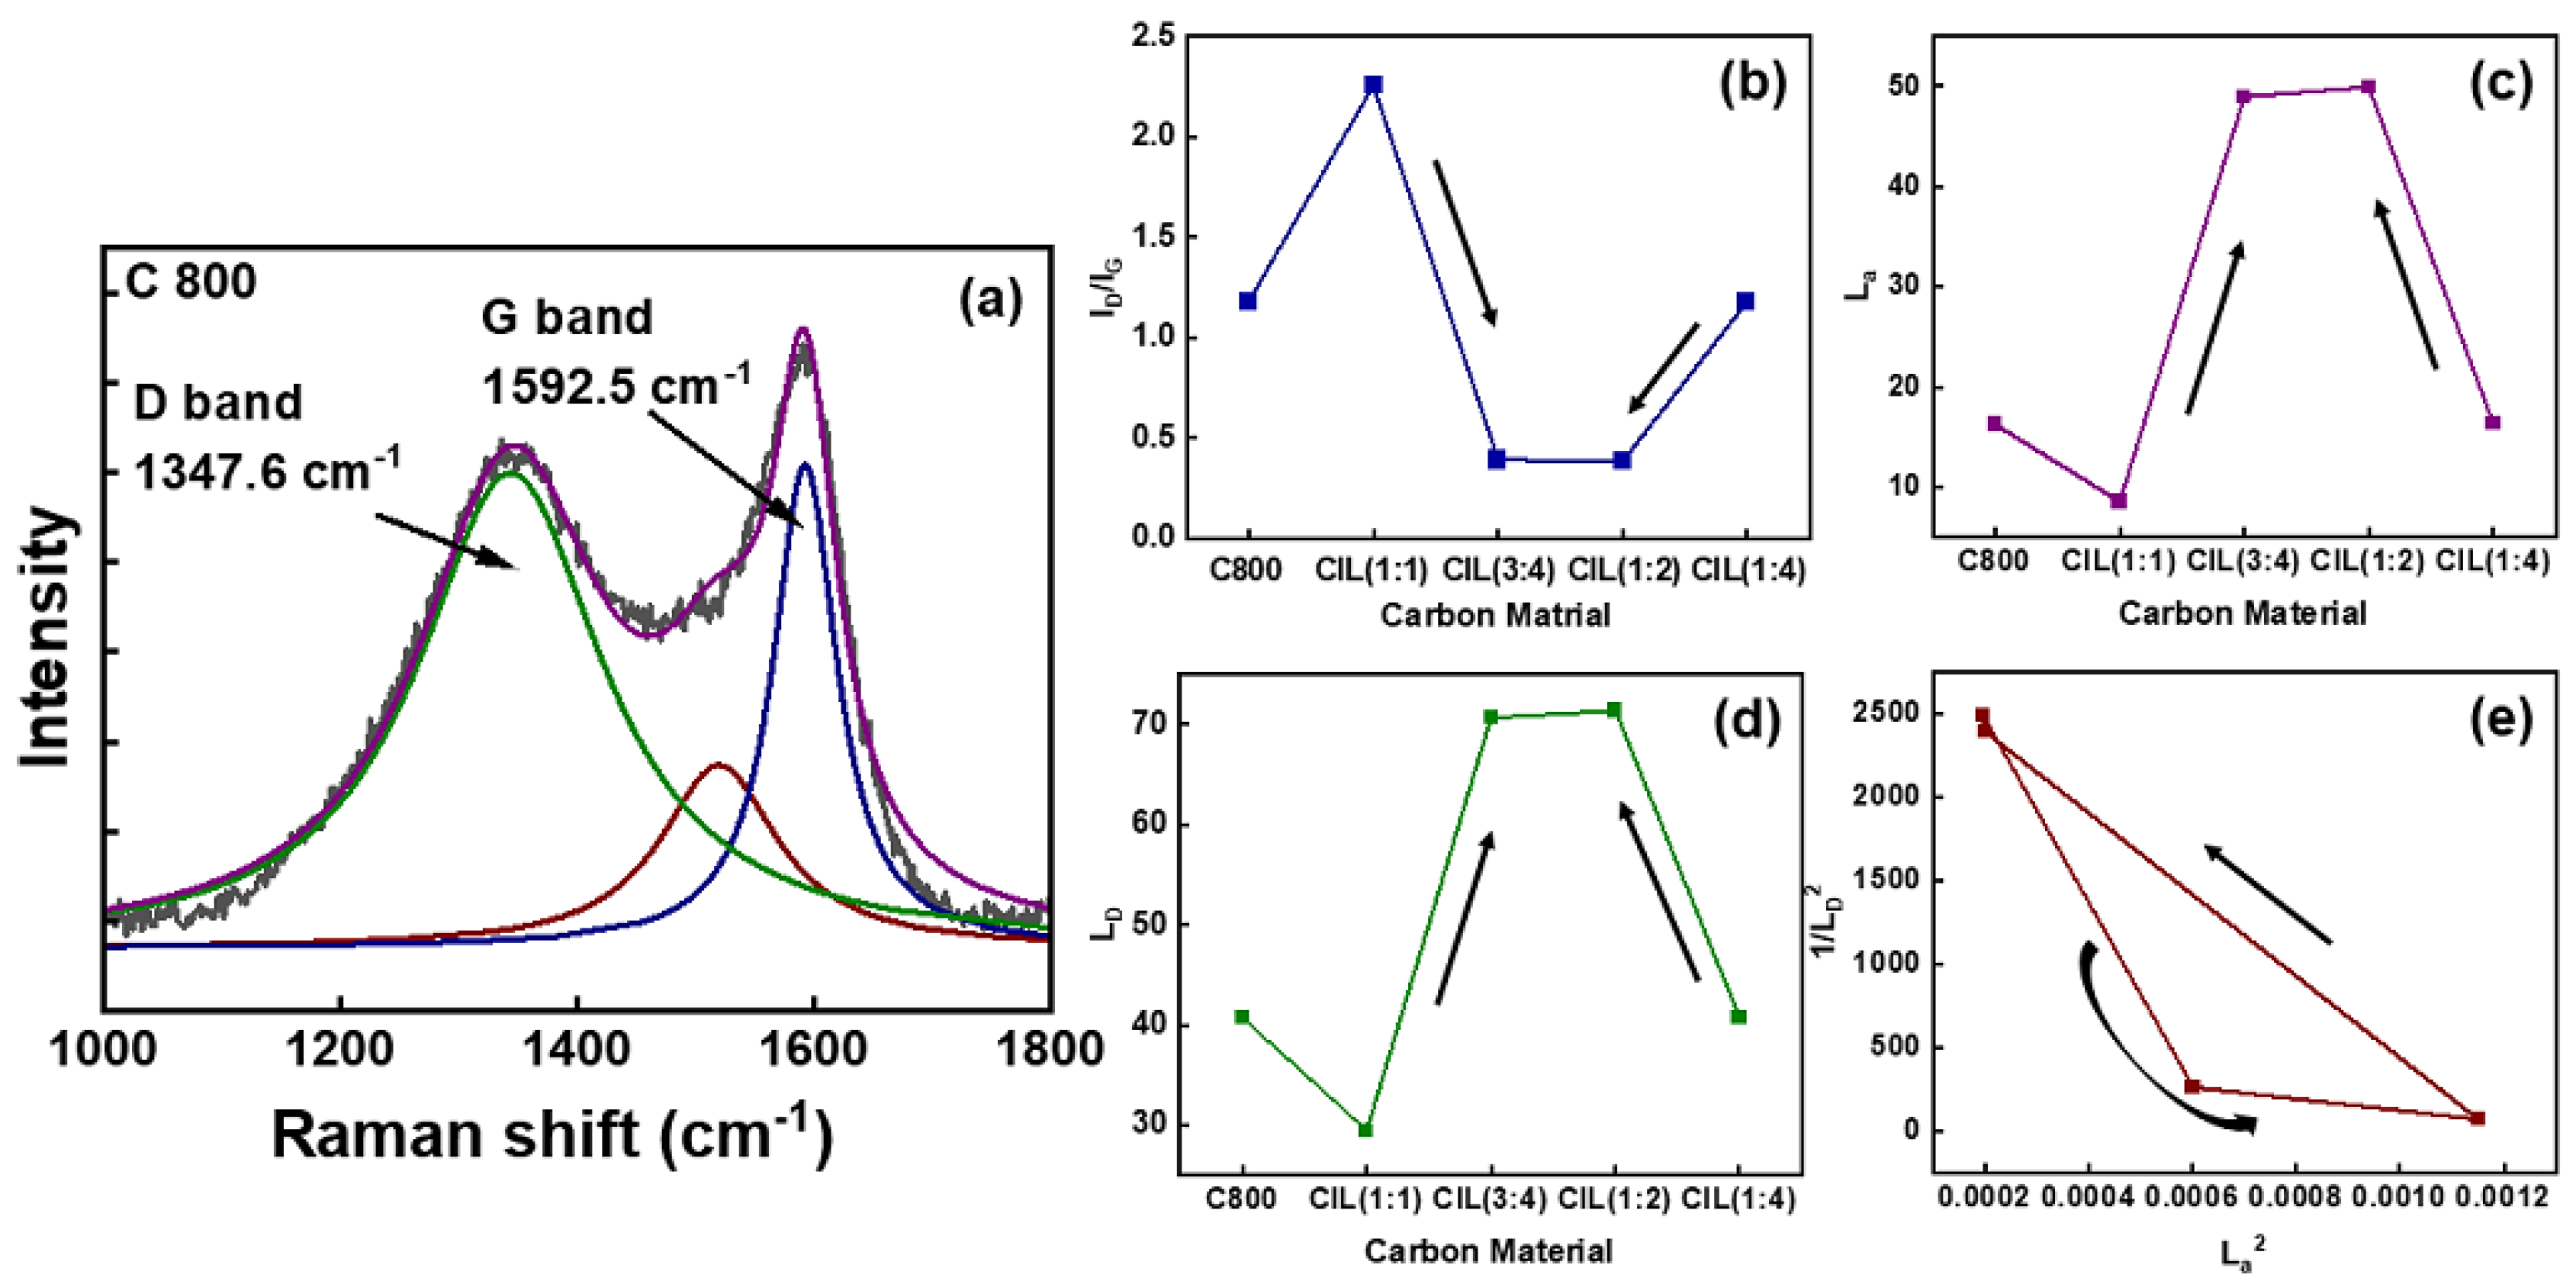
2.4. Resonant Raman Spectroscopy
2.5. BET Analysis
2.6. XPS Analysis
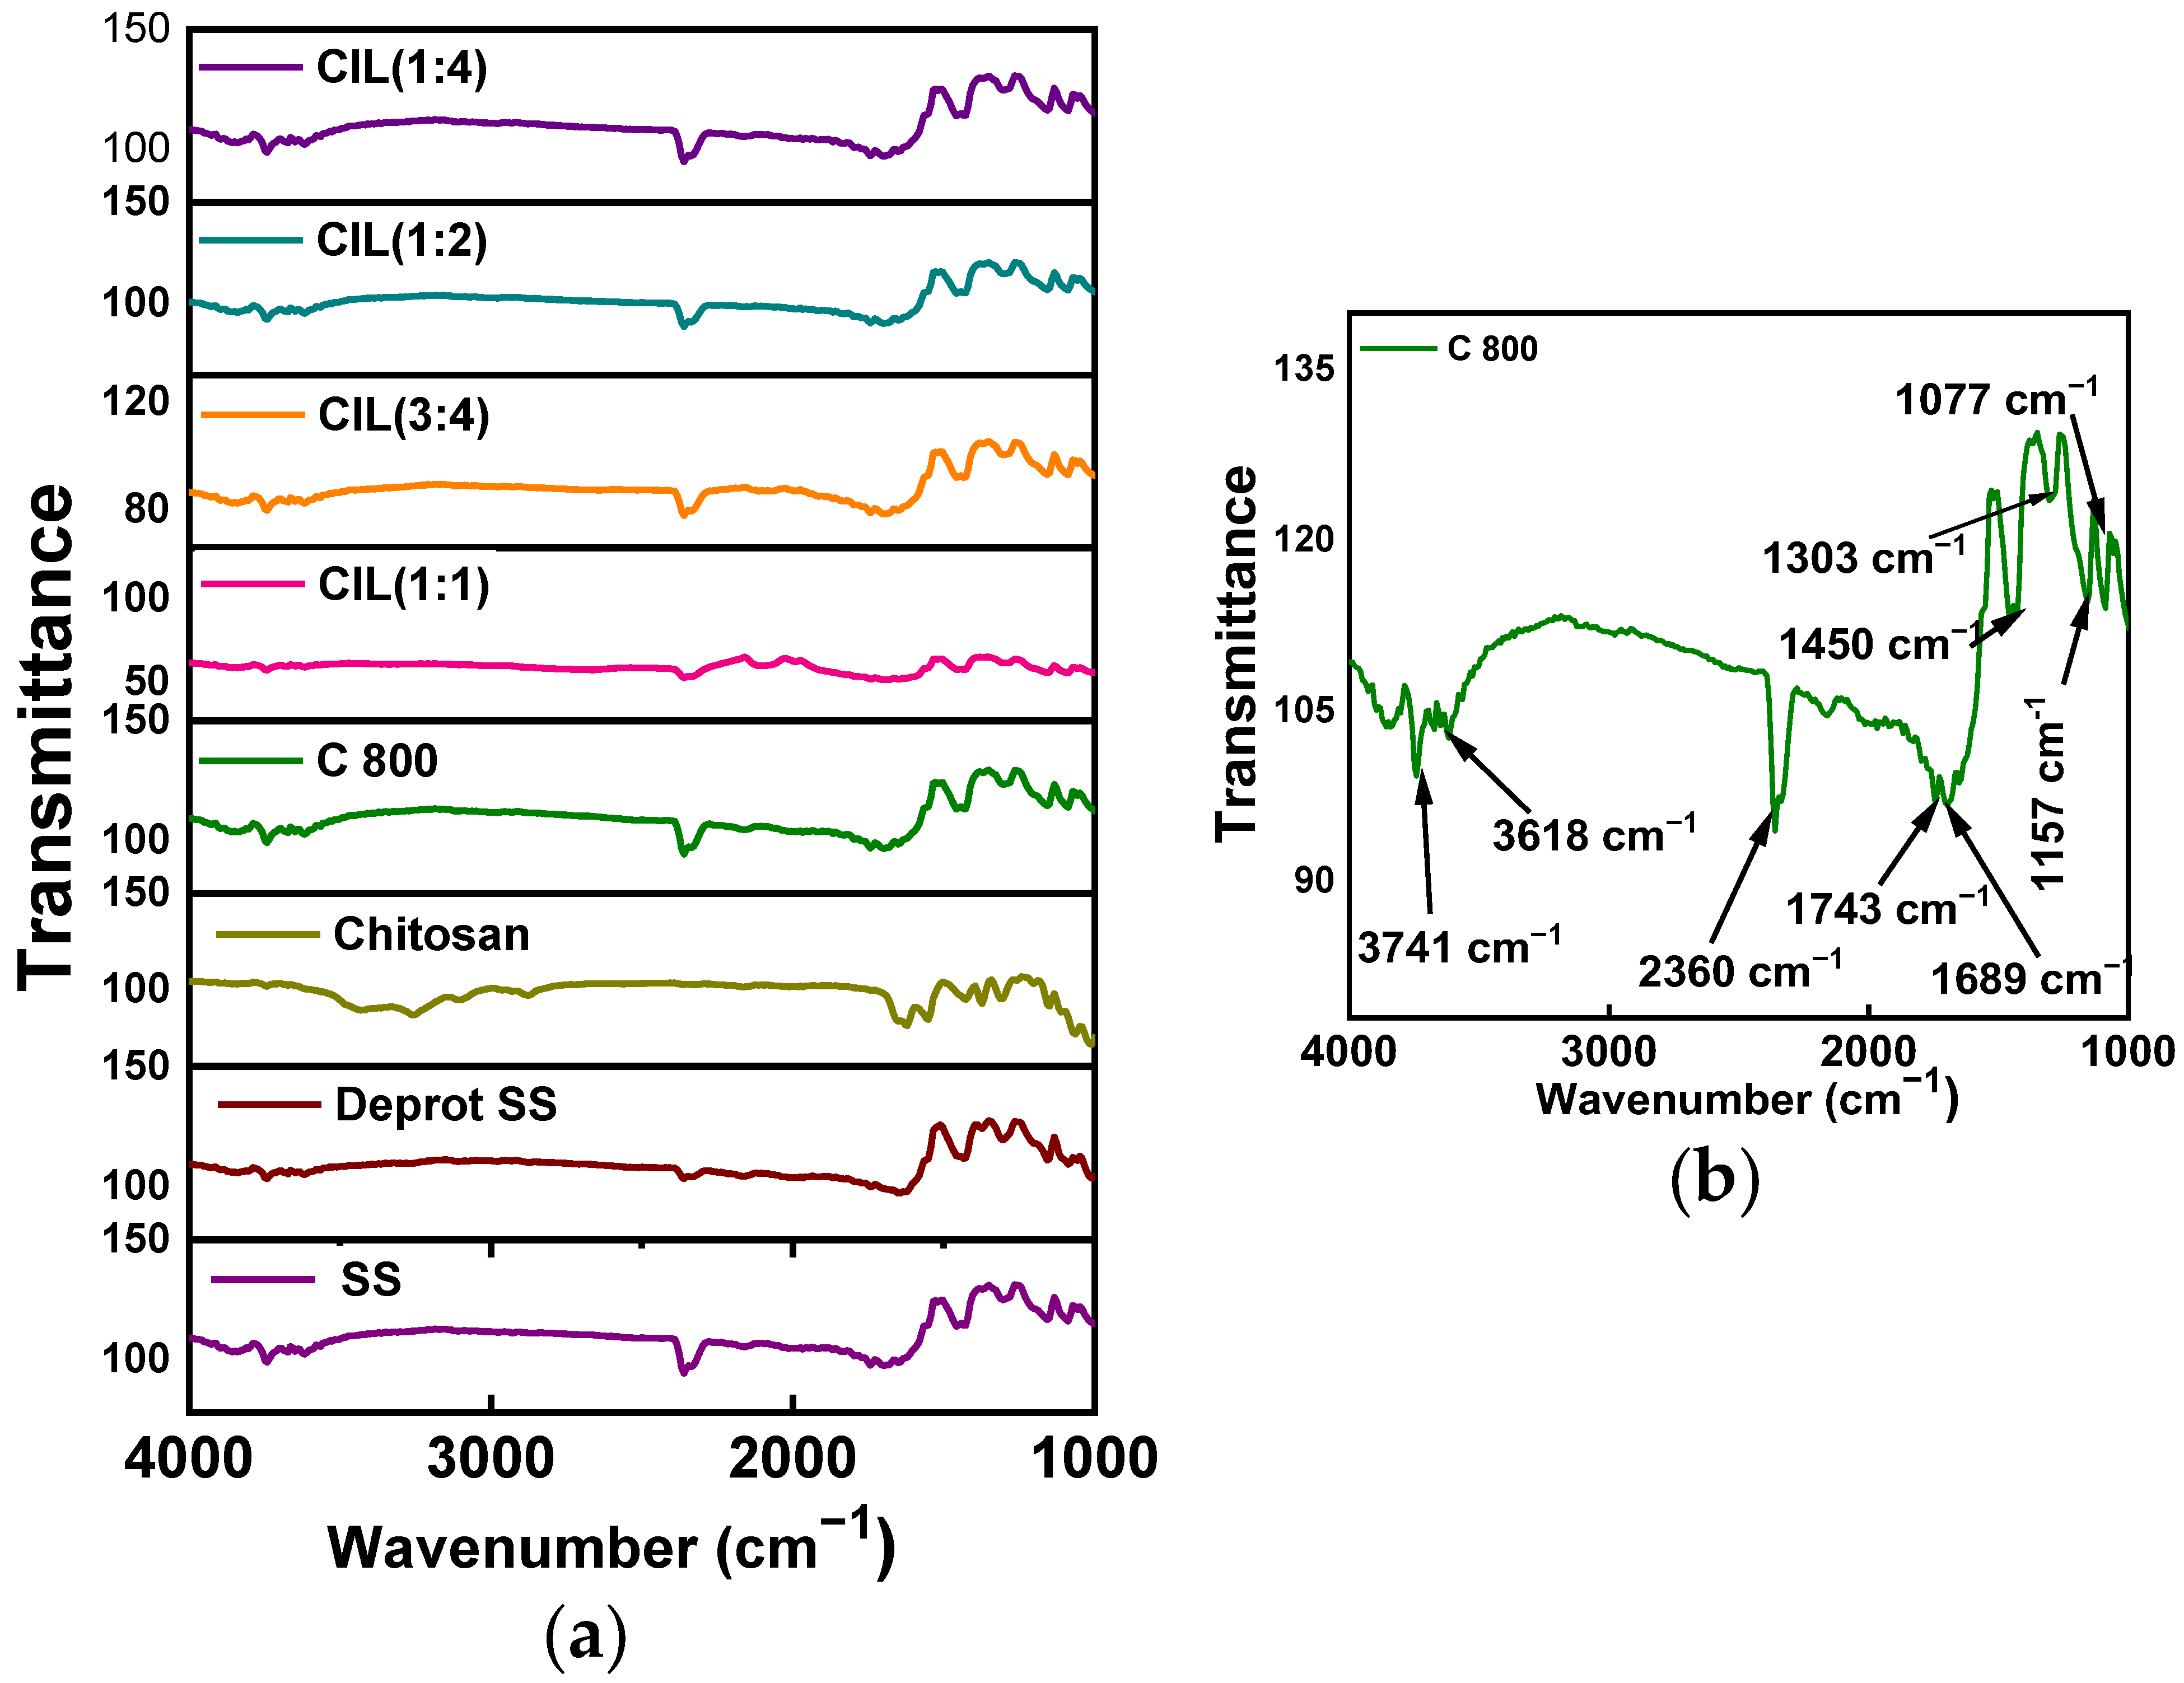
2.7. FT-IR Analysis
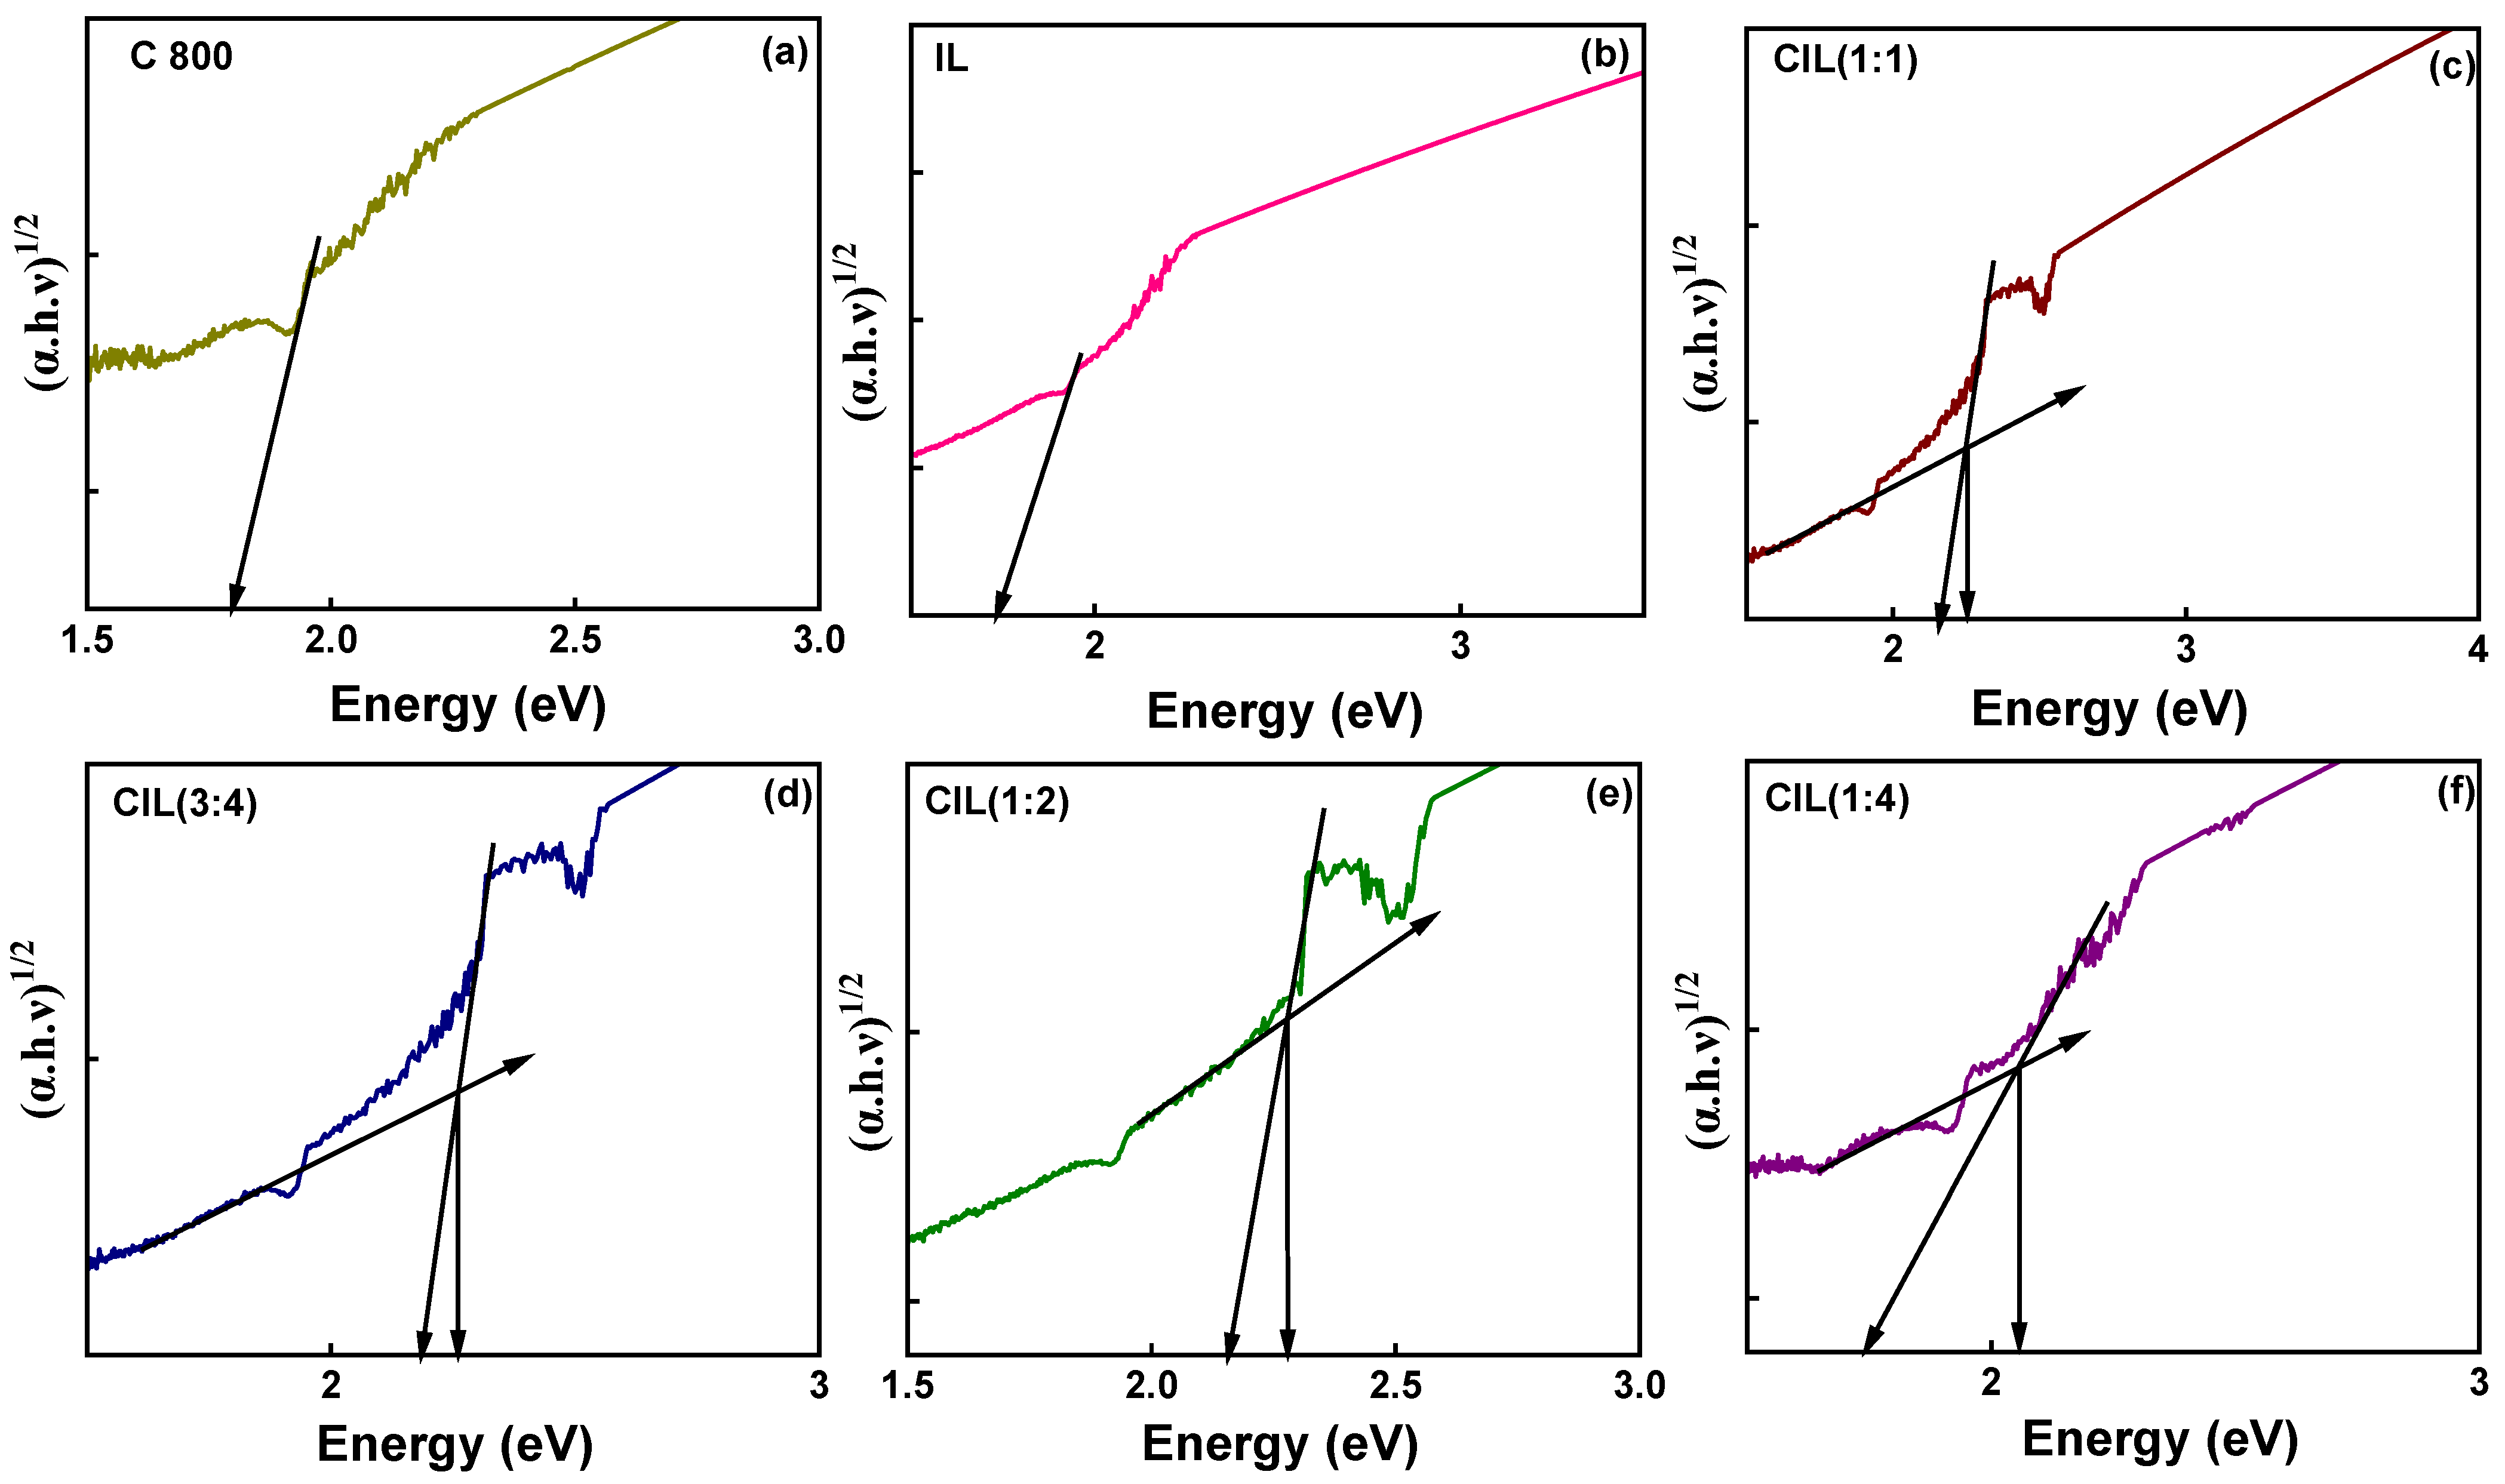
2.8. DRS Analysis
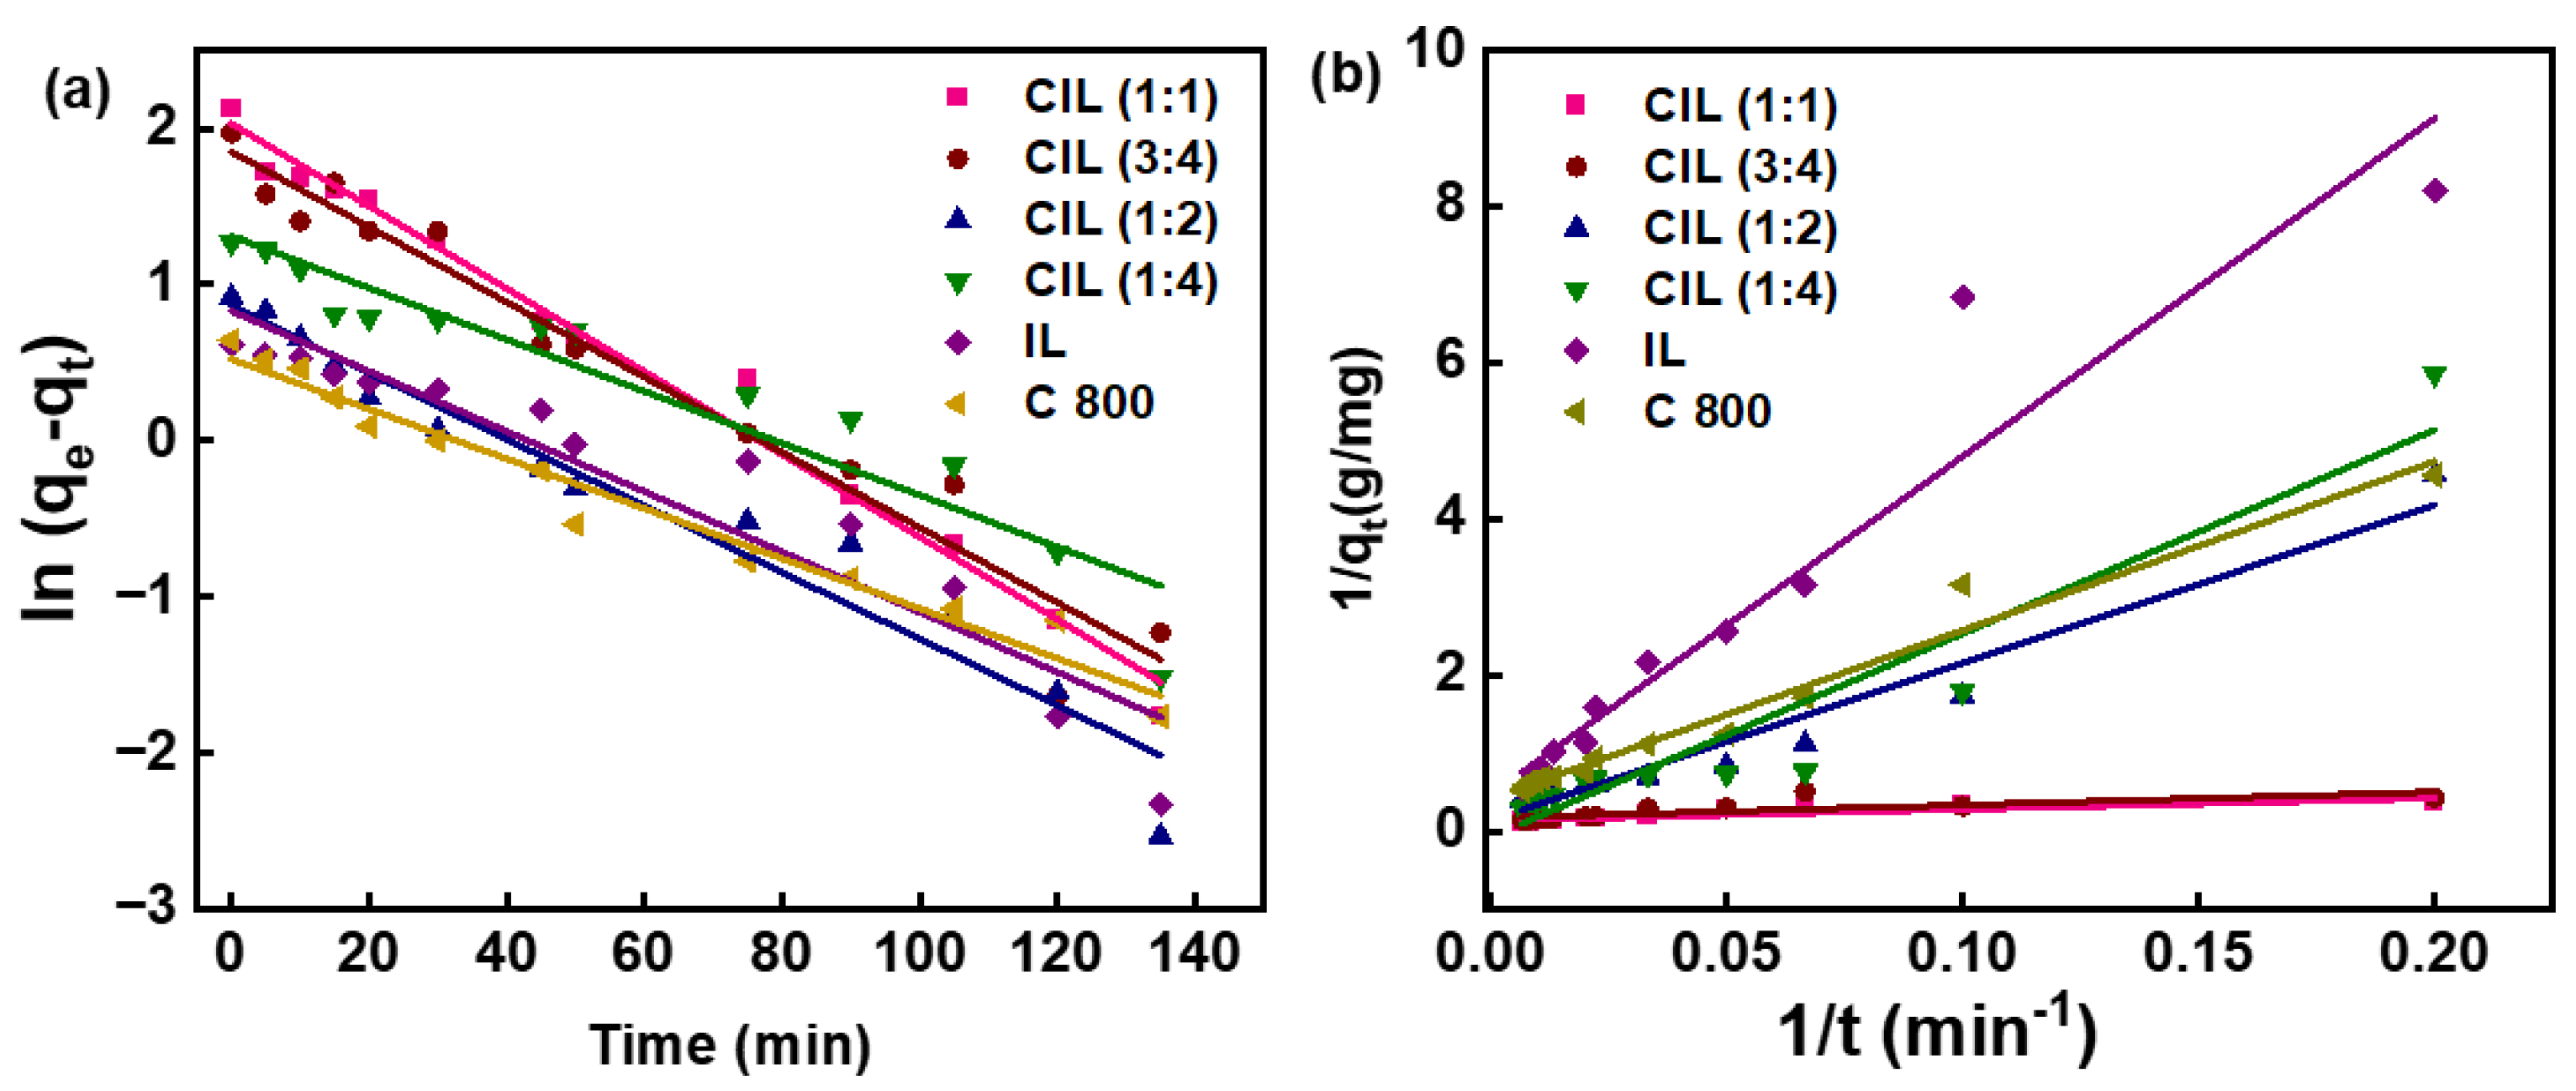
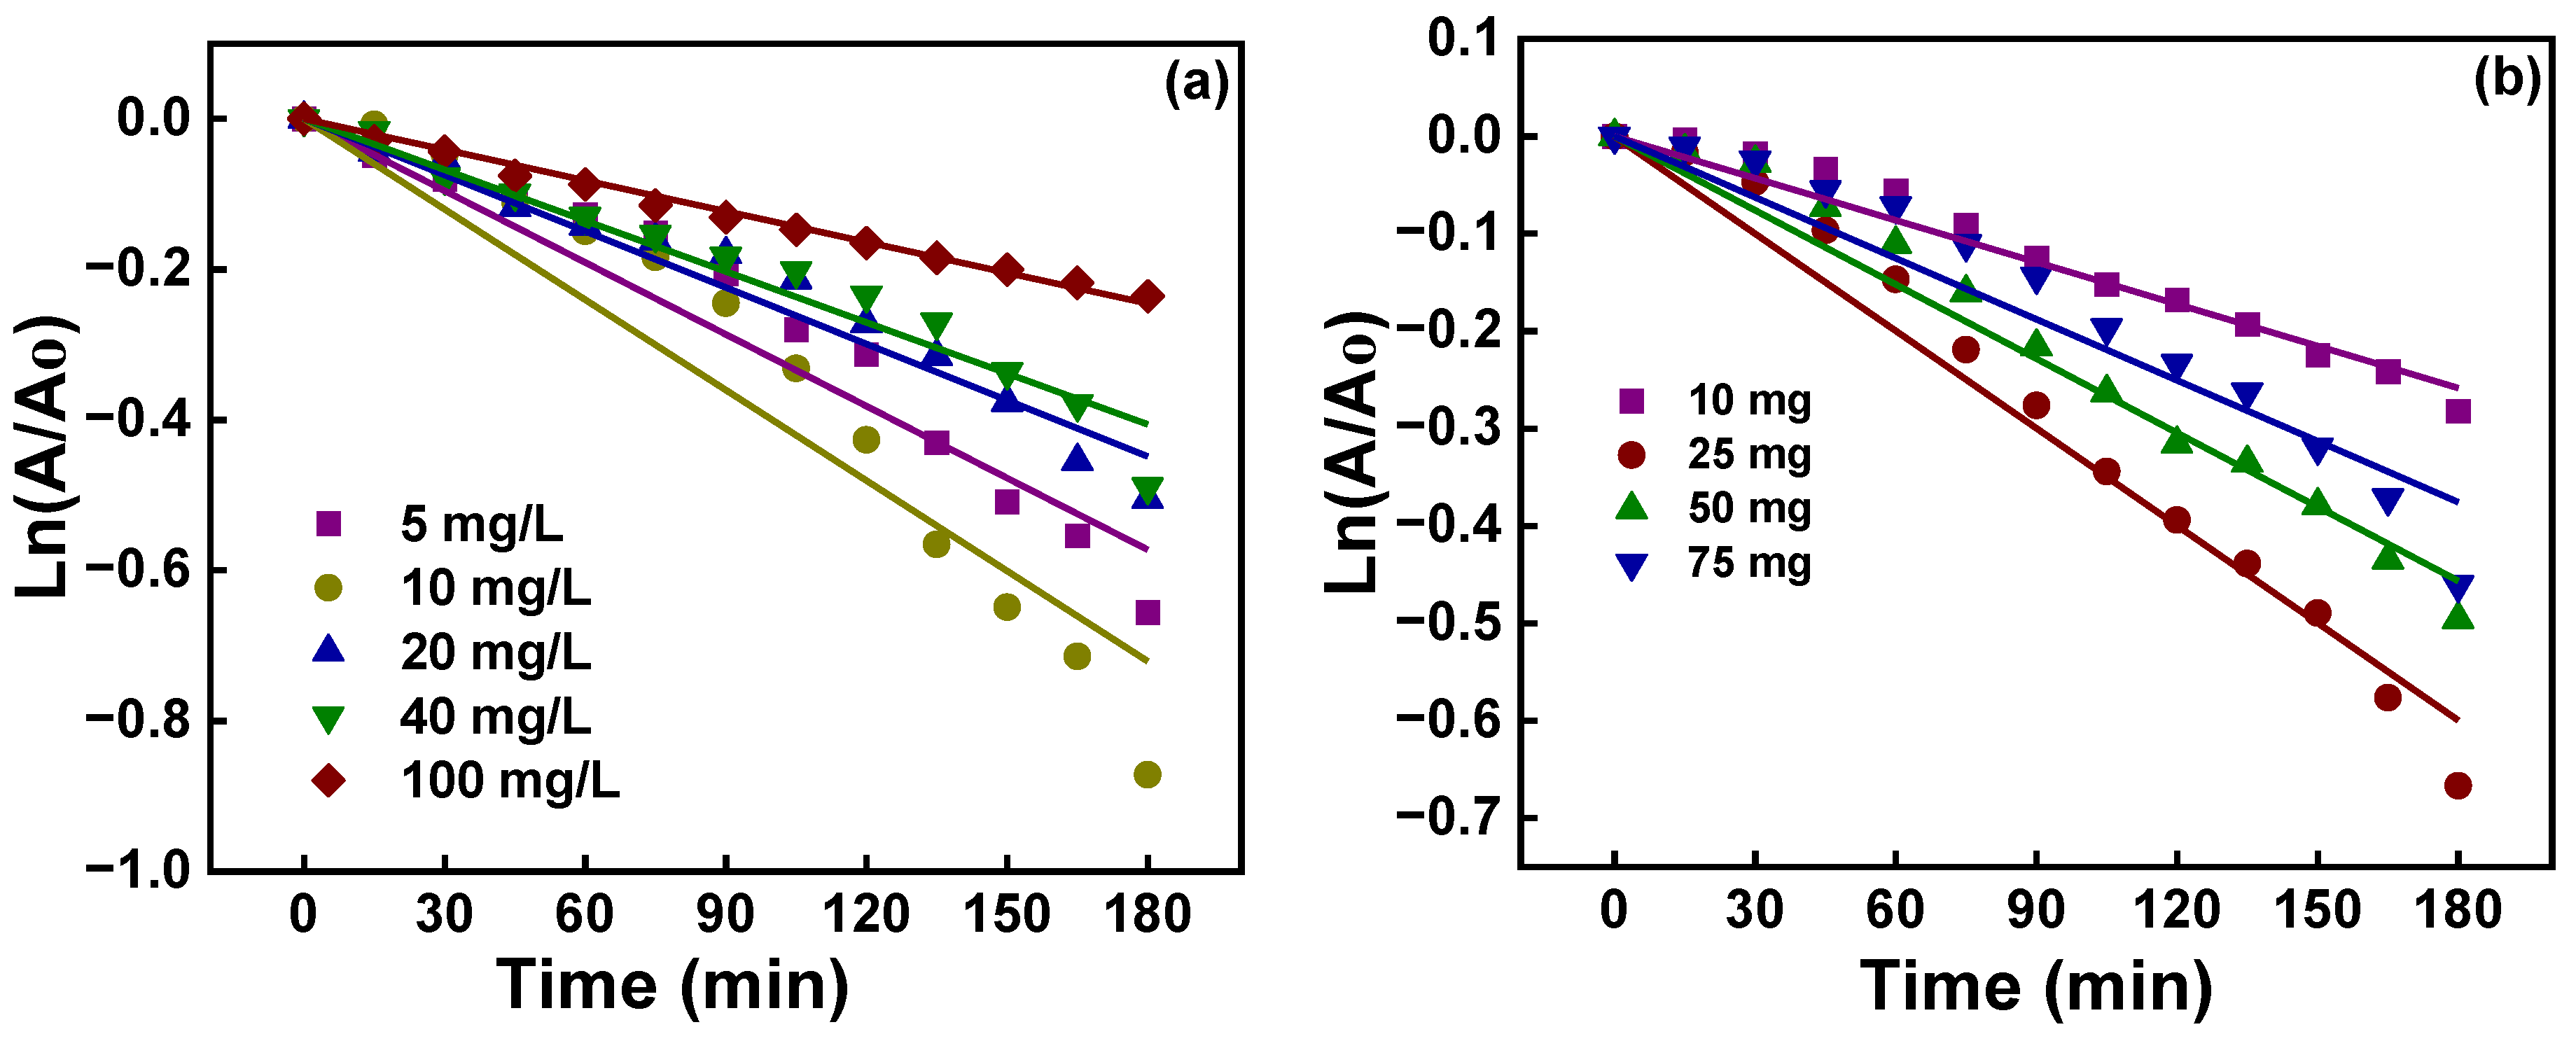
2.9. Photocatalytic Activity
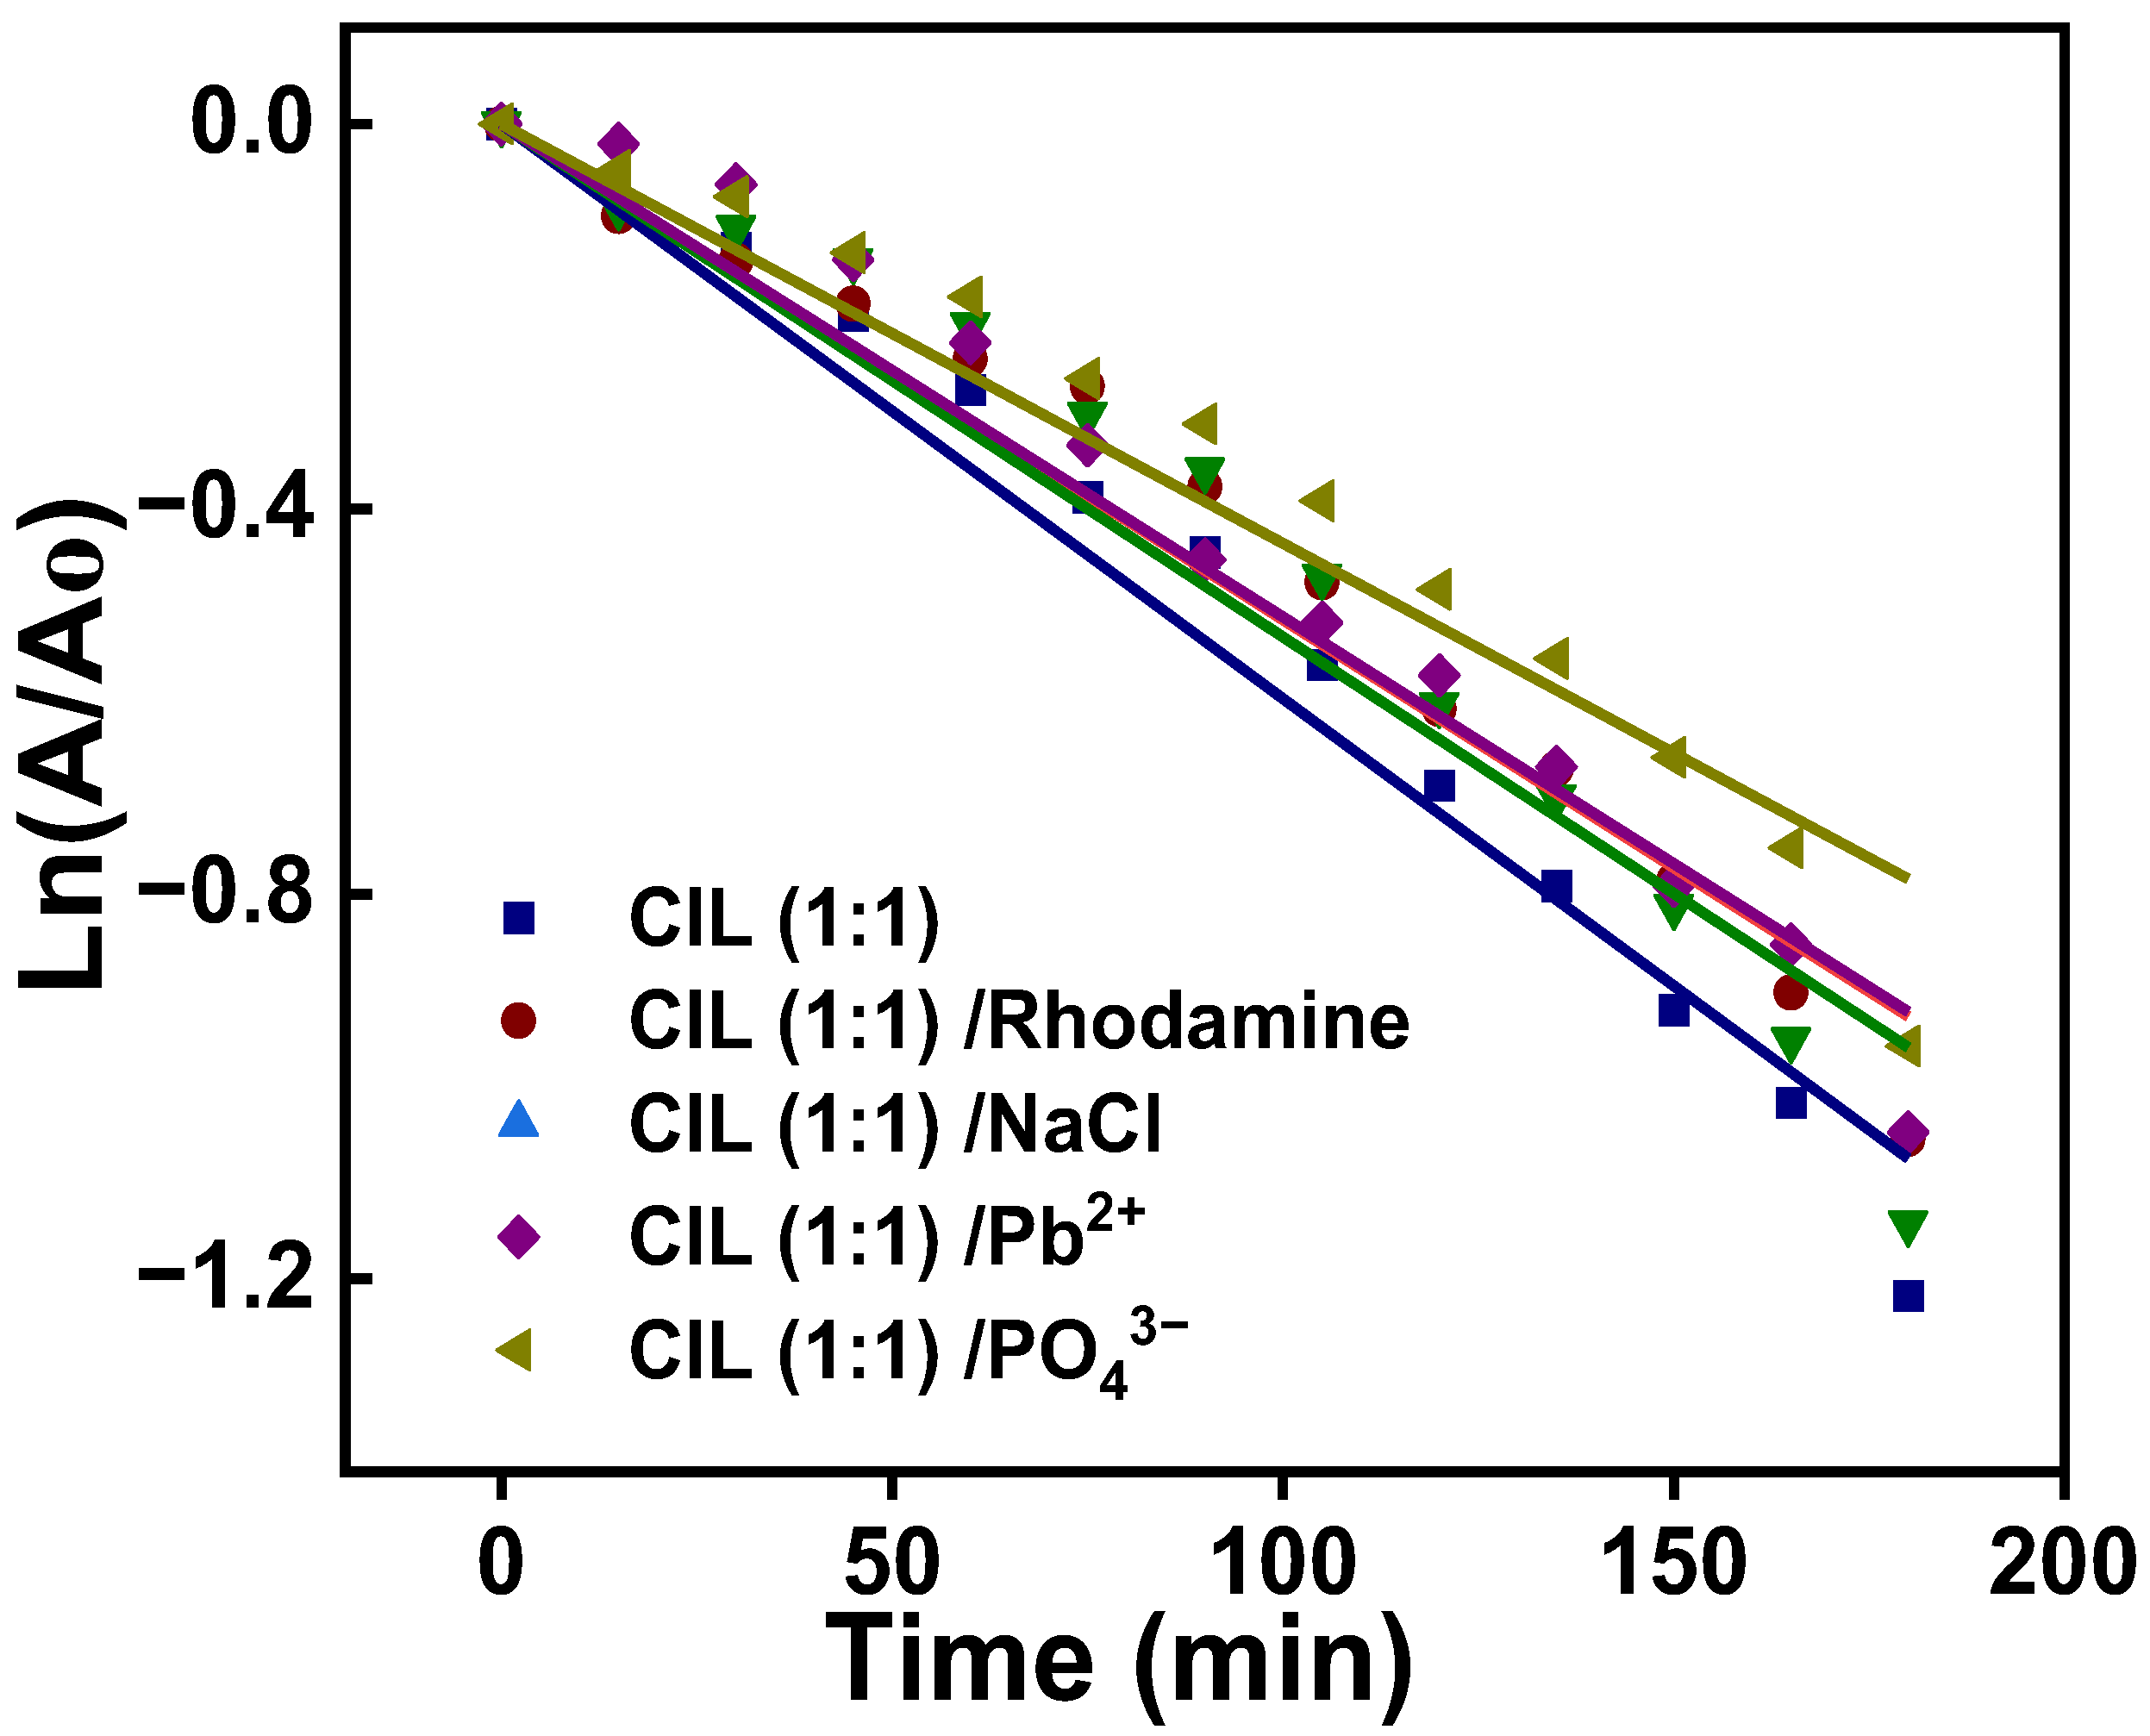
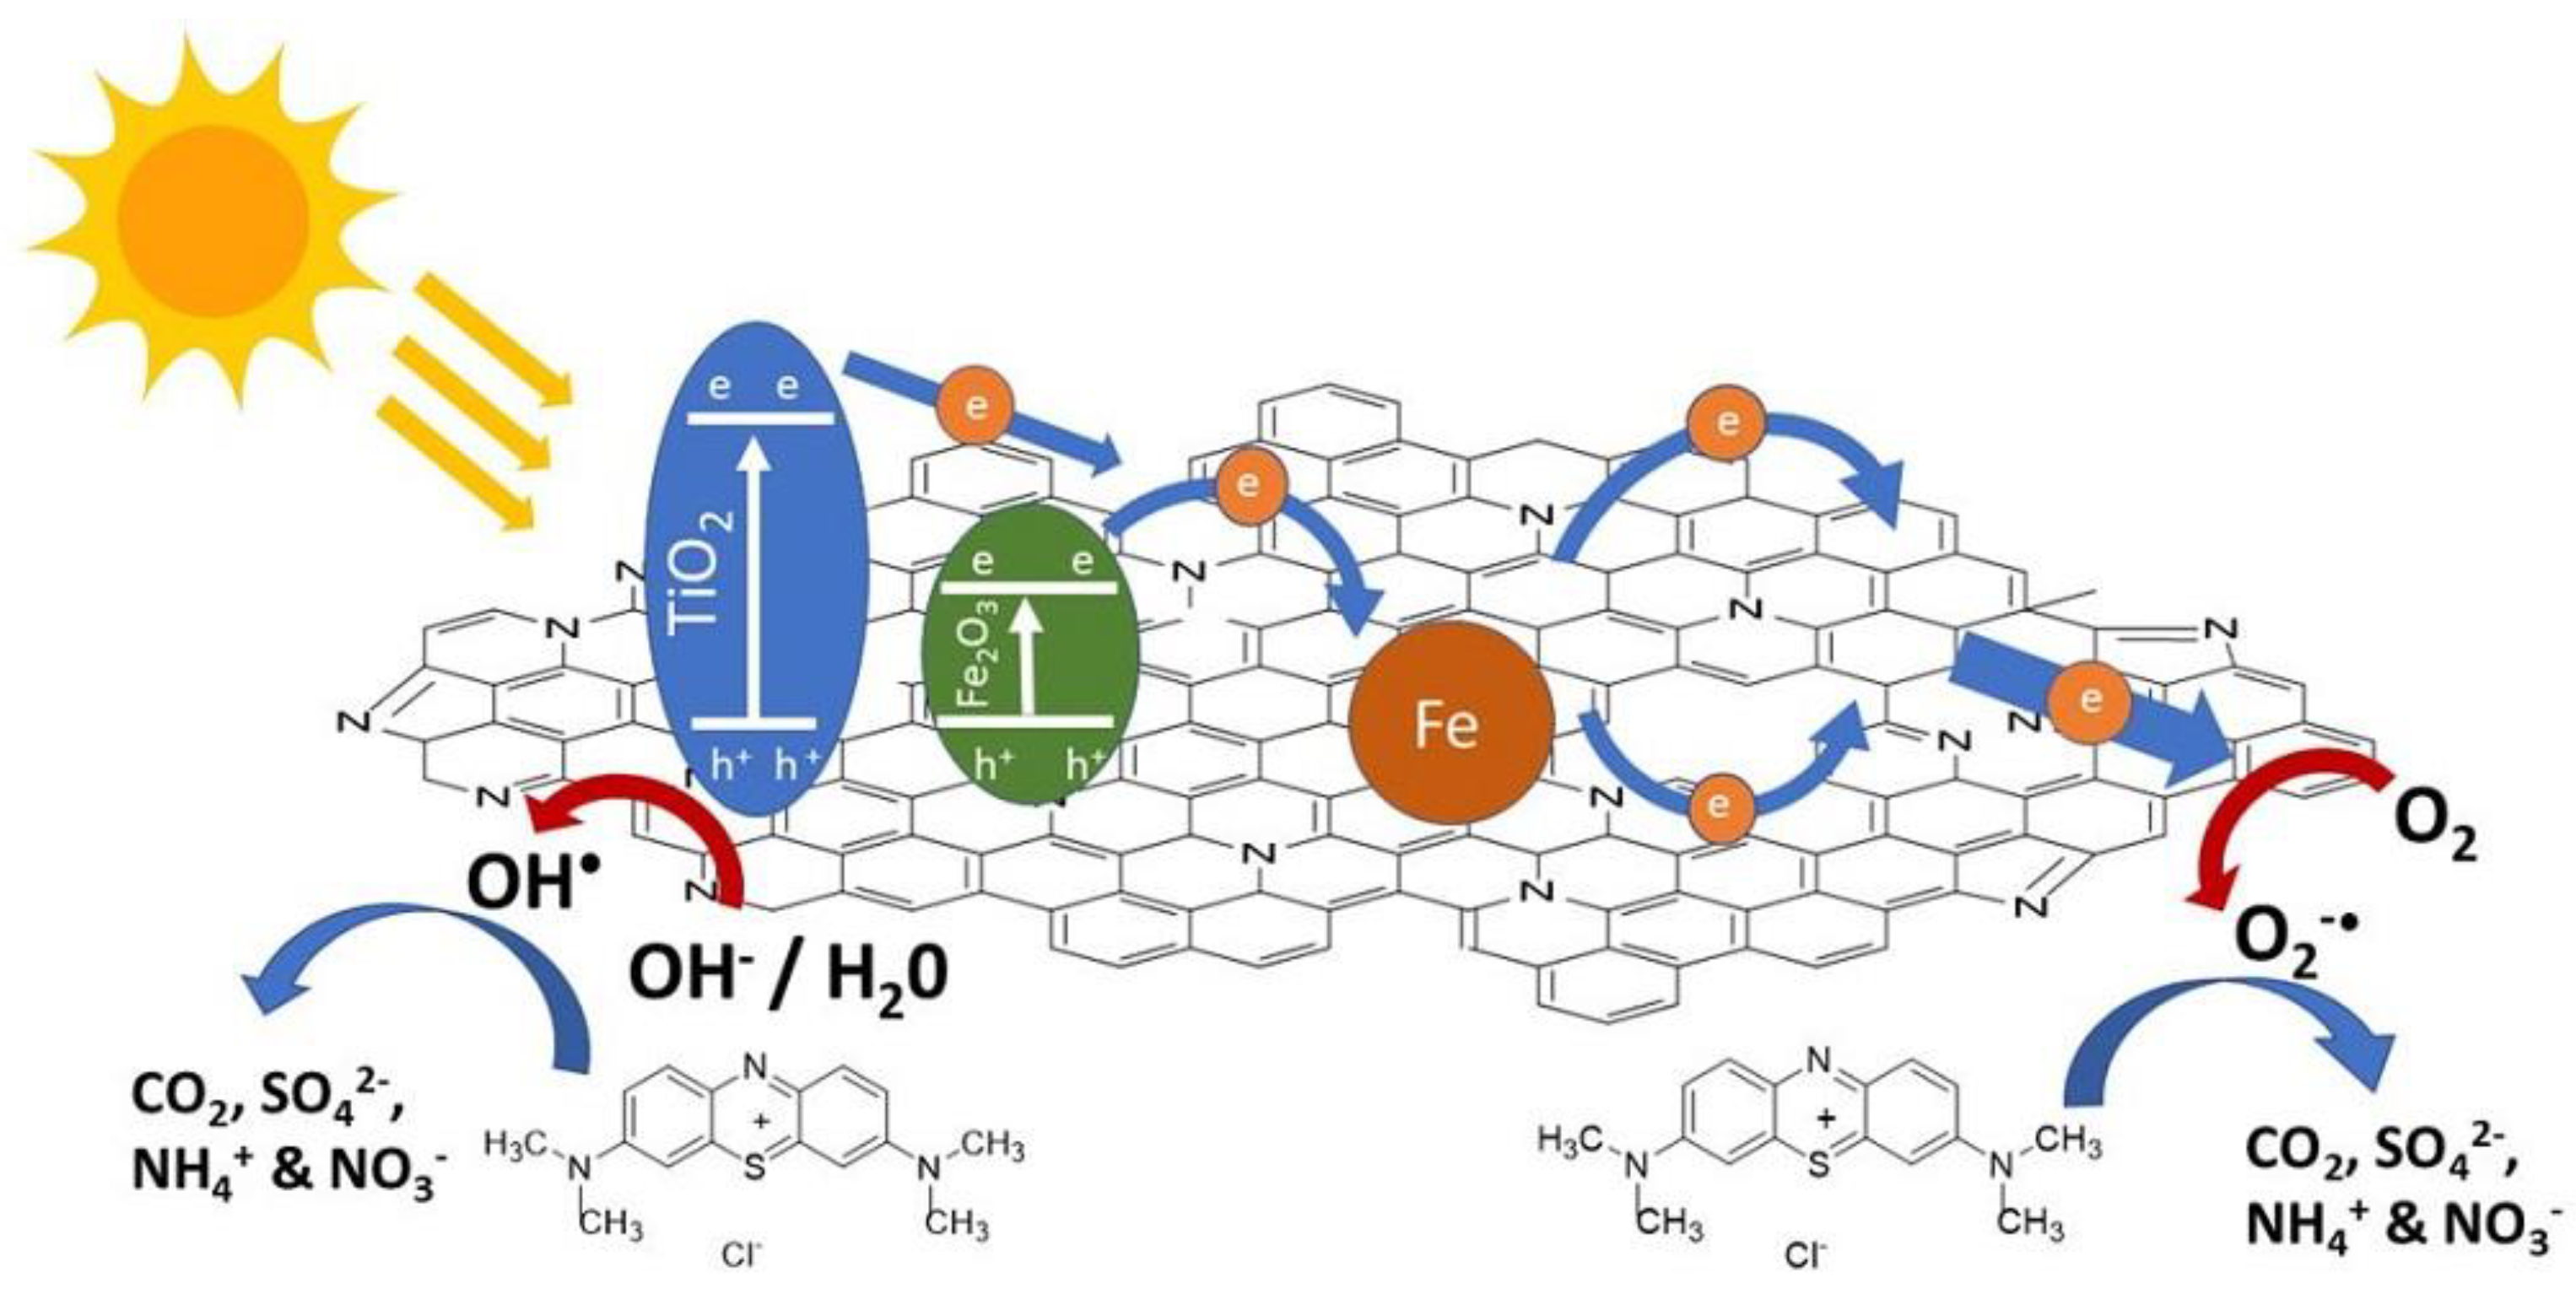
2.10. Photocatalytic Mechanism
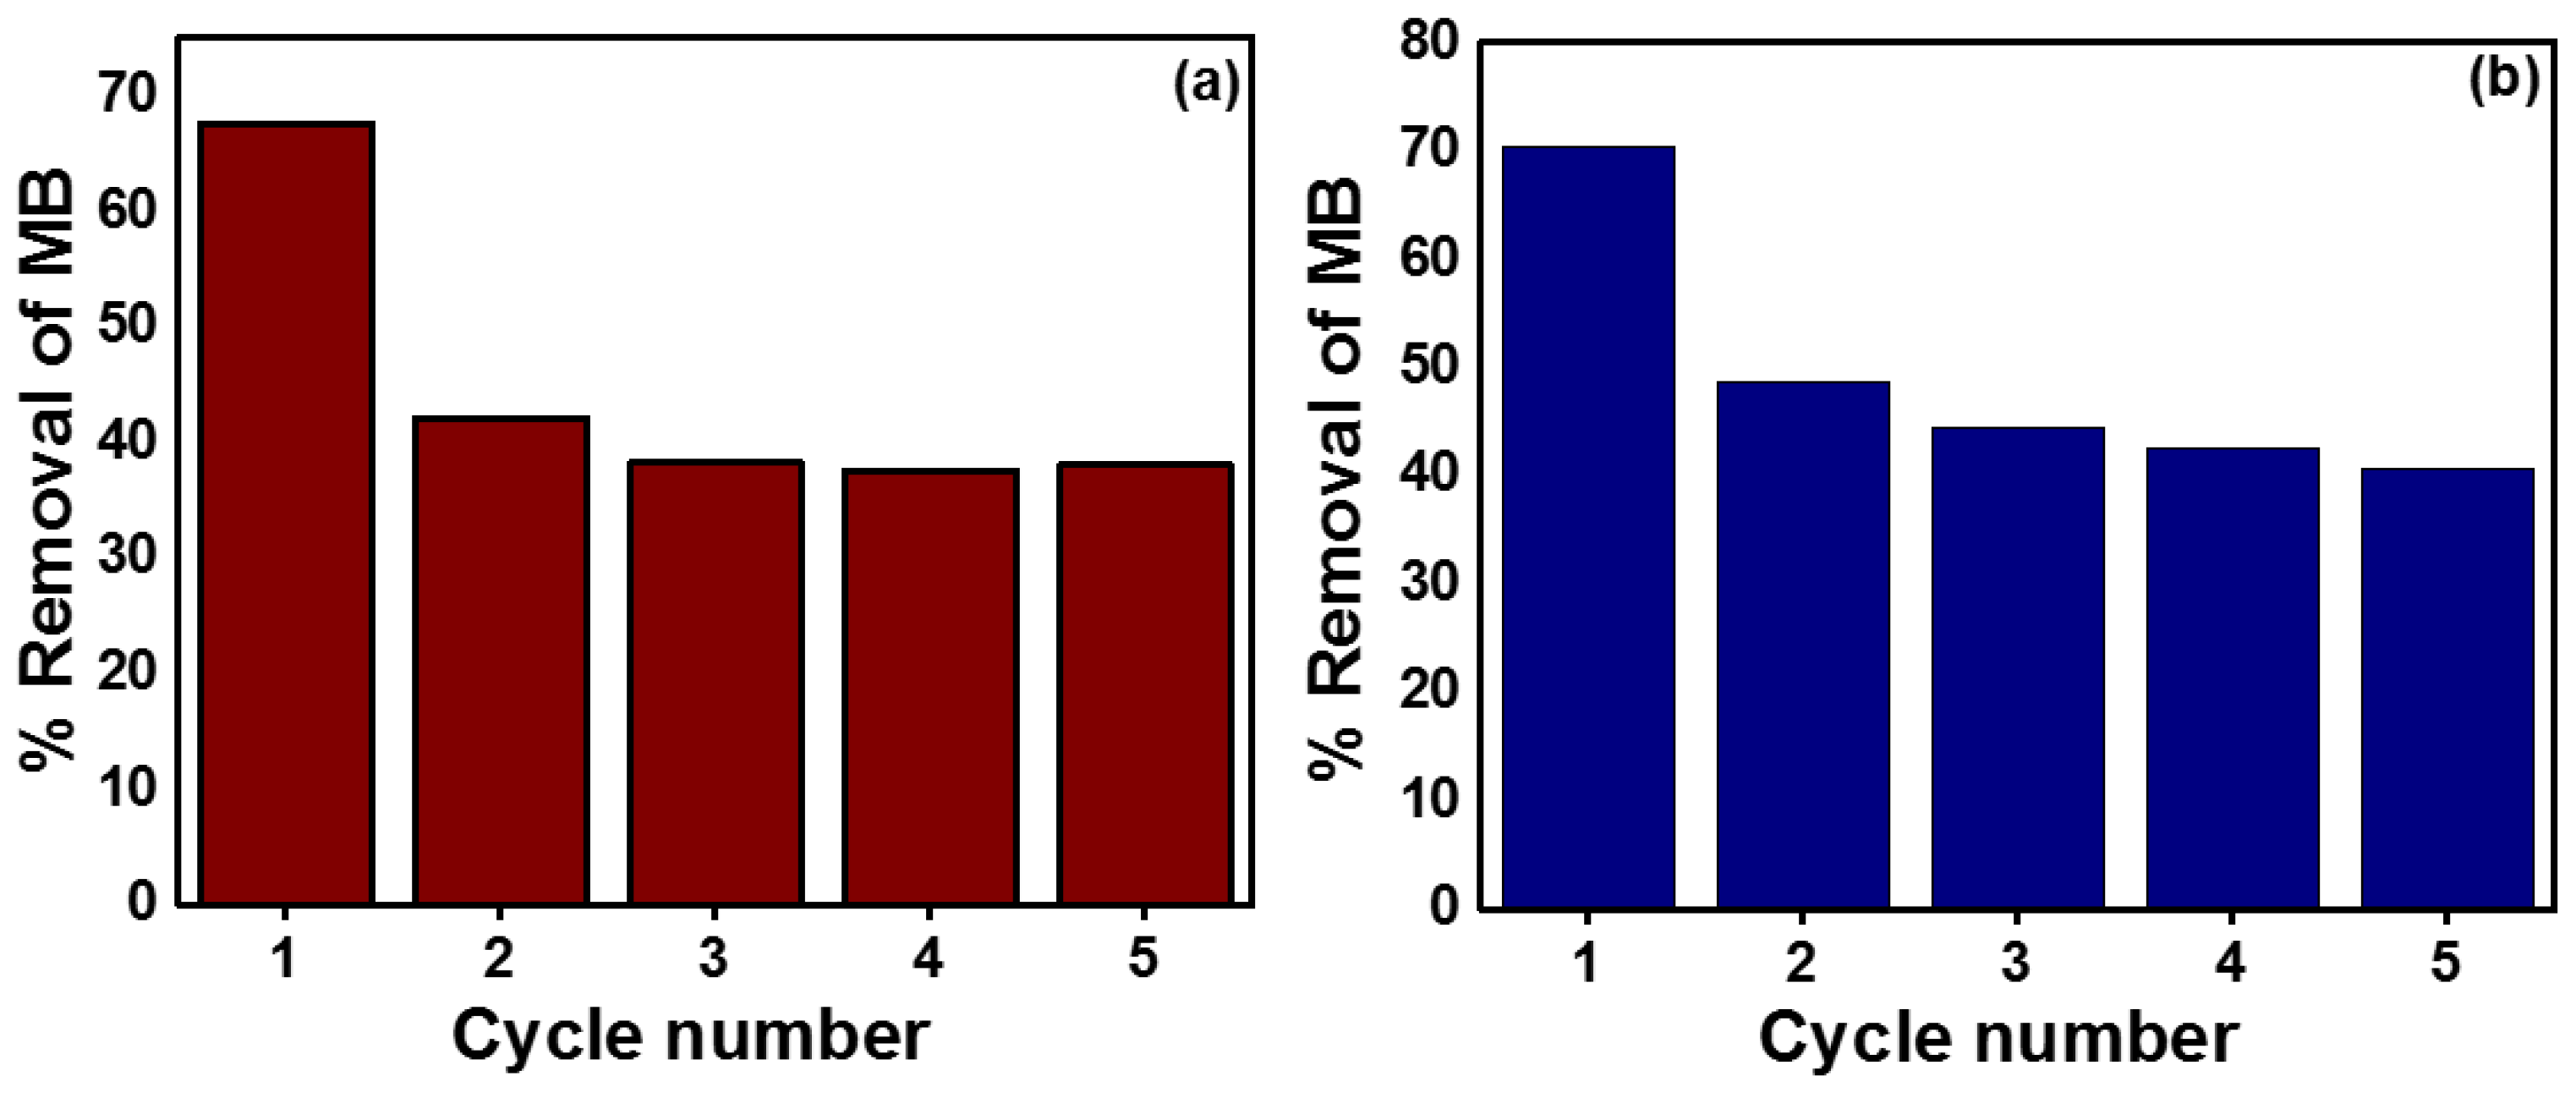
2.11. Reusability
3. Materials and Methodology
3.1. Chemicals and Materials
3.2. Dissolution of Ilmenite Sand and Precipitation
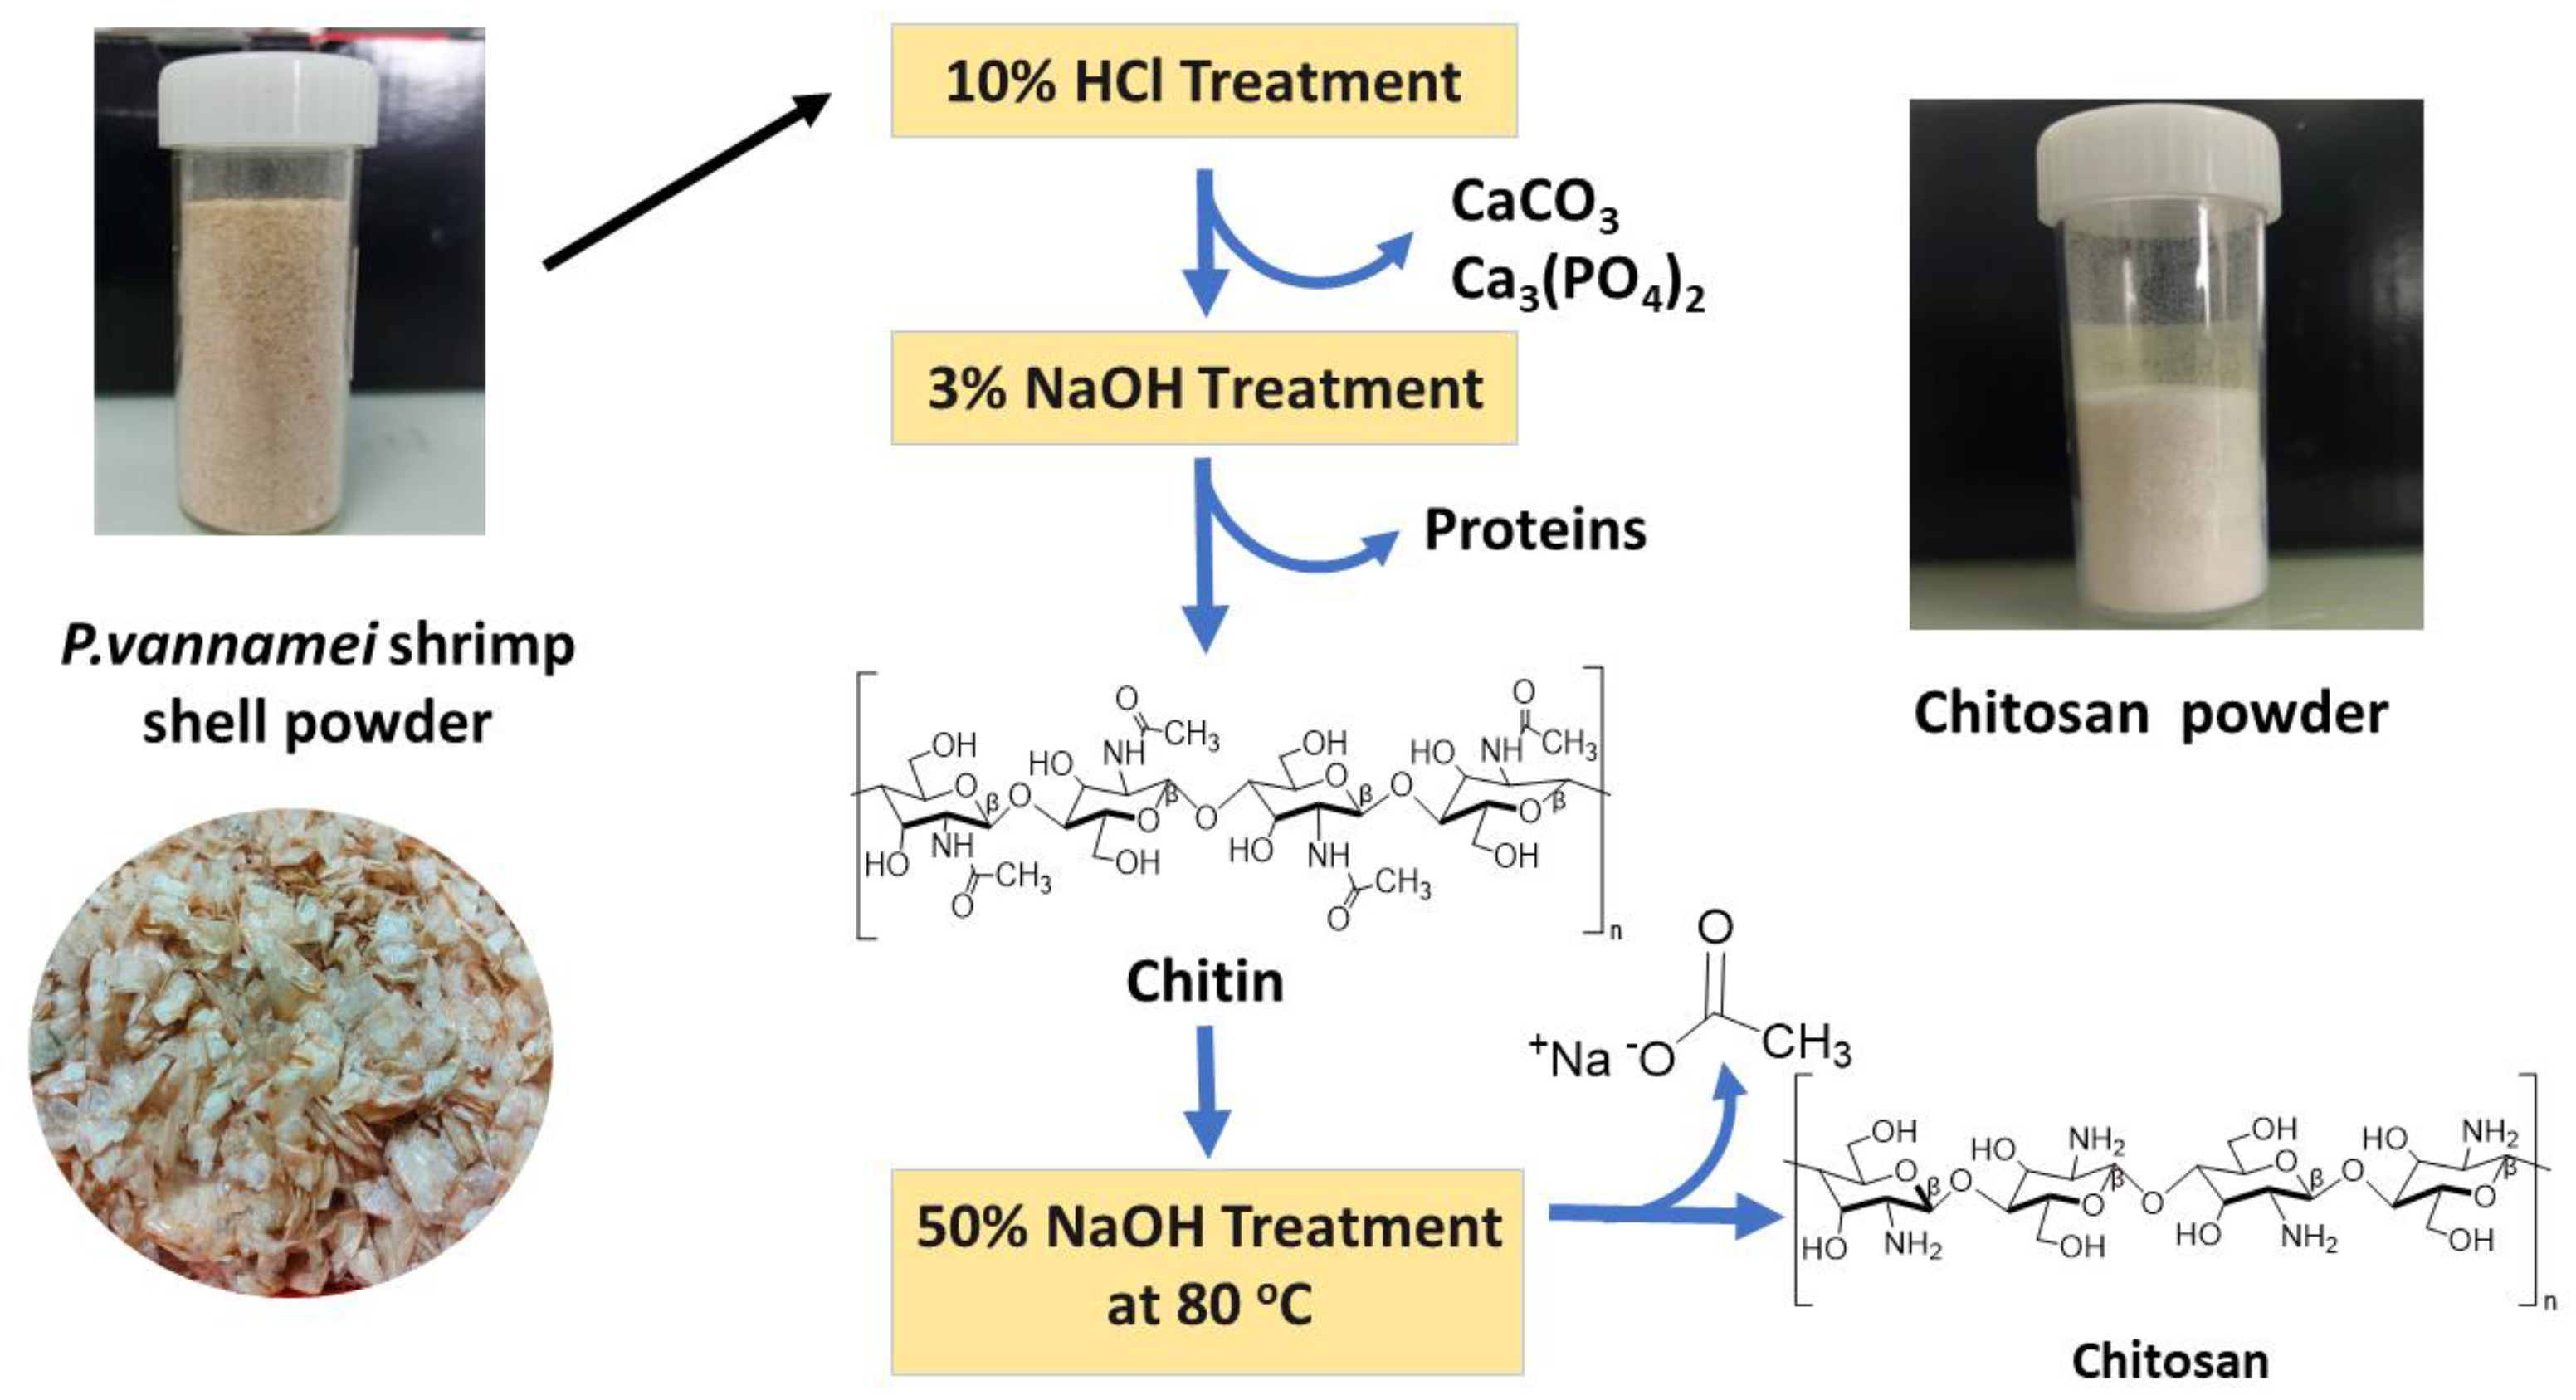
3.3. Synthesis of Chitosan from Shrimp Shells
3.4. Fabrication of the Nanocomposite
3.5. Photocatalytic Activity
4. Characterization
5. Conclusions
Supplementary Materials
Author Contributions
Funding
Institutional Review Board Statement
Informed Consent Statement
Data Availability Statement
Acknowledgments
Conflicts of Interest
References
- Kou, S.; Peters, L.M.; Mucalo, M.R. Chitosan: A Review of Sources and Preparation Methods; Elsevier: Amsterdam, The Netherlands, 2021; Volume 169, ISBN 0000000229340. [Google Scholar]
- Younes, I.; Rinaudo, M. Chitin and Chitosan Preparation from Marine Sources. Structure, Properties and Applications. Mar. Drugs 2015, 13, 1133–1174. [Google Scholar] [CrossRef] [Green Version]
- Kean, T.; Thanou, M. Chitin and Chitosan: Sources, Production and Medical Applications. RSC Polym. Chem. Ser. 2011, 1, 292–318. [Google Scholar] [CrossRef]
- Chitosan; Wiley Online Library: Hoboken, NJ, USA, 2017. [CrossRef]
- Khan, T.A.; Peh, K.K.; Ch’ng, H.S. Reporting Degree of Deacetylation Values of Chitosan: The Influence of Analytical Methods. J. Pharm. Pharm. Sci. 2002, 5, 205–212. [Google Scholar] [PubMed]
- Li, F.; You, X.; Li, Q.; Qin, D.; Wang, M.; Yuan, S.; Chen, X.; Bi, S. Homogeneous Deacetylation and Degradation of Chitin in NaOH/Urea Dissolution System. Int. J. Biol. Macromol. 2021, 189, 391–397. [Google Scholar] [CrossRef] [PubMed]
- Aranaz, I.; Alc, R.; Concepci, M. Chitosan: An Overview of Its Properties and Applications. Polymers 2021, 13, 3256. [Google Scholar] [CrossRef]
- Kulka, K.; Sionkowska, A. Chitosan Based Materials in Cosmetic Applications: A Review. Molecules 2023, 28, 1817. [Google Scholar] [CrossRef]
- Shariatinia, Z. Pharmaceutical Applications of Chitosan. Adv. Colloid Interface Sci. 2019, 263, 131–194. [Google Scholar] [CrossRef]
- Bandara, S.; Du, H.; Carson, L.; Bradford, D.; Kommalapati, R. Agricultural and Biomedical Applications of Chitosan-Based Nanomaterials. Nanomaterials 2020, 10, 1903. [Google Scholar] [CrossRef]
- Morin-Crini, N.; Lichtfouse, E.; Torri, G.; Crini, G. Applications of Chitosan in Food, Pharmaceuticals, Medicine, Cosmetics, Agriculture, Textiles, Pulp and Paper, Biotechnology, and Environmental Chemistry. Environ. Chem. Lett. 2019, 17, 1667–1692. [Google Scholar] [CrossRef] [Green Version]
- Saqib, S.; Zaman, W.; Ullah, F.; Majeed, I.; Ayaz, A.; Hussain Munis, M.F. Organometallic Assembling of Chitosan-Iron Oxide Nanoparticles with Their Antifungal Evaluation against Rhizopus Oryzae. Appl. Organomet. Chem. 2019, 33, e5190. [Google Scholar] [CrossRef]
- Saqib, S.; Zaman, W.; Ayaz, A.; Habib, S.; Bahadur, S.; Hussain, S.; Muhammad, S.; Ullah, F. Postharvest Disease Inhibition in Fruit by Synthesis and Characterization of Chitosan Iron Oxide Nanoparticles. Biocatal. Agric. Biotechnol. 2020, 28, 101729. [Google Scholar] [CrossRef]
- Thambiliyagodage, C.; Jayanetti, M.; Mendis, A.; Ekanayake, G.; Liyanaarachchi, H.; Vigneswaran, S. Recent Advances in Chitosan-Based Applications—A Review. Materials 2023, 16, 2073. [Google Scholar] [CrossRef] [PubMed]
- Yagub, M.T.; Sen, T.K.; Afroze, S.; Ang, H.M. Dye and Its Removal from Aqueous Solution by Adsorption: A Review. Adv. Colloid Interface Sci. 2014, 209, 172–184. [Google Scholar] [CrossRef] [PubMed]
- Katheresan, V.; Kansedo, J.; Lau, S.Y. Efficiency of Various Recent Wastewater Dye Removal Methods: A Review. J. Environ. Chem. Eng. 2018, 6, 4676–4697. [Google Scholar] [CrossRef]
- Thambiliyagodage, C.; Kumara, A.; Jayanetti, M.; Usgodaarachchi, L.; Liyanaarachchi, H.; Lansakara, B. Fabrication of Dual Z-Scheme g-C3N4/Fe2TiO5/Fe2O3 Ternary Nanocomposite Using Natural Ilmenite for Efficient Photocatalysis and Photosterilization under Visible Light. Appl. Surf. Sci. Adv. 2022, 12, 100337. [Google Scholar] [CrossRef]
- Gunathilaka, H.; Thambiliyagodage, C.; Usgodaarchchi, L.; Angappan, S. Effect of Surfactants on Morphology and Textural Parameters of Silica Nanoparticles Derived from Paddy Husk and Their Efficient Removal of Methylene Blue. In Proceedings of the International Conference on Innovations in Energy Engineering & Cleaner Production (IEECP’21), San Francisco, CA, USA, 29–30 July 2021. [Google Scholar] [CrossRef]
- Ramutshatsha-Makhwedzha, D.; Nomngongo, P.N. Application of Ultrafiltration Membrane Technology for Removal of Dyes from Wastewater; Springer: Berlin/Heidelberg, Germany, 2022; pp. 37–47. [Google Scholar] [CrossRef]
- Cao, N.; Yue, C.; Lin, Z.; Li, W.; Zhang, H.; Pang, J.; Jiang, Z. Durable and Chemical Resistant Ultra-Permeable Nanofiltration Membrane for the Separation of Textile Wastewater. J. Hazard. Mater. 2021, 414, 125489. [Google Scholar] [CrossRef]
- Ihaddaden, S.; Aberkane, D.; Boukerroui, A.; Robert, D. Removal of Methylene Blue (Basic Dye) by Coagulation-Flocculation with Biomaterials (Bentonite and Opuntia Ficus Indica). J. Water Process. Eng. 2022, 49, 102952. [Google Scholar] [CrossRef]
- Liyanaarachchi, H.; Thambiliyagodage, C.; Liyanaarachchi, C.; Samarakoon, U. Efficient Photocatalysis of Cu Doped TiO2/g-C3N4 for the Photodegradation of Methylene Blue. Arab. J. Chem. 2023, 16, 104749. [Google Scholar] [CrossRef]
- Thambiliyagodage, C.; Hakat, Y.; Bakker, M.G. One Pot Synthesis of Carbon/Ni Nanoparticle Monolithic Composites by Nanocasting and Their Catalytic Activity for 4-Nitrophenol Reduction. Curr. Catal. 2016, 5, 135–146. [Google Scholar] [CrossRef]
- Thambiliyagodage, C. Ligand Exchange Reactions and PEG Stabilization of Gold Nanoparticles. Curr. Res. Green Sustain. Chem. 2022, 5, 100245. [Google Scholar] [CrossRef]
- Kawai, F. Biodegradation of Polyethers (Polyethylene Glycol, Polypropylene Glycol, Polytetramethylene Glycol, and Others). Biopolym. Online 2001. [Google Scholar] [CrossRef]
- Knop, K.; Hoogenboom, R.; Fischer, D.; Schubert, U.S. Poly(Ethylene Glycol) in Drug Delivery: Pros and Cons as Well as Potential Alternatives. Angew. Chem. Int. Ed. 2010, 49, 6288–6308. [Google Scholar] [CrossRef]
- Grueso, E.; Perez-Tejeda, P.; Giráldez-Pérez, R.M.; Prado-Gotor, R.; Muriel-Delgado, F. Ethanol Effect on Gold Nanoparticle Aggregation State and Its Implication in the Interaction Mechanism with DNA. J. Colloid Interface Sci. 2018, 529, 65–76. [Google Scholar] [CrossRef]
- Zakaria, H.M.; Shah, A.; Konieczny, M.; Hoffmann, J.A.; Nijdam, A.J.; Reeves, M.E. Small Molecule- and Amino Acid-Induced Aggregation of Gold Nanoparticles. Langmuir 2013, 29, 7661–7673. [Google Scholar] [CrossRef]
- Dutta, A.; Paul, A.; Chattopadhyay, A. The Effect of Temperature on the Aggregation Kinetics of Partially Bare Gold Nanoparticles. RSC Adv. 2016, 6, 82138–82149. [Google Scholar] [CrossRef]
- Ghaly, A.; Ananthashankar, R.; Alhattab, M.; Ramakrishnan, V. Production, Characterization and Treatment of Textile Effluents: A Critical Review. J. Chem. Eng. Process. Technol. 2013, 5, 1000182. [Google Scholar] [CrossRef]
- Yaseen, D.A.; Scholz, M. Textile dye wastewater characteristics and constituents of synthetic effluents: A critical review. Int. J. Environ. Sci. Technol. 2018, 16, 1193–1226. [Google Scholar] [CrossRef] [Green Version]
- Carmen, Z.; Daniel, S. Textile Organic Dyes–Characteristics, Polluting Effects and Separation/Elimination Procedures from Industrial Effluents—A Critical Overview. In Organic Pollutants Ten Years after the Stockholm Convention; IntechOpen: London, UK, 2012; Volume 3, p. 32373. [Google Scholar] [CrossRef] [Green Version]
- Lellis, B.; Fávaro-Polonio, C.Z.; Pamphile, J.A.; Polonio, J.C. Effects of Textile Dyes on Health and the Environment and Bioremediation Potential of Living Organisms. Biotechnol. Res. Innov. 2019, 3, 275–290. [Google Scholar] [CrossRef]
- Velusamy, S.; Roy, A.; Sundaram, S.; Kumar Mallick, T. A Review on Heavy Metal Ions and Containing Dyes Removal Through Graphene Oxide-Based Adsorption Strategies for Textile Wastewater Treatment. Chem. Rec. 2021, 21, 1570–1610. [Google Scholar] [CrossRef]
- Ao, C.; Zhao, J.; Li, Q.; Zhang, J.; Huang, B.; Wang, Q.; Gai, J.; Chen, Z.; Zhang, W.; Lu, C. Biodegradable All-Cellulose Composite Membranes for Simultaneous Oil/Water Separation and Dye Removal from Water. Carbohydr. Polym. 2020, 250, 116872. [Google Scholar] [CrossRef]
- Demissie, H.; An, G.; Jiao, R.; Ritigala, T.; Lu, S.; Wang, D. Modification of High Content Nanocluster-Based Coagulation for Rapid Removal of Dye from Water and the Mechanism. Sep. Purif. Technol. 2021, 259, 117845. [Google Scholar] [CrossRef]
- Ledakowicz, S.; Pázdzior, K. Recent Achievements in Dyes Removal Focused on Advanced Oxidation Processes Integrated with Biological Methods. Molecules 2021, 26, 870. [Google Scholar] [CrossRef] [PubMed]
- Wang, W.; Lin, F.; Yan, B.; Cheng, Z.; Chen, G.; Kuang, M.; Yang, C.; Hou, L. The Role of Seashell Wastes in TiO2/Seashell Composites: Photocatalytic Degradation of Methylene Blue Dye under Sunlight. Environ. Res. 2020, 188, 109831. [Google Scholar] [CrossRef]
- Mahanta, U.; Khandelwal, M.; Deshpande, A.S. TiO2@SiO2 Nanoparticles for Methylene Blue Removal and Photocatalytic Degradation under Natural Sunlight and Low-Power UV Light. Appl. Surf. Sci. 2022, 576, 151745. [Google Scholar] [CrossRef]
- Ramar, V.; Balasubramanian, K. Reduced Graphene Oxide/WO3Nanorod Composites for Photocatalytic Degradation of Methylene Blue under Sunlight Irradiation. ACS Appl. Nano Mater. 2021, 4, 5512–5521. [Google Scholar] [CrossRef]
- Thambidurai, S.; Gowthaman, P.; Venkatachalam, M.; Suresh, S. Natural Sunlight Assisted Photocatalytic Degradation of Methylene Blue by Spherical Zinc Oxide Nanoparticles Prepared by Facile Chemical Co-Precipitation Method. Optik 2020, 207, 163865. [Google Scholar] [CrossRef]
- Vasiljevic, Z.Z.; Dojcinovic, M.P.; Vujancevic, J.D.; Jankovic-Castvan, I.; Ognjanovic, M.; Tadic, N.B.; Stojadinovic, S.; Brankovic, G.O.; Nikolic, M.V. Photocatalytic Degradation of Methylene Blue under Natural Sunlight Using Iron Titanate Nanoparticles Prepared by a Modified Sol–Gel Method. R. Soc. Open Sci. 2020, 7, 200708. [Google Scholar] [CrossRef]
- Lv, T.; Pan, L.; Liu, X.; Sun, Z. Enhanced Photocatalytic Degradation of Methylene Blue by ZnO–Reduced Graphene Oxide–Carbon Nanotube Composites Synthesized via Microwave-Assisted Reaction. Catal. Sci. Technol. 2012, 2, 2297–2301. [Google Scholar] [CrossRef]
- Liao, Y.; Pan, K.; Wang, L.; Pan, Q.; Zhou, W.; Miao, X.; Jiang, B.; Tian, C.; Tian, G.; Wang, G.; et al. Facile Synthesis of High-Crystallinity Graphitic Carbon/Fe3C Nanocomposites as Counter Electrodes for High-Efficiency Dye-Sensitized Solar Cells. ACS Appl. Mater. Interfaces 2013, 5, 3663–3670. [Google Scholar] [CrossRef]
- Zhao, D.; Yang, X.; Chen, C.; Wang, X. Enhanced Photocatalytic Degradation of Methylene Blue on Multiwalled Carbon Nanotubes–TiOJ. Colloid Interface Sci. 2013, 398, 234–239. [Google Scholar] [CrossRef]
- Mutuma, B.K.; Shao, G.N.; Kim, W.D.; Kim, H.T. Sol–Gel Synthesis of Mesoporous Anatase–Brookite and Anatase–Brookite–Rutile TiO2 Nanoparticles and Their Photocatalytic Properties. J. Colloid Interface Sci. 2015, 442, 1–7. [Google Scholar] [CrossRef] [PubMed]
- Kumbhakar, P.; Pramanik, A.; Biswas, S.; Kole, A.K.; Sarkar, R.; Kumbhakar, P. In-Situ Synthesis of RGO-ZnO Nanocomposite for Demonstration of Sunlight Driven Enhanced Photocatalytic and Self-Cleaning of Organic Dyes and Tea Stains of Cotton Fabrics. J. Hazard. Mater. 2018, 360, 193–203. [Google Scholar] [CrossRef] [PubMed]
- Kumbhakar, P.; Biswas, S.; Kumbhakar, P. Observation of High Photocatalytic Activity by Tuning of Defects in Chemically Synthesized Ethylene Glycol Capped ZnO Nanorods. Optik 2018, 154, 303–314. [Google Scholar] [CrossRef]
- Bao, S.; Wang, Y.; Wei, Z.; Yang, W.; Yu, Y. Highly Efficient Recovery of Heavy Rare Earth Elements by Using an Amino-Functionalized Magnetic Graphene Oxide with Acid and Base Resistance. J. Hazard. Mater. 2022, 424, 127370. [Google Scholar] [CrossRef]
- Thambiliyagodage, C.J.; Ulrich, S.; Araujo, P.T.; Bakker, M.G. Catalytic Graphitization in Nanocast Carbon Monoliths by Iron, Cobalt and Nickel Nanoparticles. Carbon 2018, 134, 452–463. [Google Scholar] [CrossRef]
- Sheka, E.F.; Golubev, Y.A.; Popova, N.A. Graphene Domain Signature of Raman Spectra of Sp2 Amorphous Carbons. Nanomaterials 2020, 10, 2021. [Google Scholar] [CrossRef] [PubMed]
- Kuila, S.K.; Sarkar, R.; Kumbhakar, P.; Kumbhakar, P.; Tiwary, C.S.; Kundu, T.K. Photocatalytic Dye Degradation under Sunlight Irradiation Using Cerium Ion Adsorbed Two-Dimensional Graphitic Carbon Nitride. J. Environ. Chem. Eng. 2020, 8, 103942. [Google Scholar] [CrossRef]
- Zhang, X.; Yang, W.; Gao, M.; Liu, H.; Li, K.; Yu, Y. Room-Temperature Solid Phase Surface Engineering of BiOI Sheets Stacking g-C3N4 Boosts Photocatalytic Reduction of Cr(VI). Green Energy Environ. 2022, 7, 66–74. [Google Scholar] [CrossRef]
- Zhang, X.; Tian, F.; Lan, X.; Liu, Y.; Yang, W.; Zhang, J.; Yu, Y. Building P-Doped MoS2/g-C3N4 Layered Heterojunction with a Dual-Internal Electric Field for Efficient Photocatalytic Sterilization. Chem. Eng. J. 2022, 429, 132588. [Google Scholar] [CrossRef]
- Oya, A.; Otani, S. Catalytic Graphitization of Carbons by Various Metals. Carbon 1979, 17, 131–137. [Google Scholar] [CrossRef]
- Majumdar, A.; Das, S.C.; Shripathi, T.; Hippler, R. Chemical Synthesis and Surface Morphology of Amorphous Hydrogenated Carbon Nitride Film Deposited by N2/CH4 Dielectric Barrier Discharge Plasma. Compos. Interfaces 2012, 19, 161–170. [Google Scholar] [CrossRef]
- Zhang, Y.; Liu, L.; Wang, K.; Wang, Y. CTAB-Assisted Synthesis of N-Doped Fe3C Nanowires and Their Magnetic Properties. J. Supercond. Nov. Magn. 2019, 32, 3503–3508. [Google Scholar] [CrossRef]
- Thambiliyagodage, C.; Usgodaarachchi, L.; Jayanetti, M.; Liyanaarachchi, C.; Kandanapitiye, M.; Vigneswaran, S. Efficient Visible-Light Photocatalysis and Antibacterial Activity of TiO2-Fe3C-Fe-Fe3O4/Graphitic Carbon Composites Fabricated by Catalytic Graphitization of Sucrose Using Natural Ilmenite. ACS Omega 2022, 7, 25403–25421. [Google Scholar] [CrossRef] [PubMed]
- Sallem, F.; Boudon, J.; Heintz, O.; Séverin, I.; Megriche, A.; Millot, N. Synthesis and Characterization of Chitosan-Coated Titanate Nanotubes: Towards a New Safe Nanocarrier. Dalton Trans. 2017, 46, 15386–15398. [Google Scholar] [CrossRef]
- Usgodaarachchi, L.; Thambiliyagodage, C.; Wijesekera, R.; Vigneswaran, S.; Kandanapitiye, M. Fabrication of TiO2 Spheres and a Visible Light Active α-Fe2O3/TiO2-Rutile/TiO2-Anatase Heterogeneous Photocatalyst from Natural Ilmenite. ACS Omega 2022, 7, 27617–27637. [Google Scholar] [CrossRef]
- Charitha, T.; Leshan, U.; Shanitha, M.; Ramanee, W.; Buddi, L.; Martin, B. Efficient Photodegradation Activity of α-Fe2O3/Fe2TiO5/TiO2 and Fe2TiO5/TiO2 Nanocomposites Synthesized from Natural Ilmenite. Results Mater. 2021, 12, 100219. [Google Scholar] [CrossRef]
- Makuła, P.; Pacia, M.; Macyk, W. How To Correctly Determine the Band Gap Energy of Modified Semiconductor Photocatalysts Based on UV–Vis Spectra. J. Phys. Chem. Lett. 2018, 9, 6814–6817. [Google Scholar] [CrossRef] [Green Version]
- Singh, M.; Goyal, M.; Devlal, K. Size and Shape Effects on the Band Gap of Semiconductor Compound Nanomaterials. J. Taibah Univ. Sci. 2018, 12, 470–475. [Google Scholar] [CrossRef] [Green Version]
- Degabriel, T.; Colaço, E.; Domingos, R.F.; El Kirat, K.; Brouri, D.; Casale, S.; Landoulsi, J.; Spadavecchia, J. Factors Impacting the Aggregation/Agglomeration and Photocatalytic Activity of Highly Crystalline Spheroid- and Rod-Shaped TiO2 Nanoparticles in Aqueous Solutions. Phys. Chem. Chem. Phys. 2018, 20, 12898–12907. [Google Scholar] [CrossRef]
- Thambiliyagodage, C.; Lokuge, N. Effect of Co-Pollutants on the Photocatalytic Activity of Fe Doped ZnO Nanoparticles on the Degradation of Methylene Blue. In Proceedings of the 2022 IEEE International Conference on Nanoelectronics, Nanophotonics, Nanomaterials, Nanobioscience & Nanotechnology (5NANO), Kottayam, India, 28–29 April 2022; pp. 1–5. [Google Scholar] [CrossRef]
- Zhang, K.; Dai, Z.; Zhang, W.; Gao, Q.; Dai, Y.; Xia, F.; Zhang, X. EDTA-Based Adsorbents for the Removal of Metal Ions in Wastewater. Coord. Chem. Rev. 2021, 434, 213809. [Google Scholar] [CrossRef]
- Wang, Y.; Zhou, R.; Wang, C.; Zhou, G.; Hua, C.; Cao, Y.; Song, Z. Novel Environmental-Friendly Nano-Composite Magnetic Attapulgite Functionalized by Chitosan and EDTA for Cadmium (II) Removal. J. Alloy. Compd. 2020, 817, 153286. [Google Scholar] [CrossRef]
- Thambiliyagodage, C.; Mirihana, S.; Wijesekera, R.; Madusanka, D.S.; Kandanapitiye, M.; Bakker, M. Fabrication of Fe2TiO5/TiO2 Binary Nanocomposite from Natural Ilmenite and Their Photocatalytic Activity under Solar Energy. Curr. Res. Green Sustain. Chem. 2021, 4, 100156. [Google Scholar] [CrossRef]
- Krishnan, S.; Shriwastav, A. Application of TiO2 Nanoparticles Sensitized with Natural Chlorophyll Pigments as Catalyst for Visible Light Photocatalytic Degradation of Methylene Blue. J. Environ. Chem. Eng. 2021, 9, 104699. [Google Scholar] [CrossRef]


| Sample | Plane | 2θ (°) | L (nm) | d (nm) | L/d |
|---|---|---|---|---|---|
| CIL (1:1) | (104) | 32.82 | 39.83 | 0.2726 | 146 |
| CIL (3:4) | (104) | 32.82 | 39.29 | 0.2727 | 144 |
| CIL (1:2) | (104) | 32.89 | 39.84 | 0.2721 | 146 |
| CIL (1:4) | (104) | 32.74 | 55.39 | 0.2733 | 202 |
| Sample | Band Gap (eV) | |
|---|---|---|
| Direct (n = 2) | Indirect (n = 1/2) | |
| CIL (1:1) | 2.28 | 2.26 |
| CIL (3:4) | 2.28 | 2.26 |
| CIL (1:2) | 2.18 | 2.28 |
| CIL (1:4) | 2.31 | 2.06 |
| C800 | 1.84 | 1.80 |
| IL | 1.87 | 1.78 |
| Sample | Pseudo-First-Order Kinetics | ||
|---|---|---|---|
| R2 | Rate Constant (min−1) × 10−3 | Rate Constant/Surface Area × 10−5 | |
| CIL (1:1) | 0.9954 | 4.4 | 2.4 |
| CIL (3:4) | 0.9892 | 4.3 | 2.1 |
| CIL (1:2) | 0.9973 | 3.5 | 2.5 |
| CIL (1:4) | 0.9957 | 3.4 | 3.2 |
| IL | 0.9853 | 0.63 | 0.21 |
| C800 | 0.9990 | 0.72 | 0.93 |
| Concentration (mg/L) | Pseudo-First-Order | |
|---|---|---|
| R2 | Rate Constant × 10−3 (min−1) | |
| 5 | 0.9667 | 3.2 |
| 10 | 0.9611 | 4.0 |
| 20 | 0.9861 | 2.5 |
| 40 | 0.9832 | 2.2 |
| 100 | 0.9970 | 1.4 |
| Mass (mg) | Pseudo-First-Order | |
|---|---|---|
| R2 | Rate Constant × 10−3 (min−1) | |
| 10 | 0.9862 | 1.4 |
| 25 | 0.9890 | 3.3 |
| 50 | 0.9893 | 2.5 |
| 100 | 0.9679 | 2.1 |
| Co-Pollutant | Pseudo-First-Order | |
|---|---|---|
| R2 | Rate Constant × 10−3 (min−1) | |
| Control | 0.9889 | 6.0 |
| Rhodamine | 0.9859 | 5.1 |
| NaCl | 0.9752 | 5.3 |
| Phosphate | 0.9867 | 5.1 |
| Lead nitrate | 0.9762 | 4.4 |
| Concentration | R2 | Rate Constant (min−1) |
|---|---|---|
| Control | 0.9670 | 4.55 × 10⁻³ |
| 1 mM | 0.9823 | 2.47 × 10⁻² |
| 2 mM | 0.9954 | 2.83 × 10⁻² |
| 4 mM | 0.9889 | 4.69 × 10⁻² |
| 8 mM | 0.9422 | 5.62 × 10⁻² |
| Photocatalysts | Dosage (g/L) | MB Concentration (mg/L) | Rate (min−1) | Light Source | Reference |
|---|---|---|---|---|---|
| TiO2/Fe2O3/Fe-/N-doped Graphitic Carbon Composite | 0.5 | 10 | 4.4 × 10⁻³ | Natural sunlight | Present study |
| TiO2/Seashell Composites | 1 | 10 | 1.76 × 10⁻² | UV light (365 nm) | [38] |
| TiO2-Fe3C-Fe-Fe3O4/Graphitic Carbon Composites | 1 | 10 | 7.0 × 10⁻³ | Natural sunlight | [58] |
| Fe2TiO5/TiO2 | 2 | 10 | 8.4 × 10⁻³ | Natural sunlight | [68] |
| TiO2 Nanoparticles Sensitized with Natural Chlorophyll Pigments | 2.5 | 20 | 1.4 × 10⁻² | Visible blue LED light (457 nm) | [69] |
Disclaimer/Publisher’s Note: The statements, opinions and data contained in all publications are solely those of the individual author(s) and contributor(s) and not of MDPI and/or the editor(s). MDPI and/or the editor(s) disclaim responsibility for any injury to people or property resulting from any ideas, methods, instructions or products referred to in the content. |
© 2023 by the authors. Licensee MDPI, Basel, Switzerland. This article is an open access article distributed under the terms and conditions of the Creative Commons Attribution (CC BY) license (https://creativecommons.org/licenses/by/4.0/).
Share and Cite
Mendis, A.; Thambiliyagodage, C.; Ekanayake, G.; Liyanaarachchi, H.; Jayanetti, M.; Vigneswaran, S. Fabrication of Naturally Derived Chitosan and Ilmenite Sand-Based TiO2/Fe2O3/Fe-N-Doped Graphitic Carbon Composite for Photocatalytic Degradation of Methylene Blue under Sunlight. Molecules 2023, 28, 3154. https://doi.org/10.3390/molecules28073154
Mendis A, Thambiliyagodage C, Ekanayake G, Liyanaarachchi H, Jayanetti M, Vigneswaran S. Fabrication of Naturally Derived Chitosan and Ilmenite Sand-Based TiO2/Fe2O3/Fe-N-Doped Graphitic Carbon Composite for Photocatalytic Degradation of Methylene Blue under Sunlight. Molecules. 2023; 28(7):3154. https://doi.org/10.3390/molecules28073154
Chicago/Turabian StyleMendis, Amavin, Charitha Thambiliyagodage, Geethma Ekanayake, Heshan Liyanaarachchi, Madara Jayanetti, and Saravanamuthu Vigneswaran. 2023. "Fabrication of Naturally Derived Chitosan and Ilmenite Sand-Based TiO2/Fe2O3/Fe-N-Doped Graphitic Carbon Composite for Photocatalytic Degradation of Methylene Blue under Sunlight" Molecules 28, no. 7: 3154. https://doi.org/10.3390/molecules28073154
APA StyleMendis, A., Thambiliyagodage, C., Ekanayake, G., Liyanaarachchi, H., Jayanetti, M., & Vigneswaran, S. (2023). Fabrication of Naturally Derived Chitosan and Ilmenite Sand-Based TiO2/Fe2O3/Fe-N-Doped Graphitic Carbon Composite for Photocatalytic Degradation of Methylene Blue under Sunlight. Molecules, 28(7), 3154. https://doi.org/10.3390/molecules28073154