Article

Benchmarking First-Principles Reaction Equilibrium Composition Prediction

by
Esteban A. Marques
1,2,*,
Stefan De Gendt
1,2,
Geoffrey Pourtois
2 and
Michiel J. van Setten
2,3,*
1
Department of Chemistry, KU Leuven (University of Leuven), Celestijnenlaan 200 F, 3001 Heverlee, Belgium
2
IMEC, Kapeldreef 75, 3001 Leuven, Belgium
3
ETSF European Theoretical Spectroscopy Facility, Institut de Physique, Université de Liège, Allée du 6 août 17, 4000 Liège, Belgium
*
Authors to whom correspondence should be addressed.
Molecules 2023, 28(9), 3649; https://doi.org/10.3390/molecules28093649
Submission received: 31 March 2023 / Revised: 19 April 2023 / Accepted: 20 April 2023 / Published: 22 April 2023
(This article belongs to the Section Physical Chemistry)

Abstract

:
The availability of thermochemical properties allows for the prediction of the equilibrium compositions of chemical reactions. The accurate prediction of these can be crucial for the design of new chemical synthesis routes. However, for new processes, these data are generally not completely available. A solution is the use of thermochemistry calculated from first-principles methods such as Density Functional Theory (DFT). Before this can be used reliably, it needs to be systematically benchmarked. Although various studies have examined the accuracy of DFT from an energetic point of view, few studies have considered its accuracy in predicting the temperature-dependent equilibrium composition. In this work, we collected 117 molecules for which experimental thermochemical data were available. From these, we constructed 2648 reactions. These experimentally constructed reactions were then benchmarked against DFT for 6 exchange–correlation functionals and 3 quality of basis sets. We show that, in reactions that do not show temperature dependence in the equilibrium composition below 1000 K, over 90% are predicted correctly. Temperature-dependent equilibrium compositions typically demonstrate correct qualitative behavior. Lastly, we show that the errors are equally caused by errors in the vibrational spectrum and the DFT electronic ground state energy.

Graphical Abstract

1. Introduction

Determining the thermodynamic properties of chemical reactions is of extreme importance in chemical process design and heavily relies on our ability to measure or compute Gibbs free energies [1,2]. Whilst molecular Gibbs free energies, which enable equilibrium composition predictions, may be found in literature sources, such as the NIST Chemistry WebBook [3], for simple systems, even for many relatively standard molecules, these data are not available. For new processes, such as (Area Selective) Atomic Layer Deposition ((AS)ALD) [4,5] and Chemical Vapor Deposition (CVD) [6,7,8], with experimentally difficult-to-measure and new, hypothetical molecules, the challenge is even bigger. In these cases, Density Functional Theory (DFT) [9,10] may provide an alternative source of information. Since DFT can give both the ground state electronic energy as well as the vibrational spectrum [11,12,13], it can be combined with statistical thermodynamics to yield all relevant and necessary thermodynamic quantities [14,15]. A quantity such as the equilibrium composition, which is of paramount importance in process design, is, however, rather complex; it combines many ingredients. Determining a systematic error bar is, hence, difficult, and a thorough benchmark is the only way out.
In the last 10–20 years, the number of studies that have benchmarked a specific property calculated from DFT or used a more advanced computational method has been increasing [13,16,17,18,19,20,21,22,23,24,25,26,27,28,29]. However, very few of them have focused on the complex issue of predicting the equilibrium composition systematically. Many studies have focused on the enthalpies and energies of reactions. In such studies, the accuracy of the prediction of the enthalpies and energies of reactions typically lies at around 2–10 kcal mol 1 [30,31,32,33,34,35,36,37,38,39,40,41] for small to medium sized organic molecules and up to 40 kcal mol 1 [42,43] for inorganic ones. Although enthalpies are a key component of Gibbs free energy, the effect that errors in their prediction have on the equilibrium composition has not been directly tackled. Moreover, the few studies that have explicitly dealt with equilibrium compositions have tended to focus on specific systems and have used a narrow scope [44,45]. Thus, a general and broad study quantifying the accuracy of DFT-predicted reaction equilibria is needed to broadly enable the use of DFT to guide the optimization of process conditions in many domains of chemistry.
To develop a benchmark of DFT for predicting temperature- and pressure-dependent reaction equilibria, we first need a reliable experimental reference. In this work, we collected all molecules cataloged in the Computational Chemistry Comparison and Benchmark DataBase (CCCBDB) [46] with experimental Gibbs free energy curves and elements from the first two rows of the periodic table excluding noble gases, lithium, and magnesium and including bromine. In total, this selection encompassed 117 molecules. We then calculated the Gibbs free energy of these molecules with DFT using six different exchange–correlation functionals and three basis sets of increasing size. Using these data, we calculated the equilibrium compositions for all possible independent reactions with less than 5 reagents, amounting to a total of 2648 reactions. We calculated the equilibrium temperature-dependent composition for the DFT and experimental Gibbs energies individually and directly compared the results to assess how the errors from the DFT thermodynamics affect the equilibrium composition.

2. Results

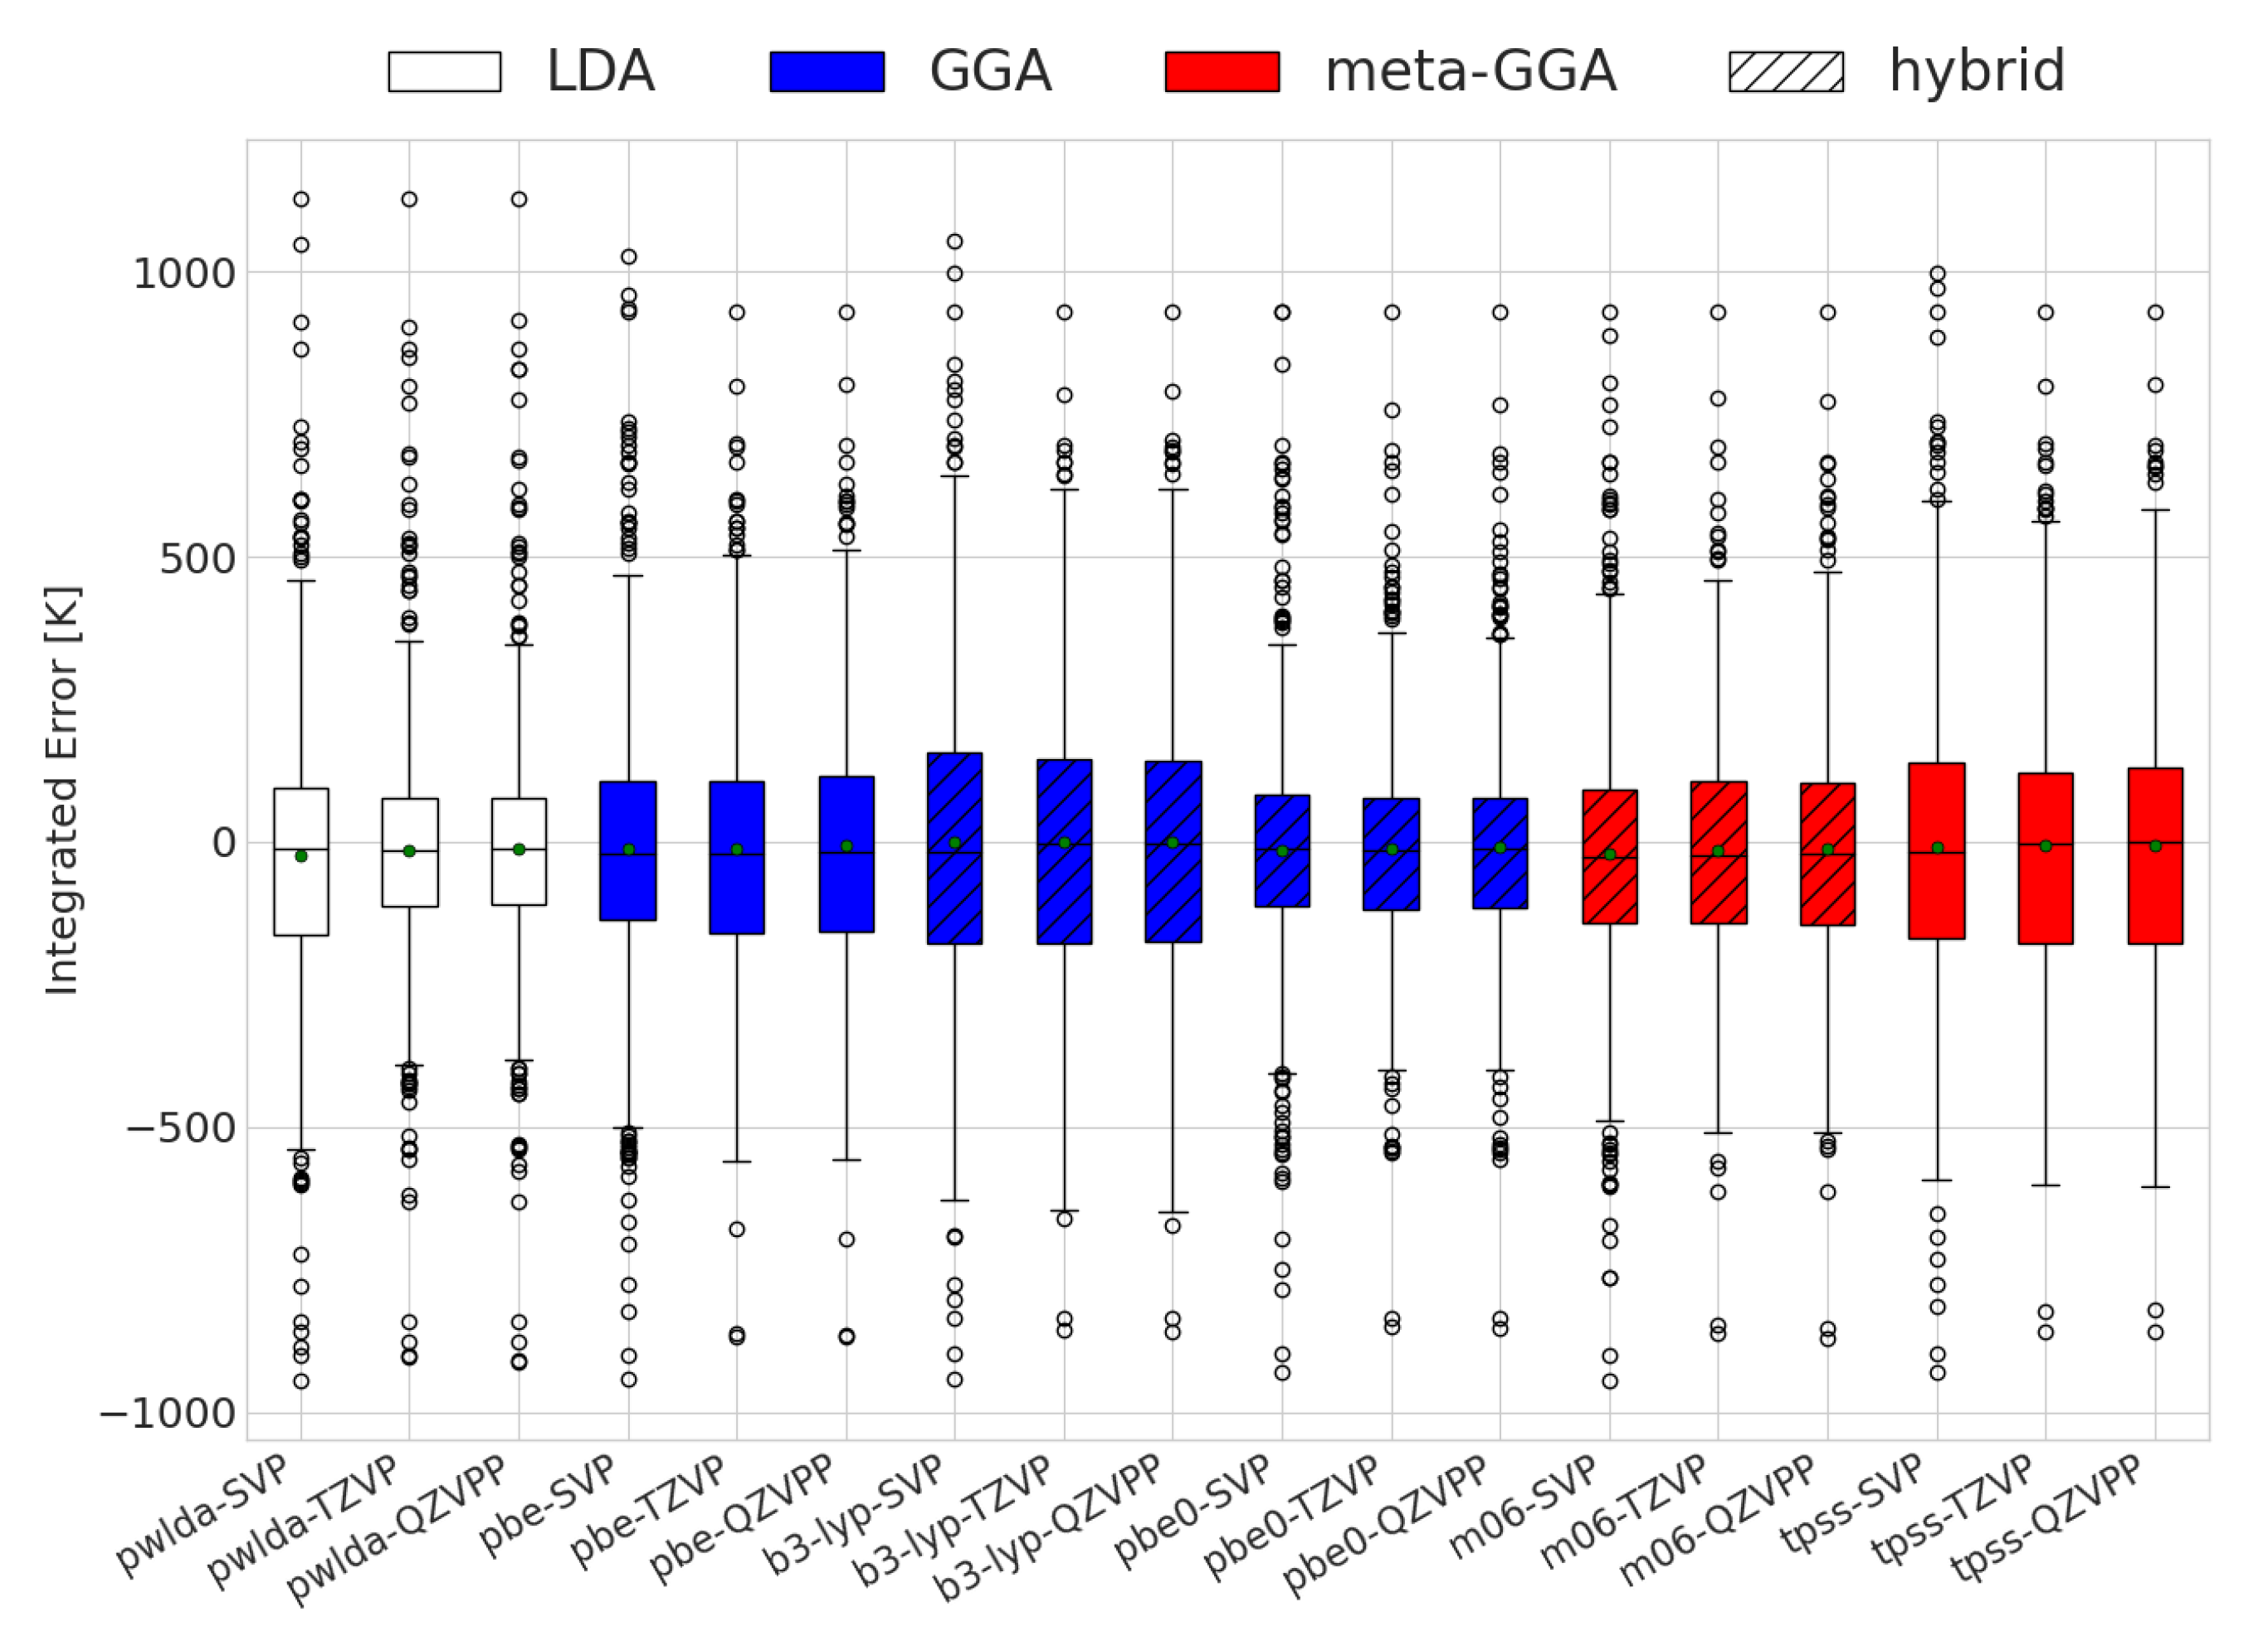
2.1. Errors for Constant Equilibrium Compositions

In our reaction set, most reactions have a fixed equilibrium composition (2164 reactions). As stated above, the signs of Δ G at the edges of the temperature range are enough to determine whether a correct composition is predicted. We present the results for this analysis in Table 1 with respect to experimental reports for the different functional and basis set combinations.
Except for the calculations of the LDA/SVP combination, DFT was able to capture the correct compositions of the reactions in more than 90% of cases. Additionally, both the functional choice as well as the basis set choice had relatively small effects on this percentage, providing marginal improvements of 4% and 8%, respectively. As expected, we observed that the performance of TZVP and QZVPP was indistinguishable. More unexpectedly, we see that hardly any improvement beyond the PBE results was made.
The errors in the molecular Gibbs free energies calculated from DFT have two origins. One is the temperature-independent part originating from the electronic total energy and the zero point vibrational energy and the other is the temperature-dependent part originating from the occupation of vibrational, translational, and rotational modes.
An important part of the error in the temperature-dependent part is associated with the harmonic approximation used to describe the vibrational modes in the enthalpy and entropy terms of the Gibbs free energy. This approximation is only valid at sufficiently low temperatures when the asymmetry of the potential energy landscape for the vibrational energy states can be neglected. To quantify the magnitude of the errors introduced by the harmonic approximation, Table 2 presents the minimal, maximal, and mean errors of the temperature-dependent part of the Gibbs free energies of all molecules for all functionals and basis sets for two temperatures, 400 and 1500 K. The temperature-dependent term of the molecules arising from the vibrational contribution differs from its experimental counterpart by −312.72 to 297.78 kJ mol 1 at 1500 K, while the range is only −45.53 to 60.53 kJ mol 1 at 400 K. Although these numbers seem huge, ultimately, we are only interested in energy differences between products and reactions. The variation over the different basis sets and functionals is minimal.
When carrying out the sign analysis approach only at lower-temperature windows [39] (300–400 K), we found an improvement of 2–4 percent points in terms of the percentage of correct predictions made. Considering only Gibbs energies between 300–400 K, the results are presented in Table 3.
The remainder of the incorrect predictions for all reactions with temperature- independent reactions from DFT are caused by ground state energy errors. We found that the set of reactions with an incorrect Gibbs reaction energy sign at a low temperature was associated with a Δ H 0 K , reaction term of around 60–150 kJ mol 1 , which is about 10 times smaller than the average Δ H 0 K , reaction , found to be above 600 kJ mol 1 . The exception to this was the PW-LDA functional, for which no relevant threshold value was found.

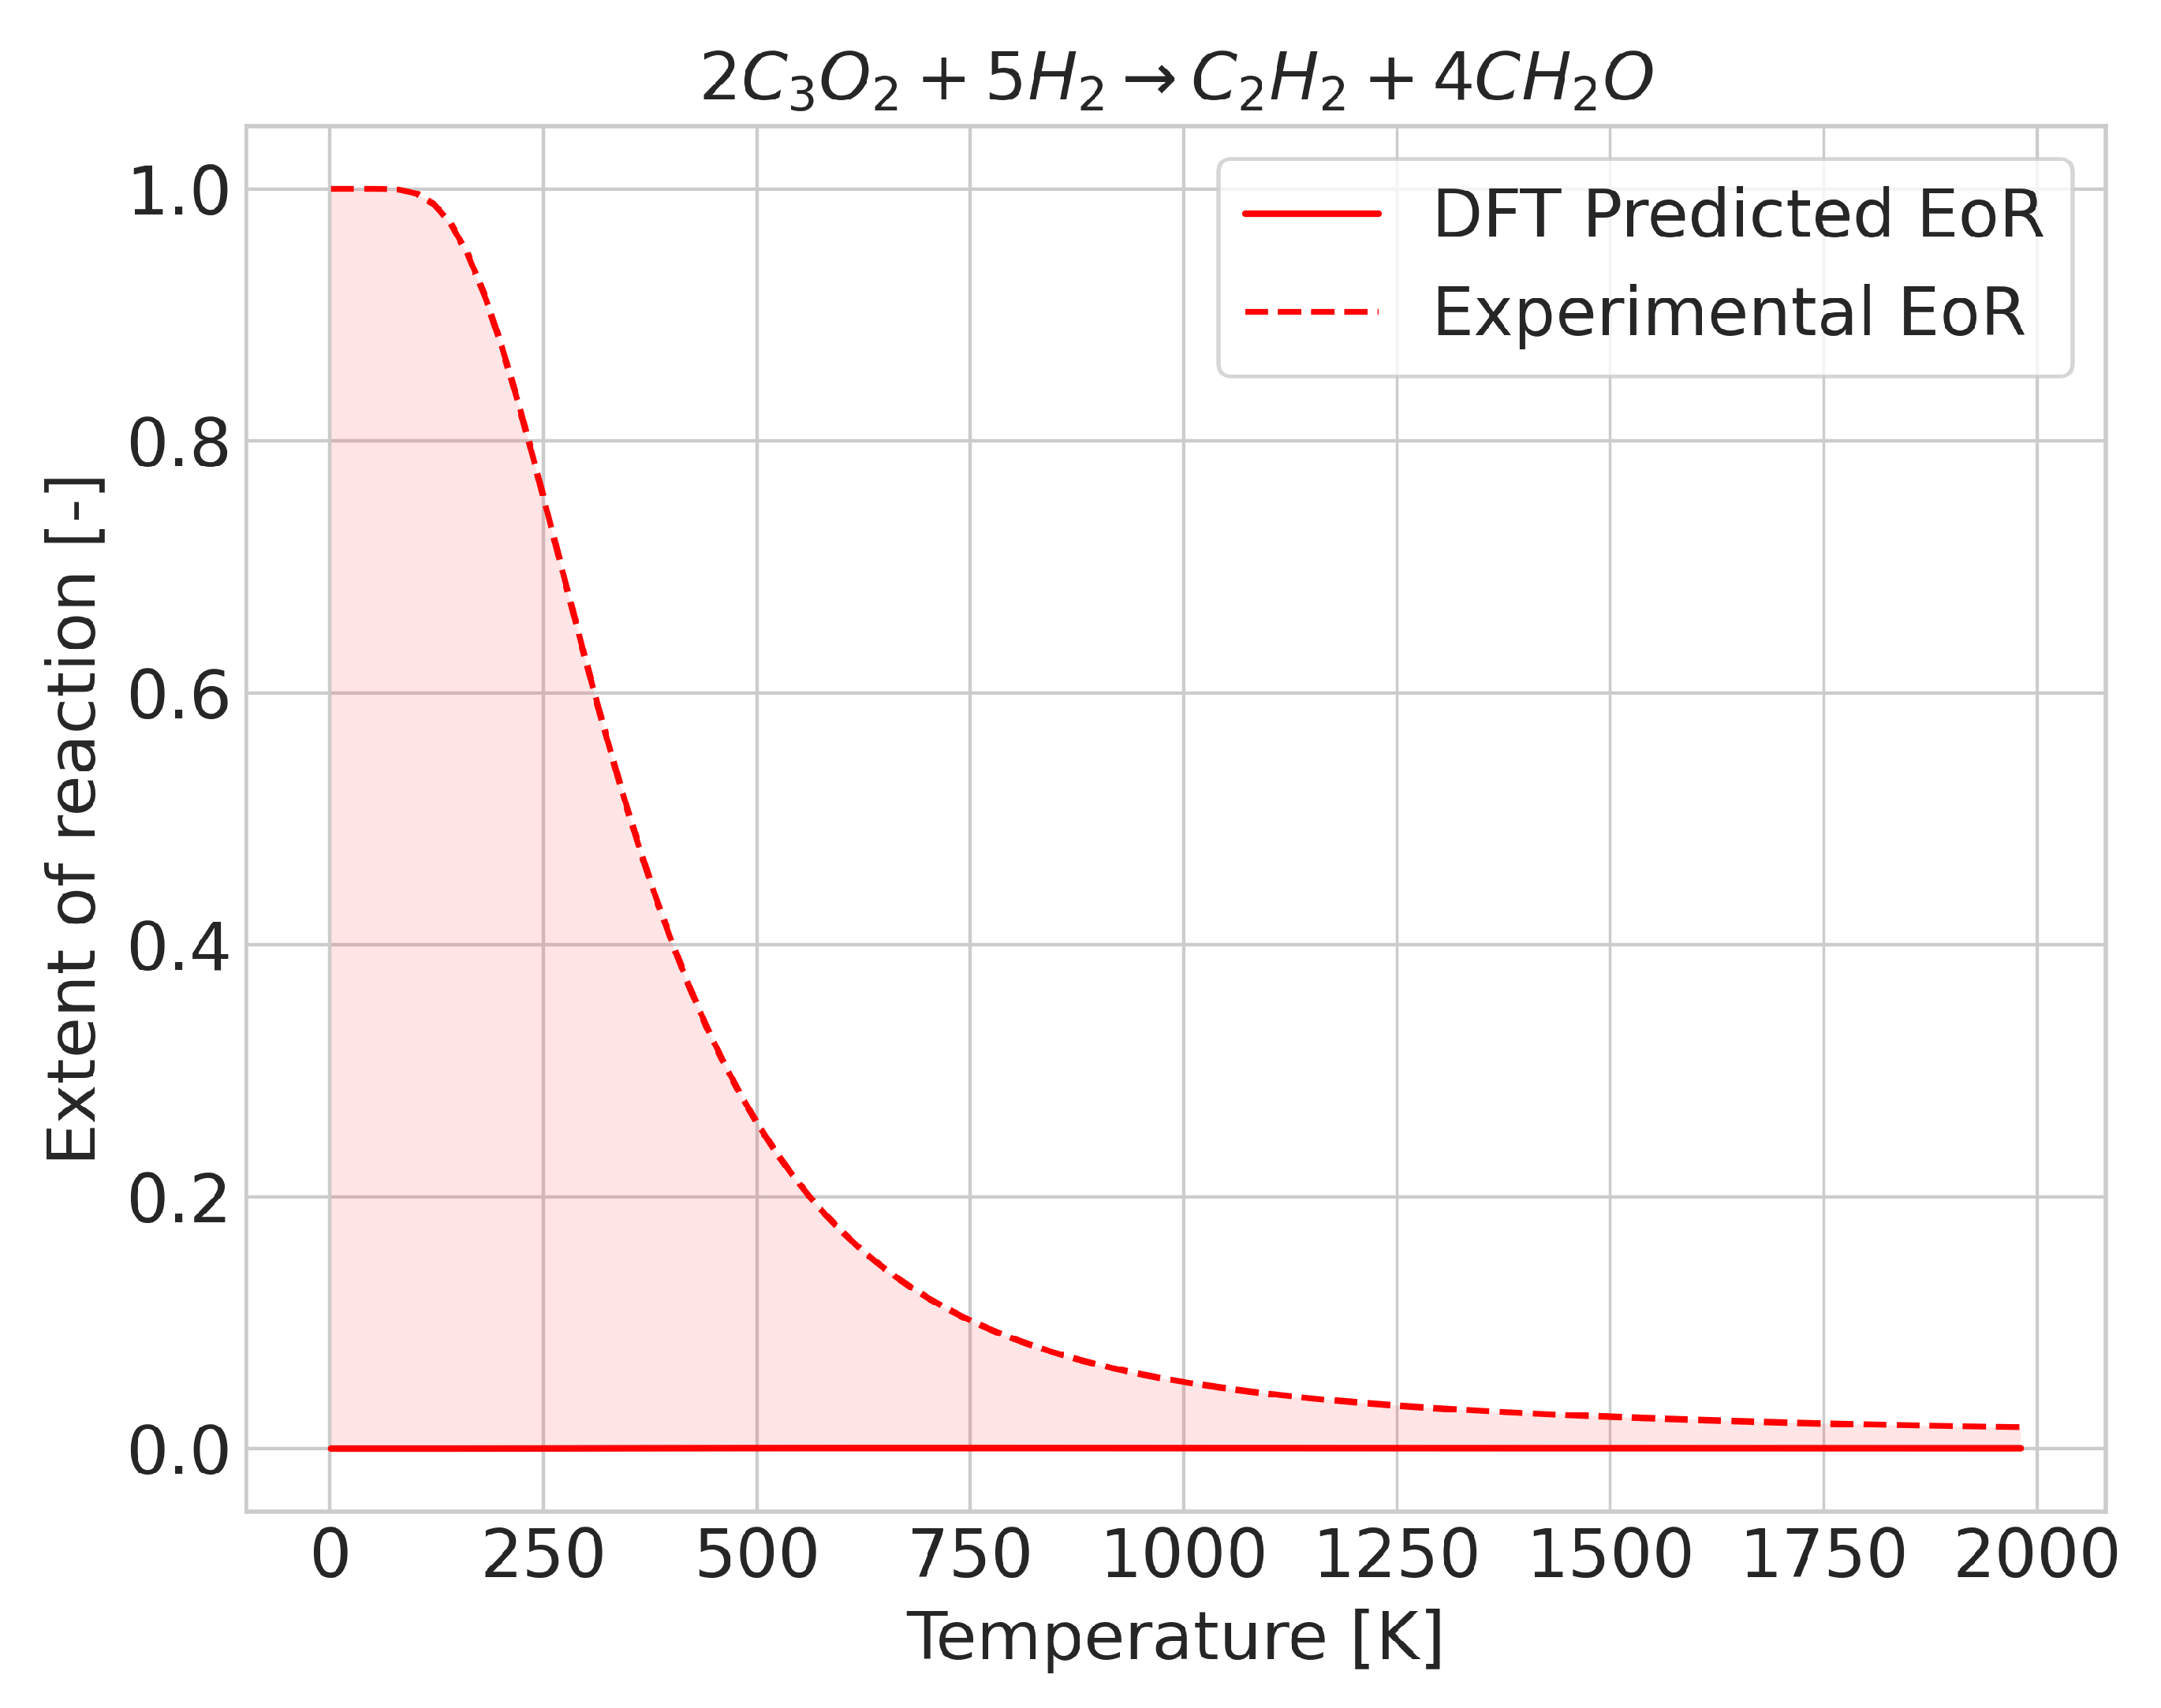
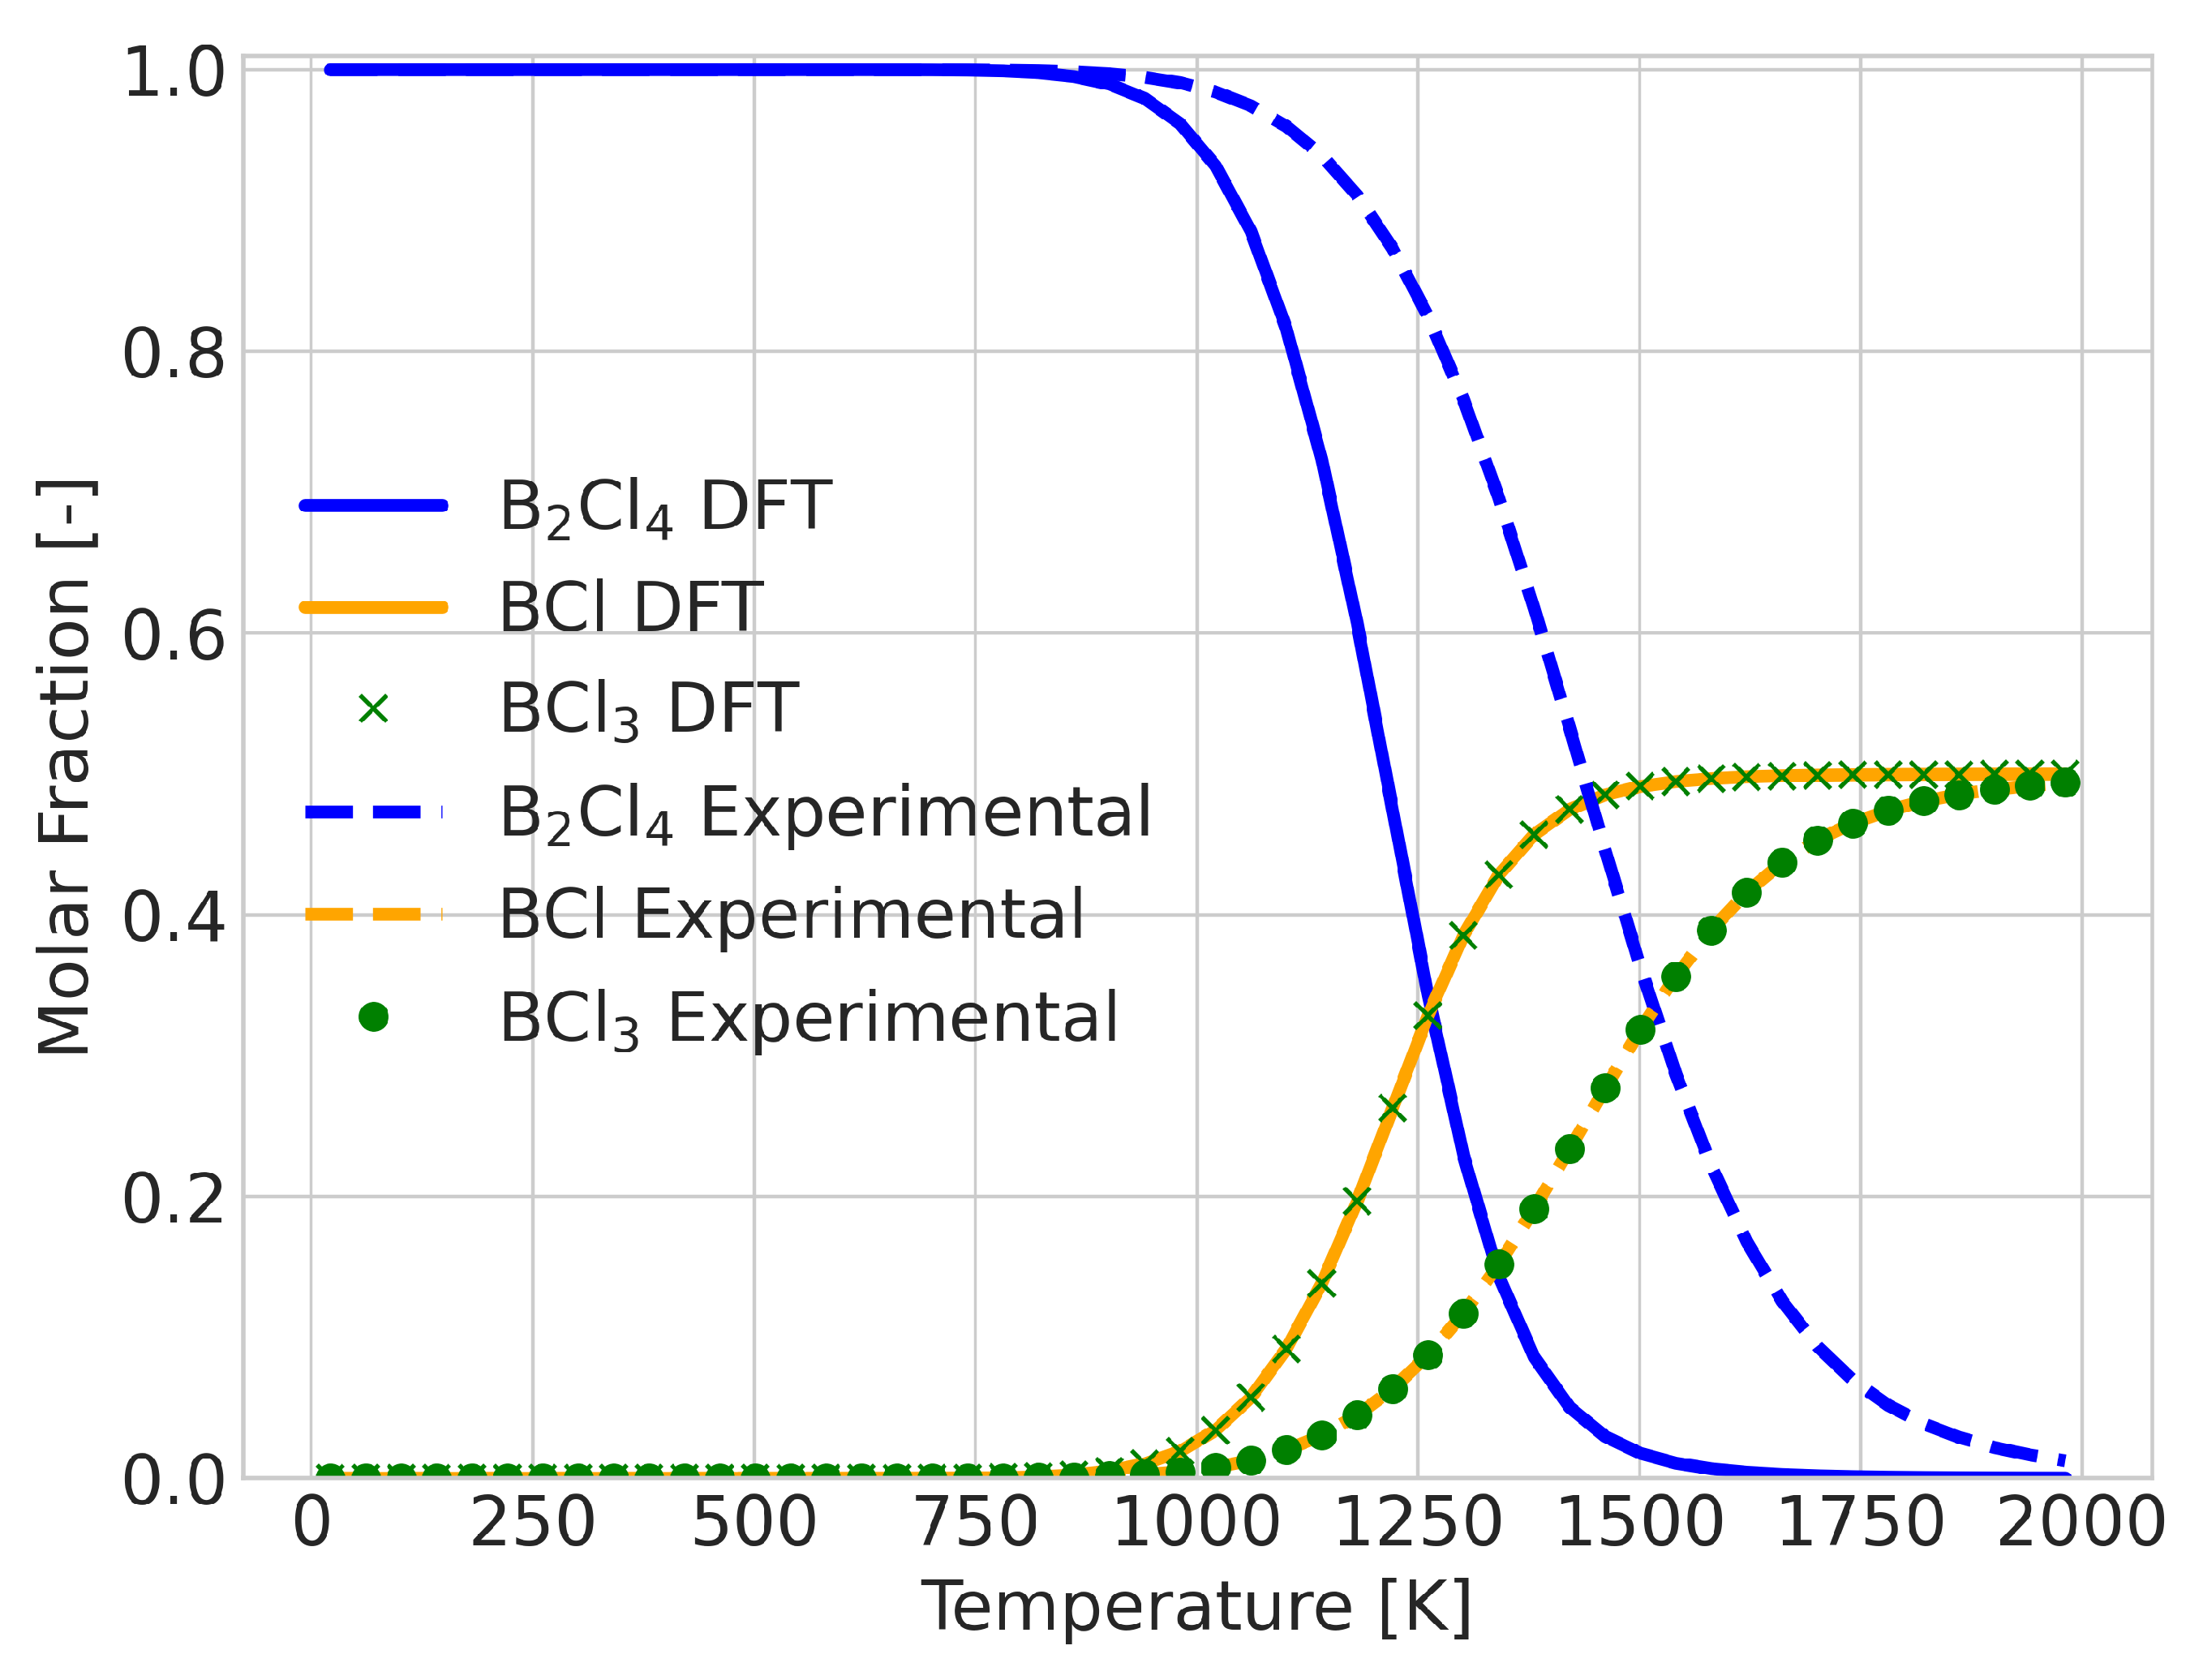
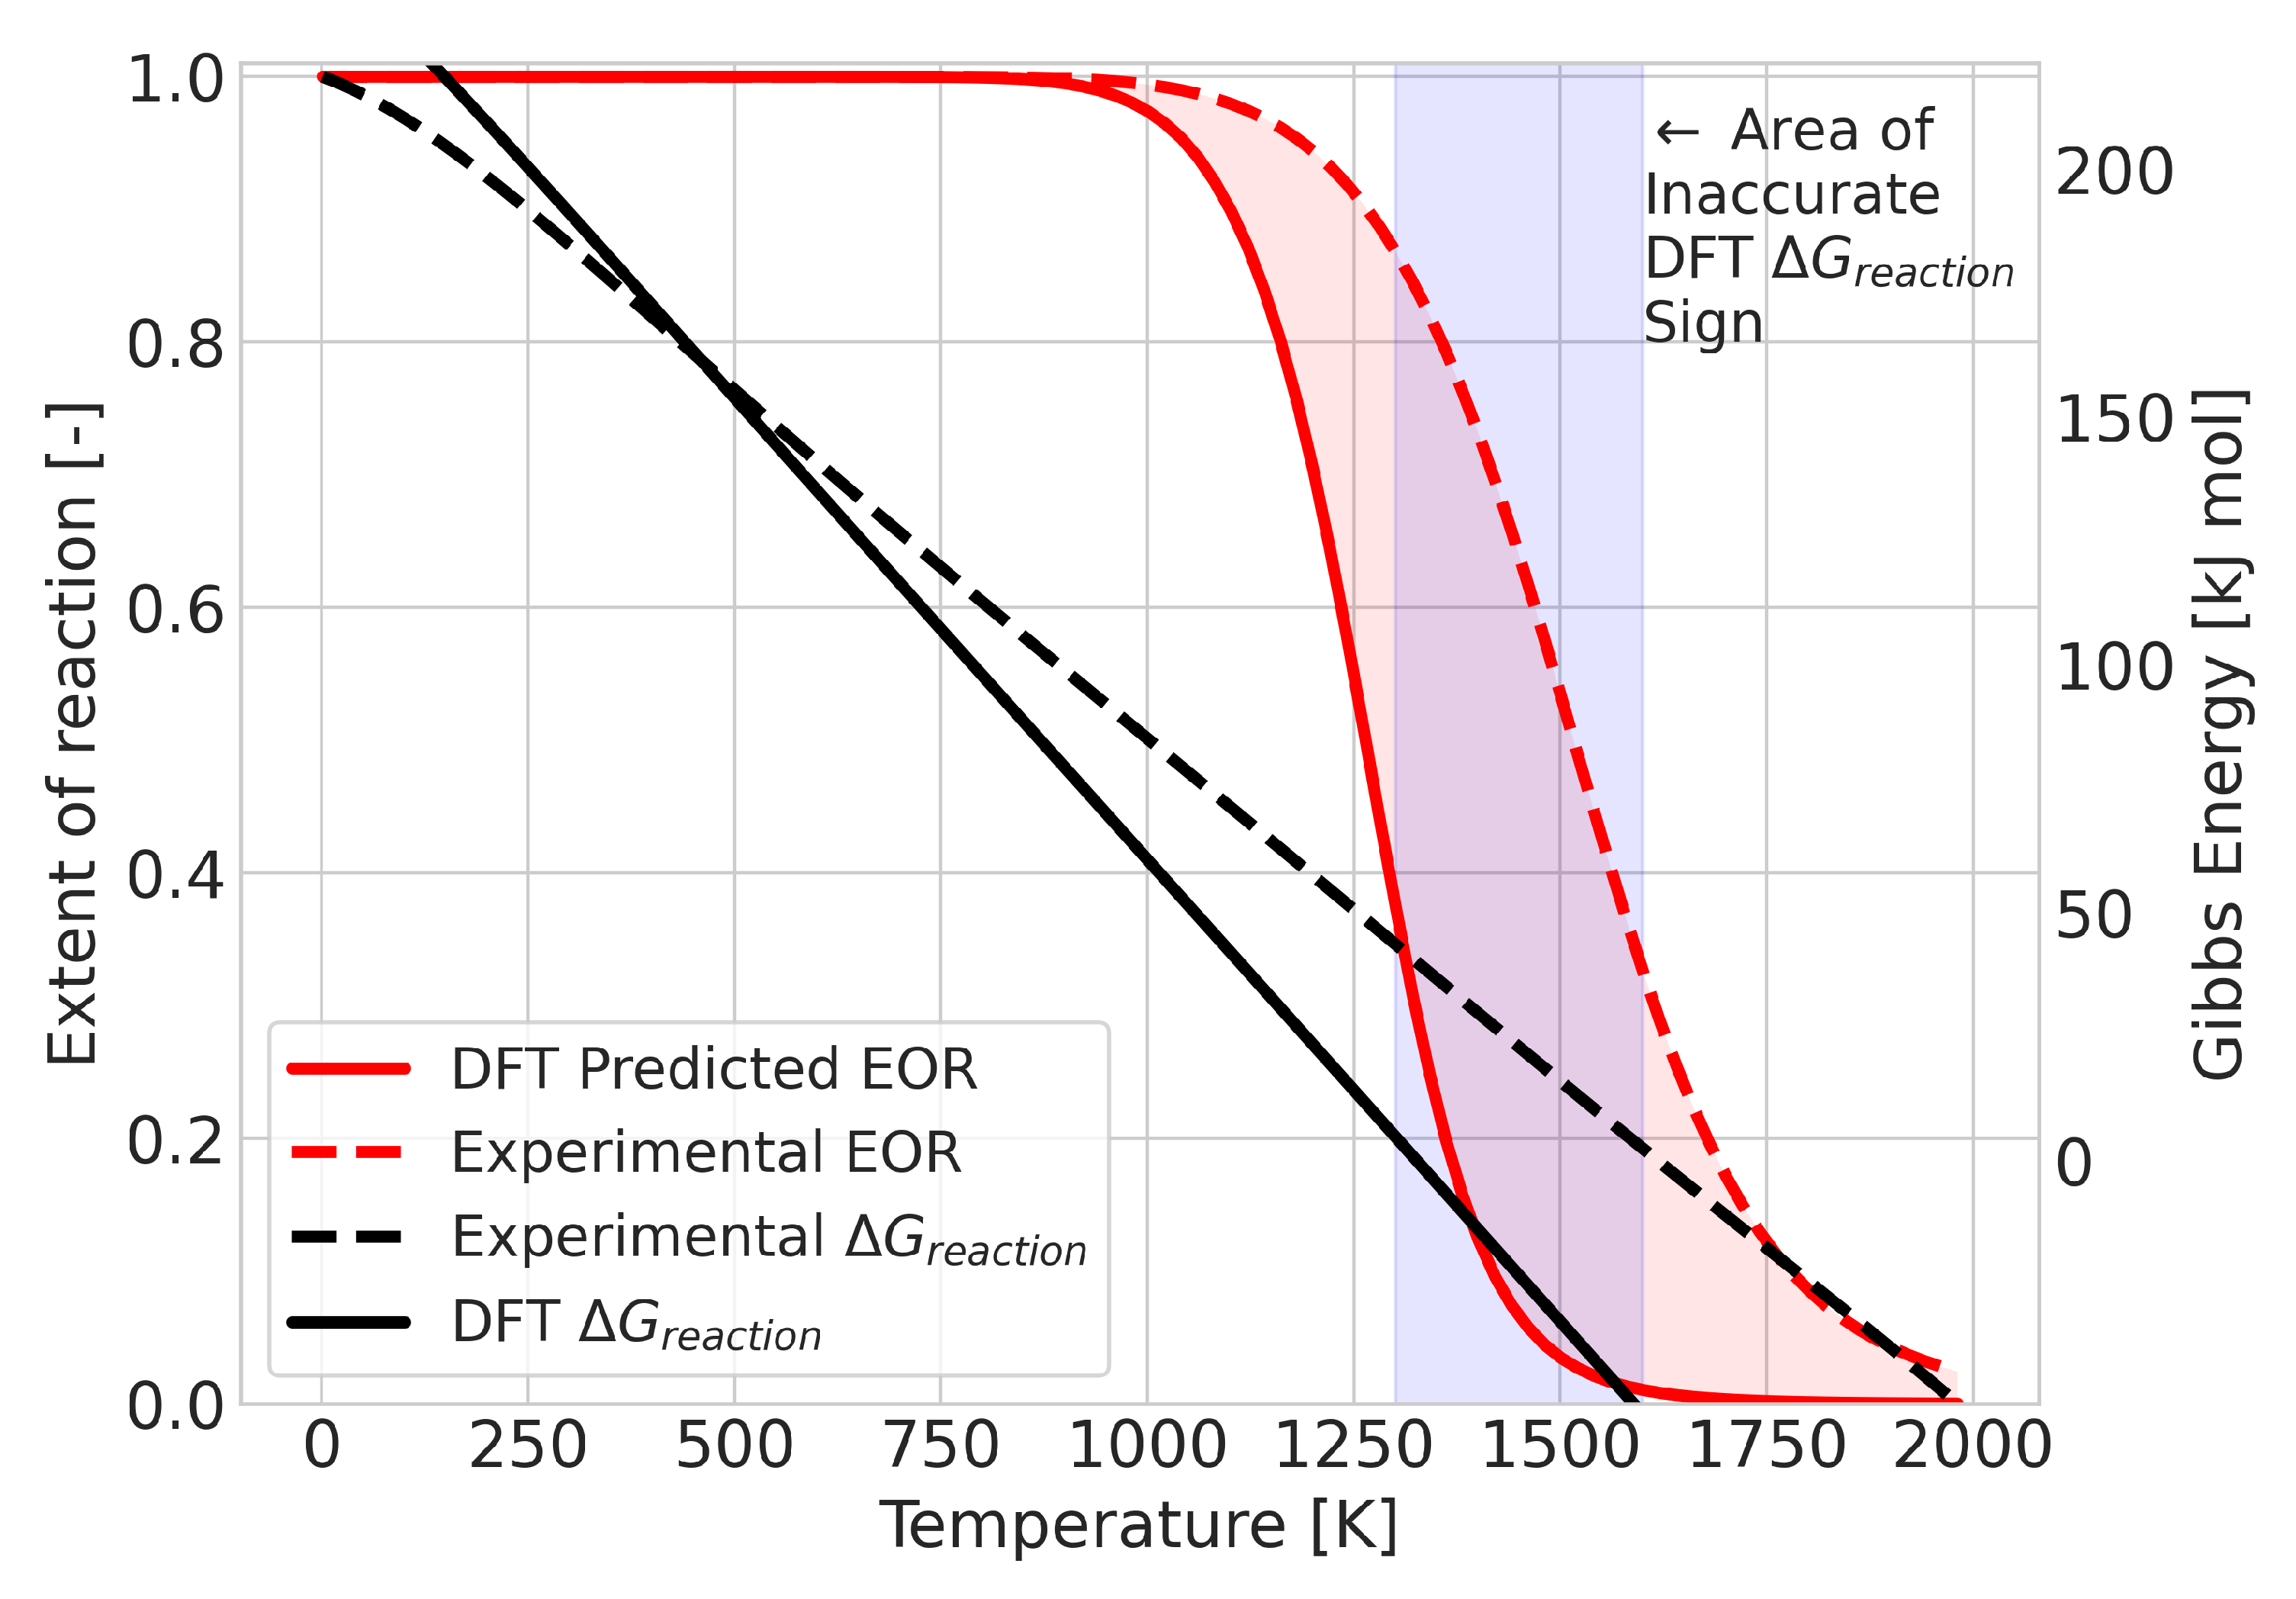
2.2. Errors for Temperature-Dependent Equilibrium Compositions

Next, we considered the reactions that showed a change of sign in the experimental Δ G within the 0–2000 K interval. This set made up 18% of all reactions. An analysis of the sign of Δ G , was performed for these reactions as well (see Table 4 and Table 5). Again, we classified a reaction as being predicted correctly if the sign of Δ G was correctly predicted by the DFT results at the upper and lower temperature limits of the interval. In all cases, a significantly lower percentage of reactions was predicted correctly as compared to the fixed composition reactions. We observed an improvement of up to 18% if we only considered the low-temperature case in the analysis (see Table 3). Once again, the errors at 1500 K were attributed mainly to the harmonic approximation.
As previously mentioned, an erroneous sign of Δ G alone does not provide a full quantitative picture of the accuracy of the DFT predictions for reactions with changing compositions. The results for the integrated extent of reaction errors are displayed in Figure 1. It is important to note that PBE0 had the lowest integrated error on average; however, specific molecules may display better performance levels with different functionals. High absolute values indicate a high degree of prediction inaccuracy. The sign reflects changes at lower (negative) or higher (positive) temperatures as compared to the experimental cases. Interestingly, all combinations of functionals and basis sets had mean values close to 0 K, meaning that the errors had little to no preference for over- or underestimating the transition temperature. Additionally, the exchange–correlation functionals had similar behaviors in terms of spread. This is in agreement with thermodynamic values reported for some solids [47]. The standard deviations of the integrated errors for all functionals were within the range of 355 to 488 K.
In most reactions, we found that prediction errors mostly consisted of the extent of reaction change taking place at a different temperature to the experimental one. We observed that cases with a high degree of error may be qualitatively correct, i.e., with the extent of reaction evolving in the proper direction with temperature, although the inflection point, corresponding to the change in sign of Δ G , occurs at a very different temperature to the experimental one. In such cases, if the predicted extent of reaction were to be shifted by the integrated error but in the opposite direction, predictions would become far more accurate. Whilst this was the most common behavior, some reactions displayed an incorrect extent of reaction, even at low temperatures. The deviation improved as the temperature increased (see Figure 2). In these cases, DFT predicted a fixed composition over the temperature range, although a change in composition took place experimentally. Separating the cases in which this happens is a rather difficult task, as the average enthalpy (which for the case of temperature-independent equilibrium compositions was very different, and distinguishing accurate and inaccurate predictions no longer allows such distinctions) lies very close to the value needed to properly describe the reactions.

2.3. Error Analysis

Understanding the origin of the errors is crucial if improvements are to be attempted. In order to obtain insight into the origin of the error, we selected the case of the PBE0 functional with the QZVPP basis set and studied the error sources in more detail. We found that 2 main sources of error can be isolated, namely
  • Errors made on Δ H , whose dominant contribution comes from the DFT ground state energy.
  • Errors in the transition temperature for the Gibbs free energy, which mostly come from harmonic approximation inaccuracies.
Replacing one term at a time with experimental values allows the contribution of each term’s error to the integrated error to be determined. The results for this analysis are displayed in Figure 3. Interestingly, we observed similar improvements in the interquartile range of the data in both corrections, suggesting that the two sources of errors identified are of the same importance. Another observation is that most outliers in the DFT calculations dropped down to the behavior of the remaining points when the ground state Gibbs free energy was taken from experimental values.

3. Methods

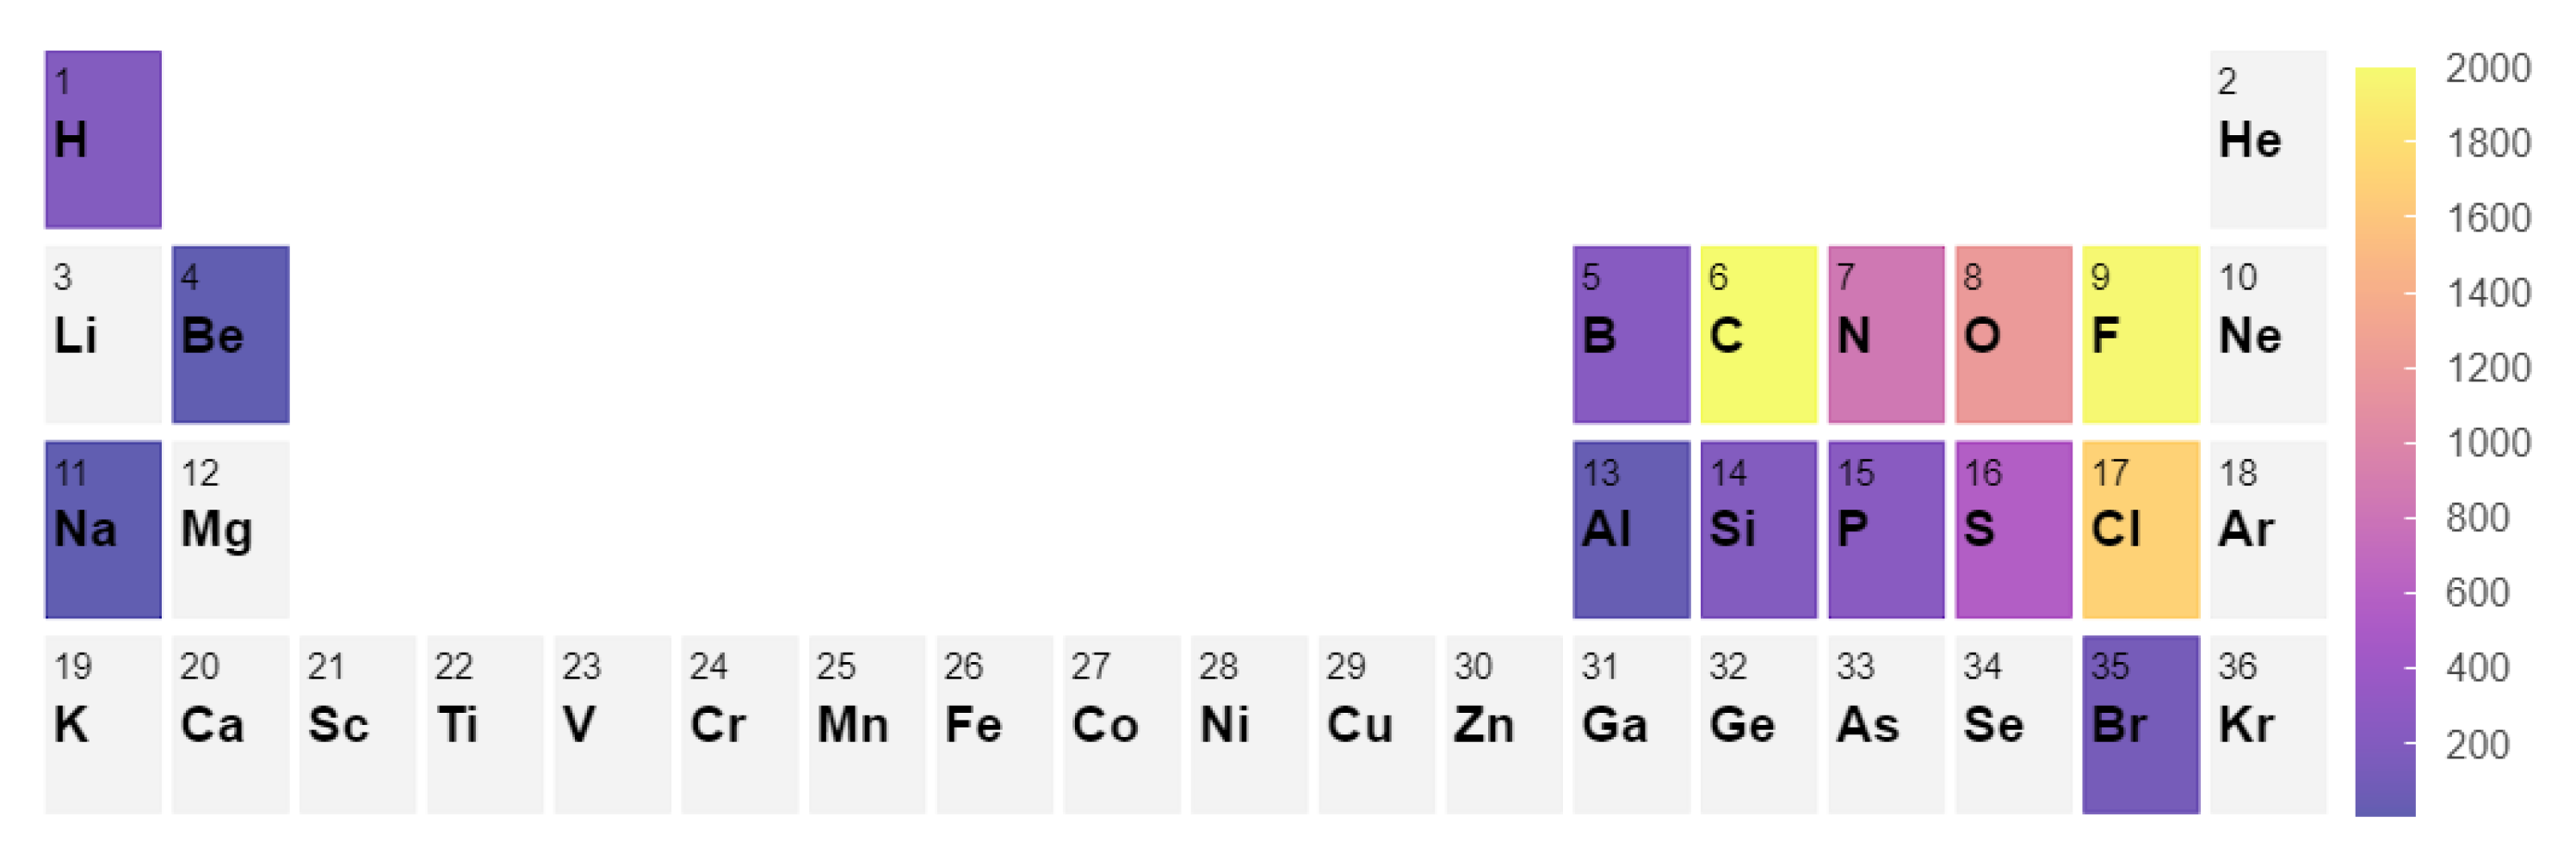
3.1. Molecule Set Collection and Reaction Generation

To build a systematic benchmark, we used the following approach. First, we conducted a search of all gas phase molecules in the Computational Chemistry Comparison and Benchmark DataBase (CCCBD) [46] containing less than 9 atoms in total and excluded all radicals and ions as well as all carbon-based cyclic compounds. In this work, we limited ourselves to small molecules; however, the inclusion of larger molecules can be done. It is known that larger molecules (>10 atoms) typically have larger errors in enthalpy [42,43], which can very significantly alter the equilibrium composition. Second, we gathered the corresponding Gibbs free energies from the NIST Chemistry WebBook [3] and discarded all molecules for which no experimental Gibbs Energy values between 300 and 1500 K were available. This selection resulted in a set of 117 molecules. From this set, we constructed a list of stoichiometrically balanced reactions containing up to four different chemical species. The reaction set contains 2648 reactions, and the distribution of the elemental composition of the reactions is shown in Figure 4. The full list of results and reactions can be found in the supplementary information.

3.2. Molecular Gibbs Free Energy Calculation

We constructed the atomic coordinates for every molecule in our reference set and carried out geometry optimization using Density Functional Theory (DFT) with a number of functionals and basis sets for all molecules. All DFT calculations were carried out using the Turbomole [49] package with the Exchange Correlation functionals PWLDA [50], B3-LYP [51,52], PBE [53], PBE0 [54], M06 [55], and TPSS [56], with the basis sets SVP, TZVP, and QZVPP from the def2 basis set library in Turbomole [57,58,59,60]. Whilst many Exchange Correlation (XC) functionals are available for this purpose [36,61,62], we focused on a small range of functionals without dispersion-correction (since we focused on small molecules) that spanned a reasonable part of the spectrum of computationally cheap DFT methods. We used an energy change convergence criterion of 1 × 10 6 Ha for self-consistent field convergence, an m5 grid size for the exchange–correlation integration [63], and a 1 × 10 5 Ha convergence for the convergence of the ground state. We converged the SCF calculations as well as the geometry optimization with a convergence criterion of 1 × 10 6 Ha. The geometry optimization scheme was used with a maximum of 0.3 Å coordinate changes per iteration. Further tightening of these criteria showed no effect on the equilibrium compositions in the sampled reactions. We stress that computationally cheap is of the essence, since chemical systems of reactions can quickly grow into many species whose properties need to be considered.
In the next step, we calculated the vibrational frequencies of all molecules in the harmonic approximation. From these, we obtained the vibrational partition function q v . The rotational and translational partition functions, q r and q t , were obtained in the ideal gas approximation [14,15]. Finally, the electronic contribution q e originating from the spin multiplicity was included. In full detail, the molecular Gibbs free energy G molecular is given by
G molecular = E 0 + E ZPE + R T ln ( Q ) + P V ideal T S
where E 0 is the electronic ground state energy of the molecule, E ZPE is the vibrational zero point energy of the molecule, P is the reference pressure (1 bar), V i d e a l is the ideal volume of a single molecule, T is the temperature, and Q is the full molecular partition function:
Q = q v q r q t q e
The vibrational contribution q v is given by
q v = j e h ω j 2 k B T 1 e h ω j k B T
where k B is the Boltzmann constant, and ω j are the wave number of mode j calculated from the harmonic approximation. The translational part becomes
q t = V 2 π m k B T h 2 3 / 2
with m being the mass of the molecule, h being the Plank constant, and V being the molecular volume, which can be expressed as follows under the ideal gas approximation:
q t = k B T P 2 π m k B T h 2 3 / 2
where P is the reference pressure of the system (chosen as 1 atmosphere). The rotational part becomes
q r π σ ( k B T ) 3 Θ A Θ B Θ C
where Θ A , Θ B , and Θ C are rotational constants given by the following formula:
Θ i = h 2 8 π 2 I i k
where I i is the moment of inertia in coordinate i Finally, the electronic part is given by
q e = j g j e ϵ j k B T
where g j is the degeneracy of the electronic mode j and ω j is the energy of mode j calculated from DFT.
From the complete molecular partition function Q, we calculated the molecular Gibbs free energy G molecular according to Equation (1) at equidistant temperature points in the range of 0 K–2000 K and fit a 6th order polynomial. Storage of the polynomial coefficient allowed us to readily calculate Gibbs free energies for any temperature within that range. In all cases, the fitting error was recorded and had a Root Mean Square Error (RMSE) value of 0.048 kJ mol 1 , and the highest deviation computed was 0.28 kJ mol 1 .

3.3. Calculation of the Equilibrium Composition

The equilibrium composition for any given reaction system is reached when the Gibbs free energy reaches a minimum. In order to obtain it, we used the Sequential Least-Squares Quadratic Programming (SLSQP) [64] algorithm to evolve the composition at a fixed pressure and temperature from a stoichiometric amount of reactants until a convergence criterion was reached ( 1 × 10 10 % of the Gibbs energy of the initial composition). We then repeated this calculation in equidistant steps spanning 300–1500 K at 1 atmosphere with entropy mixing conducted using ideal mixing laws for gases, as shown in Equations (9) and (10)).
Δ G mix = T Δ S mix
with
Δ S mix = N R i x i l n ( x i )
where i is the index for all species in the reaction system, x i is the molar fraction of the component, N is the total amount of moles in the reaction system, and R is the gas constant. Minimization was performed under particle number conservation conditions.

3.4. Error Calculation

Finally, we needed a clear way to quantify the accuracy of the equilibrium composition prediction. Among the studied reactions we observed two distinct patterns, reactions with one fixed composition over the entire temperature range and those that included a transition. Due to mixing entropy, this distinction is not completely black and white; a partial transition can also occur. To make the distinction strict, we considered the sign of the Gibbs free energy of the reaction at 0 and 2000 K. If it was the same, we classified the reaction as a fixed composition type and if it changed, we classified it as a changing type. For the first class, the DFT-based prediction was considered either correct or incorrect. For the second class, we needed a method to quantify the error. In total, we obtained 580 reactions that included a change in the considered temperature interval.
A change in equilibrium means that the Gibbs free energy of the reaction changes signs at some point in the temperature range. The error in the calculated value of this temperature could be taken as a quantitative measure of the quality of the prediction. An example of a reaction in which this occurs is the BCl + BCl 3 → B 2 Cl 4 reaction, as shown in Figure 5. For this system, the DFT results predicted the transition temperature at 1300 K, whereas the experimental data placed it at 1600 K. Despite the 300 K difference in temperature, the qualitative comparison does not seem too different. To provide an alternative measure, we also considered the integrated difference in the extent of reaction (see Figure 6). This analysis was performed for all 580 reactions that showed a composition change.

4. Conclusions

In this work, we showed that thermodynamic data obtained from DFT calculations can be used to correctly predict equilibrium compositions from temperatures ranging from 300 to 1500 K in a broad variety of chemical reactions. Predictions for which no change in equilibrium composition is present are particularly accurate, whilst predictions that involve an equilibrium composition change are more difficult to capture but still provide a qualitative picture. This trend can still hold true for complex reaction systems (i.e., systems with multiple extents of reactions) since the qualitative nature of the predictions is likely to hold as long as Δ H 0 K , reaction is above the threshold of 50–150 kJ mol 1 . Whether these trends still hold for molecules beyond 9 atoms requires further study.
In the set of reactions with a fixed equilibrium composition, the functionals TPSS and PBE0 at the QZVPP basis set performed the best, achieving correct predictions in almost all cases (92%), with a significant portion of the incorrect results occurring at high temperatures at which deviations from the harmonic approximation are known to dominate. Importantly, we observed that the difference in accuracy between the TZVP and QZVPP results was very small. The significant additional computational burden of the quadruple zeta basis set is, hence, hardly justifiable. Similarly, we observed a significant difference between the results obtained with the LDA functional and all others, but no real improvement was made beyond this. The incorrect reactions were all found to have a Gibbs free energy of around 50 kJ mol 1 , i.e., 6 times lower than the average Δ G , which could be a useful threshold to consider when carrying out similar calculations.
In the set of reactions with temperature-dependent compositions, the initial error calculations showed that the sign of Δ G for this system can be wrong at the limits of the selected temperature ranges in 35–40% of all cases. In up to half of the reactions for which an incorrect sign was predicted, Δ G was incorrect at high temperatures. Despite this, qualitative information may still be extracted. Further analysis by measuring the integrated extent of reaction error showed that the composition error consists of a shift in the reaction of the extent with an RMSE of 200–300 K. These deviations were found to arise from a combination of errors in the ground state energy of the species in the reaction as well as errors in vibrational frequencies. It was shown that whilst both corrections are significant, both must be corrected in order to significantly improve the results.

Supplementary Materials

The following supporting information can be downloaded at: https://www.mdpi.com/article/10.3390/molecules28093649/s1, the full list of results and reactions.

Author Contributions

Conceptualization and methodology, E.A.M., M.J.v.S. and G.P.; software, E.A.M., M.J.v.S. and G.P.; formal analysis, E.A.M., M.J.v.S. and G.P.; investigation, E.A.M.; resources, M.J.v.S. and G.P.; data curation, E.A.M. and M.J.v.S.; writing—original draft preparation, E.A.M.; writing—review and editing, M.J.v.S.; visualization, E.A.M. and M.J.v.S.; supervision, M.J.v.S., G.P. and S.D.G.; project administration, S.D.G. and G.P. All authors have read and agreed to the published version of the manuscript.

Funding

This research received no external funding.

Data Availability Statement

All the data produced for this work can be found in the supplementary information.

Conflicts of Interest

The authors declare no conflict of interest.

Abbreviations

The following abbreviations are used in this manuscript:
MDPIMultidisciplinary Digital Publishing Institute
DOAJDirectory of open access journals
CVDChemical Vapor Deposition
DFTDensity Functional Theory
EoRExtent of Reaction
ASALDArea Selective Atomic Layer Deposition
ALDAtomic Layer Deposition

References

  1. Jocz, J.N.; Medford, A.J.; Sievers, C. Thermodynamic Limitations of the Catalyst Design Space for Methanol Production from Methane. ChemCatChem 2019, 11, 593–600. [Google Scholar] [CrossRef]
  2. Sun, Z.; Ma, Y.; Ponge, D.; Zaefferer, S.; Jägle, E.A.; Gault, B.; Rollett, A.D.; Raabe, D. Thermodynamics-guided alloy and process design for additive manufacturing. Nat. Commun. 2022, 13, 4361. [Google Scholar] [CrossRef] [PubMed]
  3. Chase, M.W. NIST-JANAF Thermochemical Tables; American Institute of Physics: College Park, MD, USA, 1998. [Google Scholar]
  4. Mackus, A.J.; Merkx, M.J.; Kessels, W.M. From the Bottom-Up: Toward Area-Selective Atomic Layer Deposition with High Selectivity. Chem. Mater. 2019, 31, 2–12. [Google Scholar] [CrossRef]
  5. Grillo, F.; Soethoudt, J.; Marques, E.A.; de Martín, L.; van Dongen, K.; van Ommen, J.R.; Delabie, A. Area-selective deposition of ruthenium by area-dependent surface diffusion. Chem. Mater. 2020, 32, 9560–9572. [Google Scholar] [CrossRef]
  6. Shareef, I.A.; Rubloff, G.W.; Anderle, M.; Gill, W.N.; Cotte, J.; Kim, D.H. Subatmospheric chemical vapor deposition ozone/TEOS process for SiO2 trench filling. J. Vac. Sci. Technol. B Microelectron. Nanometer Struct. 1995, 13, 1888–1892. [Google Scholar] [CrossRef]
  7. Mehta, A.N.; Zhang, H.; Dabral, A.; Richard, O.; Favia, P.; Bender, H.; Delabie, A.; Caymax, M.; Houssa, M.; Pourtois, G.; et al. Structural characterization of SnS crystals formed by chemical vapour deposition. J. Microsc. 2017, 268, 276–287. [Google Scholar] [CrossRef]
  8. Powell, C.F.; Oxley, J.H.; Blocher, J.M.; Klerer, J. Vapor Deposition. J. Electrochem. Soc. 1966, 113, 266C. [Google Scholar] [CrossRef]
  9. Hohenberg, P.; Kohn, W. Inhomogeneous Electron Gas. Phys. Rev. 1964, 136, B864–B871. [Google Scholar] [CrossRef]
  10. Kohn, W.; Sham, L.J. Self-Consistent Equations Including Exchange and Correlation Effects. Phys. Rev. 1965, 140, A1133–A1138. [Google Scholar] [CrossRef]
  11. Fleszar, A.; Gonze, X. First-principles thermodynamical properties of semiconductors. Phys. Rev. Lett. 1990, 64, 2961. [Google Scholar] [CrossRef]
  12. Palafox, M.A. DFT computations on vibrational spectra: Scaling procedures to improve the wavenumbers. Phys. Sci. Rev. 2018, 3, 20170184. [Google Scholar] [CrossRef]
  13. Fromsejer, R.; Maribo-Mogensen, B.; Kontogeorgis, G.M.; Liang, X. Evaluating the harmonic approximation for the prediction of thermodynamic formation properties of solids. Comput. Mater. Sci. 2023, 223, 112152. [Google Scholar] [CrossRef]
  14. McQuarrie, D. Statistical Mechanics; University Science Books: Sausalito, CA, USA, 2000. [Google Scholar]
  15. Sandler, S. An Introduction to Applied Statistical Thermodynamics; Wiley: Hoboken, NJ, USA, 2010. [Google Scholar]
  16. Becke, A.D. Perspective: Fifty years of density-functional theory in chemical physics. J. Chem. Phys. 2014, 140, 18A301. [Google Scholar] [CrossRef]
  17. Mardirossian, N.; Head-Gordon, M. Thirty years of density functional theory in computational chemistry: An overview and extensive assessment of 200 density functionals. Mol. Phys. 2017, 115, 2315–2372. [Google Scholar] [CrossRef]
  18. Lejaeghere, K.; Bihlmayer, G.; Björkman, T.; Blaha, P.; Blügel, S.; Blum, V.; Caliste, D.; Castelli, I.E.; Clark, S.J.; Corso, A.D.; et al. Reproducibility in density functional theory calculations of solids. Science 2016, 351, 1394. [Google Scholar] [CrossRef] [PubMed]
  19. Van Setten, M.J.; Caruso, F.; Sharifzadeh, S.; Ren, X.; Scheffler, M.; Liu, F.; Lischner, J.; Lin, L.; Deslippe, J.R.; Louie, S.G.; et al. GW100: Benchmarking G0W0 for Molecular Systems. J. Chem. Theory Comput. 2015, 11, 5665–5687. [Google Scholar] [CrossRef]
  20. Dilena, G.; Pistillo, S.; Bodo, E. About the Formation of NH2OH + from Gas Phase Reactions under Astrochemical Conditions. Molecules 2023, 28, 2932. [Google Scholar] [CrossRef] [PubMed]
  21. Antol, I.; Glasovac, Z.; Margetić, D. Mechanistic DFT Study of 1,3-Dipolar Cycloadditions of Azides with Guanidine. Molecules 2023, 28, 2342. [Google Scholar] [CrossRef]
  22. Al-Hazmy, S.M.; Zouaghi, M.O.; Amri, N.; Arfaoui, Y.; Alhagri, I.A.; Hamdi, N. DFT Study of Regio- and Stereoselective 13DC Reaction between Diazopropane and Substituted Chalcone Derivatives: Molecular Docking of Novel Pyrazole Derivatives as Anti-Alzheimer’s Agents. Molecules 2023, 28, 1899. [Google Scholar] [CrossRef]
  23. Laref, S.; Wang, B.; Gao, X.; Gojobori, T. Computational Studies of Auto-Active van der Waals Interaction Molecules on Ultra-Thin Black-Phosphorus Film. Molecules 2023, 28, 681. [Google Scholar] [CrossRef]
  24. Widjaja, H.; Miran, H.A.; Altarawneh, M.; Oluwoye, I.; Lim, H.N.; Huang, N.M.; Jiang, Z.T.; Dlugogorski, B.Z. DFT + U and ab initio atomistic thermodynamics approache for mixed transitional metallic oxides: A case study of CoCu2O3 surface terminations. Mater. Chem. Phys. 2017, 201, 241–250. [Google Scholar] [CrossRef]
  25. Herrera, M.; Serra, R.M.; D’Amico, I. DFT-inspired methods for quantum thermodynamics. Sci. Rep. 2017, 7, 4655. [Google Scholar] [CrossRef] [PubMed]
  26. Dianat, A.; Seriani, N.; Bobeth, M.; Pompe, W.; Ciacchi, L.C. DFT study of the thermodynamic stability of Pd-Pt bulk oxide phases. J. Phys. Chem. C 2008, 112, 13623–13628. [Google Scholar] [CrossRef]
  27. Cervantes, J.M.; Pilo, J.; Rosas-Huerta, J.L.; Antonio, J.E.; Muñoz, H.; Oviedo-Roa, R.; Carvajal, E. DFT Electronic Properties and Synthesis Thermodynamics of LixLa1-xTiO3 Electrolytes for Li-Ion Batteries. J. Electrochem. Soc. 2021, 168, 080516. [Google Scholar] [CrossRef]
  28. Wei, M.; Marrakchi, F.; Yuan, C.; Cheng, X.; Jiang, D.; Zafar, F.F.; Fu, Y.; Wang, S. Adsorption modeling, thermodynamics, and DFT simulation of tetracycline onto mesoporous and high-surface-area NaOH-activated macroalgae carbon. J. Hazard. Mater. 2022, 425, 127887. [Google Scholar] [CrossRef]
  29. Bai, Y.; Chen, B.W.; Peng, G.; Mavrikakis, M. Density functional theory study of thermodynamic and kinetic isotope effects of H2/D2 dissociative adsorption on transition metals. Catal. Sci. Technol. 2018, 8, 3321–3335. [Google Scholar] [CrossRef]
  30. van Setten, M.J.; Lohstroh, W.; Fichtner, M. A new phase in the decomposition of Mg(BH4)2: First-principles simulated annealing. J. Mater. Chem. 2009, 19, 7081–7087. [Google Scholar] [CrossRef]
  31. van Setten, M.; Fichtner, M. On the enthalpy of formation of aluminum diboride, AlB2. J. Alloys Compd. 2009, 477, L11–L12. [Google Scholar] [CrossRef]
  32. Mole, S.J.; Zhou, X.; Liu, R. Density Functional Theory (DFT) Study of Enthalpy of Formation. 1. Consistency of DFT Energies and Atom Equivalents for Converting DFT Energies into Enthalpies of Formation. J. Phys. Chem. 1996, 100, 14665–14671. [Google Scholar] [CrossRef]
  33. Huenerbein, R.; Schirmer, B.; Moellmann, J.; Grimme, S. Effects of London dispersion on the isomerization reactions of large organic molecules: A density functional benchmark study. Phys. Chem. Chem. Phys. 2010, 12, 6940–6948. [Google Scholar] [CrossRef]
  34. Minenkov, Y.; Wang, H.; Wang, Z.; Sarathy, S.M.; Cavallo, L. Heats of Formation of Medium-Sized Organic Compounds from Contemporary Electronic Structure Methods. J. Chem. Theory Comput. 2017, 13, 3537–3560. [Google Scholar] [CrossRef]
  35. Korth, M.; Grimme, S. Mindless DFT benchmarking. J. Chem. Theory Comput. 2009, 5, 993–1003. [Google Scholar] [CrossRef]
  36. Goerigk, L.; Grimme, S. A thorough benchmark of density functional methods for general main group thermochemistry, kinetics, and noncovalent interactions. Phys. Chem. Chem. Phys. 2011, 13, 6670–6688. [Google Scholar] [CrossRef] [PubMed]
  37. Li, H.; Tang, Z.X.; Zhang, X.Z.; Li, X.H. DFT Study of the C-Cl Bond Dissociation Enthalpies and Electronic Structure of Substituted Chlorobenzene Compounds. J. Struct. Chem. 2009, 50, 34–40. [Google Scholar] [CrossRef]
  38. Wheeler, S.E.; Moran, A.; Pieniazek, S.N.; Houk, K.N. Accurate reaction enthalpies and sources of error in DFT Thermochemistry for aldol, mannich, and a-aminoxylation reactions. J. Phys. Chem. A 2009, 113, 10376–10384. [Google Scholar] [CrossRef]
  39. Ghahremanpour, M.M.; Van Maaren, P.J.; Ditz, J.C.; Lindh, R.; Van Der Spoel, D. Large-scale calculations of gas phase thermochemistry: Enthalpy of formation, standard entropy, and heat capacity. J. Chem. Phys. 2016, 145, 114305. [Google Scholar] [CrossRef]
  40. Sirirak, J.; Lawan, N.; der Kamp, M.W.V.; Harvey, J.N.; Mulholland, A.J. Benchmarking quantum mechanical methods for calculating reaction energies of reactions catalyzed by enzymes. PeerJ Phys. Chem. 2020, 2, e8. [Google Scholar] [CrossRef]
  41. Kumar, A.; Arantes, P.R.; Saha, A.; Palermo, G.; Wong, B.M. GPU-Enhanced DFTB Metadynamics for Efficiently Predicting Free Energies of Biochemical Systems. Molecules 2023, 28, 1277. [Google Scholar] [CrossRef] [PubMed]
  42. Letterman, R.G.; DeYonker, N.J.; Burkey, T.J.; Webster, C.E. Calibrating reaction enthalpies: Use of density functional theory and the correlation consistent composite approach in the design of photochromic materials. J. Phys. Chem. A 2016, 120, 9982–9997. [Google Scholar] [CrossRef] [PubMed]
  43. Ventura, O.N.; Kieninger, M.; Irving, K. Density Functional Theory: A Useful Tool for the Study of Free Radicals. Adv. Quantum Chem. 1997, 28, 293–309. [Google Scholar] [CrossRef]
  44. Reinhardt, A.; Cheng, B. Quantum-mechanical exploration of the phase diagram of water. Nat. Commun. 2021, 12, 588. [Google Scholar] [CrossRef] [PubMed]
  45. Cheng, B.; Hamel, S.; Bethkenhagen, M. Diamond formation from hydrocarbon mixtures in planets. Nat. Commun. 2022, 14, 1104. [Google Scholar] [CrossRef] [PubMed]
  46. Johnson, R.D., III. NIST Computational Chemistry Comparison and Benchmark Database. Available online: https://webbook.nist.gov/ (accessed on 1 July 2019).
  47. Sharma, D.; Kumar, J.; Vajpayee, A.; Kumar, R.; Ahluwalia, P.K.; Awana, V.P. Comparative experimental and density functional theory (DFT) study of the physical properties of MgB 2 and AlB 2. J. Supercond. Nov. Magn. 2011, 24, 1925–1931. [Google Scholar] [CrossRef]
  48. Rosen, A. Periodic Trend Plotter. 2018. Available online: https://github.com/arosen93/ptable_trends (accessed on 1 July 2019).
  49. Ahlrichs, R.; Bar, M.; Haser, M.; Horn, H.; Kolmel, C. Electronic structure calculations on workstation computers: The program system turbomole. Chem. Phys. Lett. 1989, 162, 165–169. [Google Scholar] [CrossRef]
  50. Perdew, J.P.; Wang, Y. Accurate and simple analytic representation of the electron-gas correlation energy. Phys. Rev. B 1992, 45, 13244–13249. [Google Scholar] [CrossRef] [PubMed]
  51. Lee, C.; Yang, W.; Parr, R.G. Development of the Colle-Salvetti correlation-energy formula into a functional of the electron density. Phys. Rev. B 1988, 37, 785–789. [Google Scholar] [CrossRef]
  52. Becke, A.D. Density-functional thermochemistry. III. The role of exact exchange. J. Chem. Phys. 1993, 98, 5648–5652. [Google Scholar] [CrossRef]
  53. Perdew, J.P.; Burke, K.; Ernzerhof, M. Generalized Gradient Approximation Made Simple. Phys. Rev. Lett. 1996, 77, 3865–3868. [Google Scholar] [CrossRef]
  54. Adamo, C.; Barone, V. Toward reliable density functional methods without adjustable parameters: The PBE0 model. J. Chem. Phys. 1999, 110, 6158–6170. [Google Scholar] [CrossRef]
  55. Zhao, Y.; Truhlar, D.G. The M06 suite of density functionals for main group thermochemistry, thermochemical kinetics, noncovalent interactions, excited states, and transition elements: Two new functionals and systematic testing of four M06-class functionals and 12 other functionals. Theor. Chem. Accounts 2008, 120, 215–241. [Google Scholar] [CrossRef]
  56. Tao, J.; Perdew, J.P.; Staroverov, V.N.; Scuseria, G.E. Climbing the Density Functional Ladder: Nonempirical Meta–Generalized Gradient Approximation Designed for Molecules and Solids. Phys. Rev. Lett. 2003, 91, 146401. [Google Scholar] [CrossRef]
  57. Weigend, F.; Ahlrichs, R. Balanced basis sets of split valence, triple zeta valence and quadruple zeta valence quality for H to Rn: Design and assessment of accuracy. Phys. Chem. Chem. Phys. 2005, 7, 3297. [Google Scholar] [CrossRef]
  58. Schäfer, A.; Horn, H.; Ahlrichs, R. Fully optimized contracted Gaussian basis sets for atoms Li to Kr. J. Chem. Phys. 1992, 97, 2571–2577. [Google Scholar] [CrossRef]
  59. Schäfer, A.; Huber, C.; Ahlrichs, R. Fully optimized contracted Gaussian basis sets of triple zeta valence quality for atoms Li to Kr. J. Chem. Phys. 1994, 100, 5829–5835. [Google Scholar] [CrossRef]
  60. Weigend, F.; Häser, M.; Patzelt, H.; Ahlrichs, R. RI-MP2: Optimized auxiliary basis sets and demonstration of efficiency. Chem. Phys. Lett. 1998, 294, 143–152. [Google Scholar] [CrossRef]
  61. Boese, A.D.; Klopper, W.; Martin, J.M.L. Anharmonic force fields and thermodynamic functions using density functional theory. Mol. Phys. 2005, 103, 863–876. [Google Scholar] [CrossRef]
  62. Liton, M.A.K.; Nuruzzaman, M.; Helen, S. Calculation of Gas-Phase Gibb’s free Energy Changes of Some Small Molecules with Monte Carlo, DFT (MPW1PW91), Composite (CBS-QB3), Gaussian-n (G1, G2) and Gaussian Modified (G2MP2) Methods. Orient. J. Chem. 2019, 35, 947–957. [Google Scholar] [CrossRef]
  63. Treutler, O.; Ahlrichs, R. Efficient molecular numerical integration schemes. J. Chem. Phys. 1995, 102, 346–354. [Google Scholar] [CrossRef]
  64. Jones, E.; Oliphant, T.; Peterson, P. SciPy: Open Source Scientific Tools for Python. 2001. Available online: https://scipy.org/ (accessed on 1 July 2019).
Figure 1. Evaluation of the integrated differences between the DFT and experimentally calculated equilibrium compositions for the different functional and basis sets used. The white, red, and blue colors depict the different exchange and correlation functionals used.
Molecules 28 03649 g001
Figure 2. Extent of reaction for the reaction 2 C 3 O 2 + 5 H 2 C 2 H 2 + 4 C H 2 O where the enthalpy of reaction has an incorrect sign (at 0 K).
Molecules 28 03649 g002
Figure 3. Integrated differences between DFT and experimentally calculated equilibrium compositions for 484 reactions. Green markers indicate the average error for each functional and basis set combination.
Molecules 28 03649 g003
Figure 4. Element count in the 2648 reaction set considered in the benchmark [48].
Molecules 28 03649 g004
Figure 5. Reaction composition for the reaction BCl + BCl 3 → B 2 Cl 4 with incorrect signs for the Gibbs energy of the reaction between 1300 and 1600 K, showing good qualitative information.
Molecules 28 03649 g005
Figure 6. Graphical representation of the integrated difference (area shaded in red) between the experimental and DFT results for the reaction BCl + BCl 3 → B 2 Cl 4 .
Molecules 28 03649 g006
Table 1. Percentage of all reactions with a constant equilibrium composition correctly described by DFT with respect to the experimental reports.
Percentage of Correctly Described Reactions (%)
Functional
Basis SetPWLDAPBEB3-LYPPBE0M06TPSS
SVP88.792.192.792.892.691.5
TZVP90.594.294.794.894.495.1
QZVPP90.794.694.895.294.594.9
Table 2. DFT minimum, maximum, and mean errors of the Gibbs free energy of all reactions with respect to experimental values and all combinations of basis sets and exchange–correlation functionals given at 1500 K and 400 K.
TemperatureError at 1500 K [Kj mol 1 ]Error at 400 K [Kj mol 1 ]
FunctionalBasis SetMaxMinMeanMaxMinMean
b3-lypQZVPP296.21−309.6760.9460.19−45.0811.07
b3-lypSVP295.18−310.759.960.05−45.2210.93
b3-lypTZVP296.26−309.6260.9860.20−45.0711.08
m06QZVPP295.07−310.8159.860.03−45.2510.91
m06SVP293.16−312.7257.8959.74−45.5310.62
m06TZVP294.96−310.9159.6960.01−45.2710.89
pbe0QZVPP295.65−310.2360.3860.12−45.1511.00
pbe0SVP294.96−310.9259.6960.05−45.2310.93
pbe0TZVP295.72−310.1660.4460.14−45.1411.02
pbeQZVPP298.07−307.8162.7960.52−44.7611.40
pbeSVP297.16−308.7261.8860.41−44.8611.29
pbeTZVP298.2−307.6862.9260.54−44.7311.42
pwldaQZVPP297.26−308.6261.9960.44−44.8411.32
pwldaSVP296.12−309.7660.8460.28−44.9911.16
pwldaTZVP297.43−308.4562.1560.47−44.8011.35
tpssQZVPP297.7−308.1862.4260.46−44.8111.34
tpssSVP296.79−309.0961.5260.35−44.9211.23
tpssTZVP297.78−308.162.560.48−44.7911.36
Table 3. Percentage of all reactions with a constant equilibrium composition correctly described by DFT in the range of 300 K–400 K.
Percentage of Correctly Described Reactions (%)
Functional
Basis SetPWLDAPBEB3-LYPPBE0M06TPSS
SVP89.193.193.594.593.693.5
TZVP91.395.395.996.795.996.1
QZVPP91.495.996.096.996.096.2
Table 4. Percentage of all reactions with the temperature-dependent equilibrium composition correctly described by DFT in the temperature range of 300 K–1500 K.
Percentage of Correctly Described Reactions (%)
Functional
Basis SetPWLDAPBEB3-LYPPBE0M06TPSS
SVP65.971.372.971.571.374.0
TZVP69.273.676.274.474.475.0
QZVPP69.473.376.474.074.074.6
Table 5. Percentage of all reactions with temperature-dependent equilibrium compositions correctly described by DFT in the temperature range of 300 K–400 K.
Percentage of Correctly Described Reactions (%)
Functional
Basis SetPWLDAPBEB3-LYPPBE0M06TPSS
SVP85.583.587.082.483.785.7
TZVP88.285.187.882.984.785.7
QZVPP88.284.787.682.984.585.3
Disclaimer/Publisher’s Note: The statements, opinions and data contained in all publications are solely those of the individual author(s) and contributor(s) and not of MDPI and/or the editor(s). MDPI and/or the editor(s) disclaim responsibility for any injury to people or property resulting from any ideas, methods, instructions or products referred to in the content.

