
Comparison of HPLC, HPTLC, and In Silico Lipophilicity Parameters Determined for 5-Heterocyclic 2-(2,4-Dihydroxyphenyl)-1,3,4-thiadiazoles

 , , ,
, , ,
Abstract
:1. Introduction
2. Results and Discussion
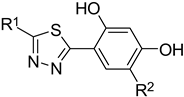
2.1. A Set of the Compounds
2.2. Chromatographic Lipophilicity Parameters
2.3. Structure–Retention Relationship
2.4. Descriptive Statistics of Lipophilicity Parameters
2.5. Correlation Analysis
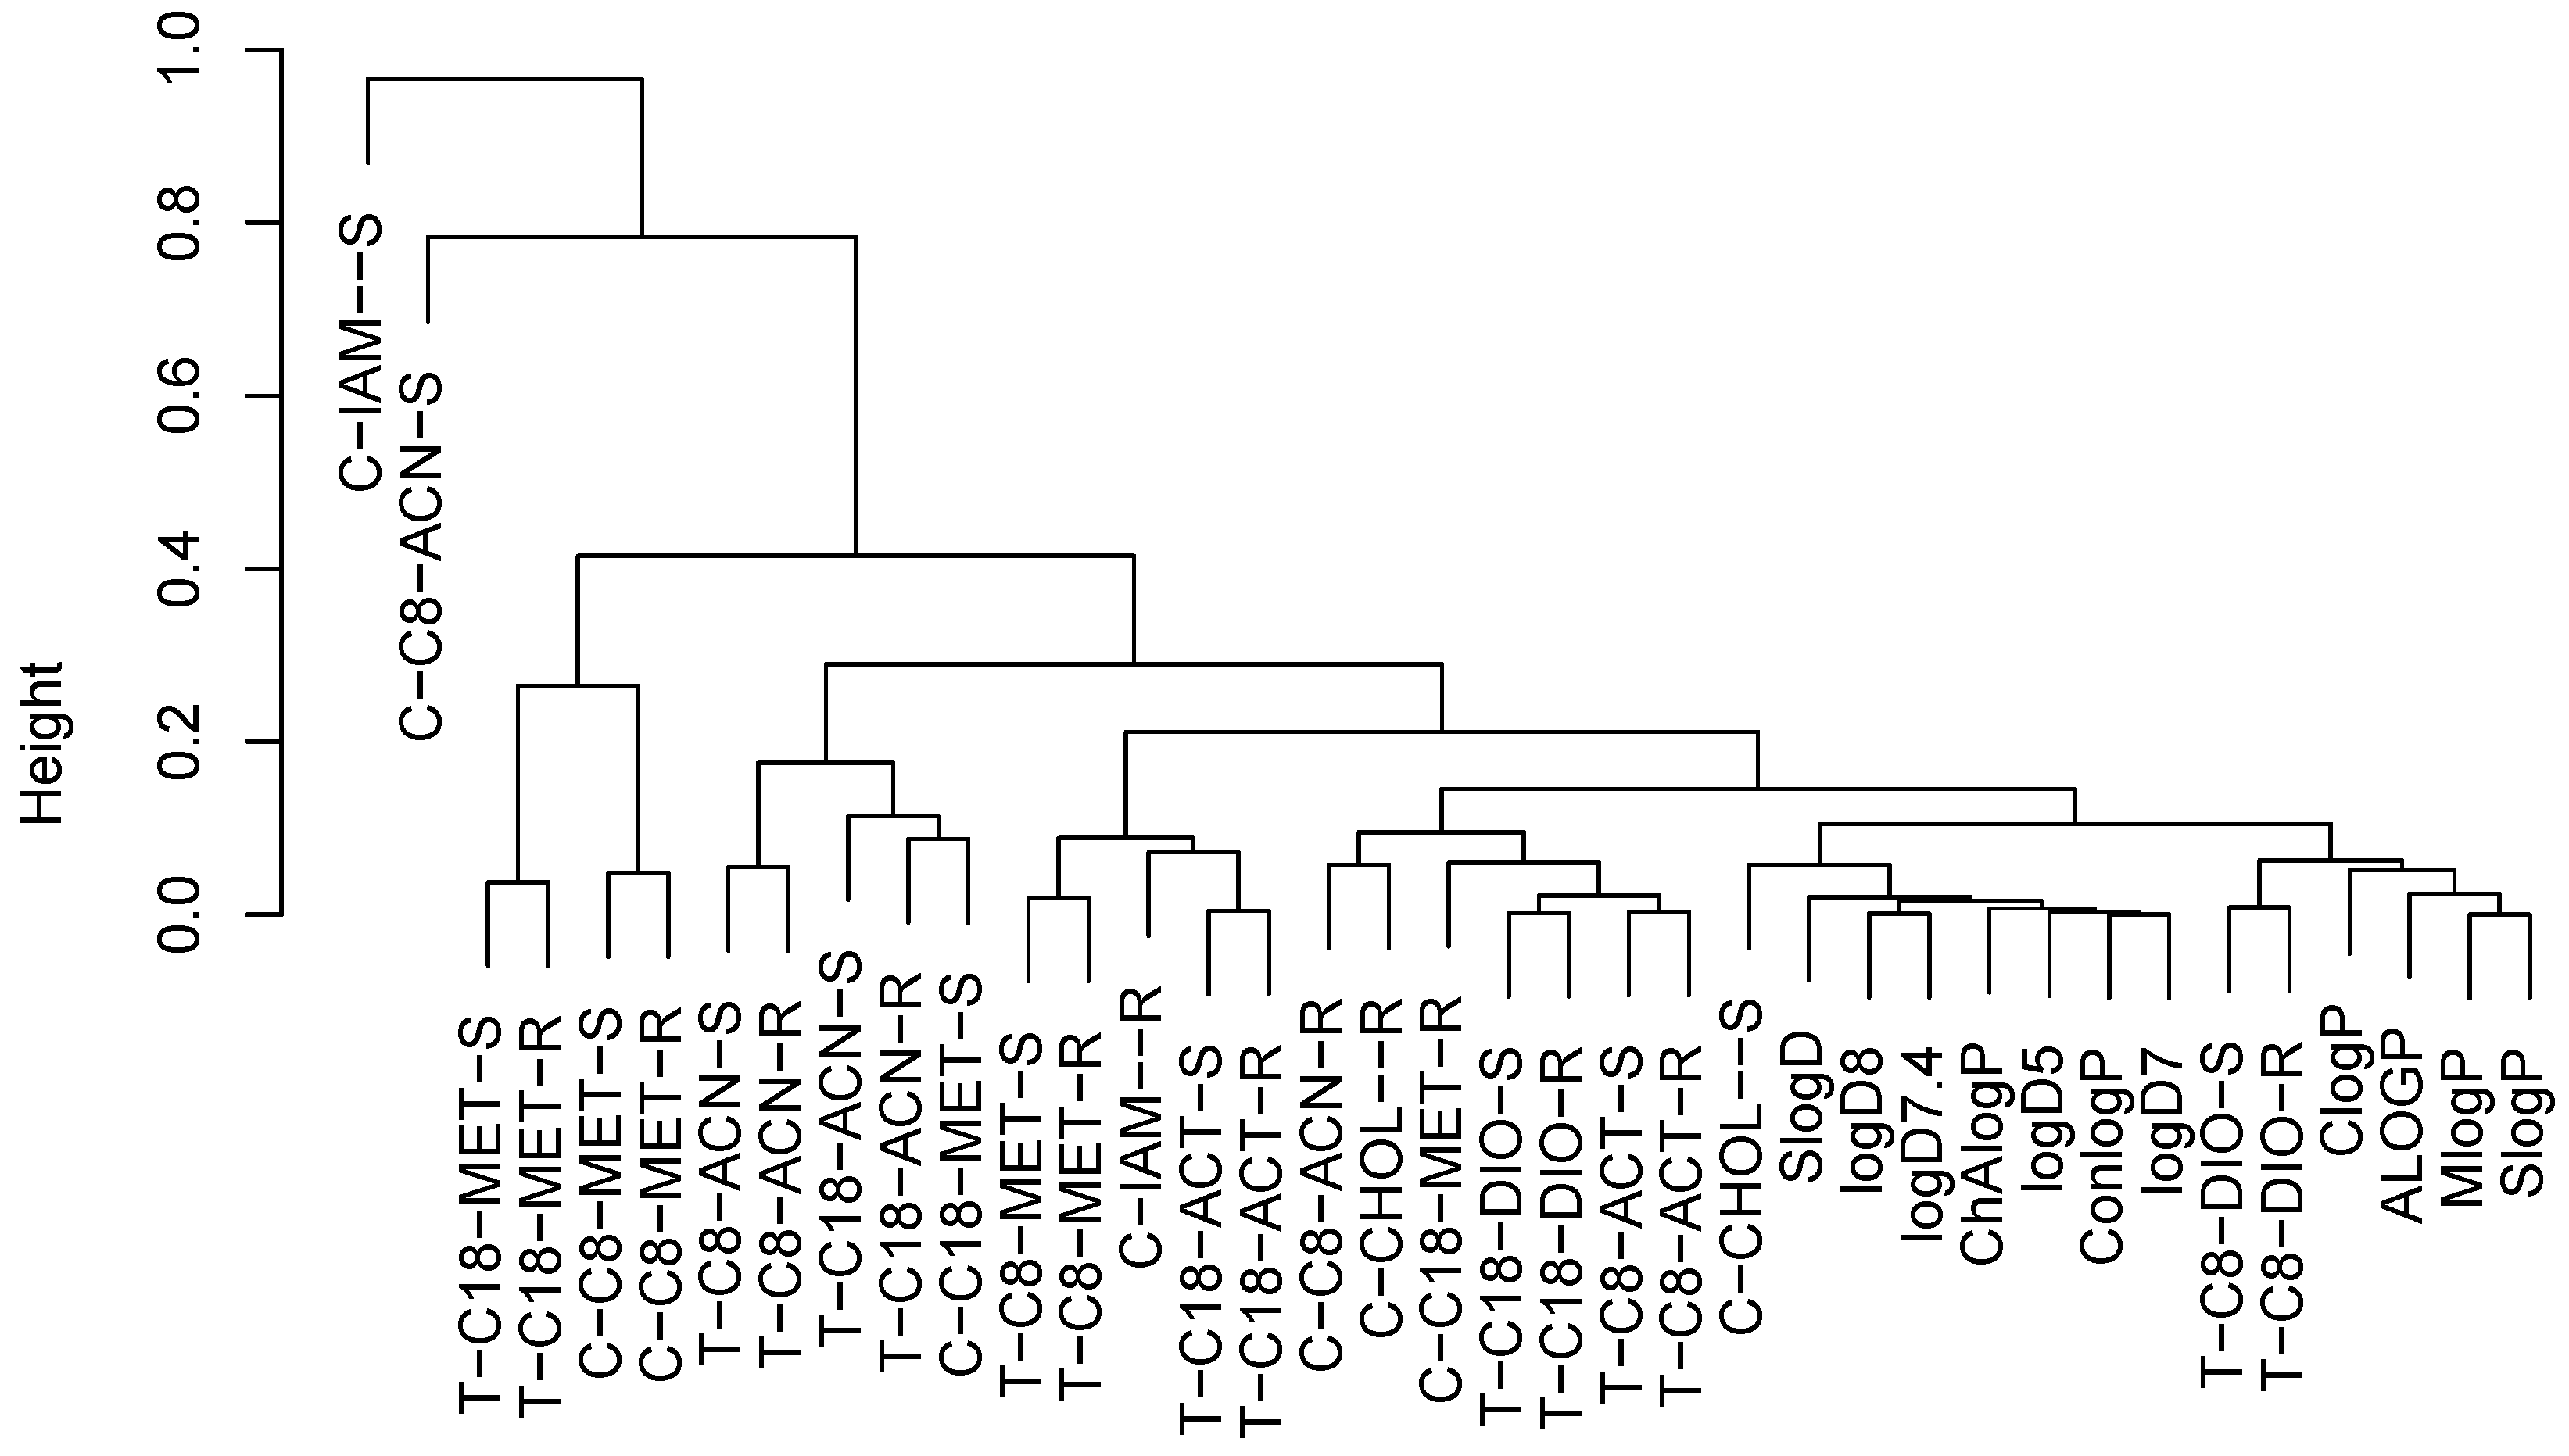
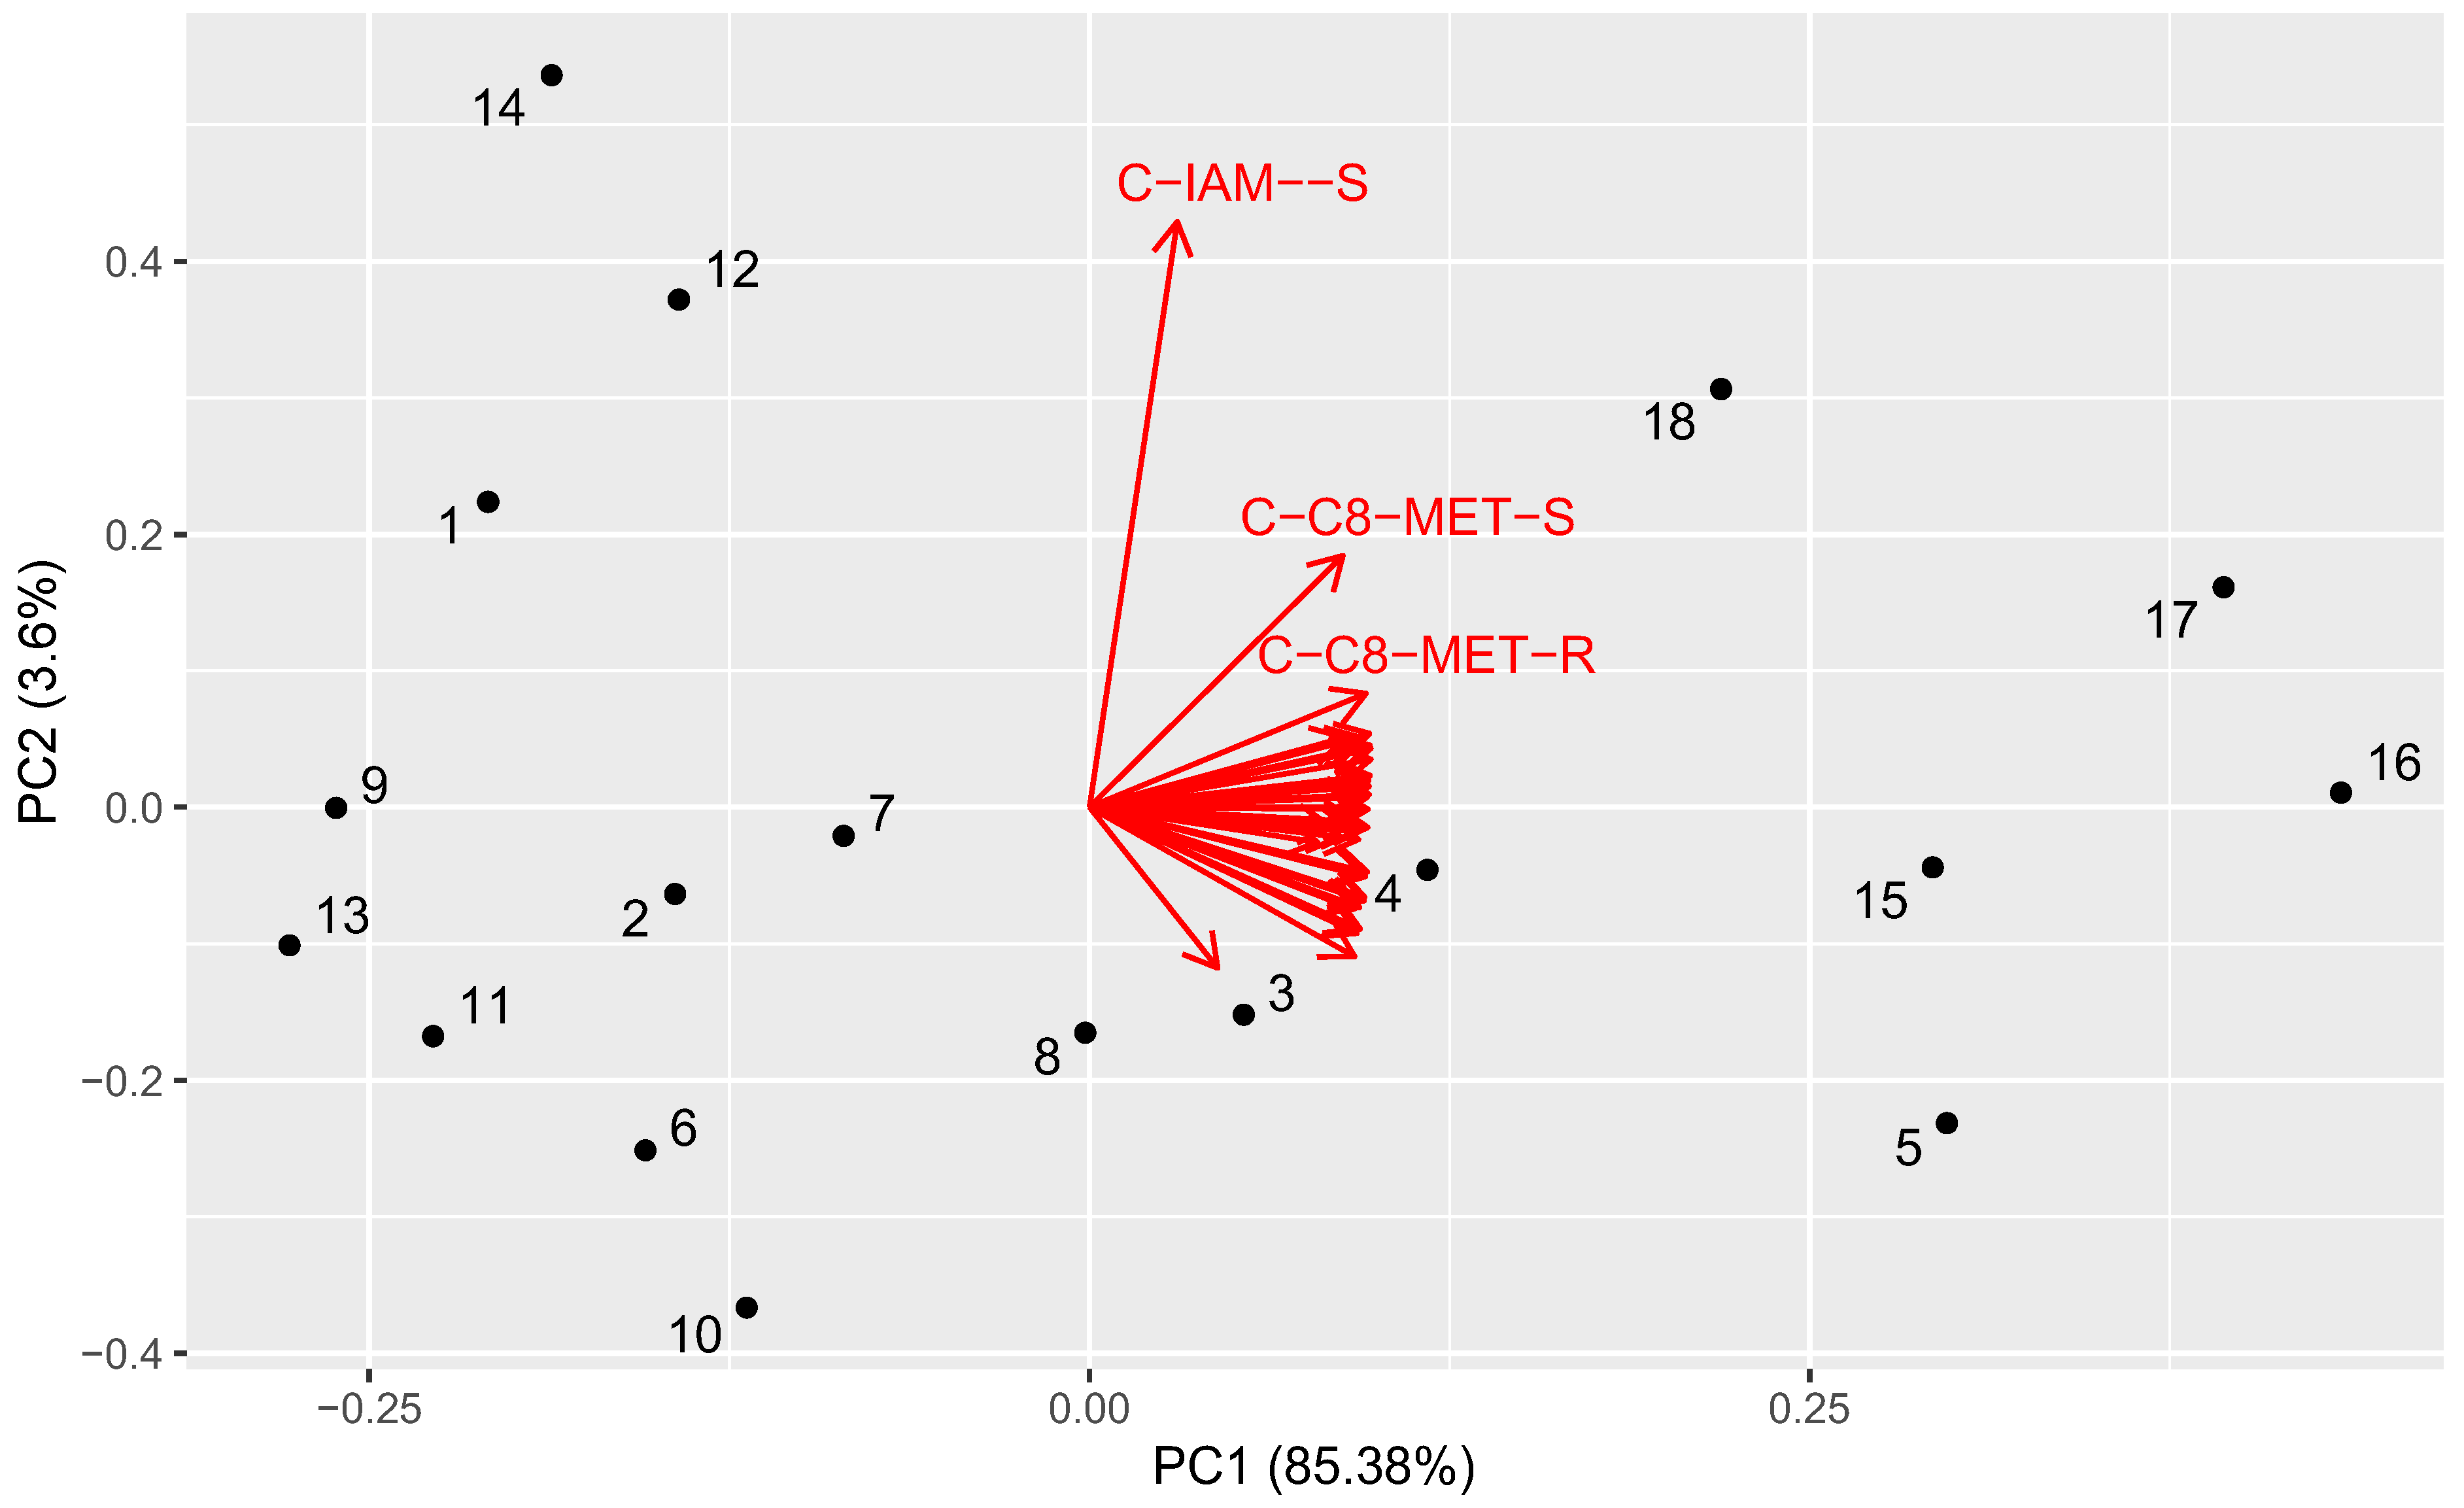
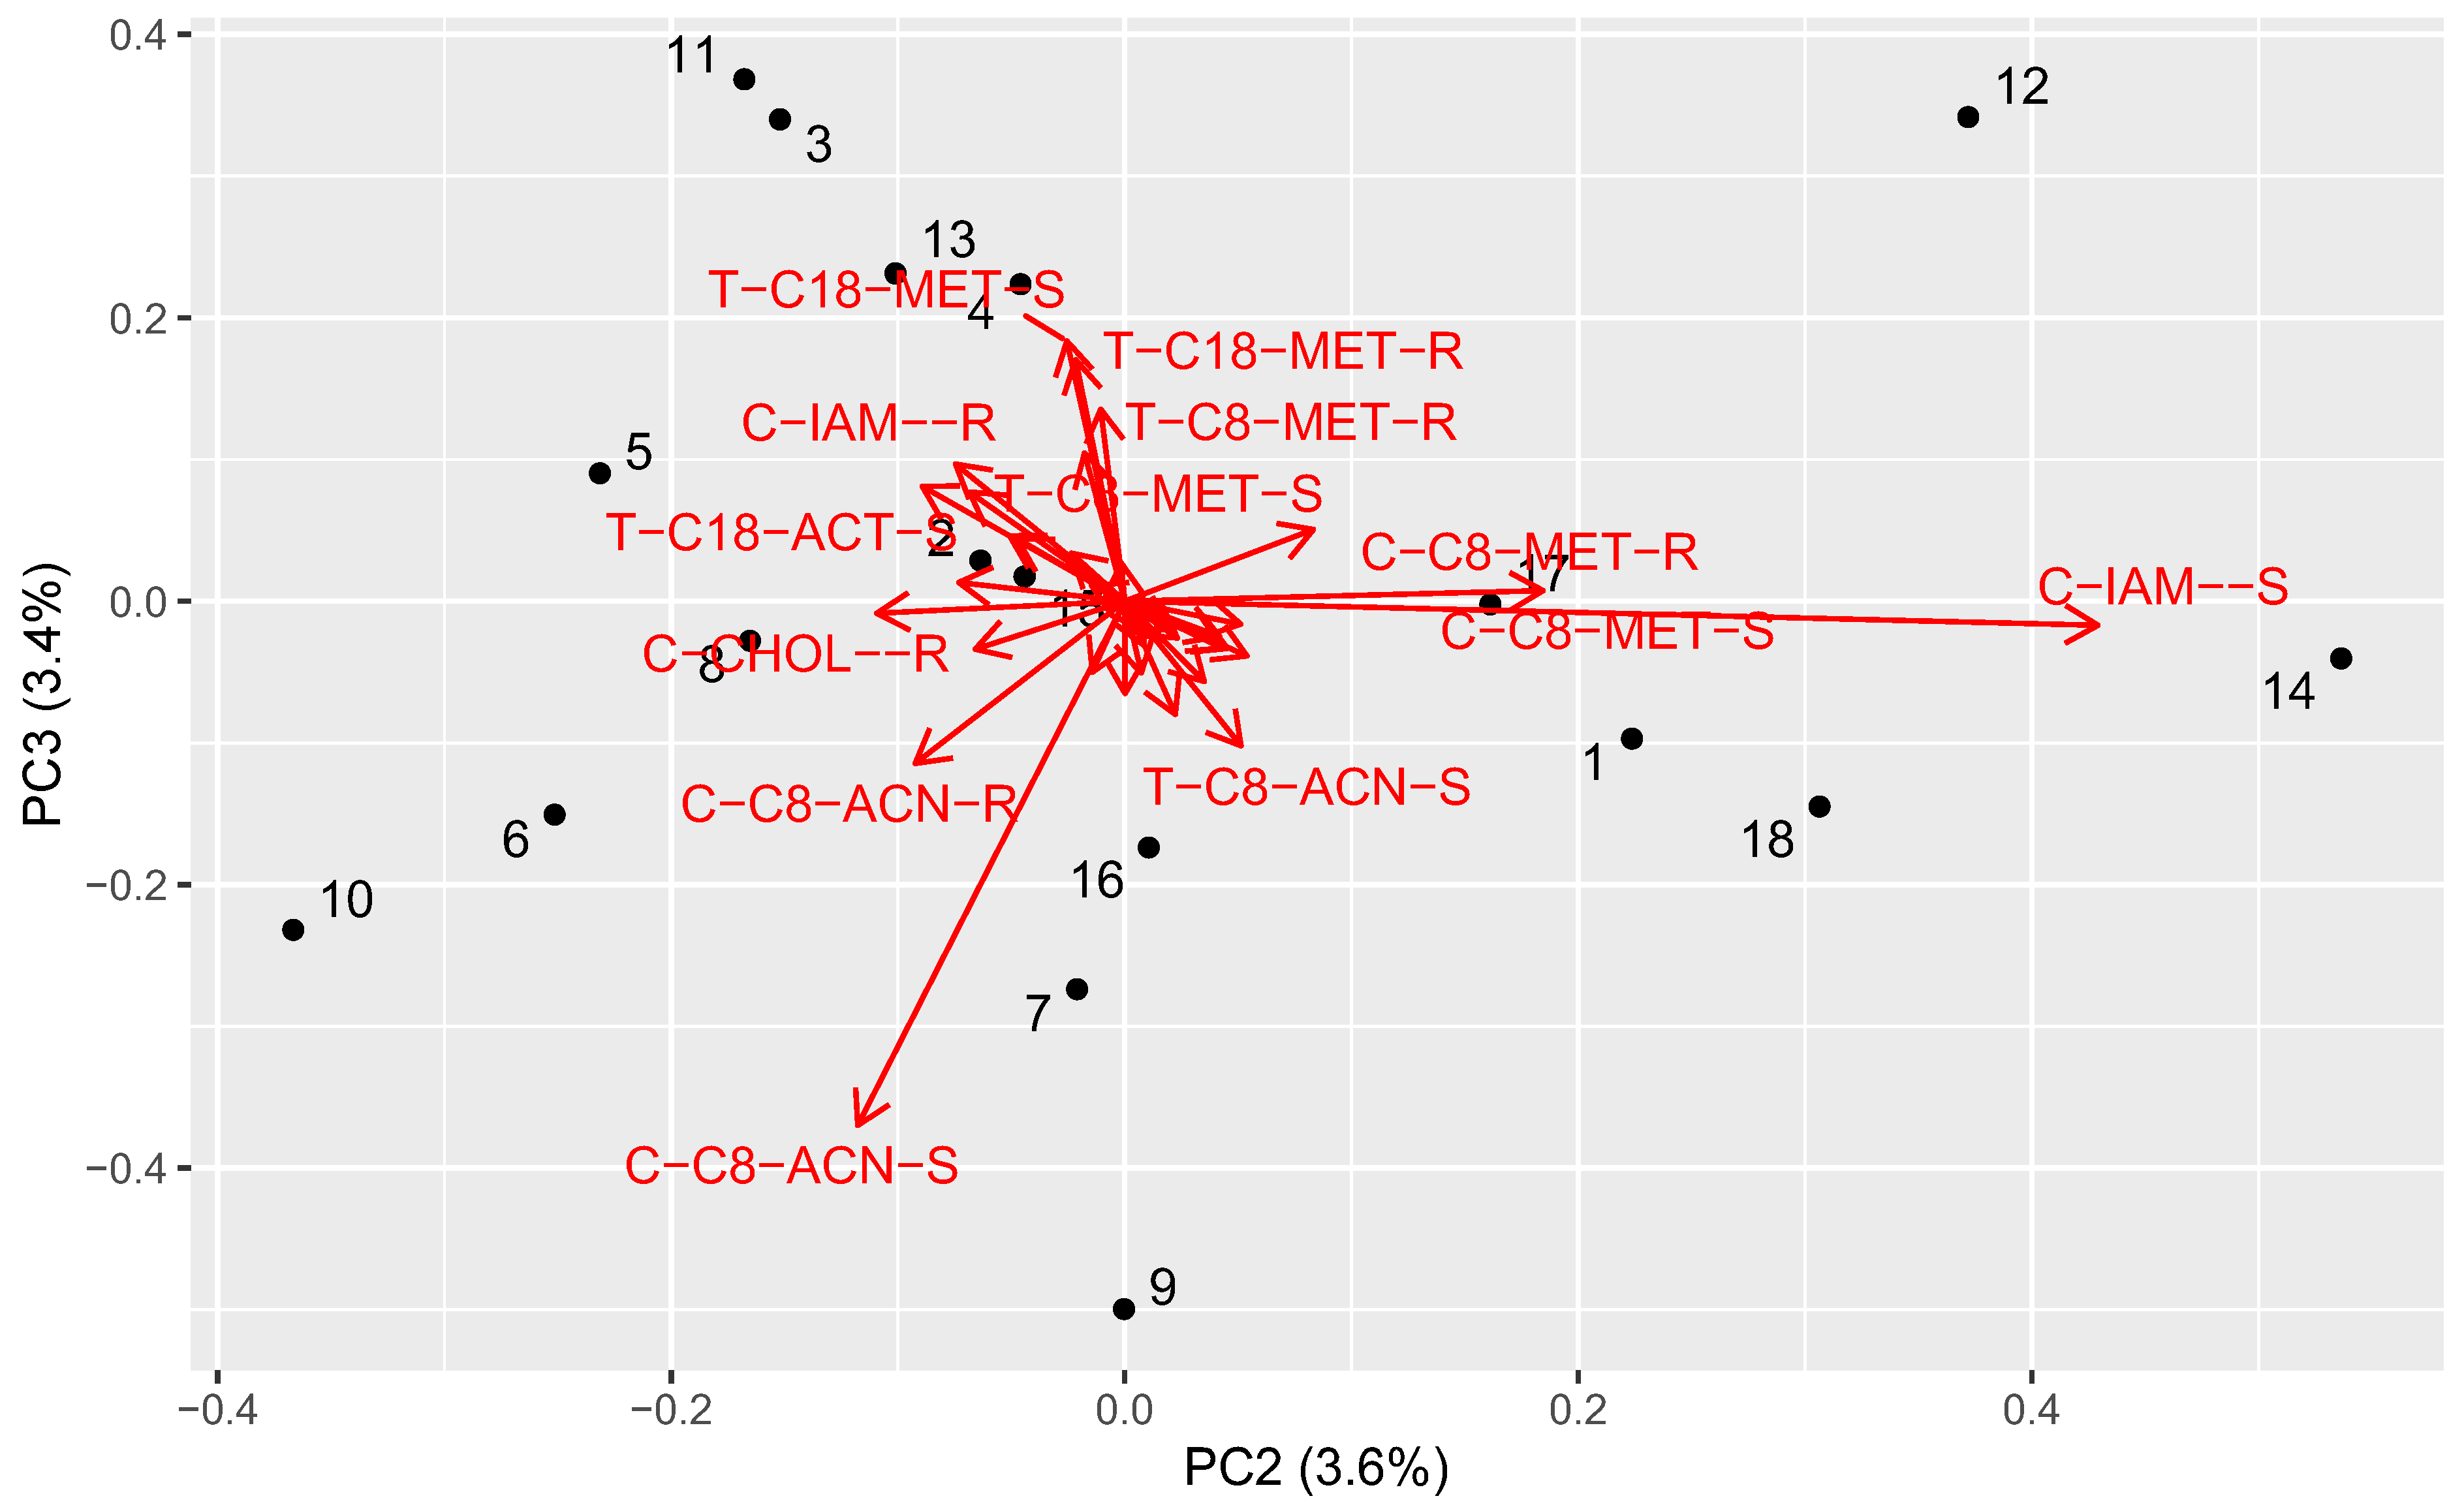
2.6. Principal Component Analysis
3. Materials and Methods
3.1. Compounds
3.2. HPTLC Chromatography
3.3. HPLC Chromatography
3.4. Computational Methods
4. Conclusions
Supplementary Materials
Author Contributions
Funding
Institutional Review Board Statement
Informed Consent Statement
Data Availability Statement
Conflicts of Interest
References
- Valko, K.L.; Zhang, T. Biomimetic properties and estimated in vivo distribution of chloroquine and hydroxy-chloroquine enantiomers. Admet Dmpk 2021, 9, 151–165. [Google Scholar] [CrossRef] [PubMed]
- Valko, K.; Butler, J.; Eddershaw, P. Predictive approaches to increase absorption of compounds during lead optimisation. Expert Opin. Drug Discov. 2013, 8, 1225–1238. [Google Scholar] [CrossRef] [PubMed]
- Arnott, J.A.; Kumar, R.; Planey, S.L. Lipophilicity indices for drug development. J. Appl. Biopharm. Pharmacokinet. 2013, 1, 31–36. [Google Scholar]
- Soares, J.X.; Santos, A.; Fernandes, C.; Pinto, M.M.M. Liquid chromatography on the different methods for the determination of lipophilicity: An essential analytical tool in medicinal chemistry. Chemosensors 2022, 10, 340. [Google Scholar] [CrossRef]
- Liu, X.L.; Testa, B.; Fahr, A. Lipophilicity and its relationship with passive drug permeation. Pharm. Res. 2011, 28, 962–977. [Google Scholar] [CrossRef] [PubMed]
- Arnott, J.A.; Planey, S.L. The influence of lipophilicity in drug discovery and design. Expert Opin. Drug Discov. 2012, 7, 863–875. [Google Scholar] [CrossRef] [PubMed]
- Lipinski, C.A. Lead- and drug-like compounds: The rule-of-five revolution. Drug Discov. Today 2004, 1, 337–341. [Google Scholar] [CrossRef] [PubMed]
- Lipinski, C.A. Chris Lipinski discusses life and chemistry after the Rule of Five. Drug Discov. Today 2003, 8, 12–16. [Google Scholar] [PubMed]
- Oprea, T.I.; Gottfries, J.; Sherbukhin, V.; Svensson, P.; Kuhler, T.C. Chemical information management in drug discovery: Optimizing the computational and combinatorial chemistry interfaces. J. Mol. Graph Model 2000, 18, 512–524. [Google Scholar] [CrossRef]
- Hollósy, F.; Lóránd, T.; Örfi, L.; Erös, D.; Kéri, G.; Idei, M. Relationship between lipophilicity and antitumor activity of molecule library of Mannich ketones determined by high-performance liquid chromatography, clogP calculation and cytotoxicity test. J. Chromatogr. B 2002, 768, 361–368. [Google Scholar] [CrossRef]
- Janicka, M.; Sztanke, M.; Sztanke, K. Reversed-phase liquid chromatography with octadecylsilyl, immobilized artificial membrane and cholesterol columns in correlation studies with in silico biological descriptors of newly synthesized antiproliferative and analgesic active compounds. J. Chromatogr. A 2013, 1318, 92–101. [Google Scholar] [CrossRef]
- Podunavac-Kuzmanovi, S.P.; Cvetković, D.D. Lipophilicity and antifungal activity of some 2-substituted benzimidazole derivatives. Chem. Ind. Chem. Eng. Q. 2011, 17, 9–15. [Google Scholar] [CrossRef]
- Teague, S.; Valko, K. How to identify and eliminate compounds with a risk of high clinical dose during the early phase of lead optimisation in drug discovery. Eur. J. Pharm. Sci. 2017, 110, 37–50. [Google Scholar] [CrossRef] [PubMed]
- Liang, C.; Lian, H.Z. Recent advances in lipophilicity measurement by reversed-phase high-performance liquid chromatography. TrAC-Trends Anal. Chem. 2015, 68, 28–36. [Google Scholar] [CrossRef]
- Bajda, M.; Gula, A.; Wieckowski, K.; Malawska, B. Determination of lipophilicity of gamma-butyrolactone derivatives with anticonvulsant and analgesic activity using micellar electrokinetic chromatography. Electrophoresis 2013, 34, 3079–3085. [Google Scholar] [CrossRef] [PubMed]
- Ciura, K.; Fedorowicz, J.; Andric, F.; Greber, K.E.; Gurgielewicz, A.; Sawicki, W.; Saczewski, J. Lipophilicity determination of quaternary (fluoro)quinolones by chromatographic and theoretical approaches. Int. J. Mol. Sci. 2019, 20, 5288. [Google Scholar] [CrossRef] [PubMed]
- Rageh, A.H.; Atia, N.N.; Abdel-Rahman, H.M. Lipophilicity estimation of statins as a decisive physicochemical parameter for their hepato-selectivity using reversed-phase thin layer chromatography. J. Pharm. Biomed. Anal. 2017, 142, 7–14. [Google Scholar] [CrossRef] [PubMed]
- Constantinescu, T.; Lungu, C.N.; Lung, I. Lipophilicity as a central component of drug-like properties of chalchones and flavonoid derivatives. Molecules 2019, 24, 1505. [Google Scholar] [CrossRef] [PubMed]
- Pastewska, M.; Zolnowska, B.; Kovacevic, S.; Kapica, H.; Gromelski, M.; Stolinski, F.; Slawinski, J.; Sawicki, W.; Ciura, K. Modeling of anticancer sulfonamide derivatives lipophilicity by chemometric and quantitative structure-retention relationships approaches. Molecules 2022, 27, 3965. [Google Scholar] [CrossRef]
- Janicka, M.; Stępnik, K.; Pachuta-Stec, A. Quantification of lipophilicity of 1,2,4-triazoles using micellar chromatography. Chromatographia 2012, 75, 449–456. [Google Scholar] [CrossRef]
- Ciura, K.; Fedorowicz, J.; Zuvela, P.; Lovric, M.; Kapica, H.; Baranowski, P.; Sawicki, W.; Wong, M.W.; Saczewski, J. Affinity of antifungal isoxazolo [3,4-b]pyridine-3(1H)-ones to phospholipids in Immobilized Artificial Membrane (IAM) Chromatography. Molecules 2020, 25, 4835. [Google Scholar] [CrossRef]
- Ganesh, V.; Basuri, P.P.; Sahini, K.; Nalini, C.N. Retention behaviour of analytes in reversed-phase high-performance liquid chromatography-A review. Biomed. Chromatogr. 2023, 37, e5482. [Google Scholar] [CrossRef]
- Welerowicz, T.; Buszewski, B. The effect of stationary phase on lipophilicity determination of beta-blockers using reverse-phase chromatographic systems. Biomed. Chromatogr. 2005, 19, 725–736. [Google Scholar] [CrossRef]
- Flieger, J.; Pizon, M.; Plech, T. Chromatographic behavior of new antiepileptic active compounds on different reversed-phase materials. J. Chromatogr. A 2014, 1338, 188–196. [Google Scholar] [CrossRef] [PubMed]
- Dobričić, V.; Turković, N.; Ivković, B.; Csuvik, O.; Vujić, Z. Evaluation of the lipophilicity of chalcones by RP-TLC and computational methods. JPC-J. Planar Chromat. 2020, 33, 245–253. [Google Scholar] [CrossRef]
- Bober, K.; Bębenek, E.; Boryczka, S. Application of TLC for evaluation of the lipophilicity of newly synthetized esters: Betulin derivatives. J. Anal. Methods Chem. 2019, 19, 1297659. [Google Scholar] [CrossRef]
- Taillardat-Bertschinger, A.; Carrupt, P.A.; Barbato, F.; Testa, B. Immobilized artificial membrane HPLC in drug research. J. Med. Chem. 2003, 46, 655–665. [Google Scholar] [CrossRef]
- Matysiak, J.; Niewiadomy, A. Application of sulfinyl bis(2,4-dihydroxythiobenzoyl) in the synthesis of N-substituted 2-amino-5-(2,4-dihydroxyphenyl)-1,3,4-thiadiazoles. Synthetic Commun. 2006, 36, 1621–1630. [Google Scholar] [CrossRef]
- Skrzypek, A.; Matysiak, J.; Niewiadomy, A.; Bajda, M.; Szymanski, P. Synthesis and biological evaluation of 1,3,4-thiadiazole analogues as novel AChE and BuChE inhibitors. Eur. J. Med. Chem. 2013, 62, 311–319. [Google Scholar] [CrossRef]
- Skrzypek, A.; Matysiak, J.; Karpinska, M.; Czarnecka, K.; Krecisz, P.; Stary, D.; Kukulowicz, J.; Paw, B.; Bajda, M.; Szymanski, P.; et al. Biological evaluation and molecular docking of novel 1,3,4-thiadiazole-resorcinol conjugates as multifunctional cholinesterases inhibitors. Bioorg. Chem. 2021, 107, 104617. [Google Scholar] [CrossRef]
- Soczewinski, E.; Wachtmeister, C.A. Relation between composition of certain ternary 2-phase solvent systems and Rm values. J. Chromatogr. 1962, 7, 311–320. [Google Scholar] [CrossRef]
- Hansch, C.; Fujita, T. Rho-Sigma-Pi Analysis. Method for correlation of biological activity + chemical structure. J. Am. Chem. Soc. 1964, 86, 1616–1626. [Google Scholar] [CrossRef]
- Vrakas, D.; Hadjipavlou-Litina, D.; Tsantili-Kakoulidou, A. Retention of substituted coumarins using immobilized artificial membrane (IAM) chromatography: A comparative study with n-octanol partitioning and reversed-phase HPLC and TLC. J. Pharm. Biomed. Anal. 2005, 39, 908–913. [Google Scholar] [CrossRef] [PubMed]
- Niewiadomy, A.; Skrzypek, A.; Matysiak, J.; Studzinski, M. Effect of organic modifier on the lipophilicity of antiproliferative active 4-(5-amino-1,3,4-thiadiazol-2-yl)benzene-1,3-diols by Reversed-Phase Overpressured Layer Chromatography. J. Liq. Chromatogr. R. T. 2010, 33, 1417–1426. [Google Scholar] [CrossRef]
- Niewiadomy, A.; Zabiñska, A.; Matysiak, J.; Rózylo, J.K. Influence of modifier and molecular structure of some dihydroxythiobenzanilides on retention in reversed-phase high-performance thin-layer chromatography. J. Chromatogr. A 1997, 791, 237–243. [Google Scholar] [CrossRef]
- MarvinSketch, version 19.9, ChemAxon Ltd.: Budapest, Hungary, 1998–2019.
- Available online: https://vcclab.org/web/alogps/ (accessed on 8 February 2024).
- ChemDraw Ultra, version 10.0, Cambridge Soft Corporation: Cambridge, MA, USA, 2006.
- MedChem Designer(TM), version 3.0.0.30, Simulations Plus, Inc.: Lancaster, CA, USA, 2011–2014.
- Klimek-Turek, A.; Dzido, T.H.; Engelhardt, H. The effect of modifier on selectivity in reversed-phase high performance liquid chromatography. LCGC Eur. 2008, 21, 32–42. [Google Scholar]
- Bhatt, N.M.; Chavada, V.D.; Sanyal, M.; Shrivastav, P.S. Influence of organic modifier and separation modes for lipophilicity assessment of drugs using thin layer chromatography indices. J. Chromatogr. A 2018, 1571, 223–230. [Google Scholar] [CrossRef] [PubMed]
- Viswanadhan, V.N.; Ghose, A.K.; Revankar, G.R.; Robins, R.K. Atomic physicochemical parameters for 3 dimensional structure directed quantitative structure—Activity relationships. 4. additional parameters for hydrophobic and dispersive interactions and their application for an automated superposition of certain naturally-occurring nucleoside antibiotics. J. Chem. Inf. Comput. Sci. 1989, 29, 163–172. [Google Scholar]
- Klopman, G.; Dimayuga, M.; Talafous, J. META. 1. A program for the evaluation of metabolic transformation of chemicals. J. Chem. Inf. Comput. Sci. 1994, 34, 1320–1325. [Google Scholar] [CrossRef]
- Ghose, A.K.; Crippen, G.M. Atomic physicochemical parameters for 3-Dimensional-Structure-Directed Quantitative Structure-Activity-Relationships. 2. Modeling dispersive and hydrophobic interactions. J. Chem. Inf. Comput. Sci. 1987, 27, 21–35. [Google Scholar] [CrossRef]
- Statistica, version 7.1, StatSoft, Inc.: Tulsa, OK, USA, 1984–2005.

 | |||||
|---|---|---|---|---|---|
| No. | R1 | R2 | No. | R1 | R2 |
| 1. |  | -Cl | 11. | 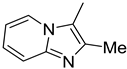 | -H |
| 2. | -Et | 12. | -Cl | ||
| 3. | 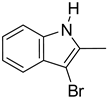 | -H | 13. 14. | 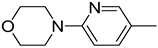 | -H -Cl |
| 4. | 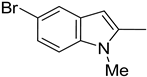 | -H | |||
| 5. | -Et | 15. |  | -H | |
| 6. |  | -H | 16. | -Et | |
| 7. | -Cl | ||||
| 8. | -Et | 17. | 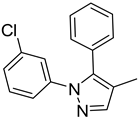 | -Et | |
| 9. 10. |  | -H -Cl | 18. | 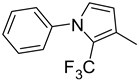 | -Cl |
| No. | Descriptor/System | Mean | Median | Min | Max | Range | Std. Dev. |
|---|---|---|---|---|---|---|---|
| 1. | RMw—C18/MeOH | 4.3424 | 4.1679 | 2.5407 | 6.3131 | 3.7724 | 1.0561 |
| 2. | RMw—C18/ACN | 2.4181 | 2.2442 | 1.3930 | 3.9912 | 2.5982 | 0.7871 |
| 3. | RMw—C18/acet | 3.7951 | 3.2917 | 2.2885 | 5.6072 | 3.3187 | 1.0156 |
| 4. | RMw—C18/diox | 4.0096 | 3.7405 | 2.1989 | 6.1654 | 3.9665 | 1.2277 |
| 5. | RMw—C8/MeOH | 4.1334 | 3.8175 | 2.2257 | 6.5014 | 4.2757 | 1.0851 |
| 6. | RMw—C8/ACN | 2.8262 | 2.5901 | 1.7456 | 4.7899 | 3.0443 | 0.8329 |
| 7. | RMw—C8/acet | 3.5870 | 3.3786 | 2.1722 | 5.9450 | 3.7728 | 1.1021 |
| 8. | RMw—C8/diox | 3.8056 | 3.2432 | 1.8586 | 6.4537 | 4.5951 | 1.2498 |
| 9. | log kw—C18/MeOH | 4.0104 | 3.9980 | 2.5789 | 5.8533 | 3.2744 | 1.0563 |
| 10. | log kw—C8/MeOH | 5.0122 | 4.6529 | 3.5488 | 6.5561 | 3.0073 | 0.9748 |
| 11. | log kw—C8/ACN | 2.3201 | 2.3214 | 1.4122 | 3.3937 | 1.9815 | 0.5503 |
| 12. | log kw—IAM | 2.5658 | 2.4026 | 1.2283 | 3.8012 | 2.5729 | 0.7299 |
| 13. | log kw—Chol | 4.4297 | 4.1548 | 3.1313 | 6.1235 | 2.9922 | 1.0041 |
| Descriptor/ System | C18/MeOH | C18/ACN | C18/Acet | C18/Diox | C8/MeOH | C8/ACN | C8/Acet | C8/Diox | C18/ACN | C8/MeOH | C8/ACN | IAM | Chol |
|---|---|---|---|---|---|---|---|---|---|---|---|---|---|
| RMw—C18/MeOH | 1.00 | ||||||||||||
| RMw—C18/ACN | 0.80 | 1.00 | |||||||||||
| RMw—C18/acet | 0.87 | 0.93 | 1.00 | ||||||||||
| RMw—C18/diox | 0.89 | 0.95 | 0.97 | 1.00 | |||||||||
| RMw—C8/MeOH | 0.88 | 0.89 | 0.94 | 0.92 | 1.00 | ||||||||
| RMw—C8/ACN | 0.79 | 0.94 | 0.90 | 0.91 | 0.90 | 1.00 | |||||||
| RMw—C8/acet | 0.88 | 0.93 | 0.95 | 0.97 | 0.94 | 0.95 | 1.00 | ||||||
| RMw—C8/diox | 0.81 | 0.91 | 0.91 | 0.91 | 0.88 | 0.93 | 0.94 | 1.00 | |||||
| log kw—C18/MeOH | 0.87 | 0.90 | 0.92 | 0.95 | 0.89 | 0.86 | 0.94 | 0.92 | 1.00 | ||||
| log kw—C8/MeOH | 0.89 | 0.91 | 0.90 | 0.92 | 0.92 | 0.92 | 0.94 | 0.94 | 0.90 | 1.00 | |||
| log kw—C8/ACN | 0.76 | 0.90 | 0.88 | 0.91 | 0.82 | 0.89 | 0.92 | 0.92 | 0.92 | 0.86 | 1.00 | ||
| log kw—IAM | 0.88 | 0.86 | 0.94 | 0.94 | 0.95 | 0.85 | 0.93 | 0.84 | 0.92 | 0.87 | 0.86 | 1.00 | |
| log kw—Chol | 0.82 | 0.90 | 0.91 | 0.92 | 0.85 | 0.88 | 0.91 | 0.90 | 0.94 | 0.88 | 0.94 | 0.89 | 1.00 |
| No. | ChA log P 1 | Con log P 1 | ALOGP 2 | log P 3 | CLog P 3 | Mlog P 4 | S + Log P 4 | S + Log D 4 | log D5 1 | log D7 1 | log D8 1 | log D7.4 1 |
|---|---|---|---|---|---|---|---|---|---|---|---|---|
| 1. | 2.35 | 2.85 | 2.98 | 3.03 | 2.3173 | 1.664 | 1.664 | 2.596 | 2.85 | 2.72 | 2.13 | 2.366 |
| 2. | 2.69 | 3.21 | 3.02 | 3.38 | 2.9049 | 1.928 | 1.928 | 3.108 | 3.21 | 3.19 | 3.08 | 3.124 |
| 3. | 3.54 | 3.98 | 4.27 | 4.28 | 2.6716 | 2.647 | 2.647 | 4.009 | 3.98 | 3.95 | 3.73 | 3.818 |
| 4. | 3.79 | 4.20 | 4.02 | 4.52 | 4.1351 | 2.882 | 2.882 | 4.005 | 4.2 | 4.17 | 3.96 | 4.044 |
| 5. | 4.65 | 5.16 | 4.95 | 5.42 | 5.1131 | 3.337 | 3.337 | 4.590 | 5.16 | 5.15 | 5.03 | 5.078 |
| 6. | 2.51 | 2.54 | 2.81 | - 5 | 2.1569 | 1.871 | 1.871 | 2.909 | 2.54 | 2.51 | 2.30 | 2.384 |
| 7. | 3.03 | 3.14 | 3.51 | - 5 | 2.5473 | 2.127 | 2.127 | 2.770 | 3.14 | 3.02 | 2.46 | 2.684 |
| 8. | 3.37 | 3.50 | 3.36 | - 5 | 3.1349 | 2.377 | 2.377 | 3.467 | 3.50 | 3.48 | 3.38 | 3.42 |
| 9. | 2.31 | 2.45 | 3.06 | 3.42 | 2.6964 | 2.040 | 2.040 | 2.913 | 2.21 | 2.41 | 2.20 | 2.284 |
| 10. | 2.83 | 3.05 | 3.81 | 3.98 | 3.0865 | 2.281 | 2.281 | 2.953 | 2.81 | 2.92 | 2.36 | 2.584 |
| 11. | 1.81 | 2.03 | 2.87 | 3.48 | 2.2487 | 1.918 | 1.918 | 2.481 | 1.98 | 2.00 | 1.78 | 1.868 |
| 12. | 2.33 | 2.63 | 3.72 | 4.03 | 2.6387 | 2.161 | 2.161 | 2.736 | 2.49 | 2.53 | 1.93 | 2.17 |
| 13. | 2.19 | 2.46 | 2.34 | 3.12 | 1.2077 | 1.552 | 1.552 | 2.403 | 2.12 | 2.42 | 2.21 | 2.294 |
| 14. | 2.71 | 3.06 | 2.96 | 3.68 | 1.5977 | 1.789 | 1.789 | 2.895 | 2.72 | 2.93 | 2.37 | 2.594 |
| 15. | 4.80 | 5.45 | 5.14 | 6.14 | 4.9270 | 3.850 | 3.850 | 4.692 | 5.45 | 5.42 | 5.20 | 5.288 |
| 16. | 5.67 | 6.41 | 5.71 | 7.05 | 5.9050 | 4.262 | 4.262 | 5.167 | 6.41 | 6.39 | 6.28 | 6.324 |
| 17. | 5.67 | 6.41 | 5.72 | 7.05 | 5.9050 | 4.262 | 4.262 | 5.201 | 6.41 | 6.39 | 6.28 | 6.324 |
| 18. | 4.98 | 5.55 | 5.22 | 5.78 | 5.0844 | 3.485 | 3.485 | 4.832 | 5.55 | 5.42 | 4.85 | 5.078 |
| Descriptor /System | ChA log P 1 | Con log P 1 | ALOGP 2 | log P 3 | Clog P 3 | M log P 4 | S + Log P 4 | S + log D 4 | log D5 1 | log D7 1 | log D7.4 1 |
|---|---|---|---|---|---|---|---|---|---|---|---|
| RMw | |||||||||||
| C18/MeOH | 0.8318 | 0.7745 | 0.8512 | 0.8512 | 0.8290 | 0.8138 | 0.8057 | 0.7993 | 0.8030 | 0.8318 | 0.8512 |
| C18/ACN | 0.8779 | 0.9018 | 0.8977 | 0.8977 | 0.9105 | 0.9110 | 0.9064 | 0.9186 | 0.9153 | 0.8779 | 0.8977 |
| C18/acet | 0.9154 | 0.8946 | 0.9325 | 0.9325 | 0.9199 | 0.9320 | 0.9318 | 0.9403 | 0.9385 | 0.9154 | 0.9325 |
| C18/diox | 0.9308 | 0.9094 | 0.9370 | 0.9370 | 0.9180 | 0.9262 | 0.9285 | 0.9302 | 0.9310 | 0.9308 | 0.9370 |
| C8/MeOH | 0.8733 | 0.8234 | 0.8792 | 0.8792 | 0.8859 | 0.8967 | 0.8951 | 0.9014 | 0.9004 | 0.8733 | 0.8792 |
| C8/ACN | 0.9351 | 0.8843 | 0.9332 | 0.9332 | 0.9227 | 0.9316 | 0.9365 | 0.9439 | 0.9425 | 0.9351 | 0.9332 |
| C8/acet | 0.9560 | 0.9148 | 0.9544 | 0.9544 | 0.9183 | 0.9297 | 0.9318 | 0.9267 | 0.9301 | 0.9560 | 0.9544 |
| C8/diox | 0.9602 | 0.9544 | 0.9732 | 0.9732 | 0.9700 | 0.9542 | 0.9523 | 0.9453 | 0.9495 | 0.9602 | 0.9732 |
| log kw | |||||||||||
| C18/MeOH | 0.8933 | 0.9199 | 0.9210 | 0.9210 | 0.9069 | 0.8861 | 0.8856 | 0.8839 | 0.8860 | 0.8933 | 0.9210 |
| C8/MeOH | 0.9447 | 0.9450 | 0.9545 | 0.9311 | 0.9224 | 0.9456 | 0.9456 | 0.9599 | 0.9531 | 0.9454 | 0.9385 |
| C8/ACN | 0.9262 | 0.9194 | 0.9315 | 0.9059 | 0.9513 | 0.9425 | 0.9425 | 0.9308 | 0.9236 | 0.9232 | 0.9276 |
| IAM | 0.8517 | 0.8229 | 0.8673 | 0.8673 | 0.8607 | 0.8751 | 0.8771 | 0.8842 | 0.8829 | 0.8517 | 0.8673 |
| Chol | 0.8709 | 0.9024 | 0.9170 | 0.9170 | 0.9106 | 0.8753 | 0.8808 | 0.9063 | 0.8979 | 0.8709 | 0.9170 |
Disclaimer/Publisher’s Note: The statements, opinions and data contained in all publications are solely those of the individual author(s) and contributor(s) and not of MDPI and/or the editor(s). MDPI and/or the editor(s) disclaim responsibility for any injury to people or property resulting from any ideas, methods, instructions or products referred to in the content. |
© 2024 by the authors. Licensee MDPI, Basel, Switzerland. This article is an open access article distributed under the terms and conditions of the Creative Commons Attribution (CC BY) license (https://creativecommons.org/licenses/by/4.0/).
Share and Cite
Paw, B.; Śliwa, R.; Komsta, Ł.; Senczyna, B.; Karpińska, M.; Matysiak, J. Comparison of HPLC, HPTLC, and In Silico Lipophilicity Parameters Determined for 5-Heterocyclic 2-(2,4-Dihydroxyphenyl)-1,3,4-thiadiazoles. Molecules 2024, 29, 2478. https://doi.org/10.3390/molecules29112478
Paw B, Śliwa R, Komsta Ł, Senczyna B, Karpińska M, Matysiak J. Comparison of HPLC, HPTLC, and In Silico Lipophilicity Parameters Determined for 5-Heterocyclic 2-(2,4-Dihydroxyphenyl)-1,3,4-thiadiazoles. Molecules. 2024; 29(11):2478. https://doi.org/10.3390/molecules29112478
Chicago/Turabian StylePaw, Beata, Rafał Śliwa, Łukasz Komsta, Bogusław Senczyna, Monika Karpińska, and Joanna Matysiak. 2024. "Comparison of HPLC, HPTLC, and In Silico Lipophilicity Parameters Determined for 5-Heterocyclic 2-(2,4-Dihydroxyphenyl)-1,3,4-thiadiazoles" Molecules 29, no. 11: 2478. https://doi.org/10.3390/molecules29112478