
Quality Studies on Cynometra iripa Leaf and Bark as Herbal Medicines

 ,
,  ,
,  , , ,
, , ,
Abstract

1. Introduction
2. Results
2.1. Macroscopic and Microscopic Analyses
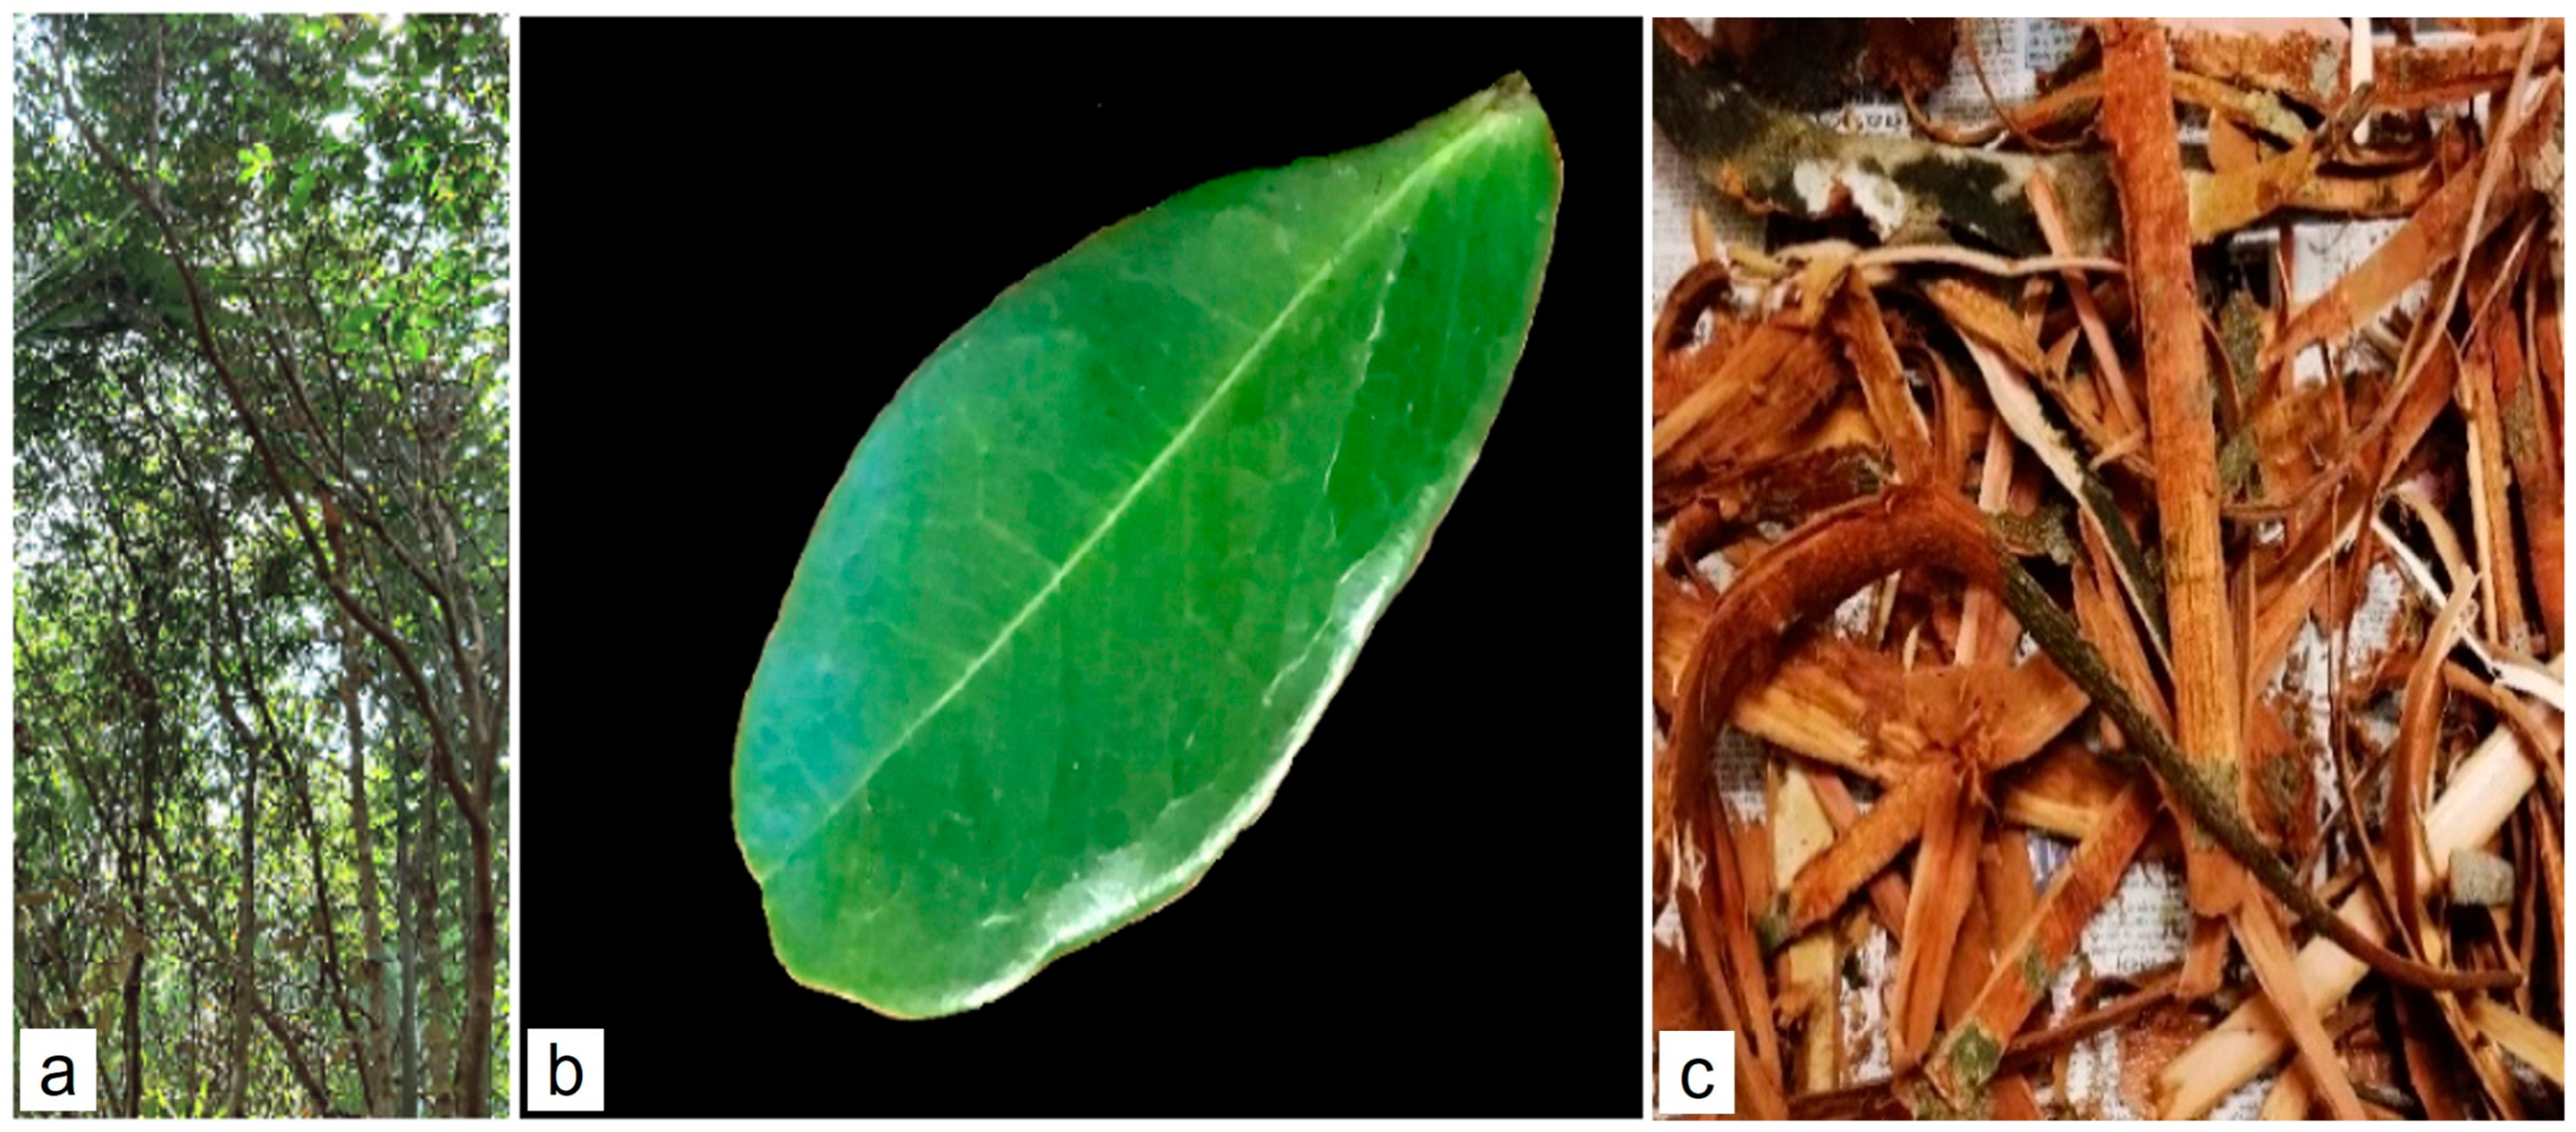
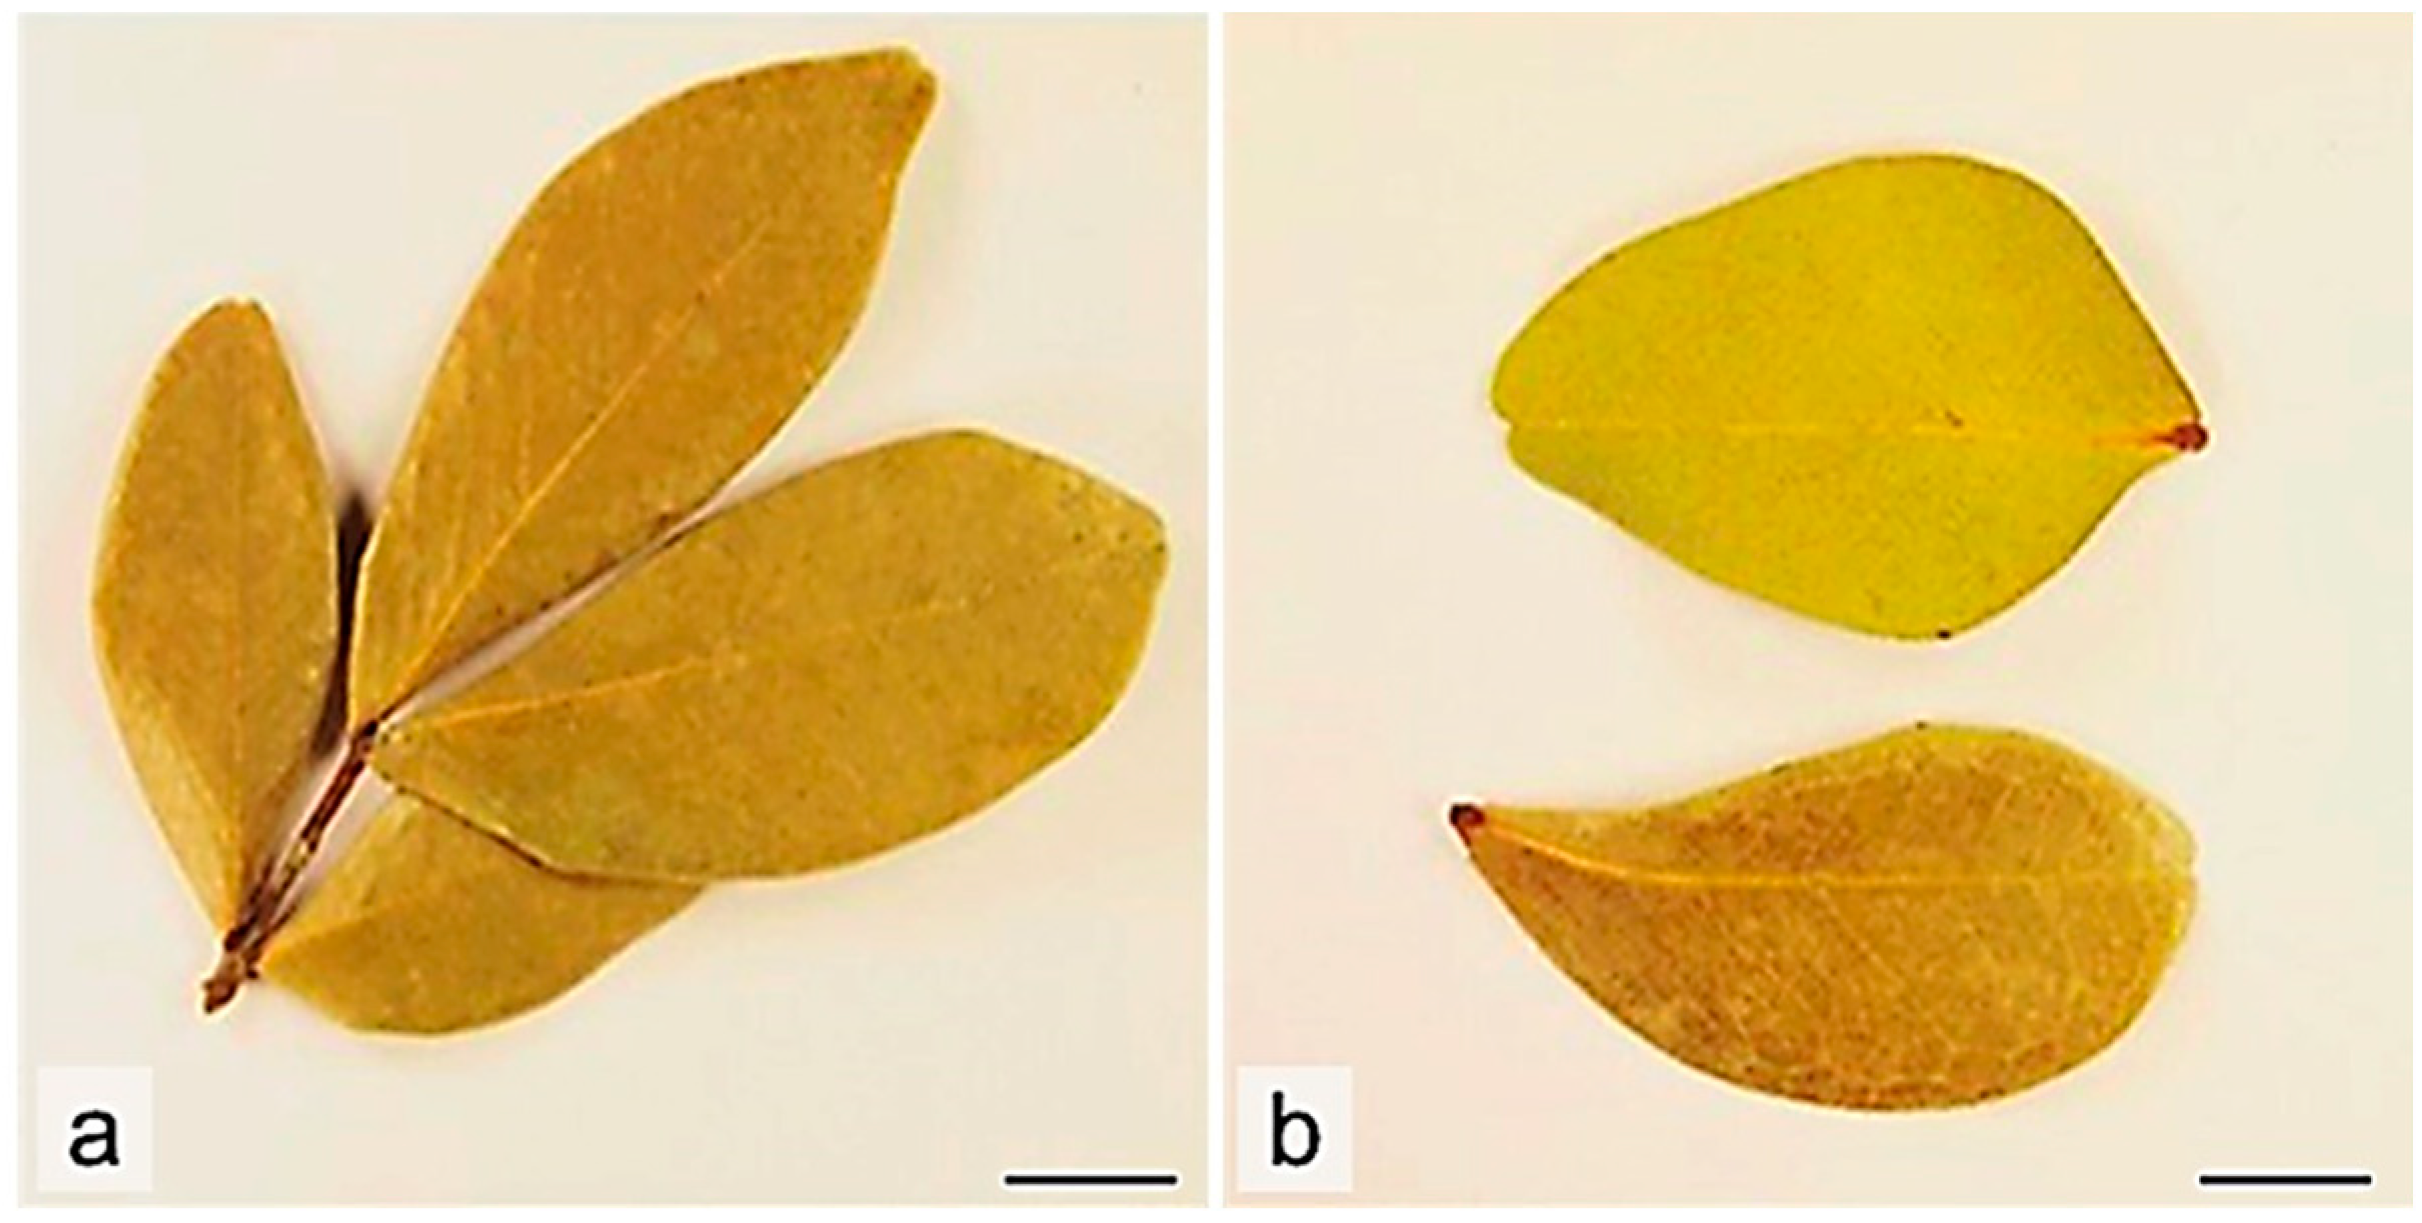
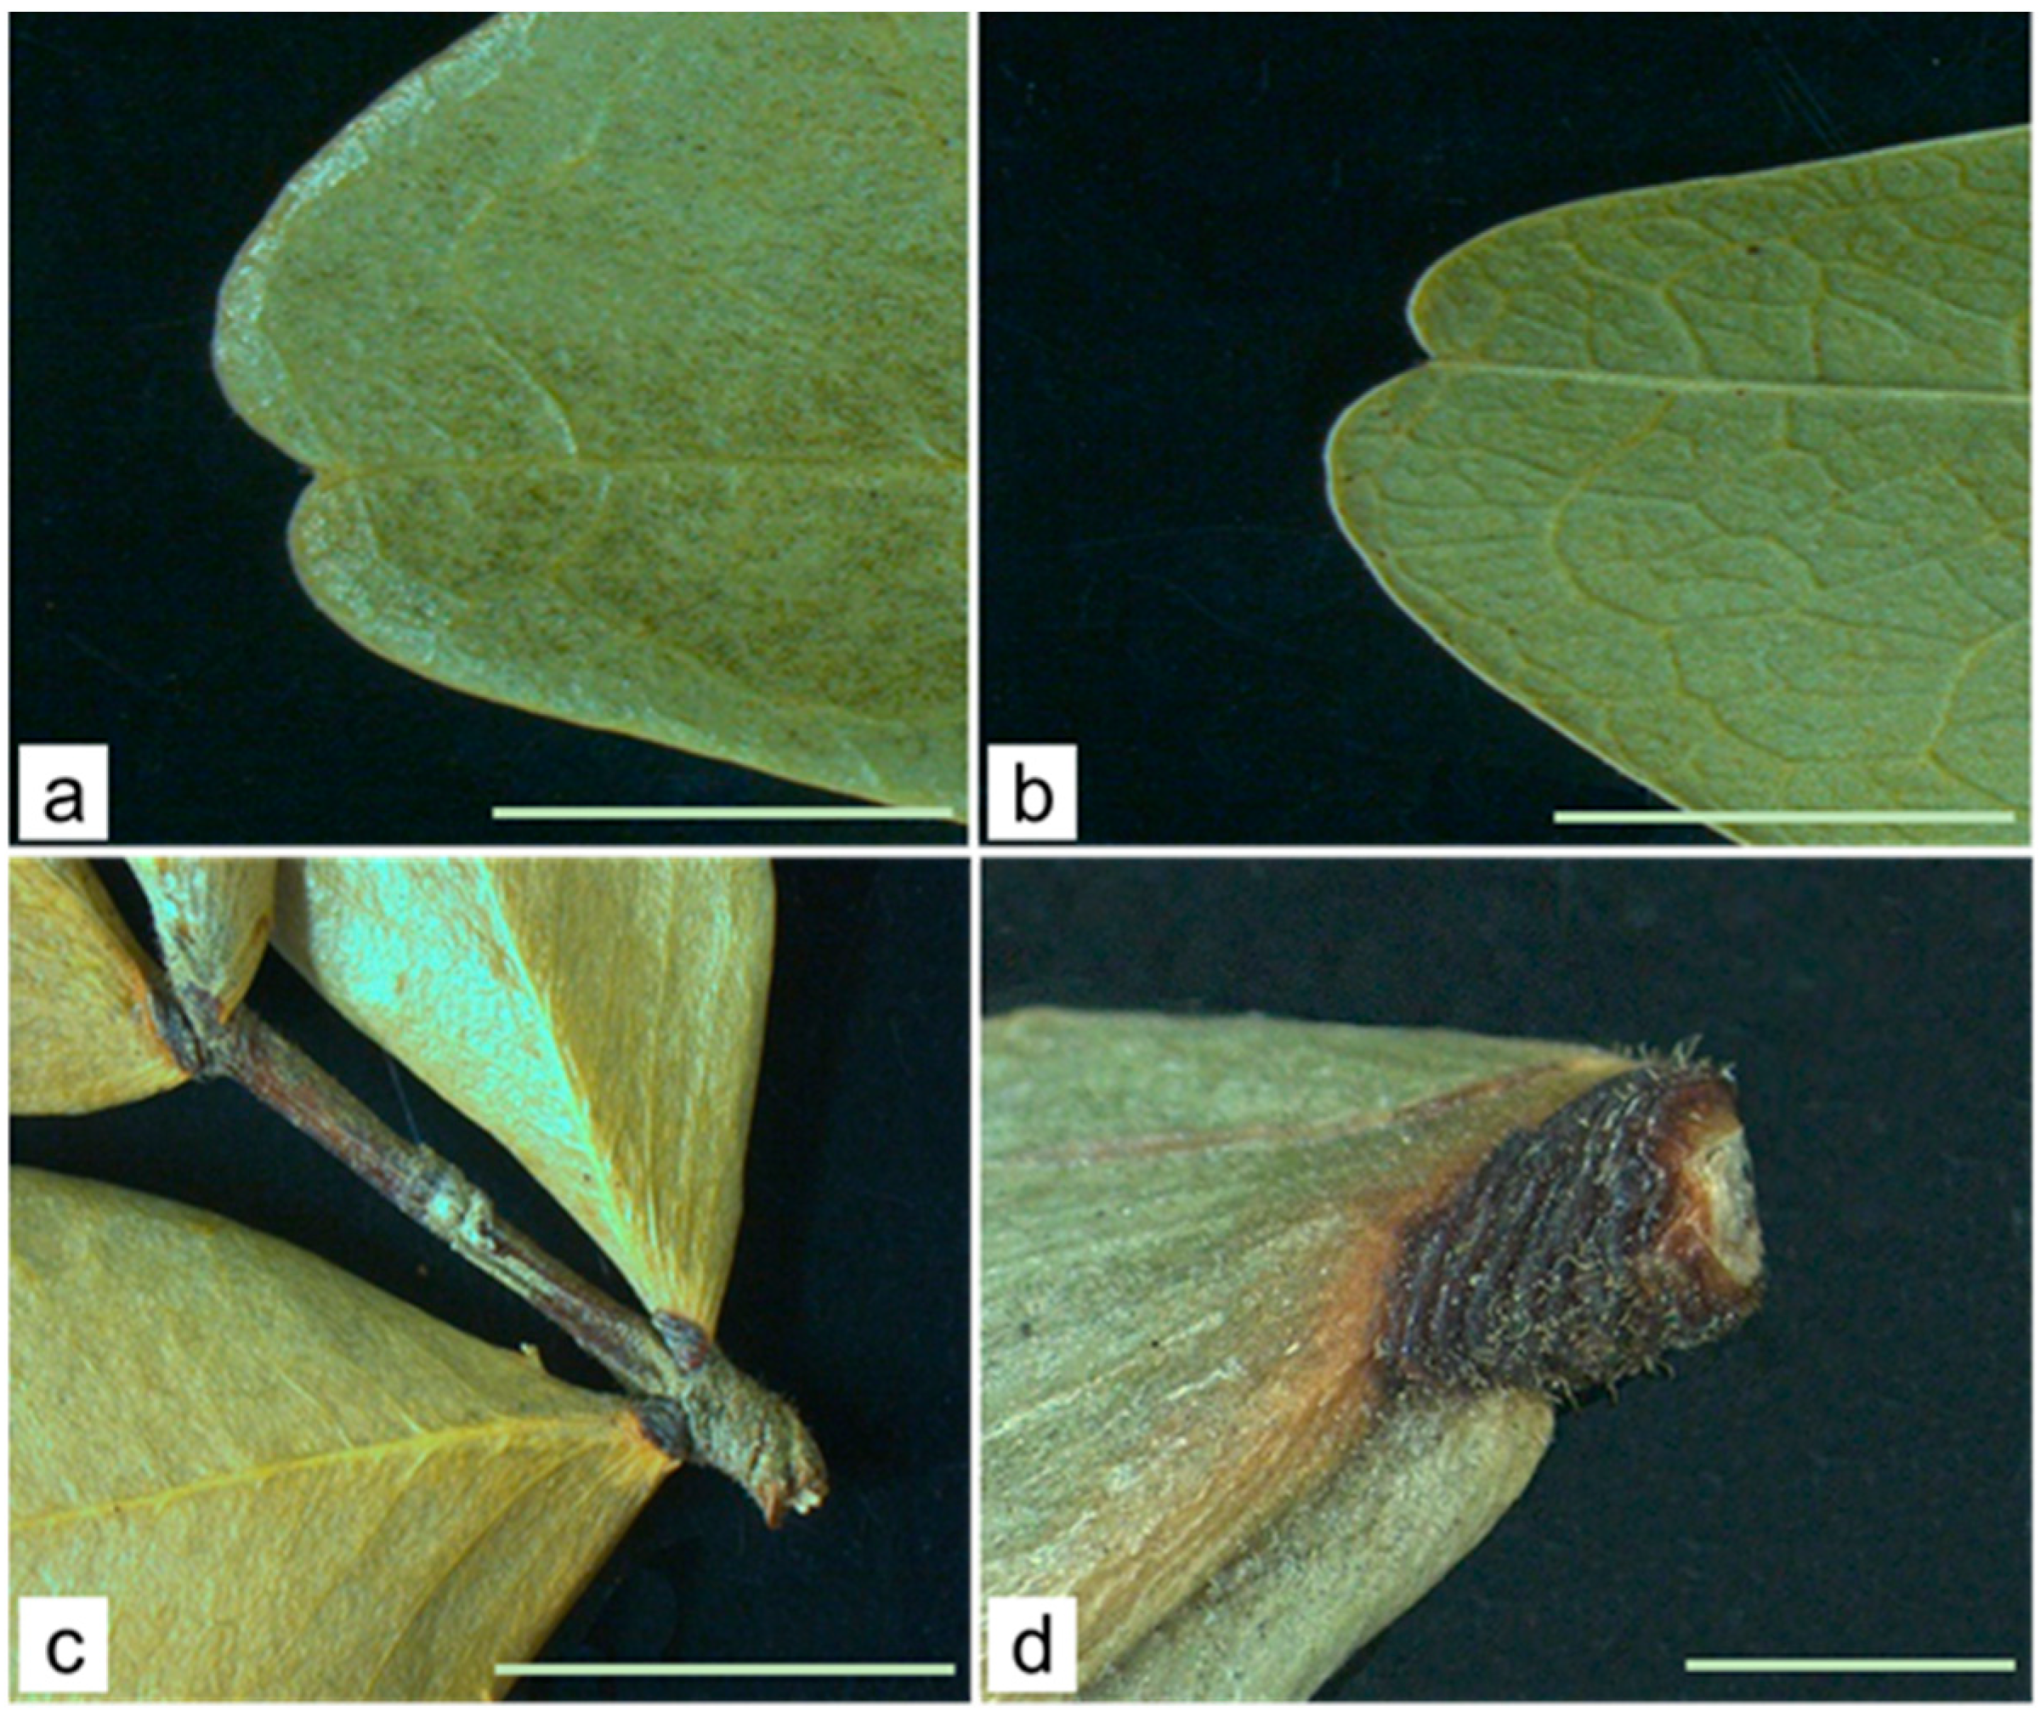
2.1.1. Leaf
Macroscopic Characteristics
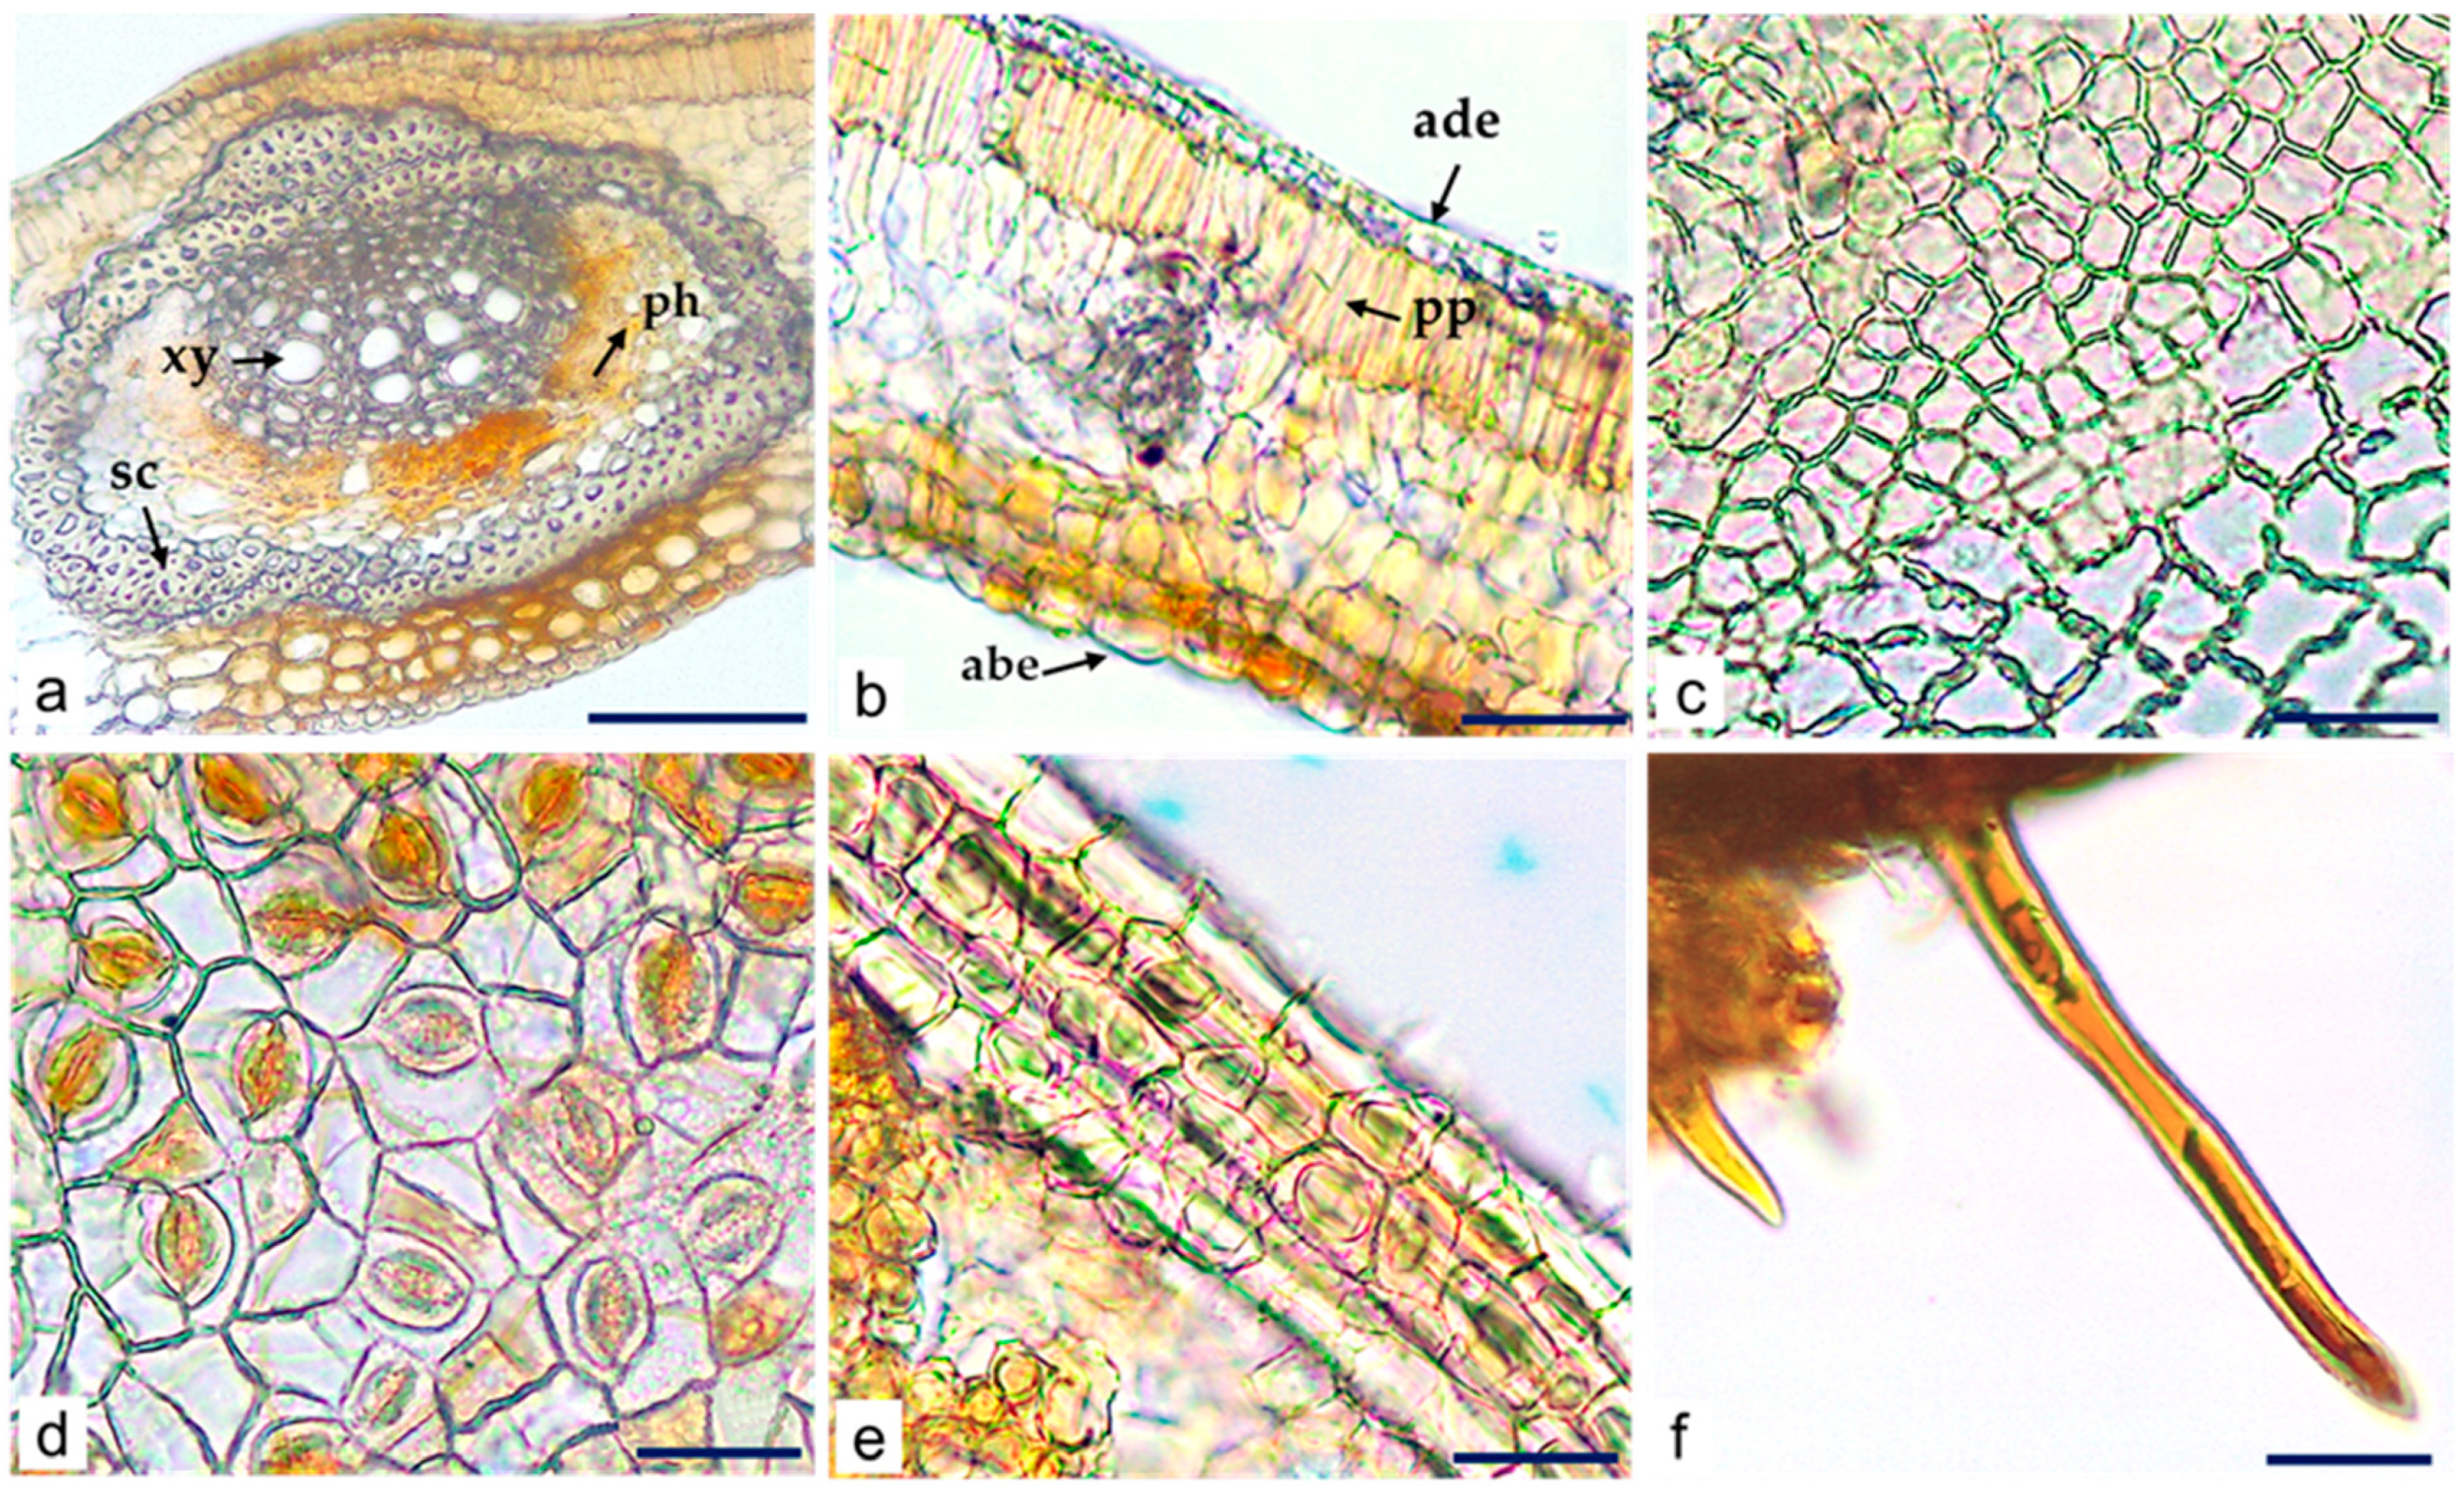
Microscopic Characteristics
2.1.2. Bark
Macroscopic Characteristics
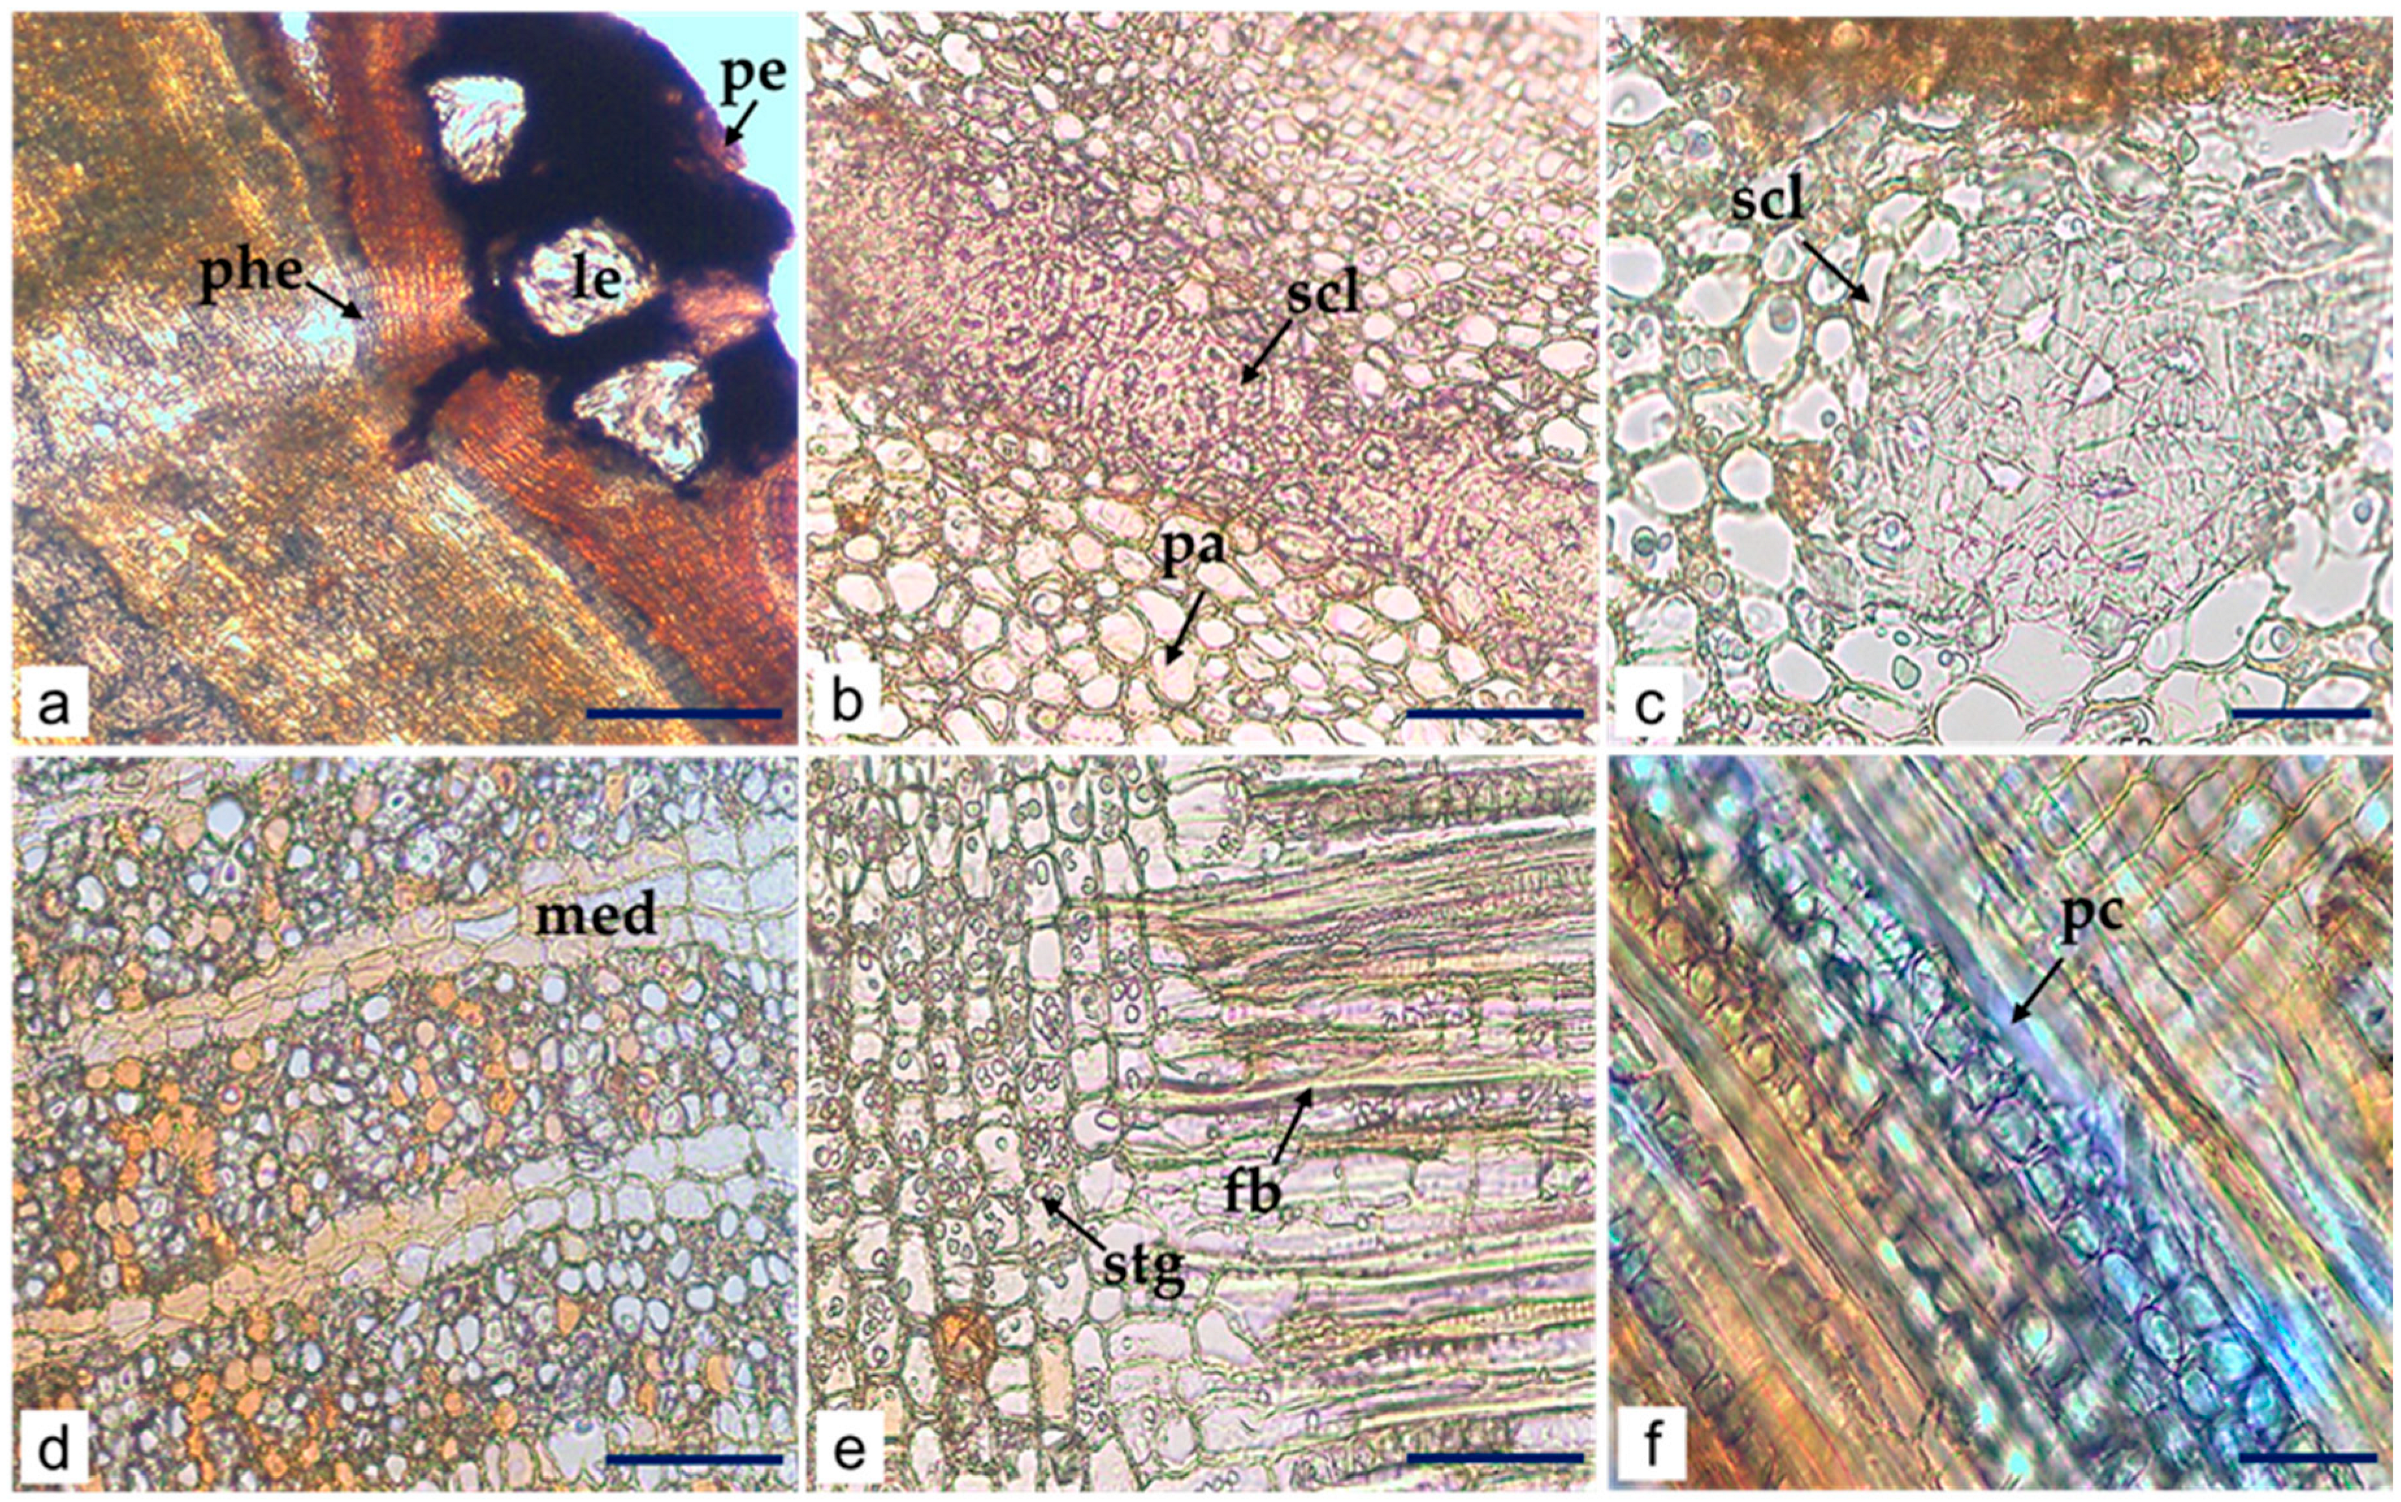
Microscopic Characteristics
2.2. Quantitative Microscopic Analysis
2.3. Chemical Studies
2.3.1. Yield of Extraction
2.3.2. Qualitative Phytochemical Analysis
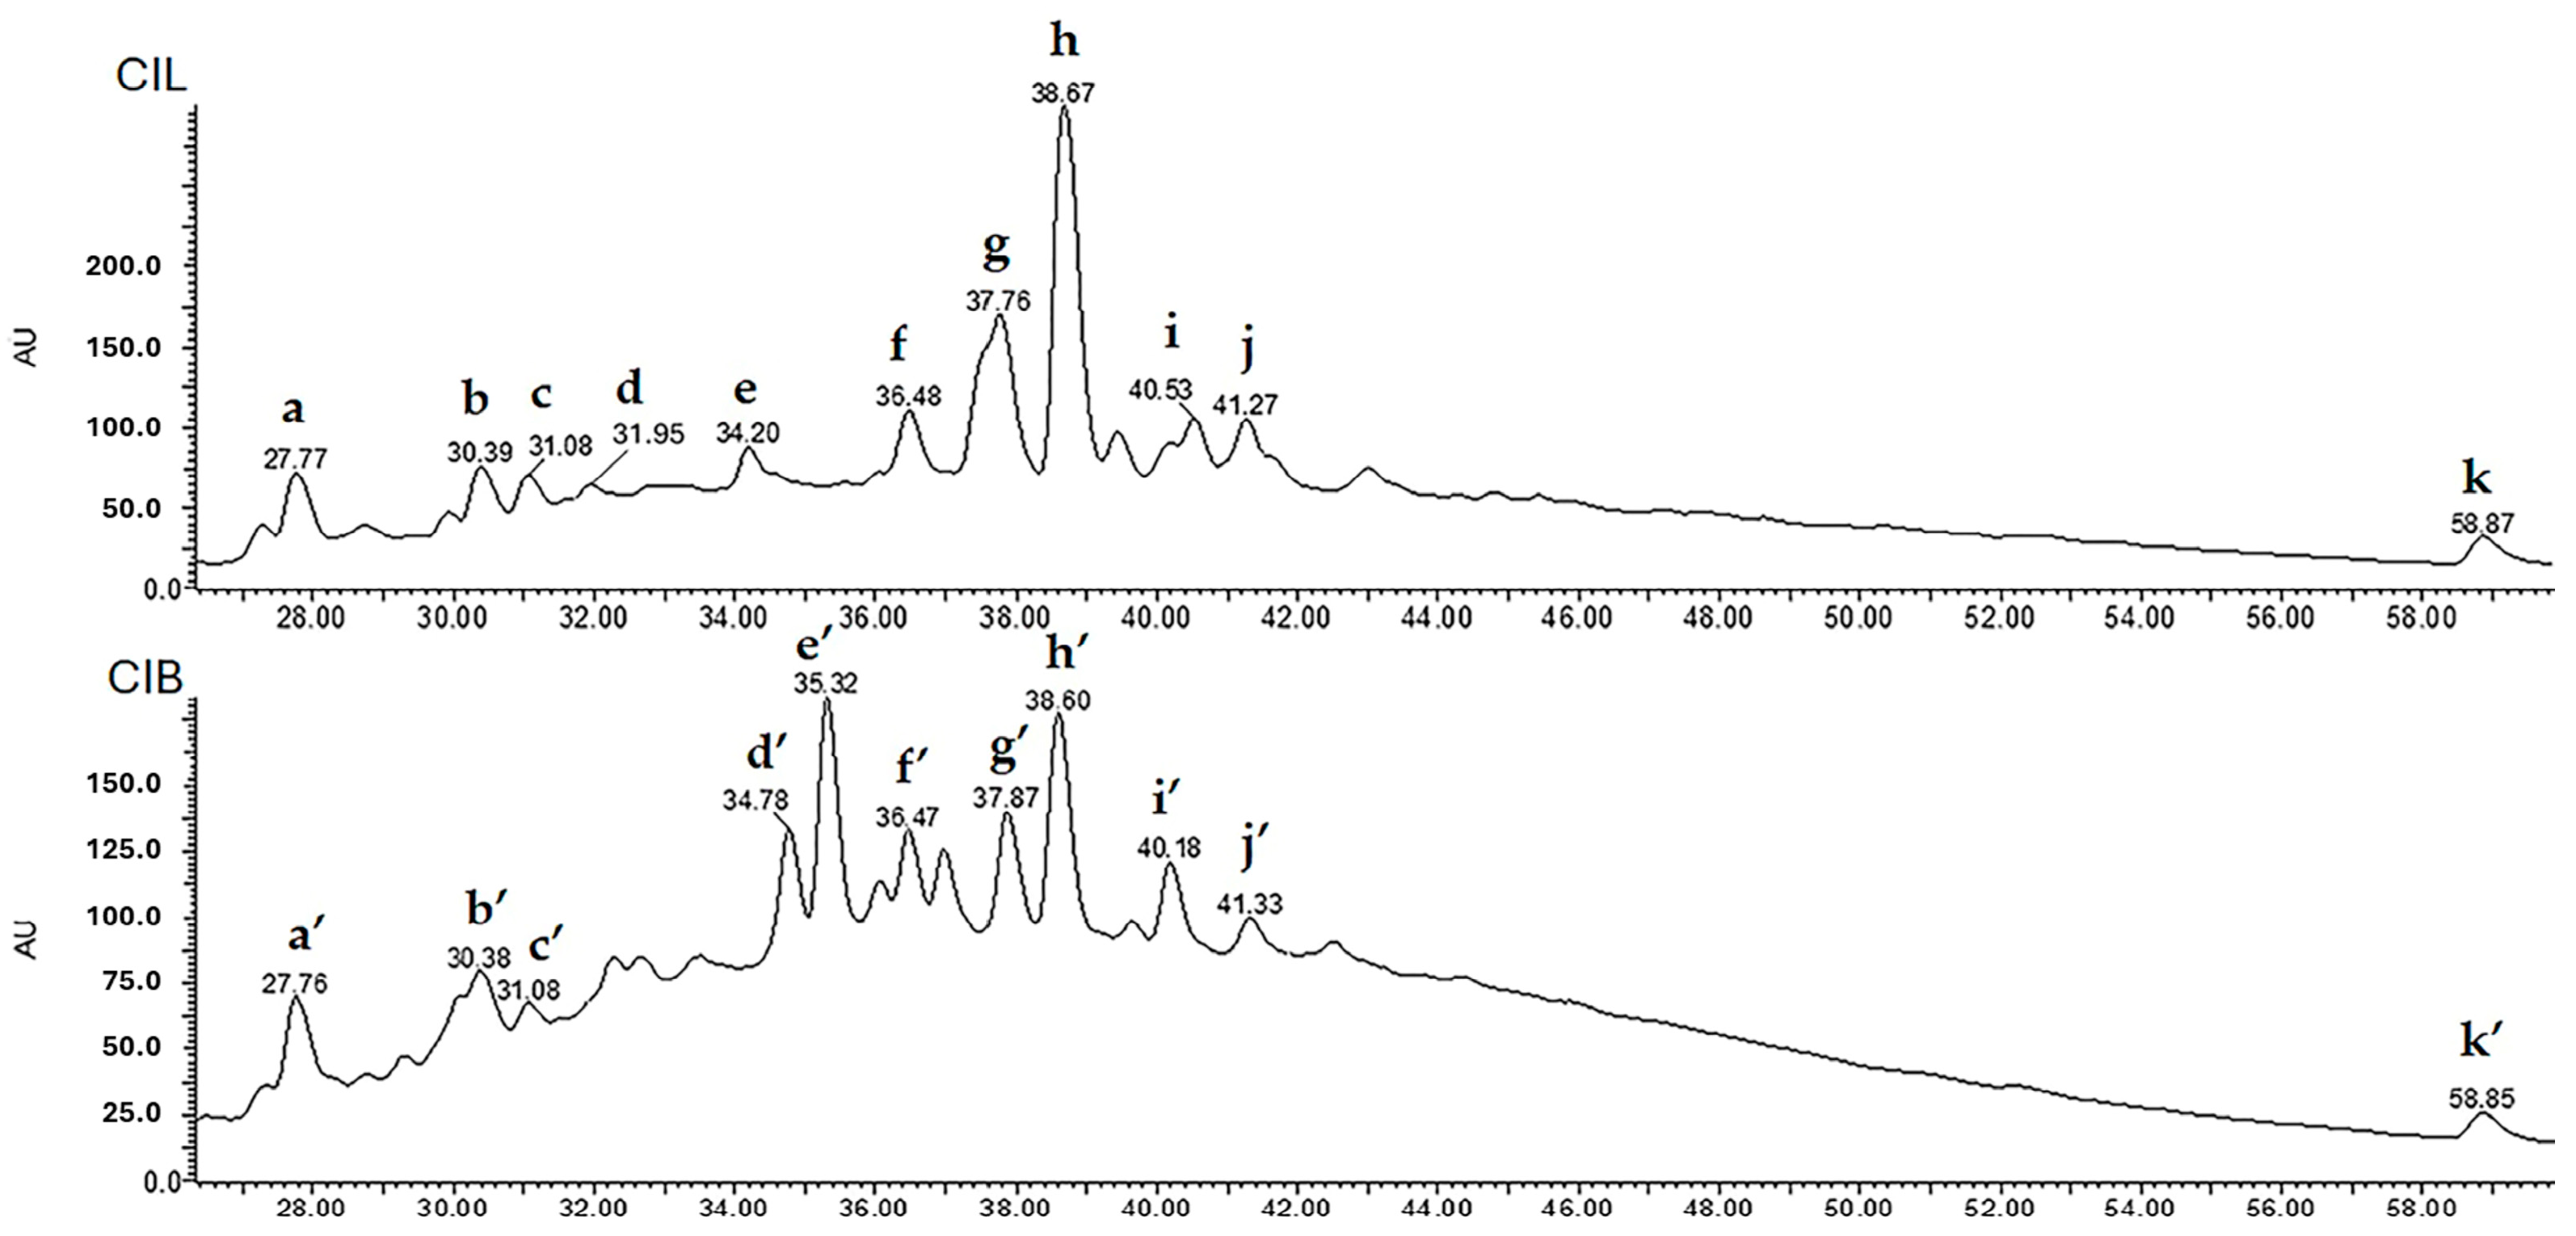
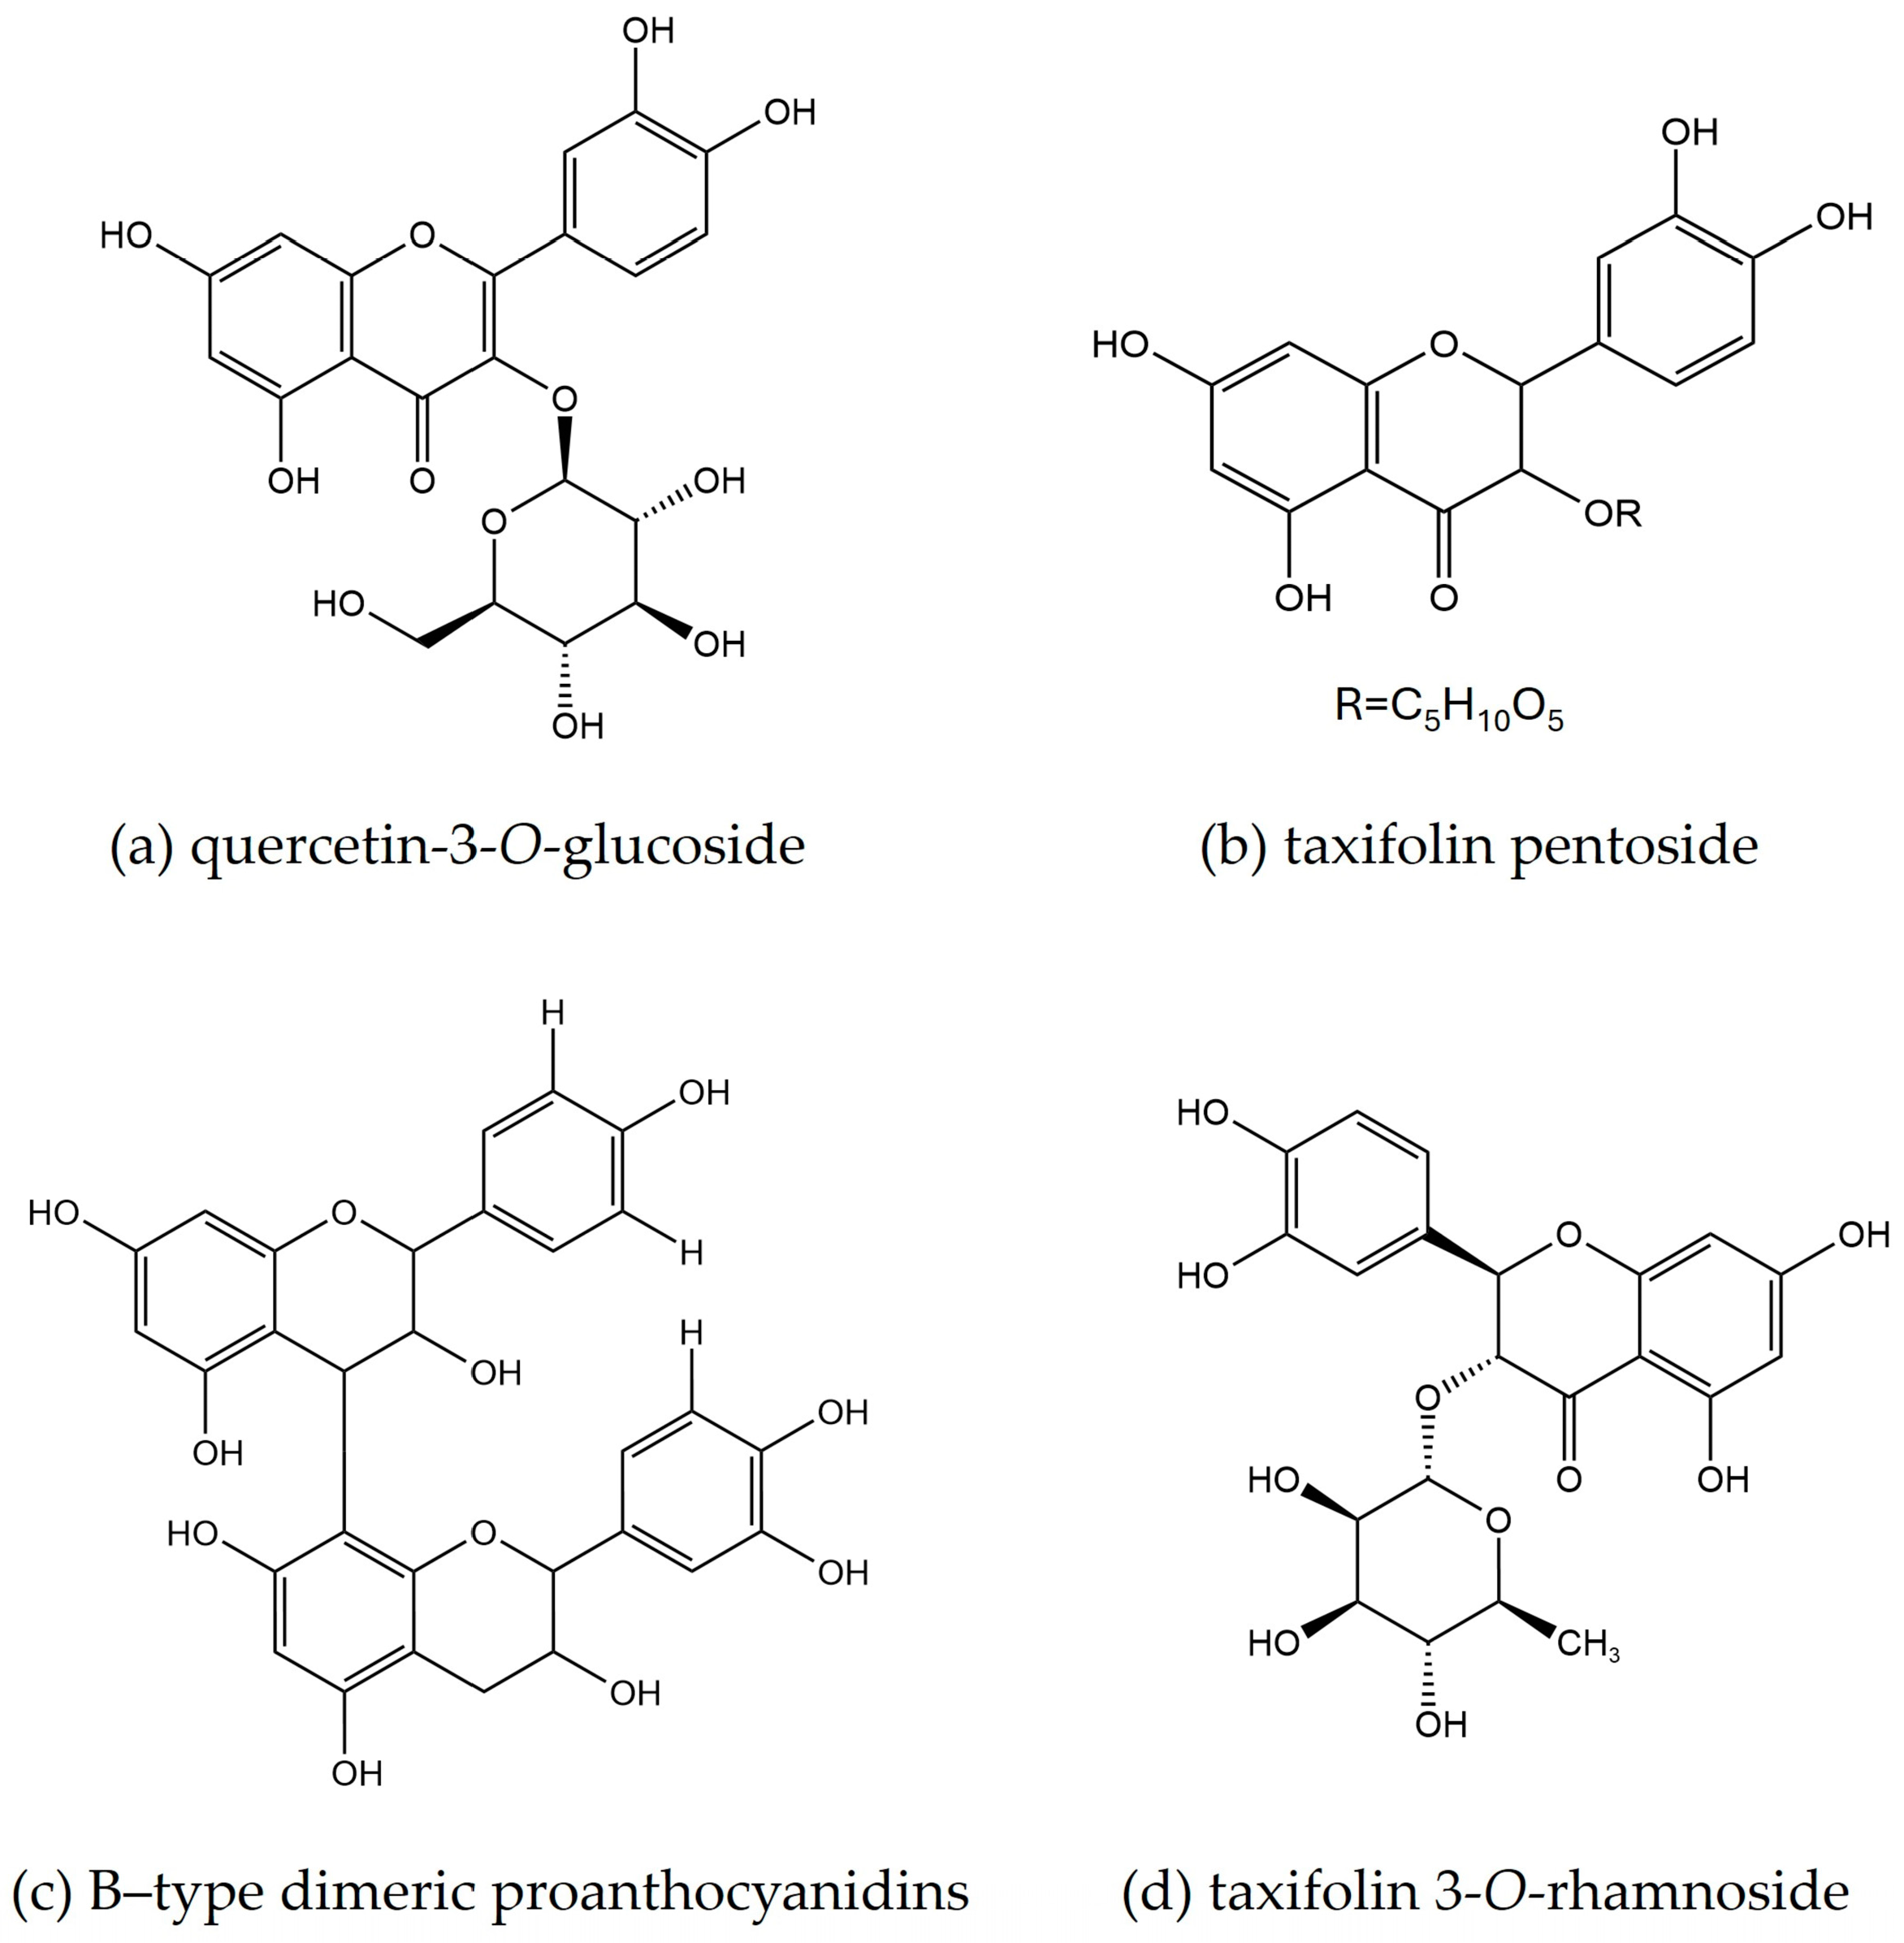
2.3.3. LC-UV/DAD-ESI/MS Fingerprint
2.3.4. Quantitative Phytochemical Analysis
2.4. Antioxidant Activity
2.4.1. DPPH Scavenging Activity
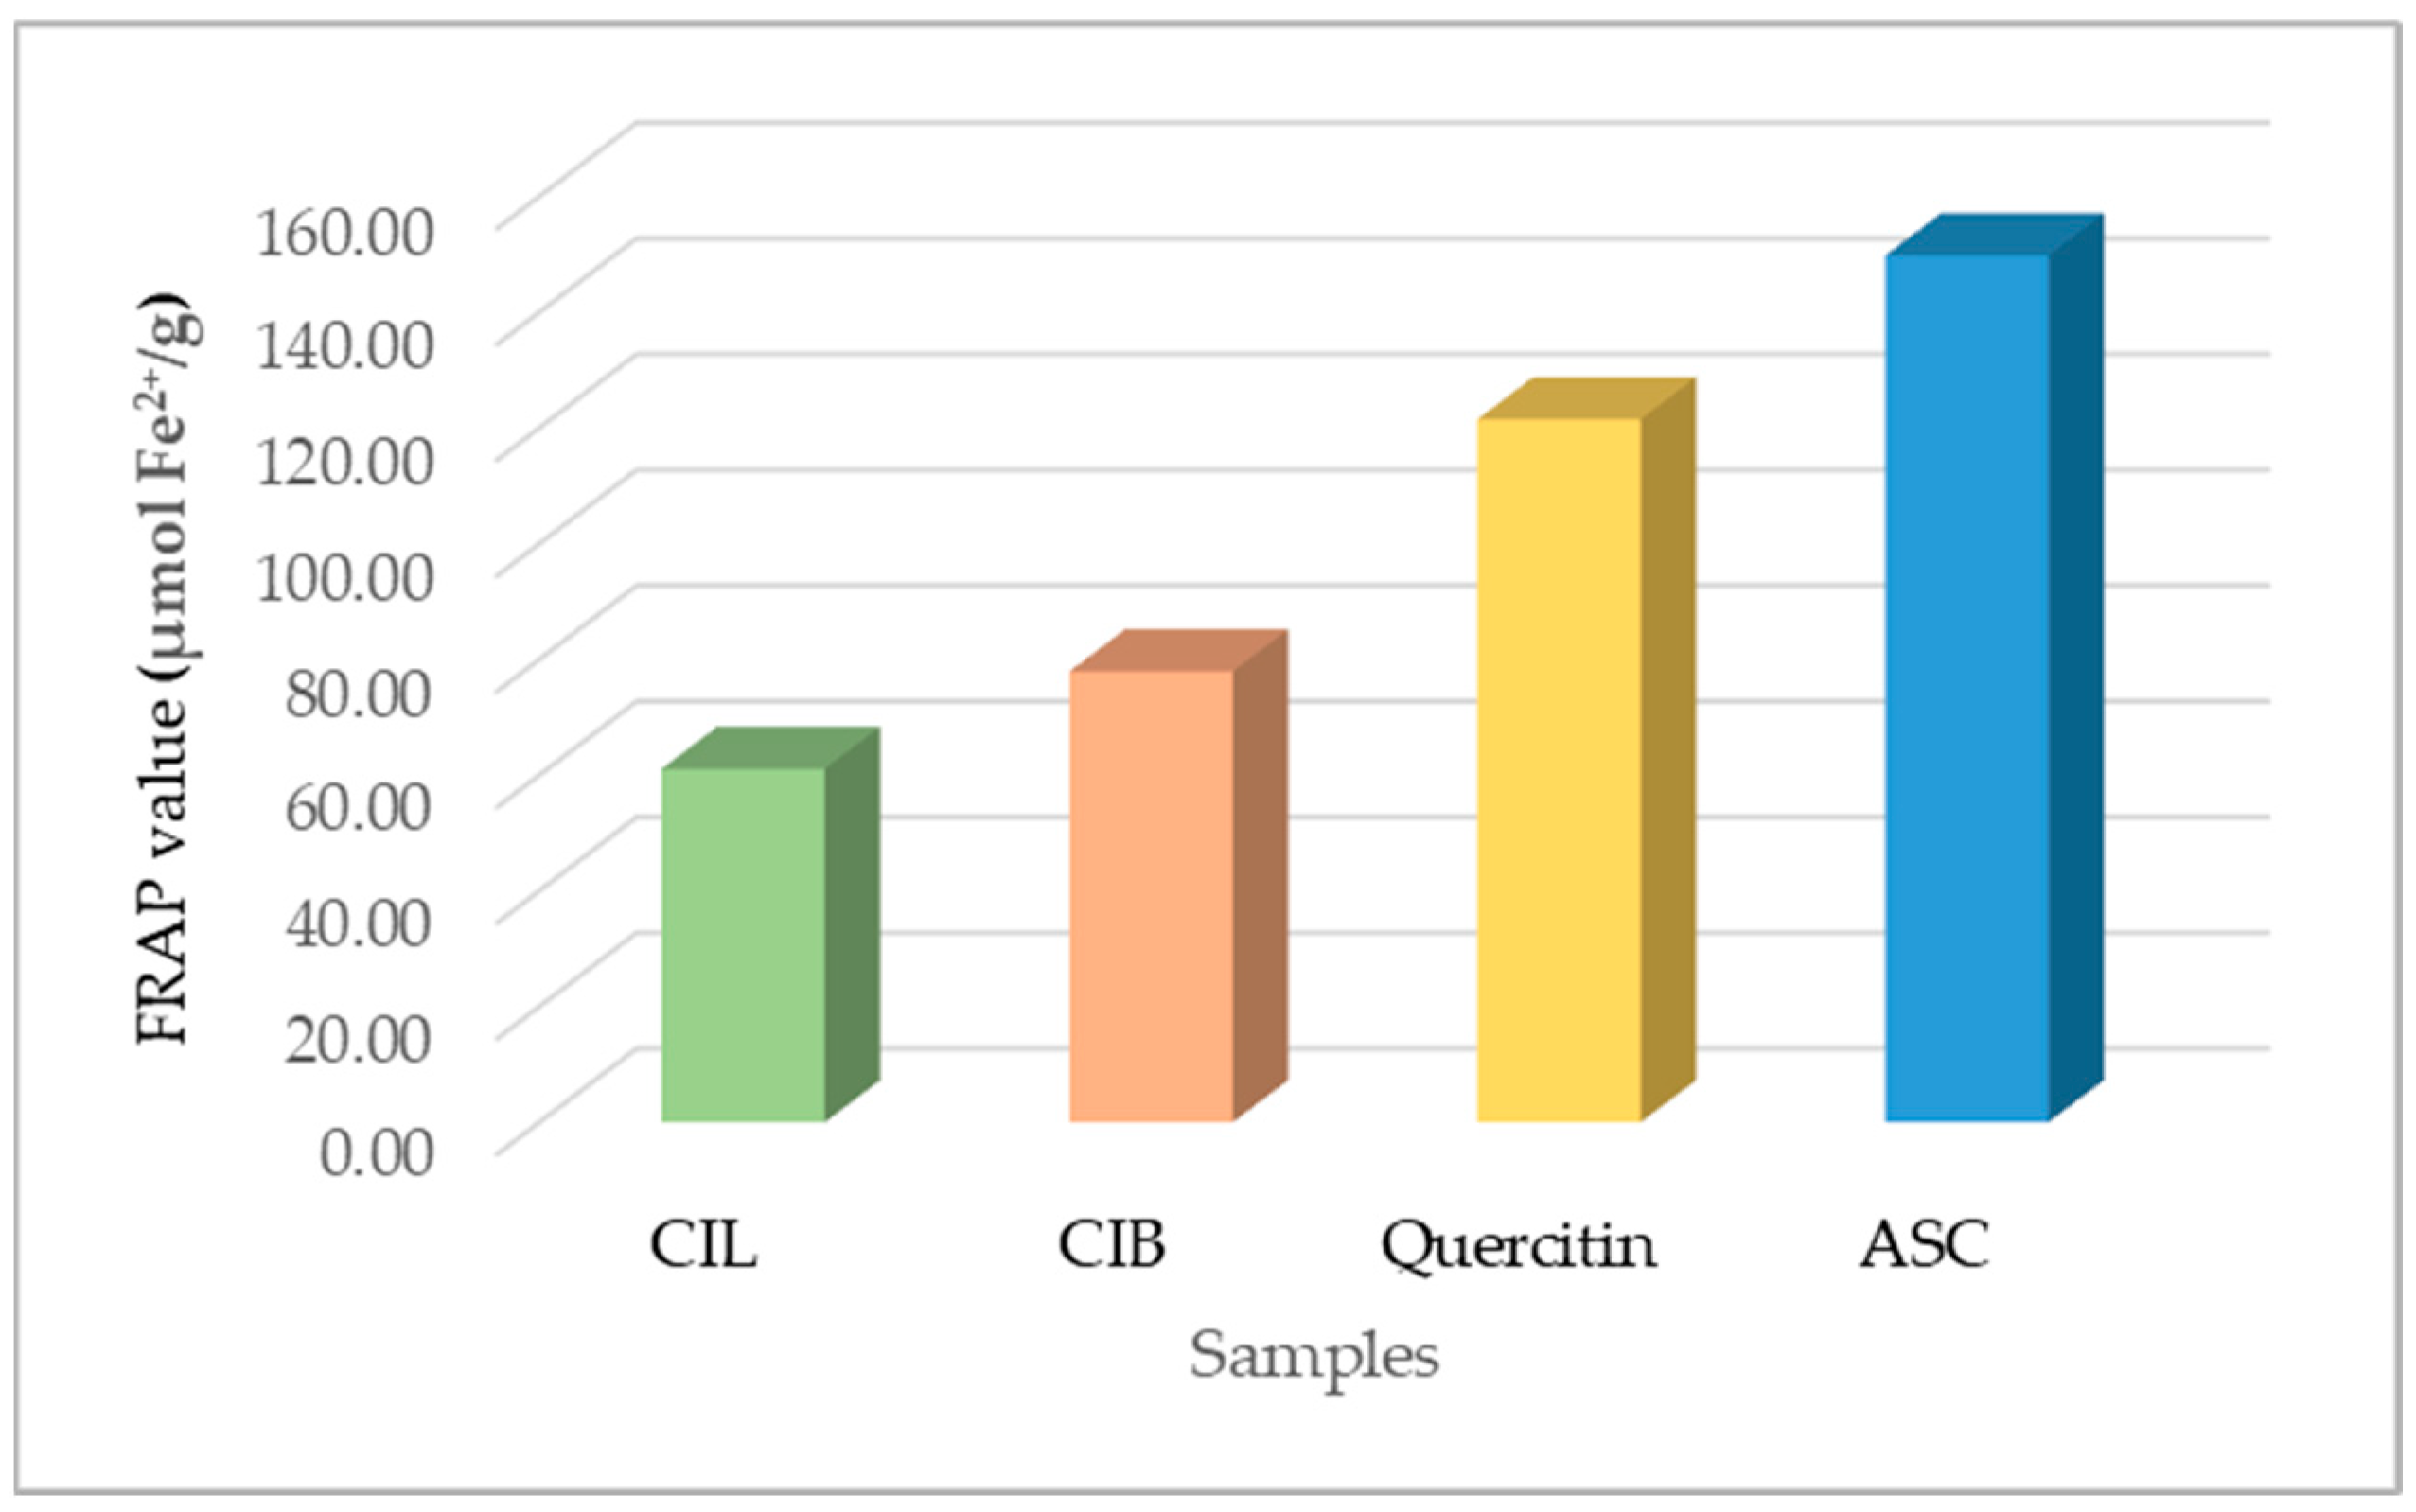
2.4.2. Ferric Reducing Capability
2.5. Correlation between Phenolic Content and Antioxidant Activity
3. Discussion
4. Materials and Methods
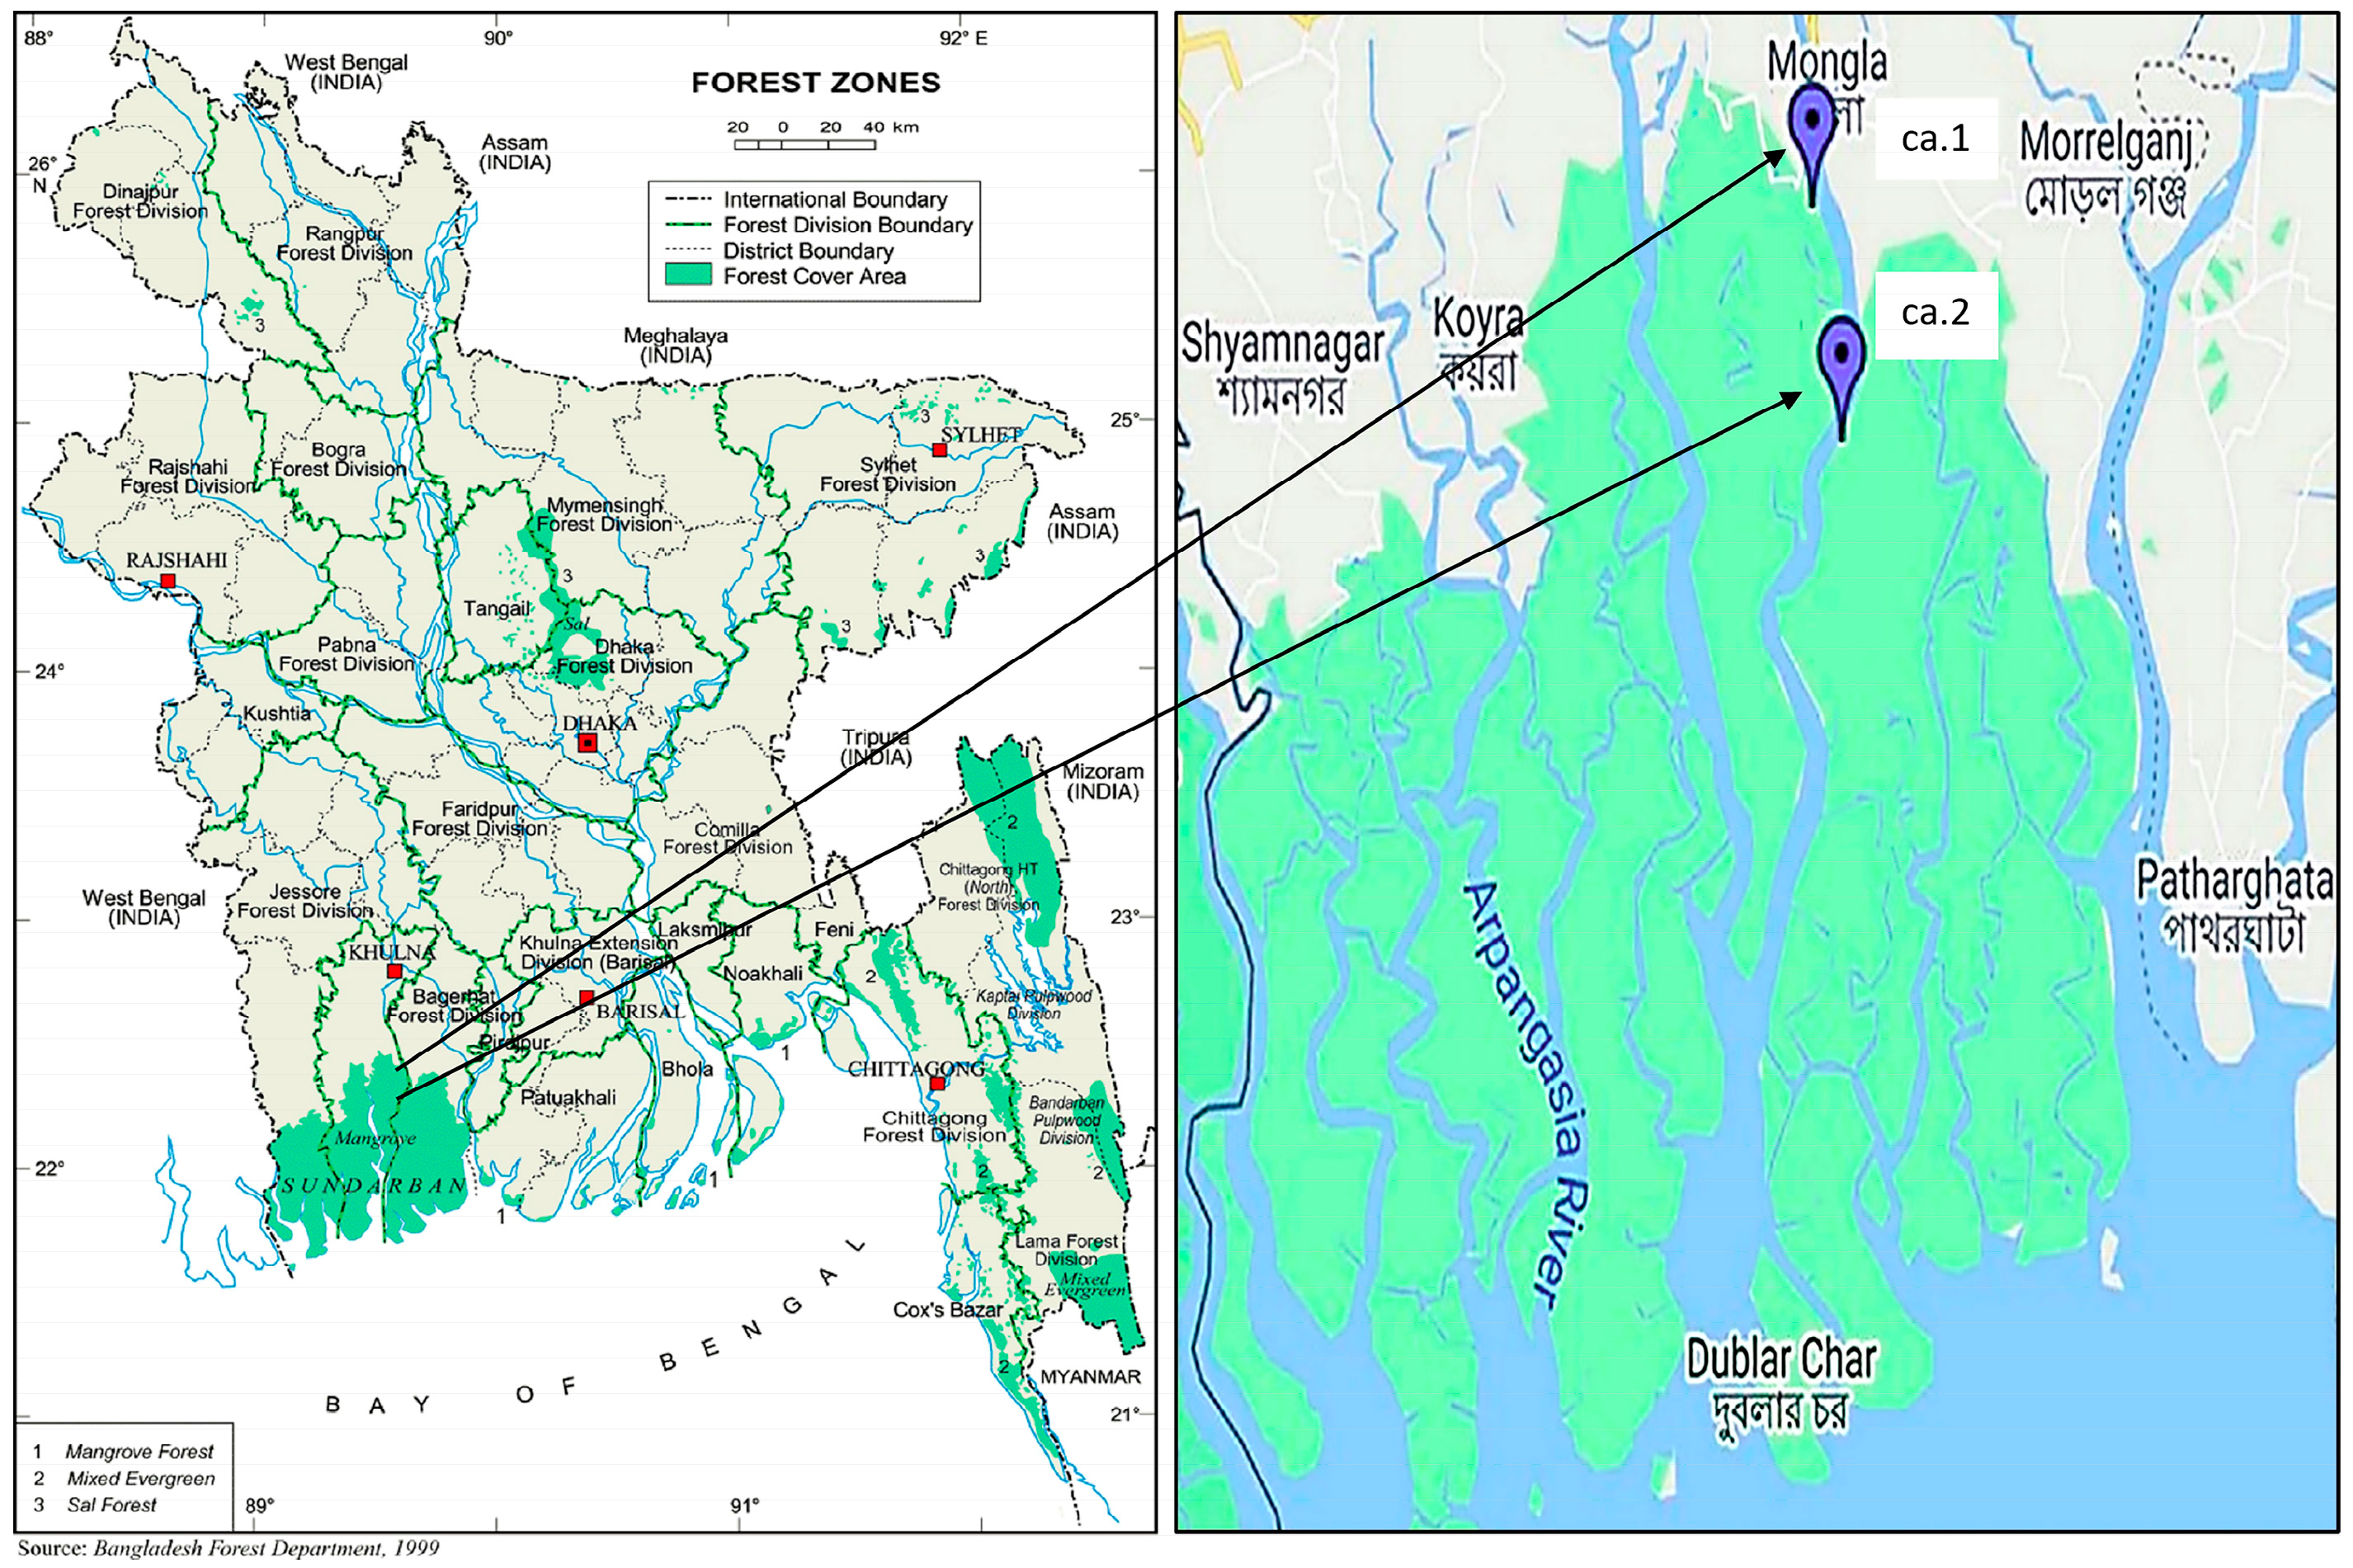
4.1. Plant Materials
4.2. Botanical Studies
4.2.1. Samples
4.2.2. Macroscopic Analysis
4.2.3. Microscopic Analysis
4.3. Chemical Studies
Plant Extract Preparation
4.4. Qualitative Phytochemical Analysis
LC-UV/DAD-ESI/MS Analysis
4.5. Quantitative Phytochemical Analysis
- Total phenolic content
- Total flavonoid content
- Total condensed tannin content
4.6. Antioxidant Activity
4.6.1. DPPH (2,2-Diphenyl-1-picrylhydrazyl) Free Radical Scavenging Assay
4.6.2. FRAP Assay
4.7. Statistical Analysis
5. Conclusions
Author Contributions
Funding
Institutional Review Board Statement
Informed Consent Statement
Data Availability Statement
Acknowledgments
Conflicts of Interest
References
- The IUCN Red List of Threatened Species. Cynometra iripa. 2023. Available online: https://www.iucnredlist.org/species/178829/7619971 (accessed on 5 January 2023).
- Duke, N.C. Mangrove floristics and biogeography. In Tropical Mangrove Ecosystems; Robertson, A.I., Alongi, D.M., Eds.; American Geophysical Union: Washington, DC, USA, 1992; pp. 63–100. [Google Scholar] [CrossRef]
- Polidoro, B.A.; Carpenter, K.E.; Collins, L.; Duke, N.C.; Ellison, A.M.; Ellison, J.C.; Farnsworth, E.J.; Fernando, E.S.; Kathiresan, K.; Koedam, N.E.; et al. The loss of species: Mangrove extinction risk and geographic areas of global concern. PLoS ONE 2010, 5, e10095. [Google Scholar] [CrossRef] [PubMed]
- Bruneau, A.; Forest, F.; Herendeen, P.S.; Klitgaard, B.B.; Lewis, G.P. Phylogenetic relationships in the Caesalpinioideae (Leguminosae) as inferred from chloroplast trnL intron sequences. Syst. Bot. 2001, 26, 487–514. [Google Scholar] [CrossRef]
- Bruneau, A.; Mercure, M.; Lewis, G.P.; Herendeen, P.S. Phylogenetic patterns and diversification in the Caesalpinioid legumes. Botany 2008, 86, 697–718. [Google Scholar] [CrossRef]
- Mackinder, B.A.; Saslis-Lagoudakis, H.; Wieringa, J.J.; Devey, D.; Forest, F.; Bruneau, A. The tropical African legume Scorodophloeus clade includes two undescribed Hymenostegia segregate genera and Micklethwaitia, a rare, monospecific genus from Mozambique. S. Afr. J. Bot. 2013, 89, 156–163. [Google Scholar] [CrossRef]
- Radosavljevic, A.; Herendeen, P.S.; Mackinder, B.A. Phylogeny of the detarioid legume genera Cynometra and Maniltoa (Leguminosae). Syst. Bot. 2017, 42, 670–679. [Google Scholar] [CrossRef]
- De la Estrella, M.; Forest, F.; Klitgård, B.; Lewis, G.P.; Mackinder, B.A.; de Queiroz, L.P.; Wieringa, J.J.; Bruneau, A. A new phylogeny-based tribal classification of subfamily Detarioideae, an early branching clade of florally diverse tropical arborescent legumes. Sci. Rep. 2018, 8, 6884. [Google Scholar] [CrossRef] [PubMed]
- POWO (Plants of the World Online). Facilitated by the Royal Botanic Gardens, Kew. 2017. Available online: https://powo.science.kew.org/ (accessed on 5 November 2021).
- LPWG (The Legume Phylogeny Working Group). A new subfamily classification of the Leguminosae based on a taxonomically comprehensive phylogeny. Taxon 2017, 66, 44–77. [Google Scholar] [CrossRef]
- Meeuwen, M.S.K. A revision of four genera of the tribe Leguminosae–Caesalpinioideae–Cynometreae in Indomalesia and the Pacific. Blumea 1970, 18, 1–52. [Google Scholar]
- Ragavan, P.; Rana, T.S.; Ravichandran, K.; Jayaraj, R.S.C.; Sivakumar, K.; Saxena, A.; Mohan, P.M. Note on Identity and Distribution of Cynometra iripa Kostel and C. ramiflora L (Fabaceae) in the Andaman and Nicobar Islands, India. Check List 2017, 13, 805–812. [Google Scholar] [CrossRef]
- Cooper, W.E. A taxonomic revision of Cynometra L. (Fabaceae) in Australia with a new species from the wet tropics of Queensland and a range extension to the mainland. Austrobaileya 2015, 9, 393–403. [Google Scholar] [CrossRef]
- Flora and Fauna Web. Cynometra iripa Kostel, National Parks, National Parks Board, Singapore. 2023. Available online: https://www.nparks.gov.sg/florafaunaweb/flora/4/0/4007 (accessed on 5 January 2022).
- Sen, U.K.; Bhakat, R.K. Assessment of psammophytic medicinal plant diversity used among the rural communities in Coastal East Midnapore, West Bengal, India. J. Herbs Spices Med. Plants 2019, 26, 219–247. [Google Scholar] [CrossRef]
- Pattanaik, C.; Reddy, C.S.; Dhal, N.K.; Das, R. Utilisation of mangrove forests in Bhitarkanika wildlife sanctuary, Orissa. Indian J. Tradit. Knowl. 2008, 7, 598–603. [Google Scholar]
- Lalitha, P.; Sachithanandam, V.; Swarnakumar, N.S.; Sridhar, R. Review on anti-inflammatory properties of mangrove plants. Asian J. Pharm. Res. 2019, 9, 273–288. [Google Scholar] [CrossRef]
- Desai, M.N.; Chavan, N.S. Fatty acid profile of Cynometra iripa kostel. from seeds and leaves. Int. J. Pharm. Res. Dev. 2011, 2, 58–62. [Google Scholar]
- Desai, M.N.; Chavan, N.S. Bioactive compounds from seed and seed coat of Cynometra iripa a mangrove species. Univers. J. Pharm. 2014, 3, 1–5. Available online: https://www.researchgate.net/publication/270898502 (accessed on 5 January 2023).
- Sabiha, S.; Serrano, R.; Hasan, K.; Moreira da Silva, I.B.; Rocha, J.; Islam, N.; Silva, O. The Genus Cynometra: A review of ethnomedicine, chemical, and biological data. Plants 2022, 11, 3504. [Google Scholar] [CrossRef]
- Basak, U.C.; Das, A.B.; Das, P. Chlorophylls, carotenoids, proteins and secondary metabolites in leaves of 14 species of mangrove. Bull. Mar. Sci. 1996, 58, 654–659. [Google Scholar]
- Choudhury, S.; Sree, A.; Mukherjee, S.C.; Pattnaik, P.; Bapuji, M. In vitro antibacterial activity of extracts of selected marine algae and mangroves against fish pathogens. Asian Fish. Sci. 2005, 18, 285–294. [Google Scholar] [CrossRef]
- Desai, M.N.; Chavan, N.S. Antibacterial activity and phytochemical screening of Cynometra iripa kostel. Int. J. Pharma Bio Sci. 2010, 1, 1–4. [Google Scholar]
- Powar, P.S.; Chavan, S.R.; Gaikwad, D.K. Antifungal activity of mangrove bark. Int. J. Pharma Bio Sci. 2011, 2, 484–488. [Google Scholar]
- Linnaeus, C. Species Plantarum; Laurentius Salvius: Stockholm, Sweden, 1753; p. 382. [Google Scholar]
- Kosteletzky, V.F. Allgemeine Medizinisch-Pharmazeutische Flora; Verlag Von Heinrich Hoff: Mannheim, Germany, 1835; Volume 4, p. 476. [Google Scholar]
- Hellström, J.; Sinkkonen, J.; Karonen, M.; Mattila, P. Isolation and structure elucidation of procyanidin oligomers from saskatoon berries (Amelanchier alnifolia). J. Agric. Food Chem. 2007, 55, 157–164. [Google Scholar] [CrossRef] [PubMed]
- Karonen, M.; Loponen, J.; Ossipov, V.; Pihlaja, K. Analysis of procyanidins in pine bark with reversed-phase and normal-phase high-performance liquid chromatography–electrospray ionization mass spectrometry. Anal. Chim. Acta 2004, 522, 105–112. [Google Scholar] [CrossRef]
- Ado, M.A.; Abas, F.; Ismail, I.S.; Ghazali, H.M.; Shaari, K. Chemical profile and antiacetylcholinesterase, antityrosinase, antioxidant and α-glucosidase inhibitory activity of Cynometra cauliflora L. leaves. J. Sci. Food Agric. 2015, 95, 635–642. [Google Scholar] [CrossRef] [PubMed]
- Moura, F.C.S.; dos Santos Machado, C.L.; Paula, F.R.; Couto, A.G.; Ricci, M.; Cechinel-Filho, V.; Bonomini, T.J.; Sandjo, L.P.; Bresolin, T.M.B. Taxifolin stability: In silico prediction and in vitro degradation with HPLC-UV/UPLC–ESI-MS monitoring. J. Pharm. Anal. 2021, 11, 232–240. [Google Scholar] [CrossRef] [PubMed]
- Ye, L.H.; He, X.X.; Yan, M.Z.; Chang, Q. Identification of in vivo components in rats after oral administration of lotus leaf flavonoids using ultra fast liquid chromatography with tandem mass spectrometry. Anal. Methods 2014, 6, 6088–6094. [Google Scholar] [CrossRef]
- Guimarães, R.; Barros, L.; Dueñas, M.; Carvalho, A.M.; Queiroz, M.J.R.; Santos-Buelga, C.; Ferreira, I.C. Characterisation of phenolic compounds in wild fruits from Northeastern Portugal. Food Chem. 2013, 141, 3721–3730. [Google Scholar] [CrossRef]
- Pascale, R.; Acquavia, M.A.; Cataldi, T.R.I.; Onzo, A.; Coviello, D.; Bufo, S.A.; Scrano, L.; Ciriello, R.; Guerrieri, A.; Bianco, G. Profiling of quercetin glycosides and acyl glycosides in sun-dried peperoni di Senise peppers (Capsicum annuum L.) by a combination of LC-ESI(-)-MS/MS and polarity prediction in reversed-phase separations. Anal. Bioanal. Chem. 2020, 412, 3005–3015. [Google Scholar] [CrossRef] [PubMed]
- National Center for Biotechnology Information. PubChem Compound Summary for CID 10095180, Kaempferol 7-O-Glucoside. Available online: https://pubchem.ncbi.nlm.nih.gov/compound/Kaempferol-7-o-D-glucopyranoside (accessed on 17 October 2023).
- Hamed, A.I.; Al-Ayed, A.S.; Moldoch, J.; Piacente, S.; Oleszek, W.; Stochmal, A. Profiles analysis of proanthocyanidins in the argun nut (Medemia argun—An ancient Egyptian palm) by LC–ESI–MS/MS. J. Mass Spectrom. 2014, 49, 306–315. [Google Scholar] [CrossRef]
- Navarro, M.; Moreira, I.; Arnaez, E.; Quesada, S.; Azofeifa, G.; Vargas, F.; Alvarado, D.; Chen, P. Polyphenolic characterization and antioxidant activity of Malus domestica and Prunus domestica cultivars from Costa Rica. Foods 2018, 7, 15. [Google Scholar] [CrossRef]
- National Center for Biotechnology Information. PubChem Compound Summary for CID 45360047, Quercetin-3-O-Pentosyl-Pentoside. Available online: https://pubchem.ncbi.nlm.nih.gov/compound/quercetin-3-O-pentosyl-pentoside (accessed on 17 October 2023).
- National Center for Biotechnology Information. PubChem Compound Summary for CID 119258, Astilbin. Available online: https://pubchem.ncbi.nlm.nih.gov/compound/Astilbin (accessed on 17 October 2023).
- Moharram, F.A.; Marzouk, M.S.A.; Ibrahim, M.T.; Mabry, T.J. Antioxidant galloylated flavonol glycosides from Calliandra haematocephala. Nat. Prod. Res. 2006, 20, 927–934. [Google Scholar] [CrossRef]
- Silva, O.; Serrano, R. Micromorphological studies for application in the quality control of herbal medicines-some data of plants used in Mozambique. In Microscopy and Imaging Science: Practical Approaches to Applied Research and Education; Méndez-Vilas, A., Ed.; Formatex Research Center: Badajoz, Spain, 2017; pp. 231–236. [Google Scholar]
- Saenger, P.; West, P.W. Determinants of some leaf characteristics of Australian mangroves. Bot. J. Linn. Soc. 2016, 180, 530–541. [Google Scholar] [CrossRef]
- Pan, A.D.; Jacobs, B.F.; Herendeen, P.S. Detarieae sensu lato (Fabaceae) from the late Oligocene (27.23 Ma) Guang river flora of north-western Ethiopia: Oligocene ethiopian legumes. Bot. J. Linn. Soc. 2010, 163, 44–54. [Google Scholar] [CrossRef]
- Appleton, J. Evaluating the bioavailability of isoquercetin. Nat. Med. J. 2010, 2, 1–6. Available online: https://www.naturalmedicinejournal.com/journal/evaluating-bioavailability-isoquercetin (accessed on 25 January 2023).
- Lesjak, M.; Beara, I.; Simin, N.; Pintać, D.; Majkić, T.; Bekvalac, K.; Orčić, D.; Mimica-Dukić, N. Antioxidant and anti-inflammatory activities of quercetin and its derivatives. J. Funct. Foods 2018, 40, 68–75. [Google Scholar] [CrossRef]
- Hsieh, H.L.; Yu, M.C.; Cheng, L.C.; Chu, M.Y.; Huang, T.H.; Yeh, T.S.; Tsai, M.M. Quercetin exerts anti-inflammatory effects via inhibiting tumor necrosis factor-α-induced matrix metalloproteinase-9 expression in normal human gastric epithelial cells. World J. Gastroenterol. 2022, 28, 1139. [Google Scholar] [CrossRef] [PubMed]
- Aghababaei, F.; Hadidi, M. Recent advances in potential health benefits of quercetin. Pharmaceuticals 2023, 16, 1020. [Google Scholar] [CrossRef] [PubMed]
- Nile, A.; Nile, S.H.; Shin, J.; Park, G.; Oh, J.-W. Quercetin-3-Glucoside extracted from apple Pomace induces cell cycle arrest and apoptosis by increasing intracellular ROS levels. Int. J. Mol. Sci. 2021, 22, 10749. [Google Scholar] [CrossRef]
- Wang, Y.-H.; Wang, W.-Y.; Chang, C.-C.; Liou, K.-T.; Sung, Y.-J.; Liao, J.-F.; Chen, C.F.; Chang, S.; Hou, Y.C.; Chou, Y.C.; et al. Taxifolin ameliorates cerebral ischemia-reperfusion injury in rats through its anti-oxidative effect and modulation of NF-kappa B activation. J. Biomed. Sci. 2006, 13, 127–141. [Google Scholar] [CrossRef] [PubMed]
- Lei, L.; Chai, Y.; Lin, H.; Chen, C.; Zhao, M.; Xiong, W.; Zhuang, J.; Fan, X. Dihydroquercetin activates AMPK/Nrf2/HO-1 signaling in macrophages and attenuates inflammation in LPS-induced endotoxemic mice. Front. Pharmacol. 2020, 11, 662. [Google Scholar] [CrossRef] [PubMed]
- Ado, M.A.; Mediani, A.; Ismail, I.S.M.; Ghazali, H.M.; Abas, F. Flavonoids from Cynometra cauliflora and their antioxidant, α-glucosidase, and cholinesterase inhibitory activities. Chem. Nat. Compd. 2019, 55, 112–114. [Google Scholar] [CrossRef]
- Rauf, A.; Imran, M.; Abu-Izneid, T.; Patel, S.; Pan, X.; Naz, S.; Silva, A.S.; Saeed, F.; Suleria, H.A.R. Proanthocyanidins: A comprehensive review. Biomed. Pharmacother. 2019, 116, 108999. [Google Scholar] [CrossRef] [PubMed]
- Kampa, M.; Theodoropoulou, K.; Mavromati, F.; Pelekanou, V.; Notas, G.; Lagoudaki, E.D.; Nifli, A.P.; Morel-Salmi, C.; Stathopoulos, E.N.; Vercauteren, J.; et al. Novel oligomeric proanthocyanidin derivatives interact with membrane androgen sites and induce regression of hormone-independent prostate cancer. J. Pharmacol. Exp. Ther. 2011, 337, 24–32. [Google Scholar] [CrossRef] [PubMed]
- Kolodziej, H.; Kayser, O.; Latté, K.P.; Ferreira, D. Evaluation of the antimicrobial potency of tannins and related compounds using the microdilution broth method. Planta Med. 1999, 65, 444–446. [Google Scholar] [CrossRef] [PubMed]
- Barbe, A.; Ramé, C.; Mellouk, N.; Estienne, A.; Bongrani, A.; Brossaud, A.; Riva, A.; Guérif, F.; Froment, P.; Dupont, J. Effects of grape seed extract and proanthocyanidin B2 on in vitro proliferation, viability, steroidogenesis, oxidative stress, and cell signaling in human granulosa cells. Int. J. Mol. Sci. 2019, 20, 4215. [Google Scholar] [CrossRef] [PubMed]
- Thuan, N.H.; Malla, S.; Trung, N.T.; Dhakal, D.; Pokhrel, A.R.; Chu, L.L.; Sohng, J.K. Microbial production of astilbin, a bioactive rhamnosylated flavanonol, from taxifolin. World J. Microbiol. Biotechnol. 2017, 33, 36. [Google Scholar] [CrossRef] [PubMed]
- Paes, J.B.; Diniz, C.E.F.; Marinho, I.V.; de Lima, C.R. Tannin potencial evaluation of six forest species of Brazilian semi-arid region. Cerne 2006, 12, 232–238. [Google Scholar]
- Moura, V.M.; Silva, W.C.R.; Raposo, J.D.A.; Freitas-de-Sousa, L.A.; Dos-Santos, M.C.; Oliveira, R.B.; Veras Mourao, R.H. The inhibitory potential of the condensed-tannin-rich fraction of Plathymenia reticulata Benth. (Fabaceae) against Bothrops atrox envenomation. J. Ethnopharmacol. 2016, 183, 136–142. [Google Scholar] [CrossRef]
- Oliveira, F.G.D.S.; Veras, B.O.D.; Silva, A.P.S.A.D.; Araújo, A.D.D.; Barbosa, D.C.D.S.; Silva, T.D.C.M.; Ribeiro, E.R.F.R.; Maia, M.M.L.; Júnior, U.P.S.; Lima, V.L.D.M.; et al. Photoprotective activity and HPLC-MS-ESI-IT profile of flavonoids from the barks of Hymenaea martiana Hayne (Fabaceae): Development of topical formulations containing the hydroalcoholic extract. Biotechnol. Biotechnol. Equip. 2021, 35, 504–516. [Google Scholar] [CrossRef]
- Landim, L.P.; Feitoza, G.S.; da Costa, J.G. Development and validation of a HPLC method for the quantification of three flavonoids in a crude extract of Dimorphandra gardneriana. Rev. Bras. Farmacogn. 2013, 23, 58–64. [Google Scholar] [CrossRef]
- Manach, C.; Scalbert, A.; Morand, C.; Rémésy, C.; Jiménez, L. Polyphenols: Food sources and bioavailability. Am. J. Clin. Nutr. 2004, 79, 727–747. [Google Scholar] [CrossRef]
- Tapiero, H.; Tew, K.D.; Ba, G.N.; Mathe, G. Polyphenols: Do they play a role in the prevention of human pathologies? Biomed. Pharmacother. 2002, 56, 200–207. [Google Scholar] [CrossRef] [PubMed]
- Chiou, Y.S.; Wu, J.C.; Huang, Q.; Shahidi, F.; Wang, Y.J.; Ho, C.T.; Pan, M.H. Metabolic and colonic microbiota transformation may enhance the bioactivities of dietary polyphenols. J. Funct. Foods 2014, 7, 3–25. [Google Scholar] [CrossRef]
- Xiong, H.-H.; Lin, S.-Y.; Chen, L.-L.; Ouyang, K.-H.; Wang, W.-J. The Interaction between Flavonoids and Intestinal Microbes: A Review. Foods 2023, 12, 320. [Google Scholar] [CrossRef] [PubMed]
- Graefe, E.U.; Wittig, J.; Mueller, S.; Riethling, A.K.; Uehleke, B.; Drewelow, B.; Pforte, H.; Jacobasch, G.; Derendorf, H.; Veit, M. Pharmacokinetics and bioavailability of quercetin glycosides in humans. J. Clin. Pharmacol. 2001, 41, 492–499. [Google Scholar] [CrossRef] [PubMed]
- Maat, L.; Beyerman, H.C. The Imidazole alkaloids. In The Alkaloids: Chemistry and Pharmacology; Brossi, A., Ed.; Academic Press: Cambridge, MA, USA, 1984; pp. 281–333. [Google Scholar] [CrossRef]
- Waterman, P.G.; Faulkner, D.F. Imidazole alkaloids from Cynometra hankei. Phytochemistry 1981, 20, 2765–2767. [Google Scholar] [CrossRef]
- Abd Aziz, A.F.; Iqbal, M. Antioxidant activity and phytochemical composition of Cynometra cauliflora. J. Exp. Integr. Med. 2013, 3, 337–341. [Google Scholar] [CrossRef]
- Afrin, S.; Pervin, R.; Sabrin, F.; Rony, S.R.; Sohrab, M.H.; Islam, M.E.; Islam, K.D.; Billah, M.M. In vitro antioxidant activity, antimicrobial and preliminary cytotoxic activity of Cynometra ramiflora—A mangrove plant. J. Microbiol. Biotechnol. Food Sci. 2016, 6, 844–850. [Google Scholar] [CrossRef]
- Sajid, Z.I.; Anwar, F.; Shabir, G.; Rasul, G.; Alkharfy, K.M.; Gilani, A.H. Antioxidant, antimicrobial properties and phenolics of different solvent extracts from bark, leaves and seeds of Pongamia pinnata (L.) Pierre. Molecules 2012, 17, 3917–3932. [Google Scholar] [CrossRef] [PubMed]
- Mulyani, Y.; Syaputra, N.D.; Dewi, K.C.; Lili, W.; Agung, M.U.K. Total phenolic, flavonoid content and antioxidant capacity of stem bark, root, and leaves methanolic extract of Rhizophora mucronata Lam. World News Nat. Sci. 2019, 26, 118–127. [Google Scholar]
- Wong, P.L.; Fauzi, N.A.; Mohamed Sumarlin, S.N.; Abdul Hamid, N.A.; Abd Ghafar, S.Z.; Azizan, A.; Zolkeflee, N.K.Z.; Abas, F. Biological activities of selected plants and detection of bioactive compounds from Ardisia elliptica using UHPLC-Q-executive orbitrap mass spectrometry. Molecules 2020, 25, 3067. [Google Scholar] [CrossRef]
- Mallawaarachchi, M.A.L.N.; Madhujith, T.; Suriyagoda, L.D.B.; Pushpakumara, D.K.N.G. Antioxidant efficacy of selected underutilized fruit species grown in Sri Lanka. Trop. Agric. Res. 2021, 32, 68–80. [Google Scholar] [CrossRef]
- European Directorate for the Quality of Medicines, EDQM. European Pharmacopoeia, 10th ed.; Directorate for the Quality of Medicines, Council of Europe: Strasbourg, France, 2019. [Google Scholar]
- Nipun, T.S.; Khatib, A.; Ahmed, Q.U.; Nasir, M.H.M.; Supandi, F.; Taher, M.; Saiman, M.Z. Preliminary Phytochemical screening, in vitro antidiabetic, antioxidant activities, and toxicity of leaf extracts of Psychotria malayana Jack. Plants 2021, 10, 2688. [Google Scholar] [CrossRef] [PubMed]
- Le Thi, V.A.; Nguyen, N.L.; Nguyen, Q.H.; Van Dong, Q.; Do, T.Y.; Nguyen, T.K.O. Phytochemical screening and potential antibacterial activity of defatted and nondefatted methanolic extracts of Xao Tam Phan (Paramignya trimera (Oliv.) Guillaum) peels against multidrug-resistant bacteria. Scientifica 2021, 2021, 4233615. [Google Scholar] [CrossRef] [PubMed]
- Dhivya, R.; Manimegalai, K. Preliminary phytochemical screening and GC-MS profiling of ethanolic flower extract of Calotropis gigantea Linn. (Apocyanaceae). J Pharmacogn. Phytochem. 2013, 2, 28–32. [Google Scholar]
- Trease, G.E.; Evans, W.C. Pharmacognosy, 15th ed.; Saunders Publishers: London, UK, 2002; pp. 214–393. [Google Scholar]
- Scalbert, A.; Monties, B.; Janin, G. Tannins in wood: Comparison of different estimation methods. J. Agric. Food Chem. 1989, 37, 1324–1329. [Google Scholar] [CrossRef]
- Olivera, F.D.; Vina, S.Z.; Marani, C.M.; Ferreyra, R.M.; Mugridge, A.; Chaves, A.R. Effect of blanching on the quality of Brussels sprouts (Brassica olearacea L. gemmifera DC) after frozen storage. J. Food Eng. 2008, 84, 148–155. [Google Scholar] [CrossRef]
- Porter, L.J.; Hrstich, L.N.; Chan, B.G. The conversion of procyanidins and prodelphinidins to cyanidin and delphinidin. Phytochemistry 1986, 25, 223–230. [Google Scholar] [CrossRef]
- Brand-Williams, W.; Cuvelier, M.E.; Berset, C. Use of a free radical method to evaluate antioxidant activity. LWT Food Sci Tech. 1995, 28, 25–30. [Google Scholar] [CrossRef]
- Benzie, I.F.; Strain, J.J. The ferric reducing ability of plasma (FRAP) as a measure of “antioxidant power”: The FRAP assay. Anal. Biochem. 1996, 239, 70–76. [Google Scholar] [CrossRef]
- Ramful, D.; Bahorun, T.; Bourdon, E.; Tarnus, E.; Aruoma, O.I. Bioactive phenolics and antioxidant propensity of flavedo extracts of Mauritian citrus fruits: Potential prophylactic ingredients for functional foods application. Toxicology 2010, 278, 75–87. [Google Scholar] [CrossRef]


| Plant Part | Chemical Class | Compounds Name | Ref. |
|---|---|---|---|
| Leaf, seed oil | Fatty acids | leaf: arachidic acid, behenic acid, cis-11-eicosenoic acid, lauric acid, linolenic acid, myristic acid, oleic acid, pentadecanoic acid, palmitic acid, stearic acid | [18] |
| seed: arachidic acid, behenic acid, caproic acid, cis-8, 11, 14-eicosatrienoic acid, cis-13, 16-docosadienoic acid, lauric acid, lignoceric acid, linoleic acid, linolenic acid, myristic acid, oleic acid, palmitic acid, stearic acid, tricosanoic acid. | |||
| Seed, seed coat | Terpenoids | cholesta-4,6-dien-3-beta-ol, β-carotene, β-sitosterol, stigmast-4-en-3-one, squalene | [19,20] |
| Esters | 1,2-benzene dicarboxylic acid mono (2-ethylhexyl) ester, butyric acid-2-pentadecyl ester, 1,2-benzene dicarboxylic acid butyl-2-ethylhexyl ester | ||
| Fatty alcohols | 1-eicosanol, falcarinol | ||
| Phenols | 2,5-di-tert-butyl-1,4-benzoquinone, 3,5-di-tert-butyl-4-hydroxybenzaldehyde | ||
| Vitamins | vitamin E |
| Anatomical Characteristics | Min–Max | Mean ± SD | Median |
|---|---|---|---|
| Leaf | |||
| Total stomata dimensions (abaxial surface) | |||
| Length (µm) | 16.01–28.85 | 20.55 ± 2.87 | 19.66 |
| Width (µm) | 14.62–21.29 | 16.90 ± 1.83 | 16.36 |
| Adaxial epidermal cell | |||
| Length (µm) | 10.26–18.64 | 13.53 ± 2.50 | 13.24 |
| Width (µm) | 5.45–13.41 | 8.52 ± 1.79 | 8.52 |
| Abaxial epidermal cell | |||
| Length (µm) | 12.84–34.20 | 20.84 ± 5.97 | 18.86 |
| Width (µm) | 8.37–15.95 | 11.33 ± 1.70 | 11.18 |
| Cross-sectional Features | |||
| Total mesophyll length (µm) | 108.38–164.37 | 132.25 ± 15.24 | 131.62 |
| Xylem vessel diameter (µm) | 9.19–21.21 | 13.50 ± 3.43 | 12.31 |
| Calcium oxalate prismatic crystals width (µm) | 3.53–8.70 | 5.89 ± 1.32 | 6.19 |
| Stomatal Index | 20.15 ± 3.44 | ||
| Bark | |||
| Schlerid cell wall thickness (µm) | 4.62–11.50 | 7.65 ± 2.15 | 7.13 |
| Starch diameter (µm) | 3.93–7.95 | 6.24 ± 1.05 | 6.37 |
| Calcium oxalate prismatic crystals width (µm) | 4.90–13.12 | 8.24 ± 1.57 | 7.86 |
| Parts Used | Weight (g) | Yield of Extract in % | DER (m/m) |
|---|---|---|---|
| CIL | 200 | 14.9 | 6.71:1 |
| CIB | 17.6 | 5.68:1 |
| Phytoconstituents | Test | Results | |
|---|---|---|---|
| CIL | CIB | ||
| Alkaloids | Bouchardat/Mayer/Dragendorff | − | − |
| Phenolic compounds | Ferric chloride test | + | + |
| Acetic acid test | + | + | |
| Saponins | Foam test | + | + |
| Plant Part | Peak | tR (min) | λmax (nm) | MW | [M − H]− (m/z) | Fragment Ions (m/z) | Tentative Assignment |
|---|---|---|---|---|---|---|---|
| CIL | a | 27.77 | 218, 223, 279 | 1155 | 1154 | 865, 577, 425, 287 | B-type proanthocyanidin (tetramer) |
| b | 30.39 | 218, 223, 279 | 866 | 865 | 577, 289 | B-type proanthocyanidin (trimer) | |
| c | 31.08 | 218, 223, 279 | 1443 | 1442 | 1154, 865, 577, 289 | B-type proanthocyanidin (pentamer 1) | |
| d | 31.95 | 218, 223, 279 | 1443 | 1442 | 1154, 865, 577, 289 | B-type proanthocyanidin (pentamer 2) | |
| e | 34.20 | 223, 284 | 436 | 435 | 303, 285, 151 | taxifolin pentoside isomer 1 | |
| f | 36.48 | 223, 285 | 436 | 435 | 303, 285, 151 | taxifolin pentoside isomer 2 | |
| g | 37.76 | 223, 268, 284, 351 | 464 | 463 | 435, 303, 285, 152 | quercetin 3-O-glucoside | |
| h | 38.67 | 223, 289 | 436 | 435 | 303, 285, 151 | taxifolin pentoside isomer 3 | |
| i | 40.53 | 218, 268, 284, 351 | 434 | 433 | 301 | quercetin 7-O-pentoside/apioside | |
| j | 41.27 | 218, 268, 284, 347 | 448 | 447 | 285 | kaempferol 7-O-glucoside | |
| k | 58.85 | 223, 269, 334 | 270 | 269 | 269, 89 | apigenin |
| Plant Part | Peak | tR (min) | λmax (nm) | MW | [M − H]− (m/z) | Fragment Ions (m/z) | Tentative Assignment |
|---|---|---|---|---|---|---|---|
| CIB | a′ | 27.76 | 221, 279 | 1155 | 1154 | 865, 577, 425, 289 | B-type proanthocyanidin (tetramer 1) |
| b′ | 30.38 | 221, 280 | 866 | 865 | 577, 289 | B-type proanthocyanidin (trimer 1) | |
| c′ | 31.08 | 221, 280 | 1155 | 1154 | 865, 577, 425, 289 | B-type proanthocyanidin (tetramer 2) | |
| d′ | 34.78 | 221, 227, 280, 320 | 562 | 561 | 433, 287, 273 | B-type proanthocyanidin (dimer 1) | |
| e′ | 35.32 | 221, 235, 280, 320 | 562 | 561 | 433, 287, 271 | B-type proanthocyanidin (dimer 2) | |
| f′ | 36.47 | 221, 281, 346 | 566 | 565 | 301 | quercetin-3-O-pentosyl-pentoside | |
| g′ | 37.87 | 221, 227, 286 | 450 | 449 | 303, 285, 151 | taxifolin 3-O-rhamnoside 1 | |
| h′ | 38.60 | 221, 227, 287 | 450 | 449 | 303, 285, 151 | taxifolin 3-O-rhamnoside 2 | |
| i′ | 40.18 | 221, 227, 284 | 450 | 449 | 303, 285, 151 | taxifolin 3-O-rhamnoside 3 | |
| j′ | 41.33 | 221, 228, 280, 350 | 600 | 599 | 447, 301 | quercitrin 3″-O-gallate | |
| k′ | 58.85 | 223, 269, 334 | 270 | 269 | 269, 89 | apigenin |
| Plant Extracts | TPC (mg GAE/g) | TFC (mg CE/g) | TCTC (mg CCE/g) |
|---|---|---|---|
| CIL | 1521 ± 4.71 | 64 ± 1.00 | 755 ± 4.00 |
| CIB | 1476 ± 4.09 | 82 ± 0.58 | 1021 ± 5.51 |
| CIL | |||||
|---|---|---|---|---|---|
| Variables | TPC | TFC | TCTC | DPPH | FRAP |
| TPC | 1 | ||||
| TFC | 0.96 | 1 | |||
| TCTC | 0.97 | 1.00 | 1 | ||
| DPPH | 0.85 | 0.96 | 0.94 | 1 | |
| FRAP | 0.92 | 0.99 | 0.99 | 0.99 | 1 |
| CIB | |||||
| Variables | TPC | TFC | TCTC | DPPH | FRAP |
| TPC | 1 | ||||
| TFC | 0.99 | 1 | |||
| TCTC | 0.99 | 1 | 1 | ||
| DPPH | 1.00 | 0.99 | 0.99 | 1 | |
| FRAP | 0.95 | 0.99 | 0.99 | 0.96 | 1 |
Disclaimer/Publisher’s Note: The statements, opinions and data contained in all publications are solely those of the individual author(s) and contributor(s) and not of MDPI and/or the editor(s). MDPI and/or the editor(s) disclaim responsibility for any injury to people or property resulting from any ideas, methods, instructions or products referred to in the content. |
© 2024 by the authors. Licensee MDPI, Basel, Switzerland. This article is an open access article distributed under the terms and conditions of the Creative Commons Attribution (CC BY) license (https://creativecommons.org/licenses/by/4.0/).
Share and Cite
Sabiha, S.; Hasan, K.; Lima, K.; Malmir, M.; Serrano, R.; Moreira da Silva, I.; Rocha, J.; Islam, N.; Silva, O. Quality Studies on Cynometra iripa Leaf and Bark as Herbal Medicines. Molecules 2024, 29, 2629. https://doi.org/10.3390/molecules29112629
Sabiha S, Hasan K, Lima K, Malmir M, Serrano R, Moreira da Silva I, Rocha J, Islam N, Silva O. Quality Studies on Cynometra iripa Leaf and Bark as Herbal Medicines. Molecules. 2024; 29(11):2629. https://doi.org/10.3390/molecules29112629
Chicago/Turabian StyleSabiha, Shabnam, Kamrul Hasan, Katelene Lima, Maryam Malmir, Rita Serrano, Isabel Moreira da Silva, João Rocha, Nurul Islam, and Olga Silva. 2024. "Quality Studies on Cynometra iripa Leaf and Bark as Herbal Medicines" Molecules 29, no. 11: 2629. https://doi.org/10.3390/molecules29112629
APA StyleSabiha, S., Hasan, K., Lima, K., Malmir, M., Serrano, R., Moreira da Silva, I., Rocha, J., Islam, N., & Silva, O. (2024). Quality Studies on Cynometra iripa Leaf and Bark as Herbal Medicines. Molecules, 29(11), 2629. https://doi.org/10.3390/molecules29112629