2.1. Preliminary Electrospinning Results
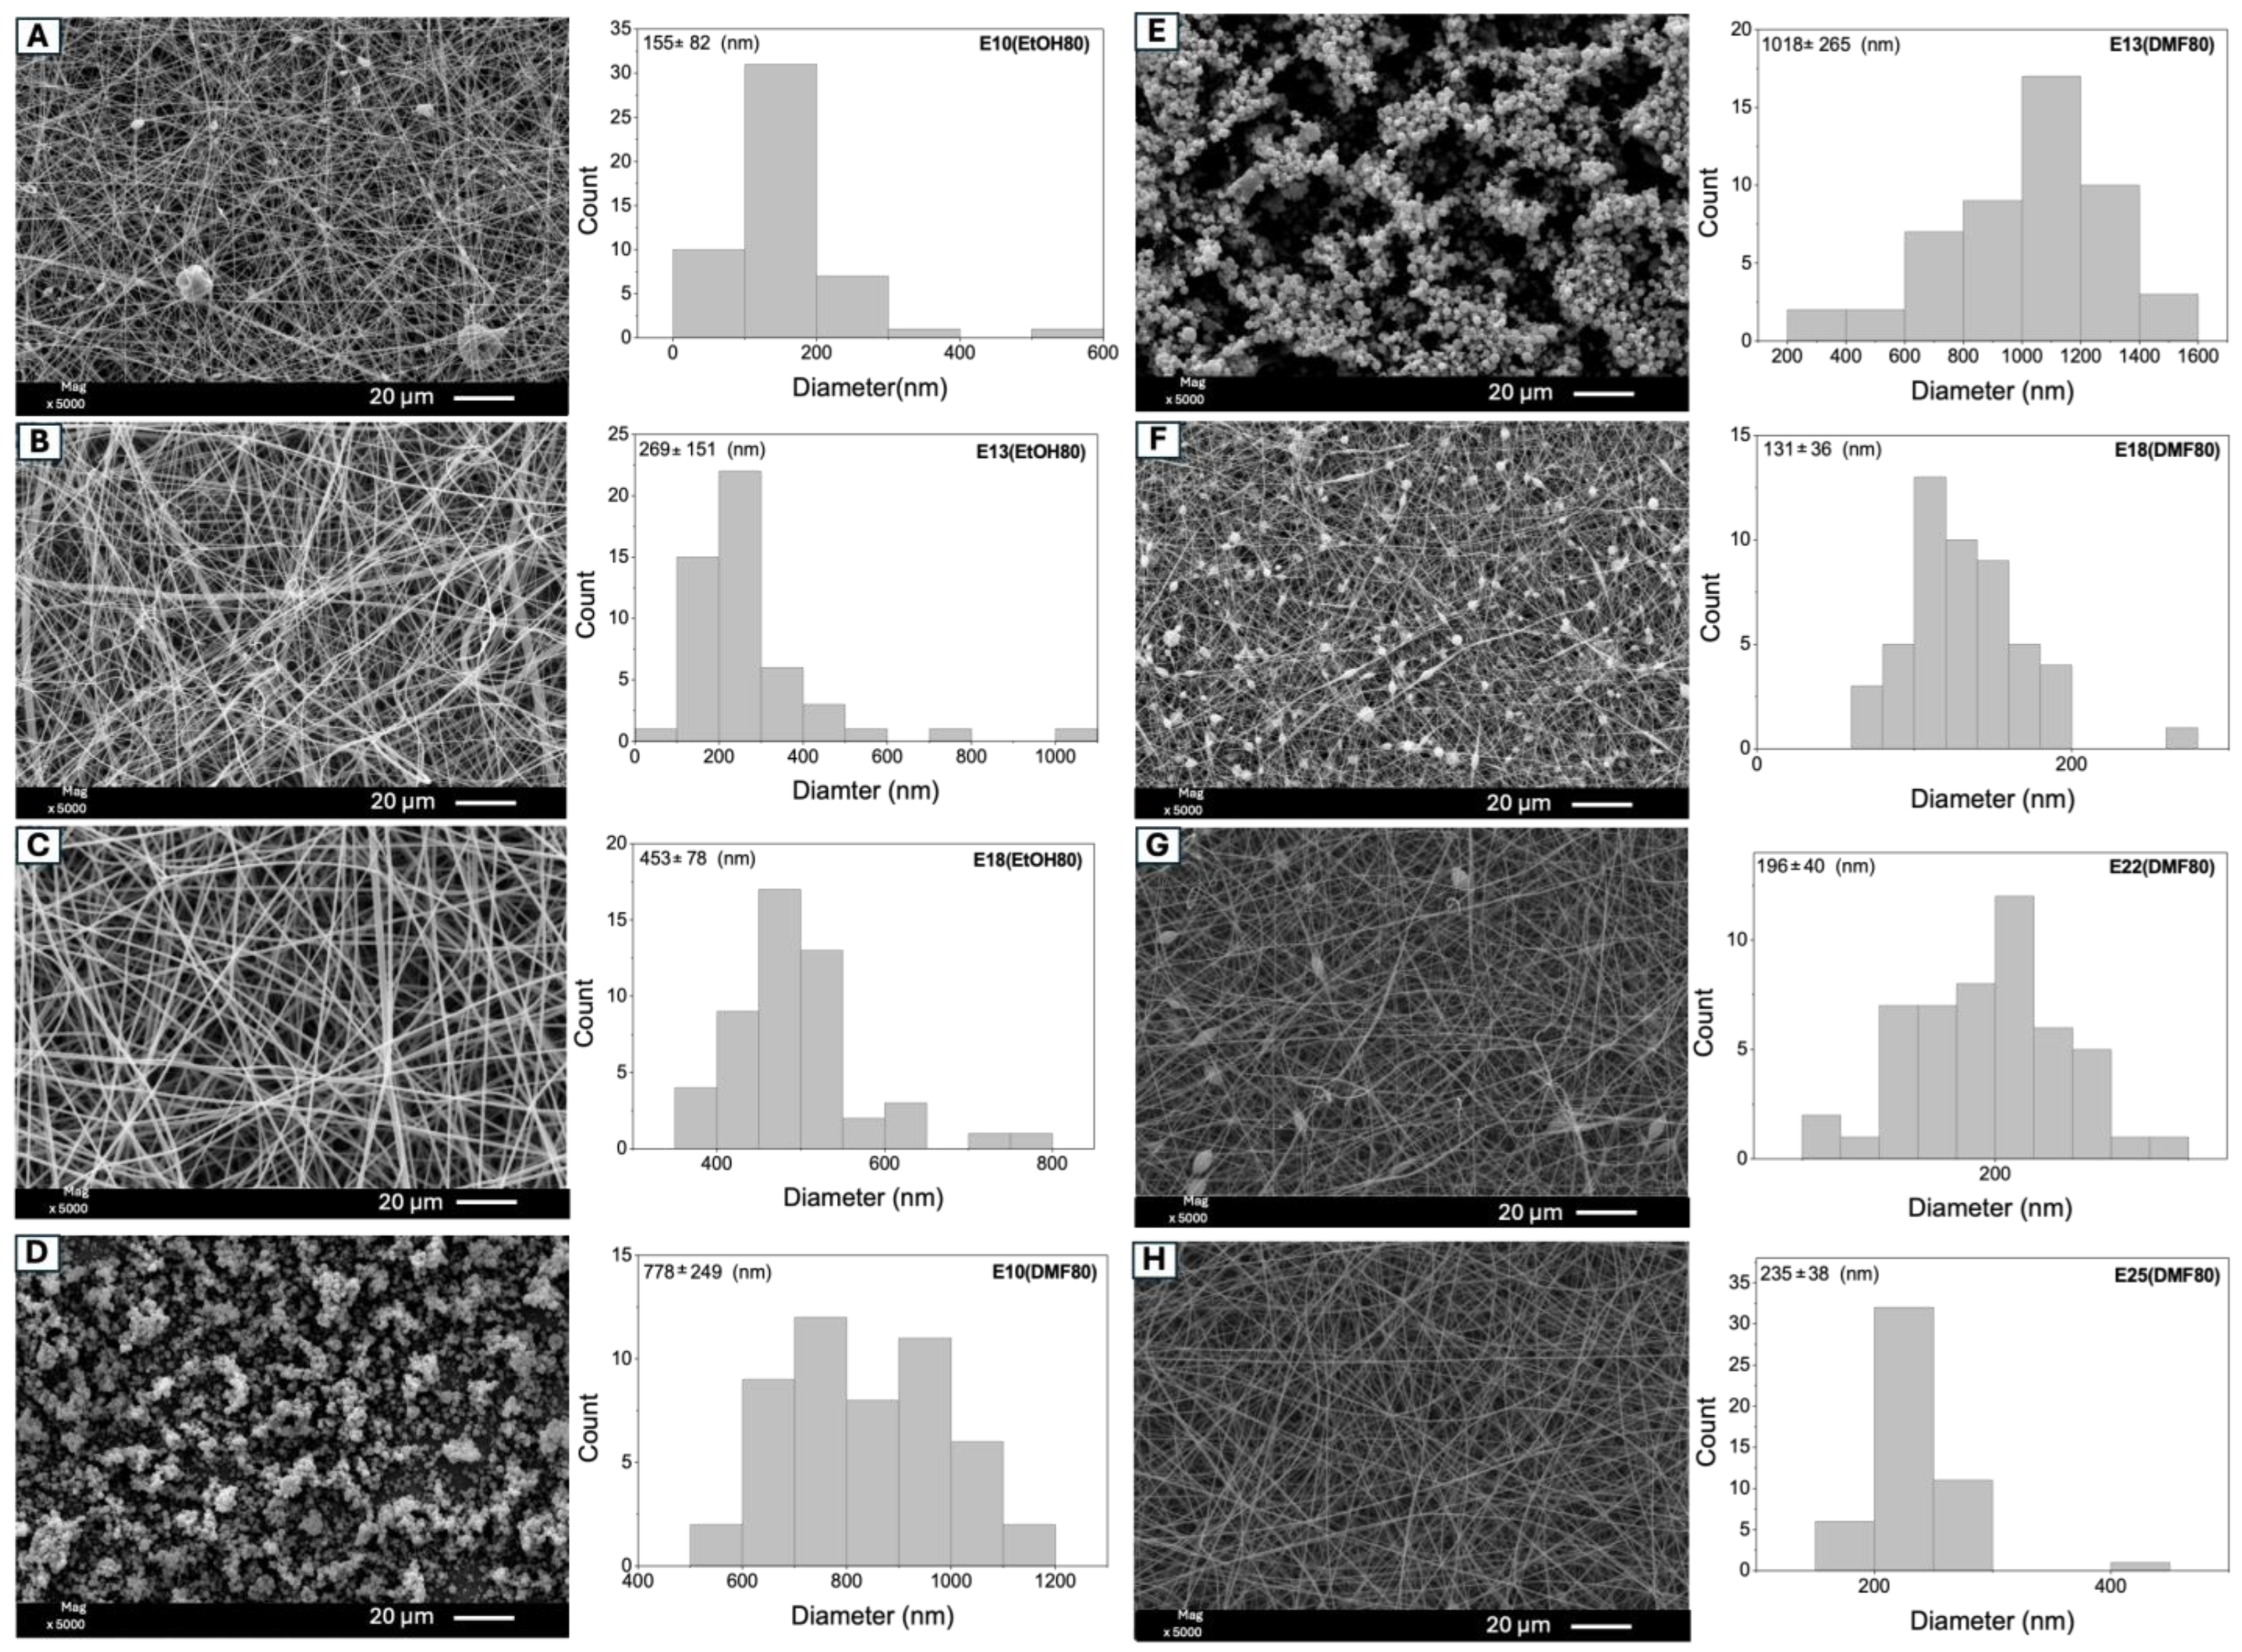
Figure 1 displays SEM images of electrospun Eudragit L100 fibers prepared under the conditions outlined in
Table 1. The samples are named based on the concentration of Eudragit L100 utilized in the solution preparation, alongside the volume/volume ratio of EtOH/DMF. The letter ‘E’ followed by the numerical value denotes Eudragit L100 and its concentration in solution, while the term within parentheses signifies the solvent in higher concentration in the binary mixture used for solution preparation. For example, sample E10(EtOH80) was derived from a solution of Eudragit L100 at 10%
w/
v in a binary EtOH/DMF mixture with 80% EtOH by volume, and sample E13(DMF80) was created from a solution of Eudragit L100 at 13%
w/
v in a DMF/EtOH mixture containing 80% DMF by volume. This naming convention extends to the other samples: the letter ‘E’ followed by the numerical value denotes Eudragit L100 and its concentration in solution, while the term within parentheses signifies the solvent in higher concentration in the binary mixture used for solution preparation.
Eudragit L100 solutions at 10, 13, and 18%
w/
v were electrospun in an EtOH/DMF mixture at volumetric ratios of 80/20 and 20/80, respectively. When the EtOH content is 80%, the electrospinning of Eudragit L100 solutions at 10 and 13%
w/
v results in non-uniform fibers. Fibers produced from the 10%
w/
v Eudragit L100 solution exhibit an average diameter of 155 ± 82 nm with beads. In contrast, the 13%
w/
v Eudragit L100 solution leads to bead-free fibers; however, their structures are not uniform, supporting an average diameter of 269 ± 151 nm. Conversely, the 18%
w/
v Eudragit L100 solution yielded more uniform fibers (453 ± 78 nm) without beads (
Figure 1 and
Table 1).
With an increase in the concentration from 10% and 13% to 18%, the polymeric chains exhibit a higher degree of entanglement, resulting in larger fiber diameters. As reported in the literature, increasing the copolymer concentration also promotes a higher electrical conductivity. When the polymeric solution has insufficient conductivity, achieving Taylor cone stability becomes more challenging. This affects the stretching of the polymeric jet, as the solution lacks sufficient charge density for fiber stretching, resulting in beaded fibers [
25].
When the DMF content is 80% in the Eudragit L100 solution, uniform fibers cannot be obtained within the 10 to 18%
w/
v concentration range. Concentrations of 10% and 13%
w/
v form beads with mean diameters of 778 ± 249 nm and 1018 ± 265 nm, respectively (
Figure 1). In this case, the dominant process is electrospraying due to the low concentration and viscosity of the polymeric solutions. These results indicate that EtOH solvent is more suitable for Eudragit L100 than DMF.
At an 18%
w/
v concentration, the copolymer macromolecules exhibit a higher degree of entanglement, resulting in better dispersion between the solvent and polymeric chains, leading to fibers with an average diameter of 131 ± 37 nm (
Figure 1 and
Table 1) The degree of polymer chain association is expected to be higher at 18%
w/
v in the EtOH/DMF 80/20 mixture compared to the DMF/EtOH 80/20 mixture. Polymer entanglements increase in solution when appropriate solvents are used to prepare the electrospun solution [
26,
27]. For example, poly(lactic acid) (
= 26,000 g/mol) solutions in chloroform produced particles via electrospraying at concentrations below 25%
w/
v, whereas fibers were formed by electrospinning at 30%
w/
v [
27]. Therefore, it is proposed to use more concentrated solutions in a DMF/EtOH 80/20 volume mixture to obtain bead-free fibers. Beaded fibers are obtained at a 22%
w/
v concentration (mean diameter of 196 ± 40 nm). Conversely, the Eudragit L100 solution at 25%
w/
v produces more homogeneous fibers (mean diameter of 235 ± 78 nm) when prepared in the DMF/EtOH 80/20 volume ratio solution (
Figure 1 and
Table 1).
The results presented in this study are consistent with those of other studies. For example, Coban et al. conducted a study in which Eudragit L100 fibers were prepared from 20%
w/
v concentration in a DMF/methanol 1:9 volume ratio. The fibers were created with a flow rate of 1.0 mL/h, a flat rectangular metallic collector positioned 20 cm away from the needle tip, and a voltage of 15 kV at 24 °C and 20% relative humidity [
28]. Despite the different experimental conditions and use of other solvents, the results of Coban et al. align with the present study’s findings. Coban et al. obtained fibers with an average diameter of 620 ± 190 nm from a 20%
w/
v Eudragit L100 solution. In this study, fibers with a mean diameter of 453 ± 78 nm were achieved by electrospinning an 18%
w/
v Eudragit L100 solution in an 80/20 EtOH/DMF volume mixture.
Giram et al. conducted a study in which Eudragit L100 fibers were prepared from 15%
w/
v solutions in an EtOH/DMF volume ratio of 80/20. The electrospinning process was carried out under the following conditions: a distance of 20 cm between the needle tip and the collector, a flow rate of 0.4 mL/h, a voltage of 20 kV, and a temperature range of 25 to 35 °C. These fibers were used as a drug carrier matrix for moxifloxacin hydrochloride for skin repair. Moxifloxacin hydrochloride was added to the polymeric solution at concentrations ranging from 1.5 to 15%
w/
v, resulting in fibers with average diameters ranging from 200 to 600 nm [
29]. Comparing the results obtained in this study with those of Giram et al., the average fiber diameter increase was observed as the concentration of the polymeric solution increased. The 13%
w/
v solution produced fibers with a mean diameter of 269 ± 151 nm, and the 18%
w/
v solution resulted in fibers with an average diameter of 453 ± 58 nm. In contrast, Giram et al. achieved fibers with an average diameter of 382 nm using a 15%
w/
v Eudragit L100 solution. It is worth noting that these results were obtained using a binary EtOH/DMF mixture solvent.
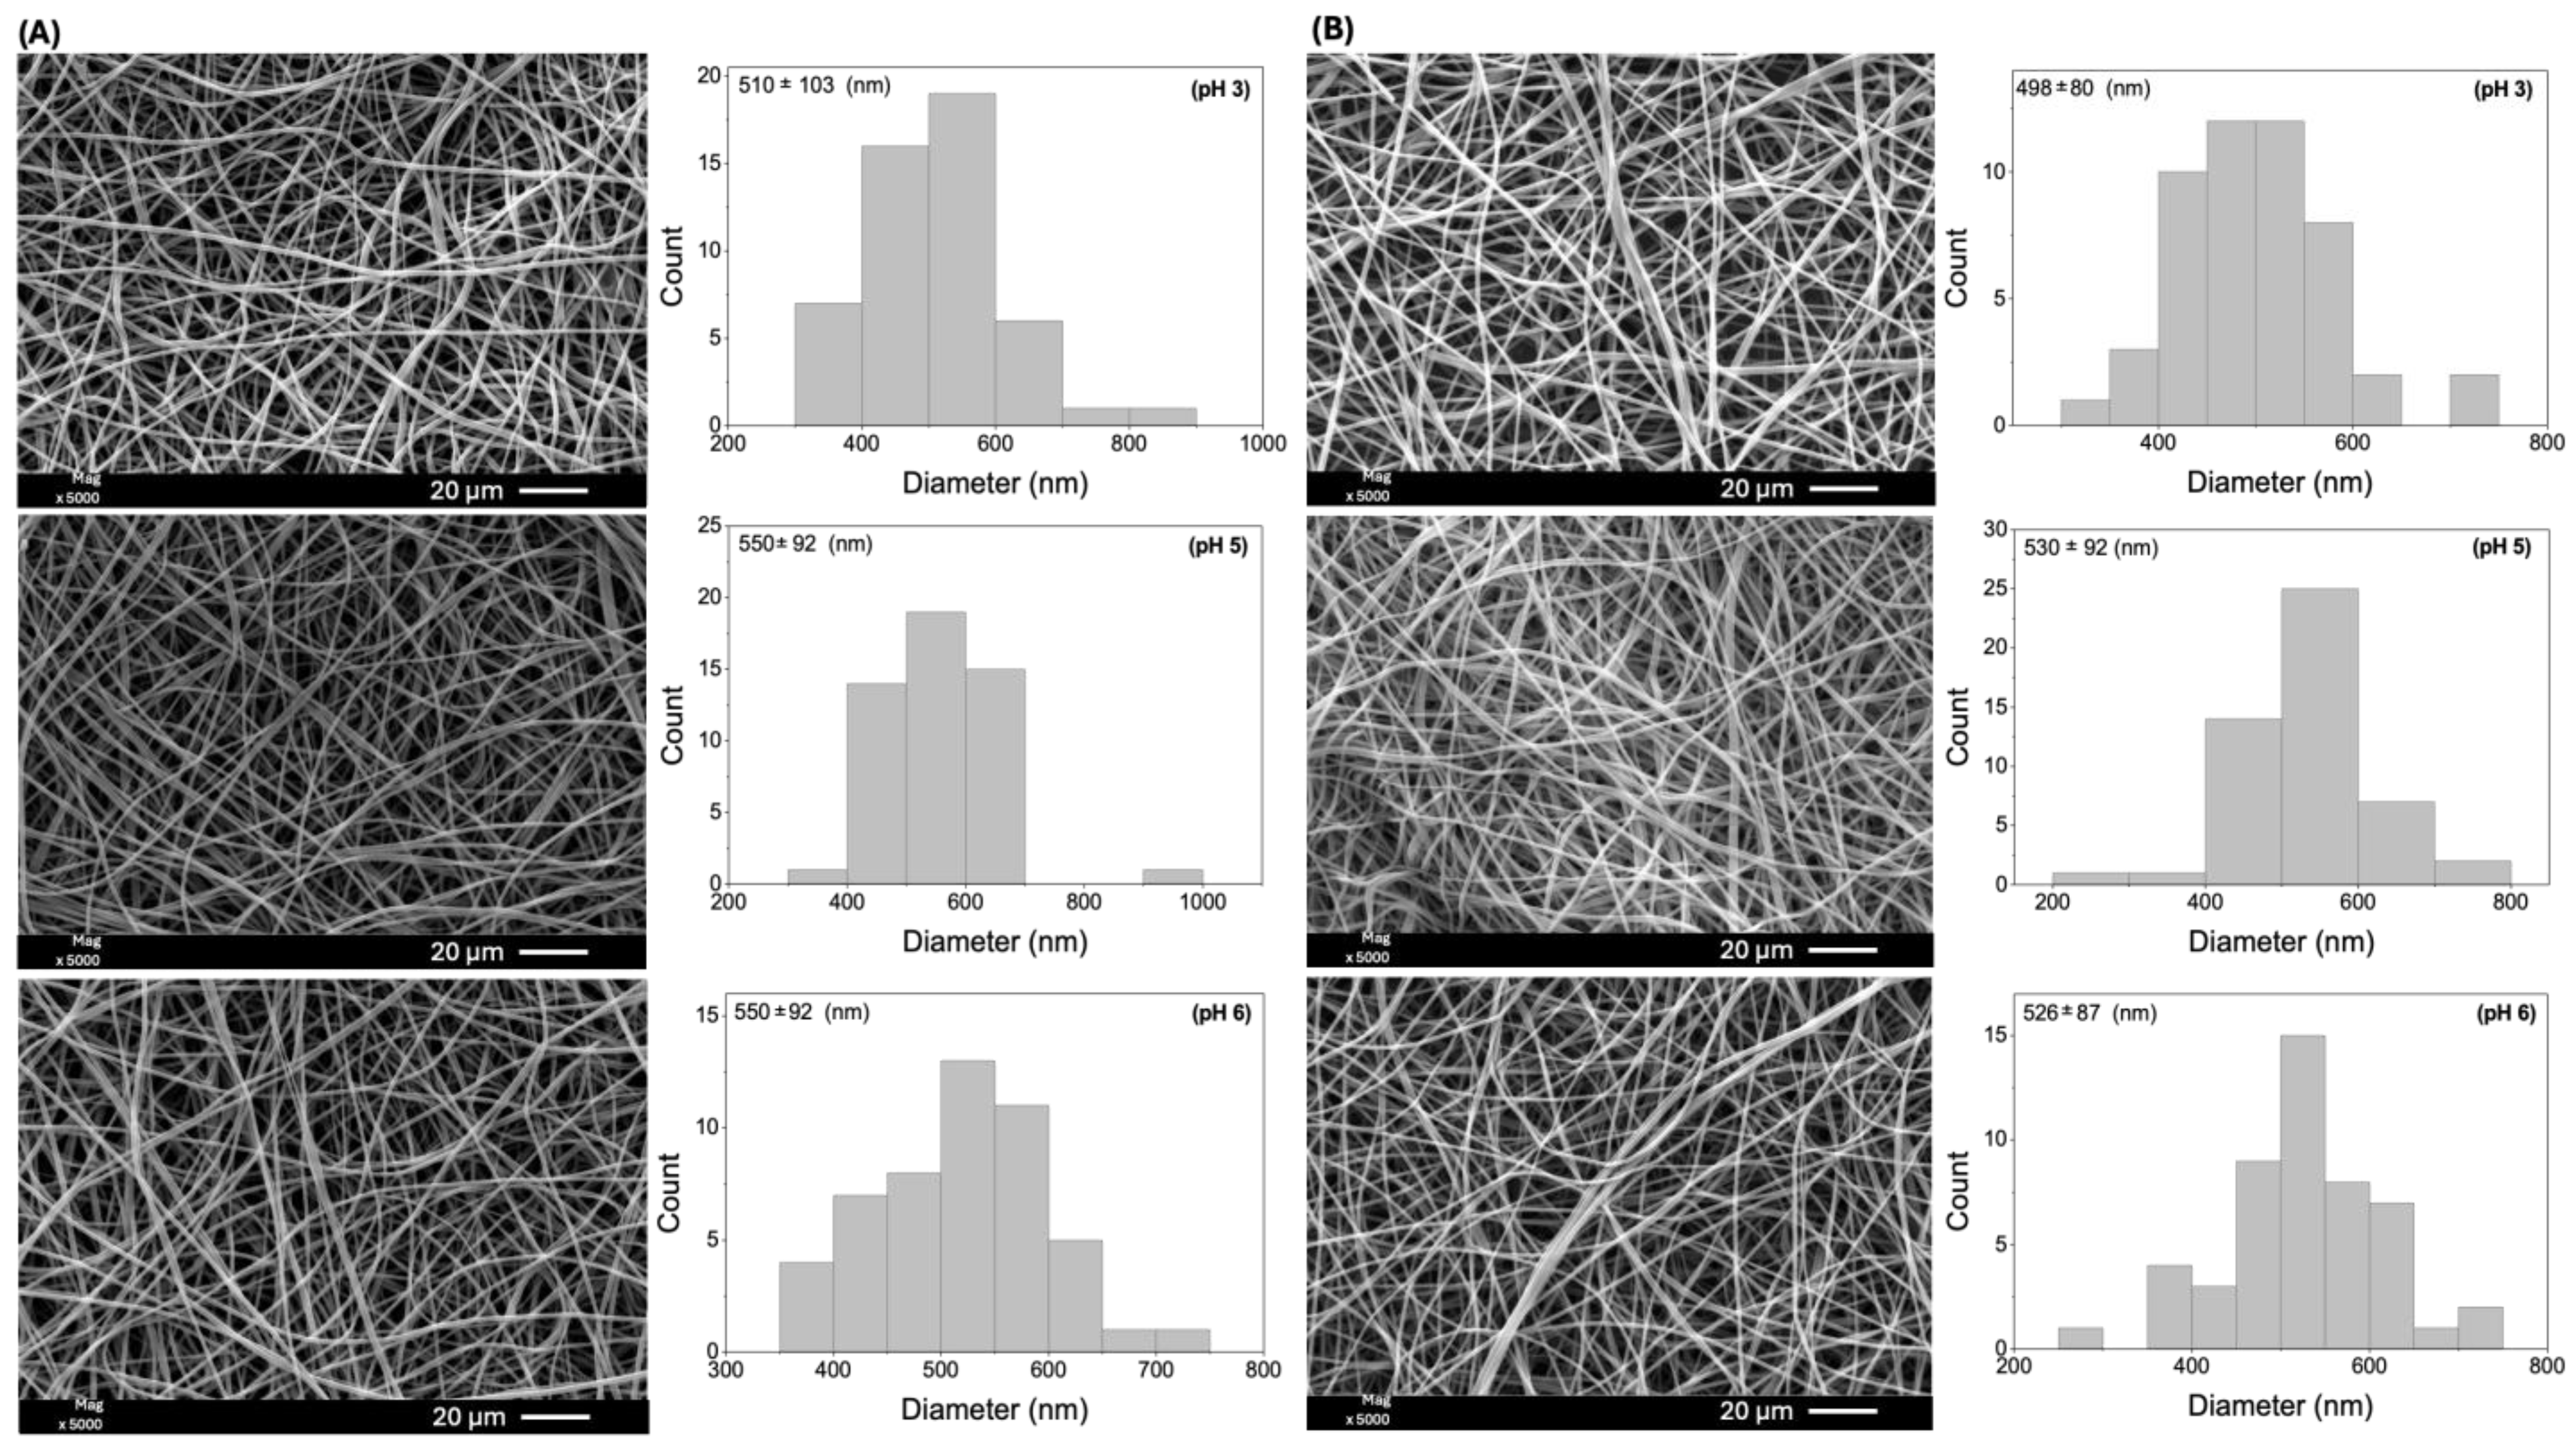
2.2. Fiber Stability
A fiber stability test was conducted on sample E18(EtOH80), which exhibited an average diameter of 453 ± 78 nm (
Figure 1). This sample was selected based on the preliminary electrospinning tests due to its homogeneous and uniform fibers without beads. Moreover, it was obtained from a lower copolymer concentration than sample E25(DMF80) (
Figure 1). The stability test involved immersing the fibers in aqueous HNO
3 solutions with pH values of 3, 5, and 6 for 1 and 5 h. SEM images of the fibers after the stability test are presented in
Figure 2.
The SEM images confirm the long-term stability of Eudragit L100 fibers in aqueous media over 5 h. The carboxylic acid groups in the Eudragit L100 repeat units have a pK
a value of approximately 6.0. The fibers could exhibit instability at pH 6.0 due to partial ionization of the polymeric chains. However, no signs of dissolution or degradation were observed, indicating the stability of the fibers with a homogeneous and uniform structure. There was some variation in the average fiber diameters compared to the mean diameters determined before the stability test. The average diameter of the as-prepared fiber was 453 ± 78 nm (before the stability test). After the stability test, the diameters increased to 510 ± 103 nm (pH 3), 496 ± 113 nm (pH 5), and 519 ± 78 nm (pH 6). The differences in the average size results were not considered statistically significant (
Figure 2).
According to the preliminary results, EtOH/DMF mixtures with a higher proportion of EtOH than DMF provide better conditions for electrospinning Eudragit L100 solutions. Therefore, mixtures with high and adjusted amounts of EtOH were selected to optimize the electrospinning process.
2.3. Optimization
As previously mentioned, several parameters play a crucial role in the electrospinning process, including the choice of solvents and the concentration of the polymer [
30]. These parameters significantly impact the morphology of the fibers, and it is important to adjust them carefully to prevent beads and achieve thin fibers [
31]. When utilizing fibers as adsorbent agents, it is essential to obtain small diameters to maximize the contact surface area between the adsorbate and the adsorbent material [
32]. To ensure effective control over this parameter, the statistical method of response surface methodology was employed [
31]. Initially, a factorial design (2
2) was applied, considering two independent variables: Eudragit L100 concentration (14%, 16%, 18%
w/
v, denoted as X
1) and EtOH/DMF solvent ratio (90/10, 85/15, and 80/20
v/
v, denoted as X
2) (
Table 2).
The model is statistically significant in explaining the data generated from the experimental trials. Analysis of variance confirms the significance of the selected model at a 95% confidence level, with
p-values below 0.05 and the
F-test exceeding the tabulated
F-value (
Table 3). Previous studies have also successfully optimized the production of thin fibers using similar parameters to those investigated in this study [
33].
The tabulated value for the
F-test (F
tab) with three degrees of freedom for the quadratic sum of the regression and the residuals at a 95% confidence level (F
3,3,95) is 9.28. The experimental
F-value (F
exp) obtained from the model is 14.06 (
Table 3). Therefore, the model’s significance is supported by the higher F
exp value compared to F
tab. Moreover, the coefficient of determination (R
2) indicates that the regression model explains approximately 93% of the total variation around the mean. When considering only the contribution of the lack of fit, a parameter directly associated with the model’s efficiency, the model accounts for 98.68% of the presented results. Hence, the model predicts the theoretical outcomes of Eudragit L100 electrospinning, specifically for optimizing the average fiber diameter.
Equation (1) presents the model regarding coded factors, enabling the fiber diameter (nm) prediction at various levels of each factor. Equation (1) comprises positive terms represented by β
0 and the interaction factor X
1X
2. Negative terms are associated with the pure factors X
1 and X
2. These positive and negative terms are related to the influence of factors on the electrospinning process, either increasing or decreasing the fiber diameter. By utilizing Equation (1), the average fiber diameter can be calculated.
The pure factors X
1 and X
2 influence the fiber diameter response more than the interaction term X
1X
2. The interaction factor does not have the same significance as the pure factors in determining the fiber diameter. This finding is consistent with the statistical analysis presented in
Table 3. The experimental
F-values for factors X
1 and X
2 are higher than the tabulated
F-value, and the probability significance test (
p) supports values below 0.05, indicating statistical significance at a 95% confidence level. The coefficient of variation for the model was calculated to be 21.79%, which is reasonable given the inherent fluctuations around the mean in diameter measurements at the nanoscale.
The system’s behavior can be visualized using the response surface and contour plot (
Figure 3) through Equation (1). The fiber diameter decreases as the concentration of Eudragit L100 reduces (
Figure 3A,B). Higher concentrations of Eudragit L100 lead to more viscous solutions (
Table 4), raising the fiber diameters (
Figure 3). Increased viscosity is desirable as long as it maintains the stability of Taylor’s cone during the electrospinning process. Solutions with high viscosity prevent solution flow, which can result in needle clogging [
27]. Conversely, low viscosity causes Taylor’s cone instability, promoting beaded fibers [
34,
35]. The response surface demonstrates that thin fibers are produced when the Eudragit L100 concentration is approximately 14%
w/
v.
The reduction in the EtOH amount in the EtOH/DMF mixture also correlates with a decrease in fiber diameter. This fact can be attributed to the solution’s conductivity changes as the EtOH/DMF ratio (
v/
v) varies from 80/20 to 90/10. The electrical conductivity of the solutions is expected to increase as the amount of EtOH reduces in the EtOH/DMF mixtures, i.e., as the concentration of DMF increases. DMF exhibits superior electrical conductivity compared to EtOH [
36]. Consequently, increasing the DMF concentration in the mixture should enhance the electrical conductivity of the solution. This parameter directly influences the formation of thin fibers by facilitating their stretching in the electrospinning process [
25].
The influence of the variables on the average fiber diameter is depicted in a two-dimensional graph (
Figure S1, Supplementary Material). Both variables X
1 and X
2 show a similar impact on the response. Decreasing the copolymer concentration and decreasing the amount of EtOH in the Eudragit L100 solution contribute to a reduction in fiber diameter. These trends are observed in
Figure S1, where mean fiber diameters ranging from 259 to 1152 nm are observed (
Table 2). Assay 1 (X
1 = 14%
w/
v and X
2 = 80/20
v/
v) yields the thinnest fibers with a diameter of 259 nm, while assay 3 (X
1 = 18%
w/
v and X
2 = 90/10
v/
v) produces the largest fibers with a mean diameter of 1152 nm (
Table 2). These findings align with the previous discussions, emphasizing that decreasing Eudragit L100 concentration and adjusting the EtOH amount are desirable to obtain thinner fibers.
2.4. Conductivity and Viscosity
Viscosity and conductivity measurements were conducted on the Eudragit L100 solutions (conditions investigated in the factorial design,
Table 2) and the EtOH/DMF mixtures at ratios of 80/20 and 20/80 (
Table 4). The electrical conductivity and viscosity are primarily influenced by the type of solvent, EtOH/DMF ratio, polymer type, and concentration.
DMF solvent exhibits higher electrical conductivity than EtOH, influencing fiber stretching and diameter. By comparing the experimental conditions of E18(EtOH80) and E18(EtOH90), it is evident that the solution with higher DMF concentration, E18(EtOH80), has the highest electrical conductivity (53.55 mPa·s) and the lowest viscosity (137.25 µS/cm). The increased conductivity results in a higher charge availability on the surface of the polymeric solution, leading to increased repulsion and greater stretching of the polymer jets, resulting in thinner fibers [
18]. Similarly, comparing solutions E14(EtOH80) and E18(EtOH80), the viscosity rises with an increasing concentration of Eudragit L100 (
Table 4). This viscosity increase occurs due to greater entanglement of the polymeric chains with higher copolymer concentrations, leading to a more viscous solution [
37].
Figure 4 exhibits the shear stress and viscosity curves for the proposed experimental conditions in the factorial design (
Table 2). All the proposed polymeric solutions are classified as Newtonian fluids, whereas the shear stress is directly proportional to the angular deformation rate [
38]. Therefore, the shear stress and viscosity curves appear as a straight line. The viscosity remains constant at room temperature and is independent of the applied deformation rate. In contrast, non-Newtonian fluids do not display linearity between shear stress and shear rate. Therefore, their viscosity values can either increase or decrease depending on the specific characteristics of each fluid [
38].
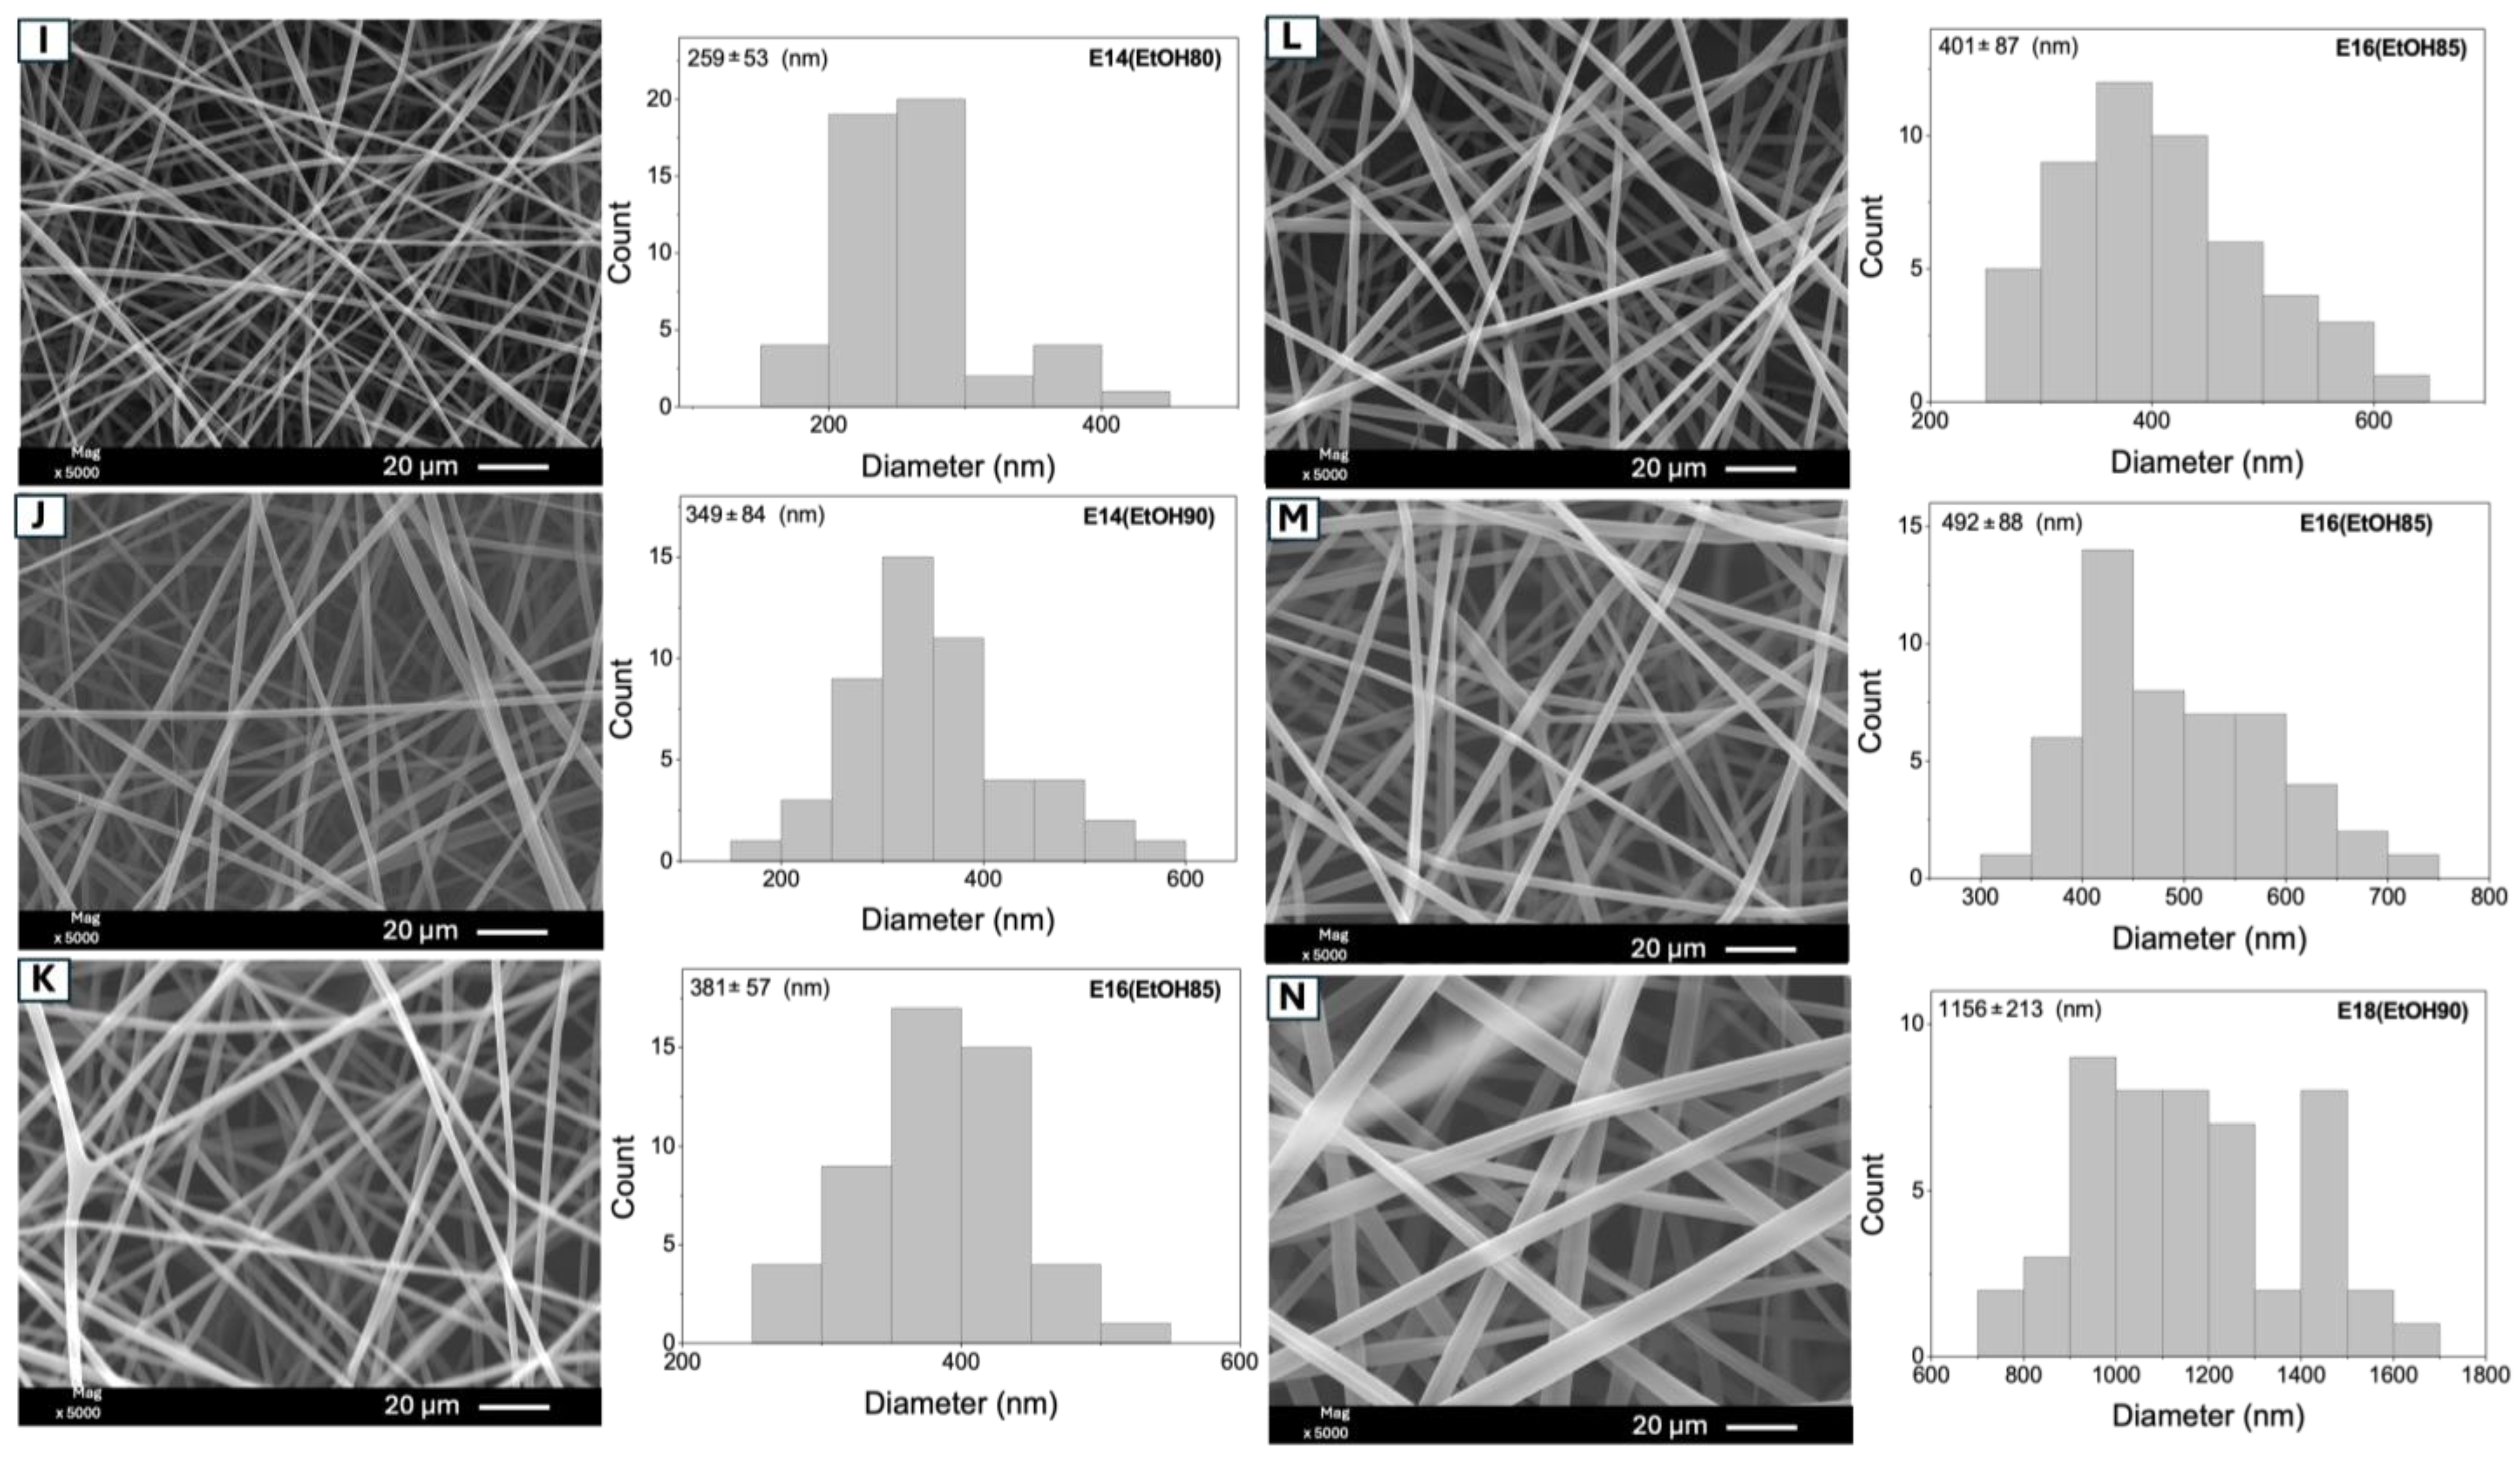
Figure 5 displays the SEM images of the fibers obtained from the experimental conditions examined in the factorial design (
Table 2), excluding sample E18(EtOH80), previously shown in
Figure 1. All experimental conditions yielded bead-free fibers. As mentioned earlier, the viscosity and conductivity of the polymeric solutions directly influence the fiber diameter. Among the experimental conditions, sample E14(EtOH80) resulted in fibers with the smallest average diameter (259 ± 53 nm), while solution E18(EtOH90) produced fibers with the largest average diameter (1156 ± 213 nm). The increase in Eudragit L100 concentration from 14 to 18%
w/
v led to an approximately 4.5-fold increase in fiber diameter, from 259 nm to 1153 nm. This observation can be attributed to the enhanced entanglement of polymer chains in solution as the copolymer concentration rises, resulting in increased viscosity and higher diameter fibers [
39].
Sample E14(EtOH90) exhibits fibers with a larger diameter (349 ± 84 nm) compared to E14(EtOH80) (259 ± 53 nm). This difference is attributed to the EtOH/DMF solvent proportion change. Increasing the DMF concentration enhances the electrical conductivity of the Eudragit L100 solutions, leading to increased stretching of the polymeric jects and, consequently, thinner fibers [
40]. A similar effect is observed when comparing the mean diameters of the samples E18(EtOH80) (453 ± 78 nm) and E18(EtOH90) (1156 ± 213 nm). The average diameters of the E16(EtOH85) fibers, which were obtained from the center point experiments, ranged from 381 ± 57 to 482 ± 88 nm.
Other factors, such as environmental parameters (e.g., temperature and relative humidity) may have influenced the variation in these fiber diameters [
41]. For example, fibers prepared from a 16%
w/
v Eudragit L100 solution at (samples E16(EtOH85 performed in triplicate and denoted by the letters K, L, and M in
Table 2) exhibit varying diameters under the same experimental conditions. The average diameters are 381 ± 57 nm (sample K), 401 ± 87 nm (sample L), and 492 ± 88 nm (sample M). Despite these variations, there are no significant differences in average diameter among the samples (
Table 2). Such alterations in average diameter are common in fibers obtained by electrospinning and can occur over a wide range. Diameter measurements are taken by selecting random fibers in SEM images, and the results are influenced by many factors, including environmental variables. Even with many controlled parameters, fluctuations in average diameter values are to be expected [
35].
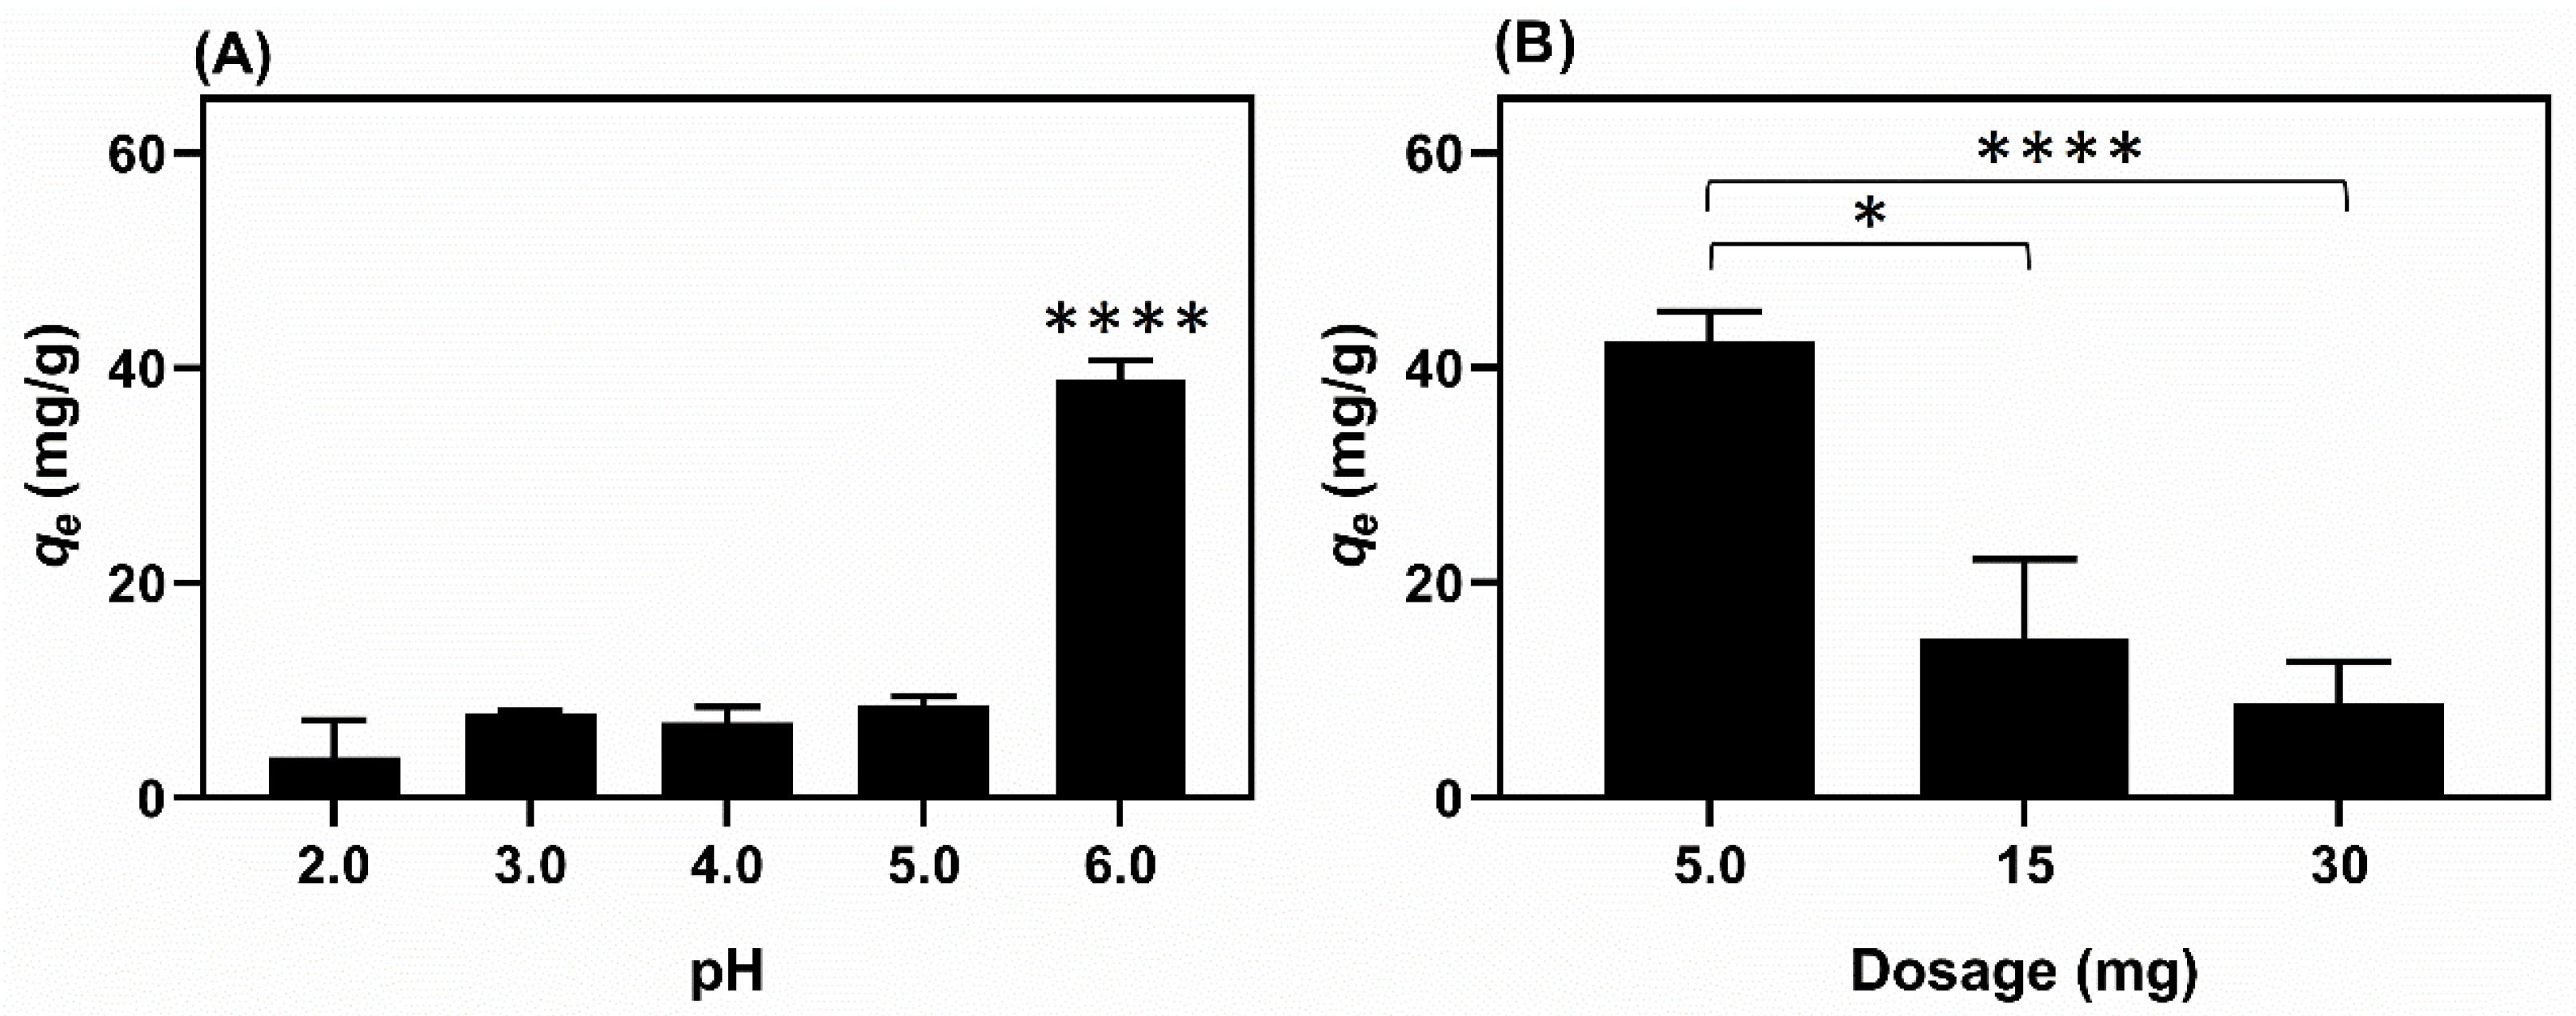
2.5. Adsorption of Cu(II) Ions
Fiber E14(EtOH80) was selected as the adsorbent agent for the adsorption studies due to its higher homogeneity and smaller average diameter compared to the other fibers, which provides a larger contact surface area for adsorption.
Figure 6 illustrates the results relating to the influence of pH and dosage on the adsorption process of Cu(II) ions using Eudragit L100 fiber (E14(EtOH80)) as the adsorbent agent.
The effect of pH on adsorption was investigated using Cu(II) solutions at various pH levels (2.0, 3.0, 4.0, 5.0, and 6.0). pH 6.0 is the most favorable for promoting Cu(II) adsorption from aqueous solutions, achieving a removal efficiency of 37% (q
e = 40.2 mg/g). The removal percentage at pH 5.0 is 12.5% (q
e = 9.1 mg/g). At pH levels 2.0, 3.0, and 4.0, the removal percentage ranges from 6.8% (q
e = 6.2 mg/g) to 8.7% (q
e = 8.0 mg/g) (
Figure 6A). Investigations at pH values above 6.0 were avoided to prevent the precipitation of copper(II) in the solution [
42]. The adsorption of Cu(II) ions is directly influenced by the pH of the solution. Solutions with a pH below 4.0, i.e., more acidic solutions, have protons in excess. This excess reduces the electrostatic interactions between Cu(II) ions and the adsorbent. It also leads to competition between H
3O
+ and Cu(II) ions in solution for the polyanion Eudragit L100 chains. As a result, lower pH values correspond to lower removal of Cu(II) ions [
43].
The dosage effect was investigated by varying the mass of E14(EtOH80) fibers used in the adsorption test. The mass quantities analyzed were 5 mg (0.125 g/L), 15 mg (0.375 g/L), and 30 mg (0.75 g/L) (
Figure 6B). The average removal percentages are 56, 72, and 76%, respectively. The removal percentage of Cu(II) increases as the adsorbent concentration rises from 0.125 to 0.75 g/L. Increasing the adsorbent mass raises the number of active sites available for adsorption [
44]. For the 5, 15, and 30 mg adsorbent dosages, the average q
e values are 42, 15, and 9 mg/g, respectively. Increasing the adsorbent dosage decreases the q
e value, which is inversely proportional to the adsorbent mass. Therefore, a dosage of 5 mg (0.125 g/L) was chosen for further adsorption studies.
The experimental kinetic data for the adsorption of Cu(II) ions is illustrated in
Figure 7. Non-linear models such as the pseudo-first order, pseudo-second order, and Elovich models were applied to investigate the adsorption mechanism (
Figure 7). The kinetic parameters obtained from the model fitting are summarized in
Table 5. The results demonstrate that the pseudo-second-order model best fits the experimental data, with a high determination coefficient (R
2) of 0.982 and a low ∆q
e value of 7.94 (
Table 5). The equilibrium state was achieved after approximately 600 min.
The kinetic adsorption of Cu(II) ions is primarily governed by chemisorption, involving electron exchange or sharing. The carboxylate sites (–COO
−) in the Eudragit L100 structure can coordinate with Cu(II) ions in aqueous solutions, leading to Cu(II) adsorption [
45]. This observation is further supported by the results obtained from FTIR-ATR and DSC analyses. The pseudo-second-order kinetic model, which assumes a constant adsorbate concentration over time, accurately describes the adsorption process. It considers that the total number of binding sites on the adsorbent surface depends on the adsorbate amount adsorbed at equilibrium [
46]. This model is commonly associated with adsorption mechanisms that involve multiple steps [
47].
The findings of this study are consistent with a previous report by Chen et al. [
47], in which polyacrylonitrile fibers containing ethylenediaminetetraacetic acid were electrospun and used for Cu(II) adsorption (with a maximum adsorption capacity of 115.61 mg/g). The pseudo-second-order kinetic model described the adsorption process well [
47]. The pseudo-first-order and pseudo-second-order models are widely employed to elucidate the kinetic behavior of copper ion sorption [
48].
2.6. Fiber and Composite Characterization
Figure 8A shows the FTIR-ATR spectra of Eudragit L100 fibers before (E14(EtOH80)) and after Cu(II) adsorption (E14(EtOH80/Cu)). The Eudragit L100 fiber FTIR-ATR spectrum exhibits characteristic bands related to the C=O axial stretching of ester groups and carboxylic acids at 1720 cm
−1. The band at 1240 cm
−1 is assigned to the C–O axial deformation vibration, whereas the bands at 1450, 965, and 750 cm
−1 are attributed to C–H angular deformation vibration on the Eudragit L100 chains, respectively.
The E14(EtOH80/Cu) FTIR-ATR spectrum shows characteristic bands of Eudragit L100, similar to those observed in the FTIR-ATR spectrum of the fiber before Cu(II) adsorption. However, a prominent new band at 1614 cm
−1 occurs in the E14(EtOH80/Cu) FTIR spectrum, which can be attributed to the asymmetric stretching of C=O bonds on carboxylate anions stabilized by metallic ions [
49]. This band does not appear in the E14(EtOH80) FTIR-ATR spectrum, suggesting that the Eudragit L100 carboxylate sites interact through Coulomb forces with Cu(II) ions, leading to Cu(II) adsorption [
50].
The DSC curves of the E14(EtOH80) and E14(EtOH80/Cu) fibers are presented in
Figure 8B. In the E14(EtOH80) DSC curve, the endothermic peak associated with the melting temperature is observed at 225 °C. In contrast, the E14(EtOH80/Cu) DSC profile shows endothermic peaks at 242 and 248 °C. A comparison of the DSC curves reveals distinct profiles for the endothermic peaks, indicating ordered regions in the E14(EtOH80/Cu fiber. Adsorbed Cu(II) ions electrostatically interact with the carboxylate groups of Eudragit L100 within the fibers, leading to Cu(II) adsorption. The intensity of the endothermic peak corresponding to the melting temperature is significantly lower in the E14(EtOH80) DSC profile compared to the intensity of the endothermic peaks in the E14(EtOH80/Cu) DSC curve. The presence of Cu(II) ions results in higher thermal stability of the fibers due to the ordered regions in the complexed fiber, as supported by the endothermic peaks at higher temperatures in the E14(EtOH80/Cu) DSC curve [
45] (
Figure 8B).
The notable change in the DSC curve profile following Cu(II) adsorption suggests that a portion of the Cu(II) ions are absorbed within the fibers rather than solely adsorbed on the surface. This finding supports the chemisorption mechanism proposed by the kinetic study. In the bulk fibers, each Cu(II) ion can interact with adjacent Eudragit L100 chains, forming a three-dimensional network commonly called “physical hydrogel” [
45].
2.7. Swelling Degree
The swelling degree of the fibers E14(EtOH80) and E14(EtOH80/Cu) was determined in an aqueous HNO3 solution at pH 6.0 (25 °C) for 24 h. The E14(EtOH80) fiber exhibits a significantly higher swelling degree, reaching 4052 ± 25%, whereas the E14(EtOH80/Cu) fiber shows a much lower swelling degree of only 437 ± 33%. This difference can be attributed to the availability of carboxylate sites in the fiber structure. The E14(EtOH80) samples have carboxylic functions available to interact with water molecules through ion-dipole forces, leading to increased expansion of the polymeric chains and a greater swelling degree. This indicates that the fiber matrix, before adsorption, absorbs an enormous water content.
In contrast, the E14(EtOH80/Cu) fiber is complexed with Cu(II) ions. As a result, the availability of carboxylate groups for interaction with water is reduced. Instead, carboxylate anions in the Eudragit L100 fibers interact through coulombic interactions with Cu(II) ions, resulting in a three-dimensional Eudragit L100 network supported by the physical crosslinking of adjacent copolymer chains with Cu(II) ions. Consequently, the carboxylate ions in the E14(EtOH80/Cu) fiber are no longer accessible to interact with water molecules, significantly reducing swelling. These findings are consistent with the FTIR-ATR and DSC results, supporting the complexation of Cu(II) ions with the Eudragit L100 fibers.
2.8. Antimicrobial Activity
Figure 9 shows a digital image of a 48-well plate containing bacterial suspensions, where E14(EtOH80), E14(EtOH80/Cu), and copper(II) sulfate solutions were added. The first three rows (“a”, “b”, and “c”) correspond to wells seeded with
S. aureus, while the last three rows (“d”, “e”, and “f”) represent wells seeded with
P. aeruginosa. The first column represents the positive control, which contains samples without bacteria. The eighth column represents the negative control, consisting of wells containing only microbial culture without samples. Rows “a” and “d” correspond to the assays conducted with E14(ETOH80), while rows “b” and “e” represent the 48-well plates seeded with E14(ETOH80/Cu), and rows “c” and “f” were seeded with copper(II) sulfate (
Figure 9). The digital image was captured after adding resazurin, a colorimetric indicator of cell viability. Blue wells indicate low microbial activity, while pink ones indicate high cell viability (
Figure 9).
The antimicrobial assays were performed using copper(II) sulfate, E14(EtOH80), and E14(EtOH80/Cu) at similar concentrations (
Table 6). Each well in a 48-well plate was supplemented with a predetermined mass of fiber disks or copper(II) sulfate. The concentration of Cu(II) ions within the E14(EtOH80/Cu), which was used in the antimicrobial assay (rows “b” and “e” in
Figure 9) is indicated in
Table 6. The Cu(II) concentration in the E14(EtOH80/Cu) fibers incubated with the microbial cells was calculated based on the q
e value (43.70 mg/g). The E14(EtOH80) fiber does not contain Cu(II) ions in its composition, comprising the fiber before the adsorption of Cu(II) ions. The E14(EtOH80) concentration used in the antimicrobial assay is compiled in
Table 6, along with the copper(II) concentration (mg/mL). The concentrations presented in
Table 6 are correlated with
Figure 9.
The colorimetric assay confirms the lack of cytotoxicity of the E14(EtOH80) fiber against both microbial strains. Wells containing E14(EtOH80) (rows “a” for
S. aureus and “d” for
P. aeruginosa) exhibit a pink color, indicating resazurin reduction to resorufin due to increased cellular activity (
Figure 9). This confirms the proliferation of microorganisms in the wells with E14(EtOH80) fiber. In contrast, the wells (rows “b” and “e”) seeded with E14(EtOH80/Cu) demonstrate inhibition of microbial growth (
Figure 9). The MIC values obtained from the colorimetric assay, resulting in low cell viability, are 9.50 mg/mL (equivalent to 3.32 × 10
−4 mg/mL of adsorbed Cu(II)) for
S. aureus and 4.75 mg/mL (equivalent to 1.66 × 10
−4 mg/mL of adsorbed Cu(II)) for
P. aeruginosa (
Table 6).
The MIC values differ when comparing the concentrations of Cu(II) present in the E14(EtOH80/Cu) fibers and copper(II) sulfate solutions. The MIC values supported by the copper(II) sulfate solution are 2.5 mg/mL for S. aureus against 3.32 × 10⁻⁴ mg/mL of adsorbed Cu(II)) and 1.25 mg/mL for P. aeruginosa against 1.66 × 10⁻⁴ mg/mL of adsorbed Cu(II). It is suggested that these differences primarily depend on the sample type. The E14(EtOH80/Cu) fibers dissolve, releasing Cu(II) ions into the microbial suspension at pH 7.4, while the copper(II) sulfate solution contains sulfate ions that can stabilize the Cu(II) ions, hindering their action against bacteria, as metallic ions have recognized antimicrobial activity in microbial suspension (e.g., silver and zinc ions). Additionally, Cu(II) ions in aqueous media occur in the form of copper(II) complexes, where Cu(II) ions coordinate with six water molecules. This should influence the antimicrobial properties of the samples, justifying the difference in the MIC values.
The results agree with other findings already reported. Chai et al. utilized coated stainless-steel alloys with copper to prevent implant-related infections in bone tissues [
51]. Martins et al. [
45] developed films of pectin/chitosan through casting and utilized these films as adsorbents for Cu(II) ions (q
e = 29.20 mg/g). They demonstrated that the films containing Cu(II) ions exhibited bacteriostatic activity against
Escherichia coli (
E. coli) at 25 mg/mL, whereas the film without adsorbed Cu(II) did not show any activity, even at 100 mg/mL. The bacteriostatic activity is dependent on the copper(II) ion in the film, which remained insoluble in the microbial suspension. Deus et al. [
52] reported MIC values higher than 2 mg/mL for copper(II) sulfate against many isolates of
E. coli, a Gram-negative bacterium.
Aliquots were collected from wells that did not show visible growth as indicated by the resazurin (
Figure 9) and transferred to Petri dishes (85 × 10 mm) containing Mueller–Hinton agar. The dishes were then incubated at 37 °C for 24 h to determine if the samples exhibited bactericidal activity (
Figure S2, Supplementary Material). The bacterial colonies proliferate in the Petri dishes, indicating that the E14(EtOH80/Cu sample and the copper(II) sulfate solution do not possess bactericidal activity against
P. aeruginosa and
S. aureus (
Figure S3). Therefore, the E14(EtOH80/Cu fiber and Cu(II) solutions exhibit bacteriostatic activity against
P. aeruginosa and
S. aureus.

 ,
, 


