


Hydrochar from Pine Needles as a Green Alternative for Catalytic Electrodes in Energy Applications

 ,
,  ,
,  ,
,  , , ,
, , ,  and
and 
Abstract

1. Introduction
2. Results and Discussion
2.1. Synthesis and Characterization of Hydrochars
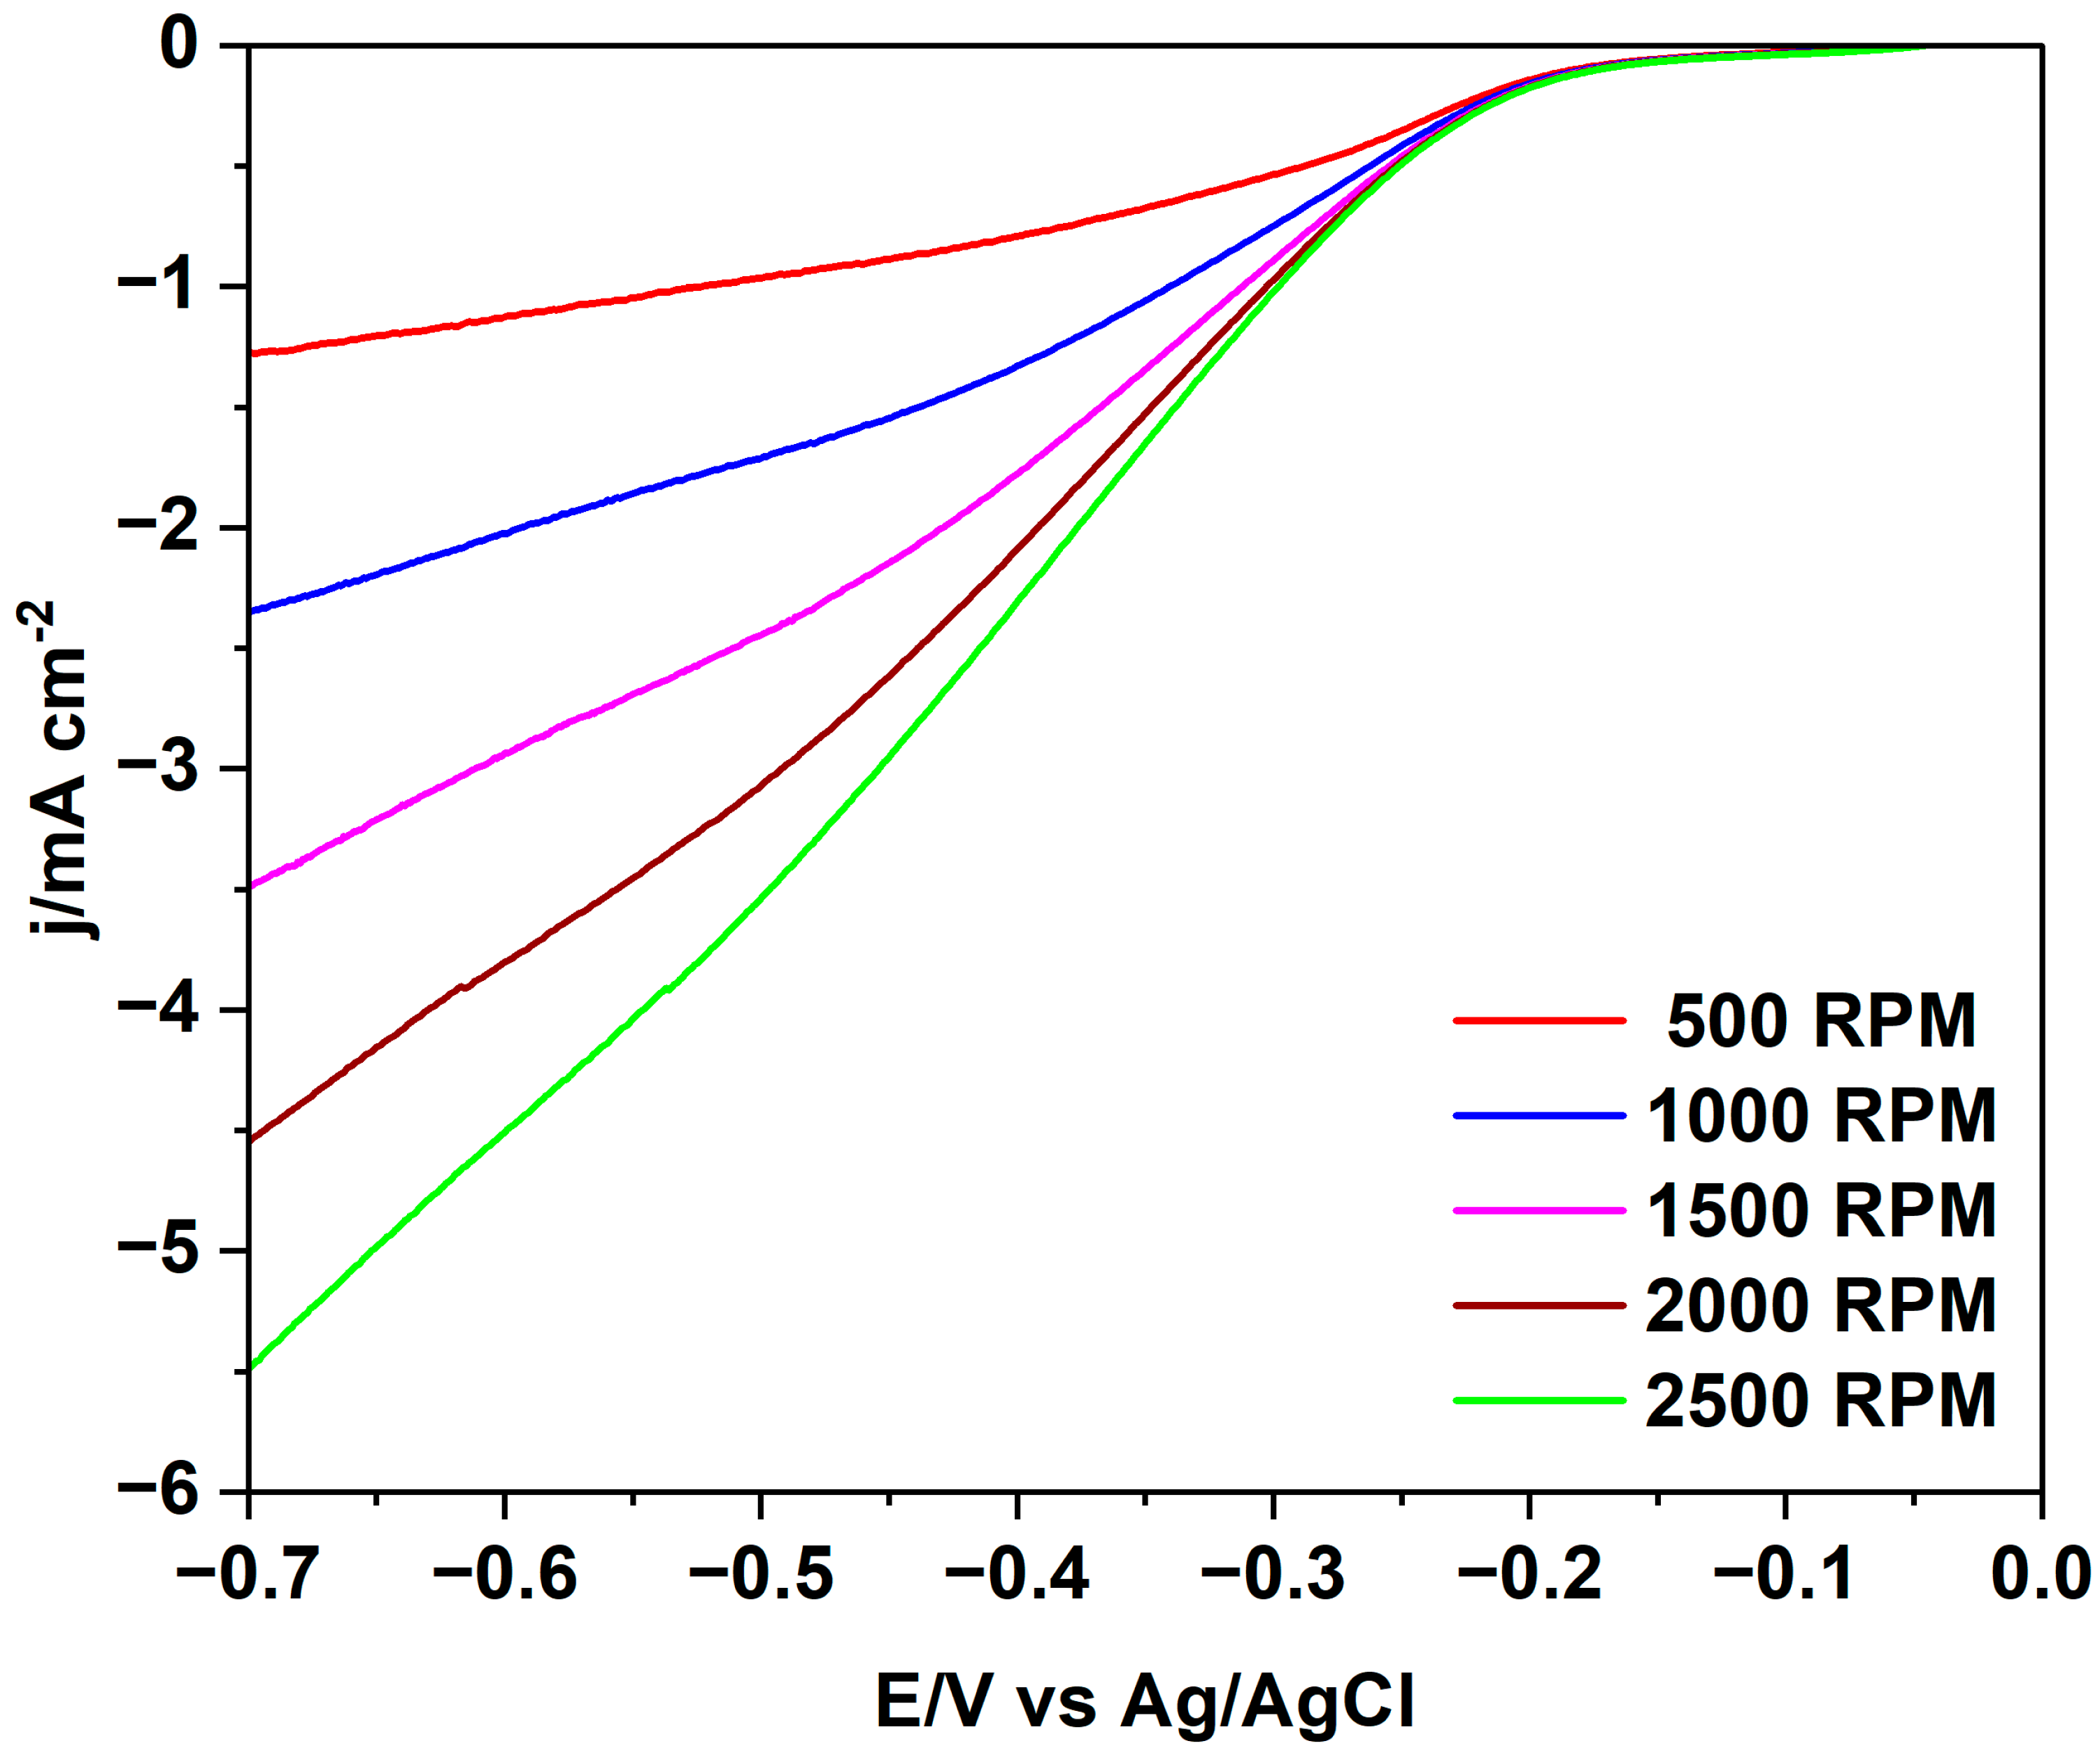
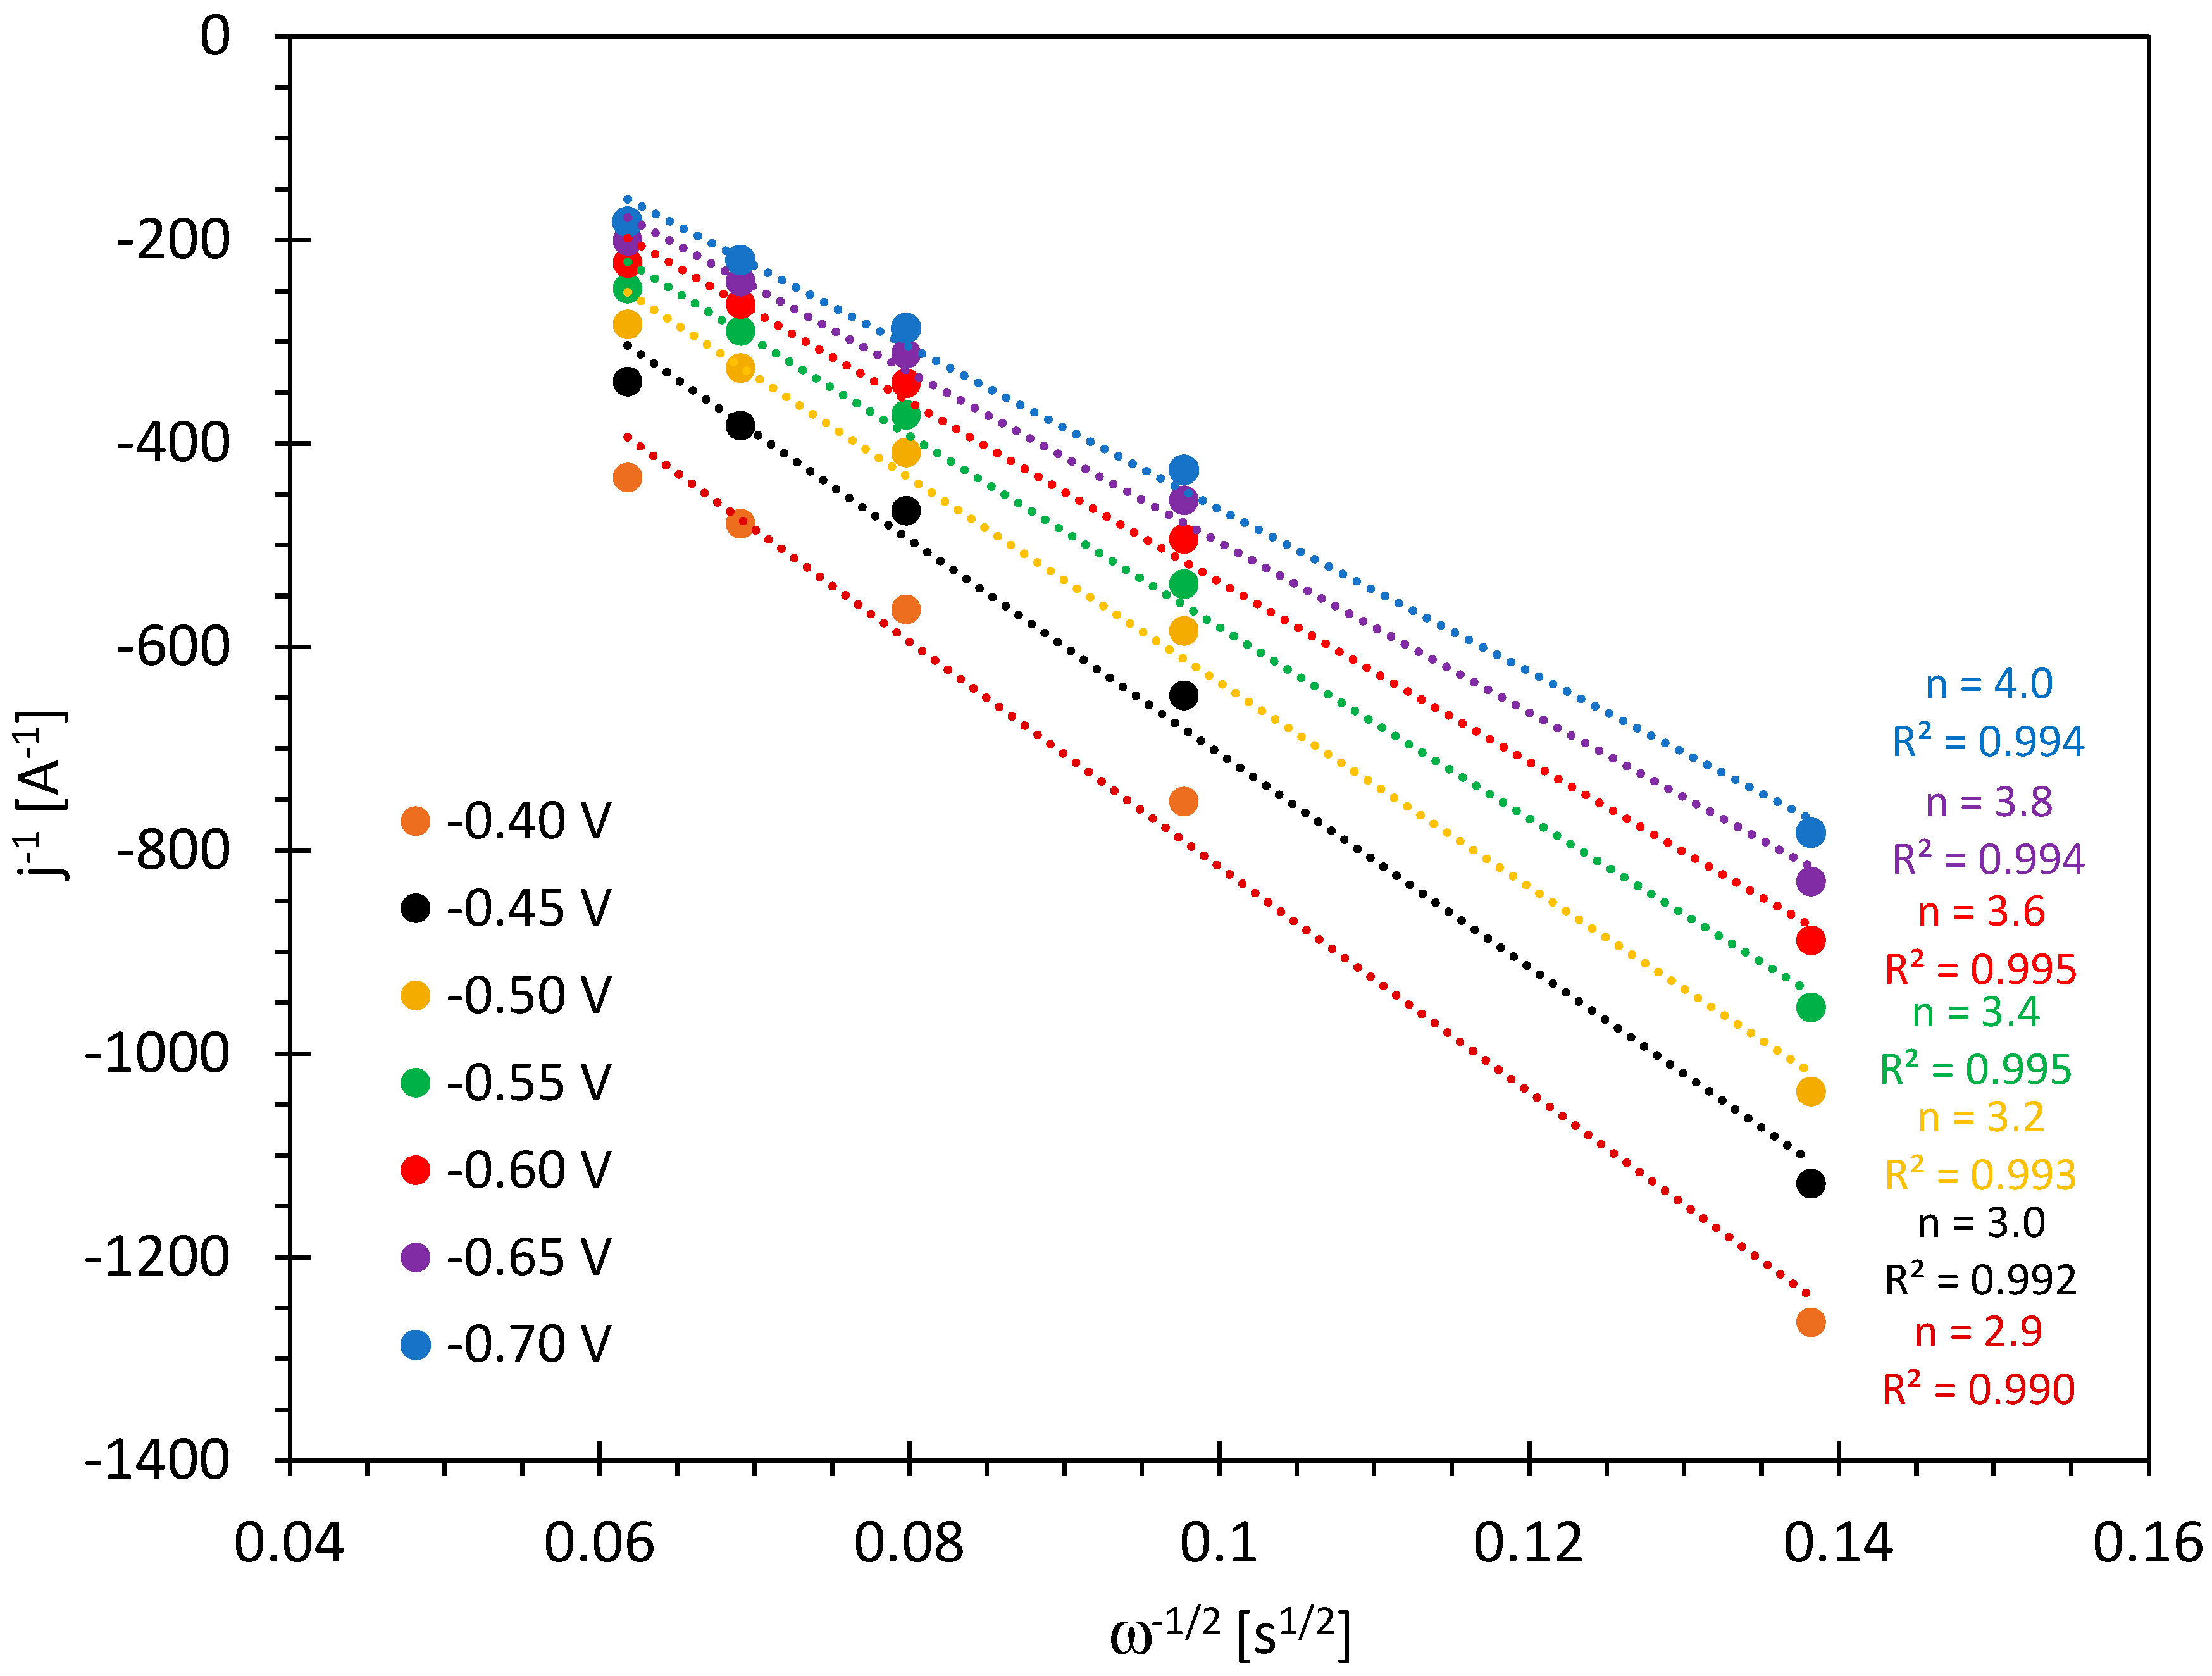
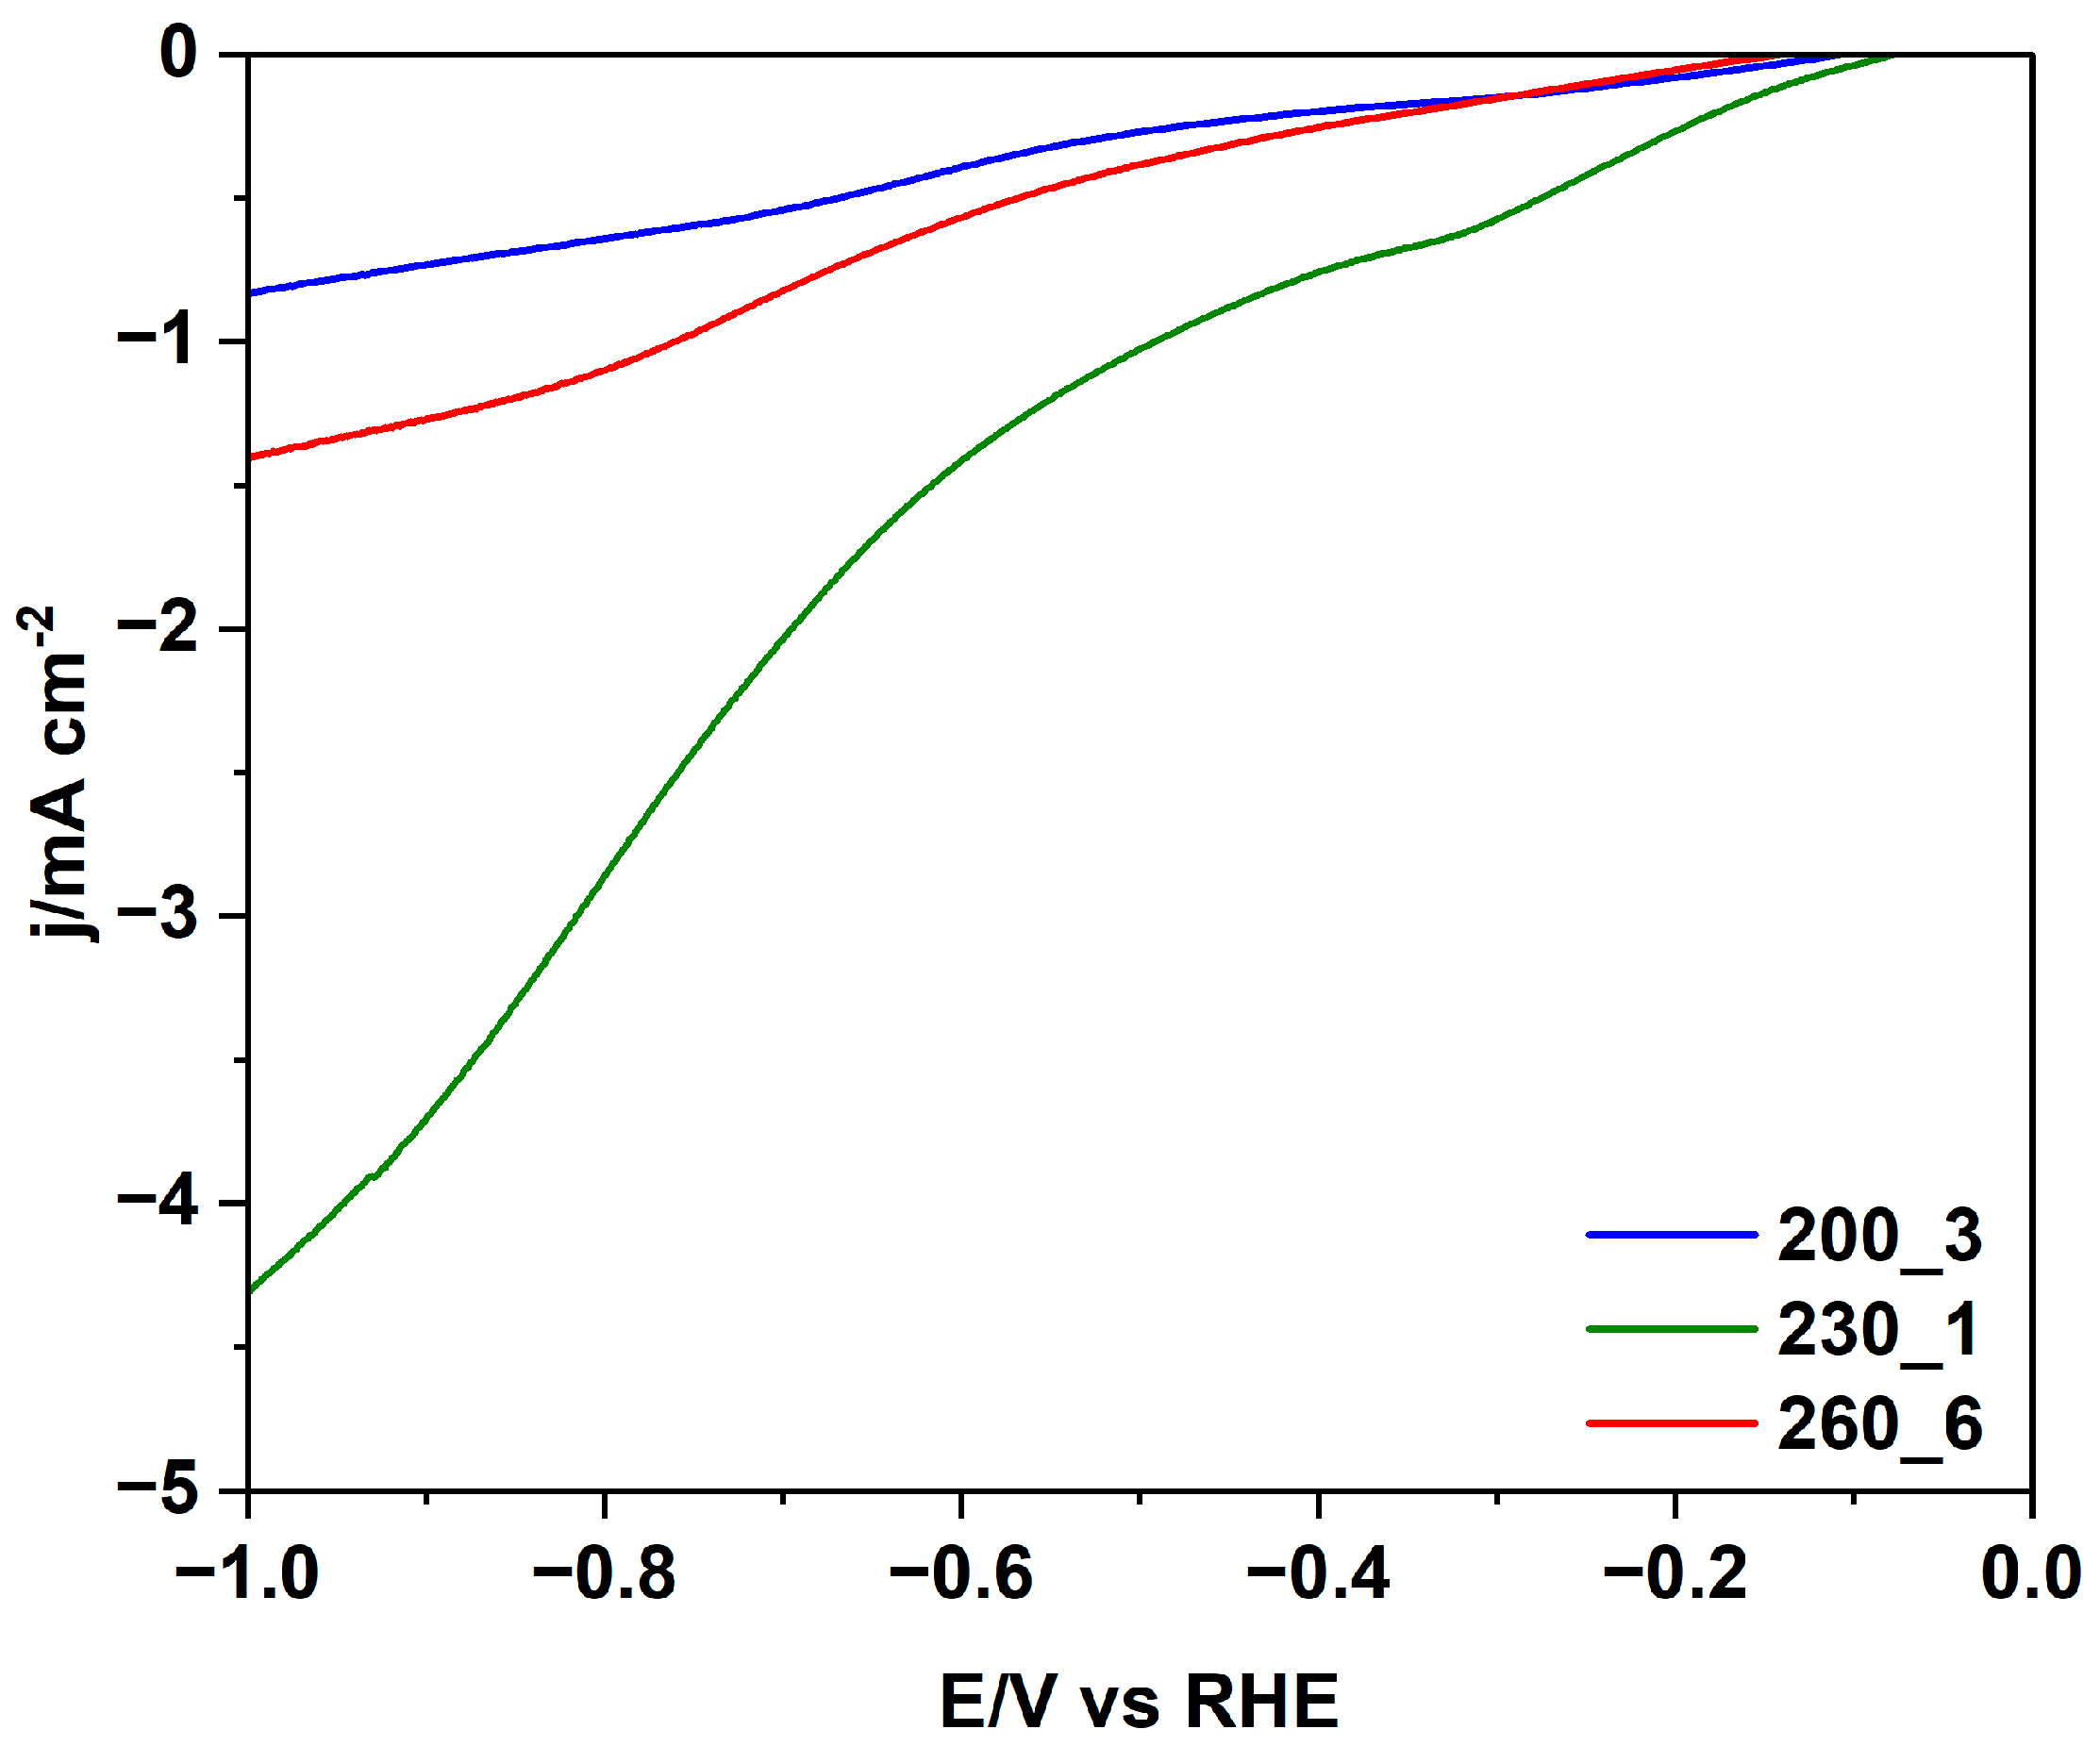
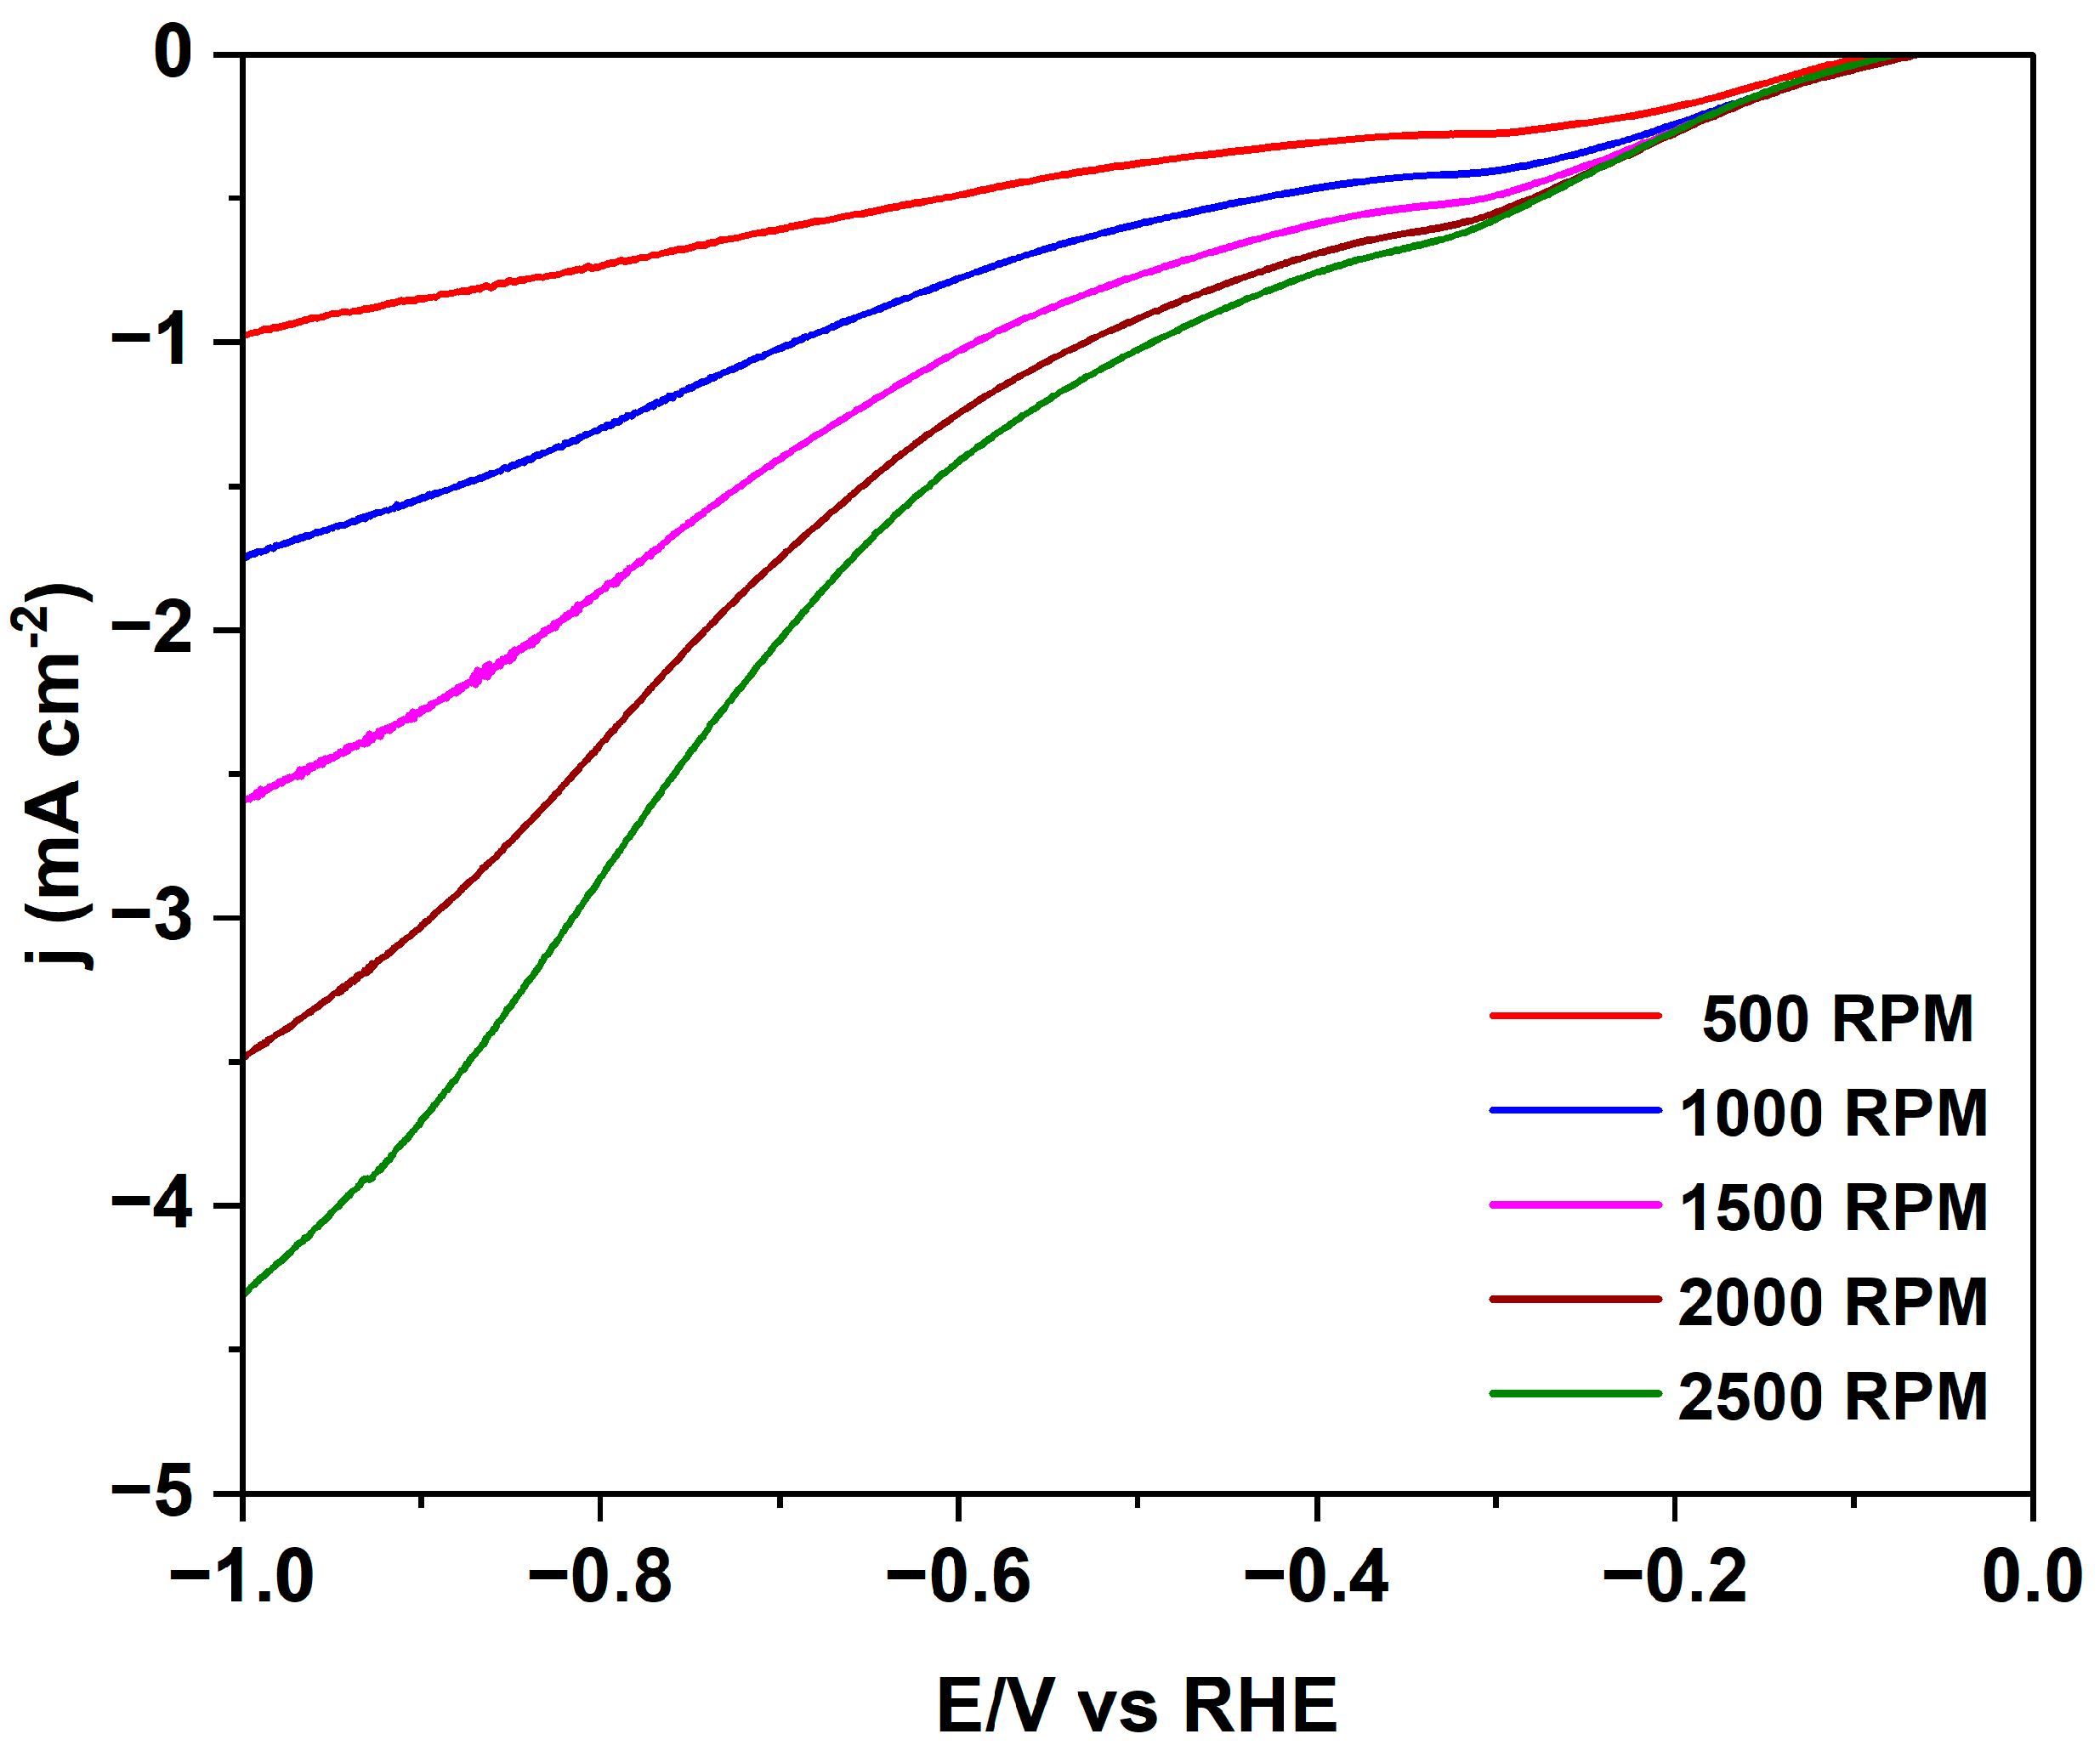
2.2. Hydrochar Catalytic Electrodes for ORR and CO2RR
3. Materials and Methods
3.1. Materials
3.2. Synthesis of Hydrochars
3.2.1. Pine Needle Waste Pre-Treatment
3.2.2. Hydrothermal Carbonization of Pre-Treated PNs with Urea
3.3. Catalytic Ink and Electrode Preparation
3.4. Characterization
3.4.1. Proximate Composition
3.4.2. Elemental Analysis
3.4.3. Bulk Density of Hydrochars
3.4.4. Brunauer–Emmett–Teller (BET) Analysis
3.4.5. Water Contact Angle
3.4.6. Microscopical Observations
3.4.7. Spectroscopic Analysis
3.4.8. Electrochemical Measurements
4. Conclusions
Supplementary Materials
Author Contributions
Funding
Institutional Review Board Statement
Informed Consent Statement
Data Availability Statement
Acknowledgments
Conflicts of Interest
References
- Seow, Y.X.; Tan, Y.H.; Mubarak, N.M.; Kansedo, J.; Khalid, M.; Ibrahim, M.L.; Ghasemi, M. A review on biochar production from different biomass wastes by recent carbonization technologies and its sustainable applications. J. Environ. Chem. Eng. 2022, 10, 107017. [Google Scholar] [CrossRef]
- Ghodake, G.S.; Shinde, S.K.; Kadam, A.A.; Saratale, R.G.; Saratale, G.D.; Kumar, M.; Palem, R.R.; Al-Shwaiman, H.A.; Elgorban, A.M.; Syed, A.; et al. Review on biomass feedstocks, pyrolysis mechanism and physicochemical properties of biochar: State-of-the-art framework to speed up vision of circular bioeconomy. J. Clean. Prod. 2021, 297, 126645. [Google Scholar] [CrossRef]
- Correa, C.R.; Hehr, T.; Voglhuber-Slavinsky, A.; Rauscher, Y.; Kruse, A. Pyrolysis vs. hydrothermal carbonization: Understanding the effect of biomass structural components and inorganic compounds on the char properties. J. Anal. Appl. Pyrolysis 2019, 140, 137–147. [Google Scholar] [CrossRef]
- Liu, W.J.; Jiang, H.; Yu, H.Q. Development of Biochar-Based Functional Materials: Toward a Sustainable Platform Carbon Material. Chem. Rev. 2015, 115, 12251–12285. [Google Scholar] [CrossRef] [PubMed]
- Lyu, H.; Lim, J.Y.; Zhang, Q.R.; Senadheera, S.S.; Zhang, C.C.; Huang, Q.L.; Ok, Y.S. Conversion of organic solid waste into energy and functional materials using biochar catalyst: Bibliometric analysis, research progress, and directions. Appl. Catal. B 2024, 340, 123223. [Google Scholar] [CrossRef]
- Lee, J.; Kim, K.H.; Kwon, E.E. Biochar as a Catalyst. Renew. Sustain. Energy Rev. 2017, 77, 70–79. [Google Scholar] [CrossRef]
- Xiong, X.N.; Yu IK, M.; Cao, L.C.; Tsang DC, W.; Zhang, S.C.; Ok, Y.S. A review of biochar-based catalysts for chemical synthesis, biofuel production, and pollution control. Bioresour. Technol. 2017, 246, 254–270. [Google Scholar] [CrossRef] [PubMed]
- Cao, X.F.; Sun, S.N.; Sun, R.C. Application of biochar-based catalysts in biomass upgrading: A review. RSC Adv. 2017, 7, 48793–48805. [Google Scholar] [CrossRef]
- Zhao, S.; Wang, X.; Wang, Q.; Sumpradit, T.; Khan, A.; Zhou, J.; Salama, E.-S.; Li, X.; Qu, J. Application of biochar in microbial fuel cells: Characteristic performances, electron-transfer mechanism, and environmental and economic assessments. Ecotoxicol. Environ. Saf. 2023, 267, 115643. [Google Scholar] [CrossRef]
- Bhatia, S.K.; Palai, A.K.; Kumar, A.; Bhatia, R.K.; Patel, A.K.; Thakur, V.K.; Yang, Y.H. Trends in renewable energy production employing biomass-based biochar. Bioresour. Technol. 2021, 340, 125644. [Google Scholar] [CrossRef]
- Senthil, C.; Lee, C.W. Biomass-derived biochar materials as sustainable energy sources for electrochemical energy storage devices. Renew. Sustain. Energy Rev. 2021, 137, 110464. [Google Scholar] [CrossRef]
- Arauzo, P.J.; Maziarka, P.A.; Schoder, K.A.; Pfersich, J.; Ronsse, F.; Kruse, A. Influence of sequential HTC pre-treatment and pyrolysis on wet food-industry wastes: Optimisation toward nitrogen-rich hierarchical carbonaceous materials intended for use in energy storage solutions. Sci. Total Environ. 2022, 816, 151648. [Google Scholar] [CrossRef]
- Khosravi, A.; Zheng, H.; Liu, Q.; Hashemi, M.; Tang, Y.Z.; Xing, B.S. Production and characterization of hydrochars and their application in soil improvement and environmental remediation. Chem. Eng. J. 2022, 430, 133142. [Google Scholar] [CrossRef]
- Becker, G.C.; Wüst, D.; Köhler, H.; Lautenbach, A.; Kruse, A. Novel approach of phosphate-reclamation as struvite from sewage sludge by utilising hydrothermal carbonization. J. Environ. Manag. 2019, 238, 119–125. [Google Scholar] [CrossRef]
- Marin-Batista, J.D.; Mohedano, A.F.; Rodríguez, J.J.; de la Rubia, M.A. Energy and phosphorous recovery through hydrothermal carbonization of digested sewage sludge. Waste Manag. 2020, 105, 566–574. [Google Scholar] [CrossRef] [PubMed]
- Kumar, M.; Dutta, S.; You, S.M.; Luo, G.; Zhang, S.C.; Show, P.L.; Sawarkar, A.D.; Singh, L.; Tsang, D.C.W. A critical review on biochar for enhancing biogas production from anaerobic digestion of food waste and sludge. J. Clean. Prod. 2021, 305, 127143. [Google Scholar] [CrossRef]
- Diaz, E.; Manzano, F.J.; Villamil, J.; Rodriguez, J.J.; Mohedano, A.F. Low-Cost Activated Grape Seed-Derived Hydrochar through Hydrothermal Carbonization and Chemical Activation for Sulfamethoxazole Adsorption. Appl. Sci. 2019, 9, 5127. [Google Scholar] [CrossRef]
- Alhnidi, M.J.; Straten, J.W.; Nicolae, S.A.; Hoffmann, V.; Titirici, M.M.; Kruse, A. Thermal treatment versus hydrothermal carbonization: How to synthesize nitrogen-enriched carbon materials for energy storage applications? Int. J. Energy Res. 2022, 46, 1622–1636. [Google Scholar] [CrossRef]
- Zhuang, X.Z.; Liu, J.G.; Ma, L.L. Facile synthesis of hydrochar-supported catalysts from glucose and its catalytic activity towards the production of functional amines. Green Energy Environ. 2023, 8, 1358–1370. [Google Scholar] [CrossRef]
- Wang, J.; Chen, S.; Xu, J.Y.; Liu, L.C.; Zhou, J.C.; Cai, J.J. High-surface-area porous carbons produced by the mild KOH activation of a chitosan hydrochar and their CO2 capture. New Res. Carbon Mater. 2021, 36, 1081–1093. [Google Scholar] [CrossRef]
- Esteban, D.A.; Martínez, A.G.; González, J.C.; Birss, V.I.; Otero-Díaz, L.C.; Brande, D.A. Tunable Supercapacitor Materials Derived from Hydrochar/Gold Nanograpes. ACS Appl. Energy Mater. 2020, 3, 9348–9359. [Google Scholar] [CrossRef]
- Zhou, Y.; Shi, W.K.; Engler, N.; Nelles, M. High-value utilization of kitchen waste derived hydrochar in energy storage regulated by circulating process water. Energy Convers. Manag. 2021, 229, 113737. [Google Scholar] [CrossRef]
- Li, K.; Liu, Y.Q.; Cui, B.; Sima, D.W.; Wang, D.; Ye, Y.Y.; Li, S.R.; Zheng, Z.F. Nitrogen reduction to ammonia at ambient conditions using hydrochar prepared from cigarette filters as catalyst. Int. J. Hydrogen Energy 2020, 45, 20875–20882. [Google Scholar] [CrossRef]
- Mai, D.D.; Wen, R.; Cao, W.M.; Yuan, B.; Liu, Y.; Liu, Q.; Qian, G.R. Effect of Heavy Metal (Zn) on Redox Property of Hydrochar Produced from Lignin, Cellulose, and D-Xylose. ACS Sustain. Chem. Eng. 2017, 5, 3499–3508. [Google Scholar] [CrossRef]
- Reza, M.T.; Lynam, J.G.; Uddin, M.H.; Coronella, C.J. Hydrothermal carbonization: Fate of inorganics. Biomass Bioenergy 2013, 49, 86–94. [Google Scholar] [CrossRef]
- Feng, X.; Bai, Y.; Liu, M.Q.; Li, Y.; Yang, H.Y.; Wang, X.R.; Wu, C. Untangling the respective effects of heteroatom-doped carbon materials in batteries, supercapacitors and the ORR to design high performance materials. Energy Environ. Sci. 2021, 14, 2036–2089. [Google Scholar] [CrossRef]
- Pietrzak, R.; Wachowska, H.; Nowicki, P. Preparation of nitrogen-enriched activated carbons from brown coal. Energy Fuels 2006, 20, 1275–1280. [Google Scholar] [CrossRef]
- Choi, J.; Zequine, C.; Bhoyate, S.; Lin, W.; Li, X.L.; Kahol, P.; Gupta, R. Waste Coffee Management: Deriving High-Performance Supercapacitors Using Nitrogen-Doped Coffee-Derived Carbon. C J. Carbon Res. 2019, 5, 44. [Google Scholar] [CrossRef]
- Park, S.; Choi, M.S.; Park, H.S. Nitrogen-doped nanoporous carbons derived from lignin for high CO2 capacity. Carbon Lett. 2019, 29, 289–296. [Google Scholar] [CrossRef]
- Quan, C.; Jia, X.Y.; Gao, N.B. Nitrogen-doping activated biomass carbon from tea seed shell for CO2 capture and supercapacitor. Int. J. Energy Res. 2020, 44, 1218–1232. [Google Scholar] [CrossRef]
- Hu, X.; Liu, W.J.; Ma, L.L.; Yu, H.Q. Sustainable Conversion of Harmful Algae Biomass into a CO2 Reduction Electrocatalyst for Two-Fold Carbon Utilization. Environ. Sci. Technol. 2023, 57, 1157–1166. [Google Scholar] [CrossRef]
- Yuan, H.R.; Qian, X.; Luo, B.; Wang, L.F.; Deng, L.F.; Chen, Y. Carbon dioxide reduction to multicarbon hydrocarbons and oxygenates on plant moss-derived, metal-free, in situ nitrogen-doped biochar. Sci. Total Environ. 2020, 739, 140340. [Google Scholar] [CrossRef]
- Amelia, S.T.W.; Nurtono, T.; Setyawan, H.; Widiyastuti, W. Electrocapacitive and electrocatalytic performances of hydrochar prepared by one-step hydrothermal carbonization without further activation. Mater. Res. Express 2023, 10, 075602. [Google Scholar] [CrossRef]
- Upskuviene, D.; Balciunaite, A.; Drabavicius, A.; Jasulaitiene, V.; Niaura, G.; Talaikis, M.; Plavniece, A.; Dobele, G.; Volperts, A.; Zhurinsh, A.; et al. Synthesis of nitrogen-doped carbon catalyst from hydrothermally carbonized wood chips for oxygen reduction. Catal. Commun. 2023, 184, 106797. [Google Scholar] [CrossRef]
- Nagappan, S.; Duraivel, M.; Hira, S.A.; Prabakar, K.; Ha, C.-S.; Joo, S.H.; Nam, K.M.; Park, K.H. Heteroatom-doped nanomaterials/core–shell nanostructure based electrocatalysts for the oxygen reduction reaction. J. Mater. Chem. A 2022, 10, 987–1021. [Google Scholar] [CrossRef]
- Nallayagari, A.R.; Sgreccia, E.; Pasquini, L.; Vacandio, F.; Kaciulis, S.; Di Vona, M.L.; Knauth, P. Catalytic electrodes for the oxygen reduction reaction based on co-doped (B-N, Si-N, S-N) carbon quantum dots and anion exchange ionomer. Electrochim. Acta 2022, 427, 140861. [Google Scholar] [CrossRef]
- Rao, P.; Wang, T.-J.; Li, J.; Deng, P.L.; Shen, Y.J.; Yu, C.; Tian, X.-L. Plasma-induced Fe-Nx active sites to improve the oxygen reduction reaction performance. Adv. Sensor Energy Mater. 2022, 1, 100005. [Google Scholar] [CrossRef]
- Jiang, M.; Yu, X.; Yang, H.; Chen, S. Optimization strategies of preparation of biomass-derived carbon electrocatalyst for boosting oxygen reduction reaction: A minireview. Catalysts 2020, 10, 1472. [Google Scholar] [CrossRef]
- Sekhon, S.S.; Lee, J.; Park, J.-S. Biomass-derived bifunctional electrocatalysts for oxygen reduction and evolution reaction: A review. J. Energy Chem. 2022, 65, 149–172. [Google Scholar] [CrossRef]
- Zhang, S.B.; Zhang, X.; Zhang, S.Y.; Zhang, J.J.; Li, G.Y.; He, Y.; Shao, J.A.; Zhang, S.H.; Yang, H.P.; Chen, H.P. Biomass-derived functional carbon material for CO2 adsorption and electrochemical CO2 reduction reaction. Carbon Capture Sci. Technol. 2023, 9, 100135. [Google Scholar] [CrossRef]
- Tan, Y.; Jia, S.; Tan, J.; Leow, Y.; Zheng, R.; Tan, X.Y.; Dolmanan, S.B.; Zhang, M.; Yew, P.Y.M.; Ni, X.P.; et al. Coconut husk-derived biochar for enhancing electrochemical conversion of CO2. Mater. Today Chem. 2023, 30, 101595. [Google Scholar] [CrossRef]
- Fu, S.L.; Li, M.; de Jong, W.; Kortlever, R. Tuning the Properties of N-Doped Biochar for Selective CO2 Electroreduction to CO. ACS Catal. 2023, 13, 10309–10323. [Google Scholar] [CrossRef]
- Borghei, M.; Lehtonen, J.; Liu, L.; Rojas, O.J. Advanced Biomass-Derived Electrocatalysts for the Oxygen Reduction Reaction. Adv. Mater. 2018, 30, 1703691. [Google Scholar] [CrossRef] [PubMed]
- Nallayagari, A.R.; Sgreccia, E.; Pasquini, L.; Sette, M.; Knauth, P.; Di Vona, M.L. Impact of Anion Exchange Ionomers on the Electrocatalytic Performance for the Oxygen Reduction Reaction of B-N Co-doped Carbon Quantum Dots on Activated Carbon. ACS Appl. Mater. Interfaces 2022, 14, 46537–46547. [Google Scholar] [CrossRef] [PubMed]
- Brown, A.V.; Tompsett, G.A.; Partopour, B.; Deskins, N.A.; Timko, M.T. Hydrochar structural determination from artifact-free Raman analysis. Carbon 2020, 167, 378–387. [Google Scholar] [CrossRef]
- Sevilla, M.; Fuertes, A.B. Chemical and Structural Properties of Carbonaceous Products Obtained by Hydrothermal Carbonization of Saccharides. Chem. Eur. J. 2009, 15, 4195–4203. [Google Scholar] [CrossRef] [PubMed]
- Wang, Y.; Alsmeyer, D.C.; McCreery, R.L. Raman-spectroscopy of carbon materials-structural basis of observed spectra. Chem. Mater. 1991, 2, 557–563. [Google Scholar] [CrossRef]
- Yu, J.; Sun, L.S.; Berrueco, C.; Fidalgo, B.; Paterson, N.; Millan, M. Influence of temperature and particle size on structural characteristics of chars from Beechwood pyrolysis. J. Anal. Appl. Pyrolysis 2018, 130, 127–134. [Google Scholar] [CrossRef]
- Xu, J.; Liu, J.; Ling, P.; Zhang, X.; Xu, K.; He, L.; Wang, Y.; Su, S.; Hu, S.; Xiang, J. Raman spectroscopy of biochar from the pyrolysis of three typical Chinese biomasses: A novel method for rapidly evaluating the biochar property. Energy 2020, 202, 117644. [Google Scholar] [CrossRef]
- Potgieter-Vermaak, S.; Maledi, N.; Wagner, N.; Van Heerden, J.H.P.; Van Grieken, R.; Potgieter, J.H. Raman spectroscopy for the analysis of coal: A review. J. Raman Spectrosc. 2011, 42, 123–129. [Google Scholar] [CrossRef]
- Brown, A.B.; McKeogh, B.J.; Tompsett, G.A.; Lewis, R.; Deskins, N.A.; Timko, M.T. Structural analysis of hydrothermal char and its models by density functional theory simulation of vibrational spectroscopy. Carbon 2017, 125, 614–629. [Google Scholar] [CrossRef]
- Ray, A. Characterization of Biochars from Various Agricultural By-Products Using FTIR Spectroscopy, SEM focused with image Processing. IJAEB 2020, 13, 423–430. [Google Scholar] [CrossRef]
- Sahoo, S.S.; Vijay, V.K.; Chandra, R.; Kumar, H. Production and characterization of biochar produced from slow pyrolysis of pigeon pea stalk and bamboo. Clean. Eng. Technol. 2021, 3, 100101. [Google Scholar] [CrossRef]
- Ganguly, A.; Sharma, S.; Papakonstantinou, P.; Hamilton, J. Probing the Thermal Deoxygenation of Graphene Oxide Using High-Resolution In Situ X-ray-Based Spectroscopies. J. Phys. Chem. C 2011, 115, 17009–17019. [Google Scholar] [CrossRef]
- Abe, T.; Watanabe, A. X-ray photoelectron spectroscopy of nitrogen functional groups in soil humic acids. Soil Sci. 2004, 169, 35–43. [Google Scholar] [CrossRef]
- Singh, B.; Fang, Y.Y.; Cowie, B.C.C.; Thomsen, L. NEXAFS and XPS characterisation of carbon functional groups of fresh and aged biochars. Org. Geochem. 2014, 77, 1–10. [Google Scholar] [CrossRef]
- Fajardo-Díaz, J.L.; Rodríguez-Corvera, C.L.; Muñoz-Sandoval, E.; López-Urías, F. Furan and Pyran Functional Groups Driven the Surface of Nitrogen-Doped Nanofiber Sponges. Chemnanomat 2020, 6, 672–684. [Google Scholar] [CrossRef]
- Cheng, F.; Li, X.W. Preparation and Application of Biochar-Based Catalysts for Biofuel Production. Catalysts 2018, 8, 346. [Google Scholar] [CrossRef]
- Shi, N.; Liu, Q.Y.; He, X.; Wang, G.; Chen, N.; Peng, J.Y.; Ma, L.L. Molecular Structure and Formation Mechanism of Hydrochar from Hydrothermal Carbonization of Carbohydrates. Energy Fuels 2019, 33, 9904–9915. [Google Scholar] [CrossRef]
- Brewer, C.E.; Chuang, V.J.; Masiello, C.A.; Gonnermann, H.; Gao, X.D.; Dugan, B.; Driver, L.E.; Panzacchi, P.; Zygourakis, K.; Davies, C.A. New approaches to measuring biochar density and porosity. Biomass Bioenergy 2014, 66, 176–185. [Google Scholar] [CrossRef]
- Kambo, H.S.; Dutta, A.A. Comparative review of biochar and hydrochar in terms of production, physico-chemical properties and applications. Renew. Sustain. Energy Rev. 2015, 45, 359–378. [Google Scholar] [CrossRef]
- Panganoron, H.O.; Pascasio, J.D.A.; Esparcia, E.A., Jr.; del Rosario, J.A.D.; Ocon, J.D. Hydrothermally Carbonized Waste Biomass as Electrocatalyst Support for α-MnO2 in Oxygen Reduction Reaction. Catalysts 2020, 10, 177. [Google Scholar] [CrossRef]
- Bertheussen, E.; Abghoui, Y.; Jovanov, Z.P.; Varela, A.S.; Stephens, I.E.L.; Chorkendorff, I. Quantification of liquid products from the electroreduction of CO2 and CO using static headspace-gas chromatography and nuclear magnetic resonance spectroscopy. Catal. Today 2017, 288, 54–62. [Google Scholar] [CrossRef]
- Rois, M.F.; Sasono, S.R.A.; Widiyastuti, W.; Nurtono, T.; Setyawan, H. High-performance electrocatalyst made from lignosulfonate nanofiber composited with manganese dioxide without carbonation process. Adv. Powder Technol. 2022, 33, 103572. [Google Scholar] [CrossRef]
- Becerra-Arciniegas, R.A.; Narducci, R.; Ercolani, G.; Sgreccia, E.; Pasquin, L.; Di Vona, M.L.; Knauth, P. Model Long Side-Chain PPO-Based Anion Exchange Ionomers: Properties and Alkaline Stability. J. Phys. Chem. C 2020, 124, 1309–1316. [Google Scholar] [CrossRef]
- ISO 18134-3:2023; Solid Biofuels. Determination of Moisture Content. Part 3: Moisture in General Analysis Sample. International Organization for Standardization: Geneva, Switzerland, 2023.
- ISO 18123:2023; Solid Biofuels. Determination of Volatile Matter. International Organization for Standardization: Geneva, Switzerland, 2023.
- ISO 18122:2022; Solid Biofuels. Determination of Ash Content. International Organization for Standardization: Geneva, Switzerland, 2022.
- DIN 51719:1997-07; Testing of Solid Fuels-Solid Mineral Fuels-Determination of Ash Content. Deutsches Institut für Normung: Berlin, German, 1997.
- European Biochar Certificate (EBC). Richtlinien für Die Zertifizierung von Pflanzenkohle; Ithaka Institute: Arbaz, Switzerland, 2012; Version 9.3G vom 11; Available online: http://www.european-biochar.org (accessed on 20 May 2024).
- Vdlufa, V.M.A. Available online: https://www.vdlufa.de/Methodenbuch/index.php?option=com_content&view=article&id=7&Itemid=108&lang=de&lang=de (accessed on 20 May 2024).


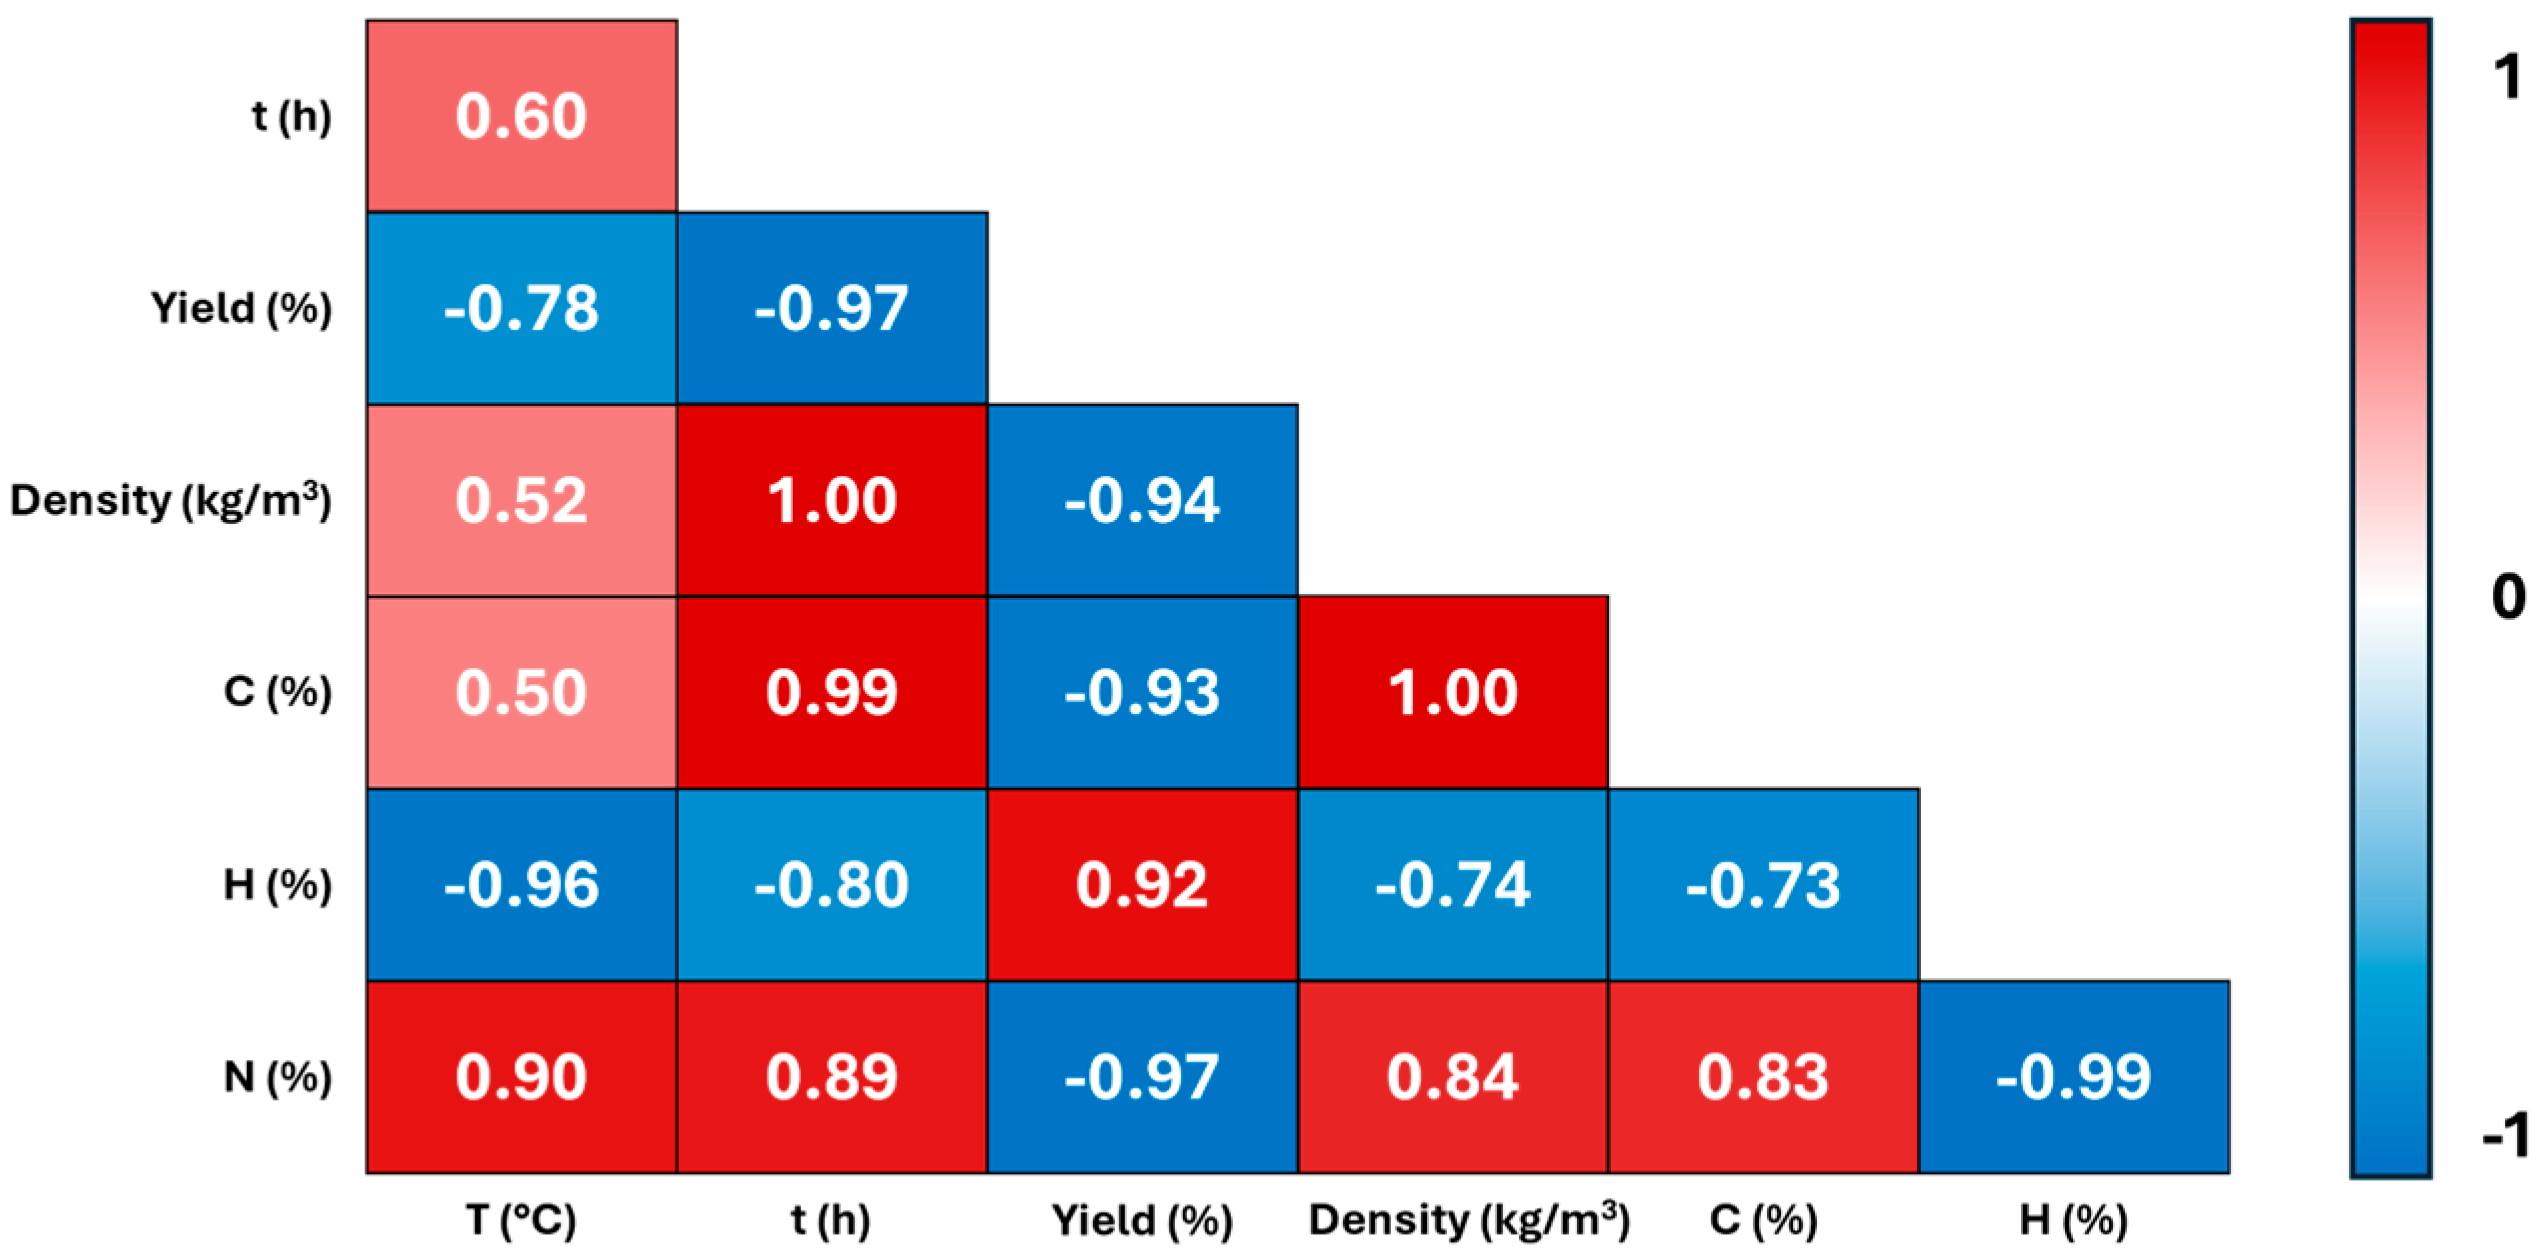
| Sample | T (°C) | Time (h) | Yield (%) | δ (kg/m3) | C (%) | H (%) | N (%) | O 2 (%) |
|---|---|---|---|---|---|---|---|---|
| 200_3 | 200 | 3 | 60 | 224 | 49.72 | 5.49 | 2.34 | 37.85 |
| 230_1 | 230 | 1 | 61 | 136 | 45.70 | 5.31 | 2.50 | 39.51 |
| 260_6 | 260 | 6 | 55 | 320 | 53.68 | 4.75 | 4.45 | 31.79 |
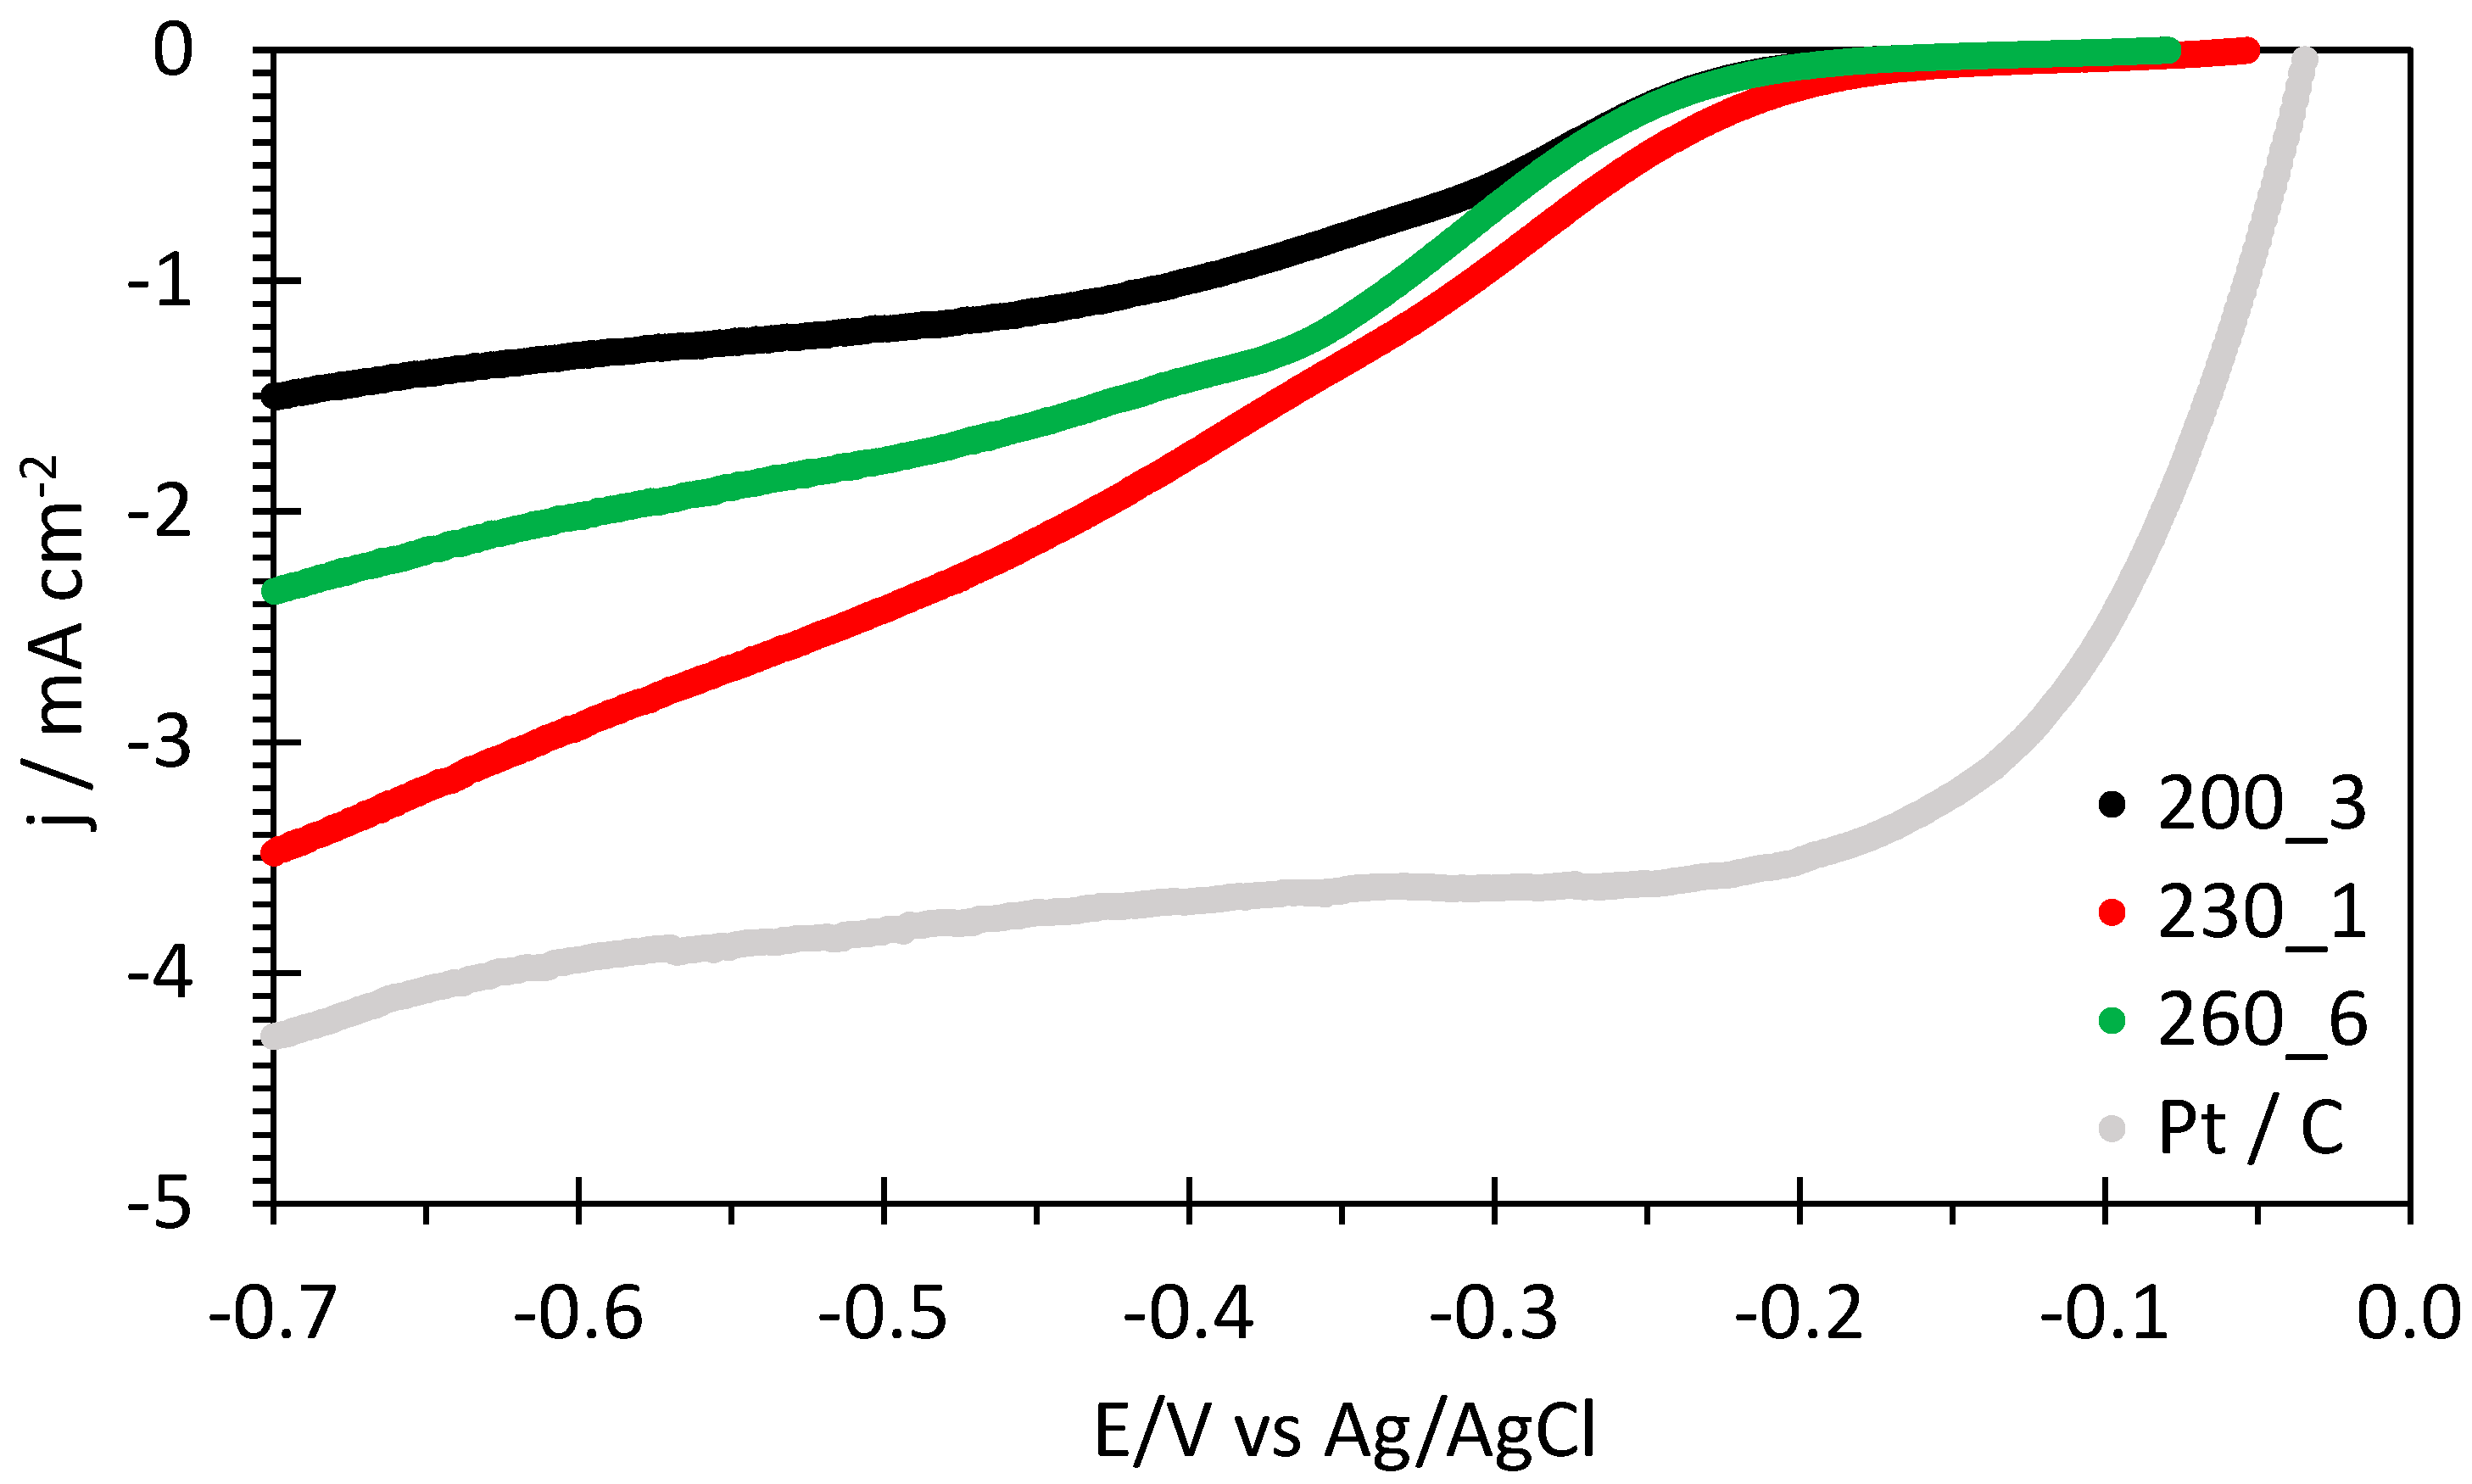
| Sample | Eonset ORR vs. RHE/V | E1/2 ORR vs. RHE/V | n ORR | B ORR/mV |
|---|---|---|---|---|
| 200_3 | 0.90 | 0.67 | 1.85 | 114 |
| 230_1 | 0.92 | 0.69 | 3.97 | 106 |
| 260_6 | 0.90 | 0.67 | 3.63 | 114 |
| Hydrochar (Synthesis Conditions) | Biomass Source | Eonset (V/RHE) | n | Ref. |
|---|---|---|---|---|
| 230 °C 1 h (230_1) | pine needles | 0.92 | 3.97 at 0.26 V/RHE | This work |
| 200 °C 12 h, treated in KMnO4 and H2SO4 (pH~3) | extracted avocado seed | N/A | 1.83 at 0.46 V/RHE | [33] |
| 200 °C 12 h, treated in KMnO4 and NH4OH (pH~9) | extracted avocado seed | N/A | 2.21 at 0.46 V/RHE | [33] |
| 800 °C, N-doped | wood chips | 0.90 | ~4 in the range 0.30–0.65 V/RHE | [34] |
| 250 °C 12 h, activated in KOH and incorporation of MnO2 | corncobs | 0.73 | 3.27 at 0.21 V/RHE | [62] |
| 250 °C 12 h, activated in KOH and incorporation of MnO2 | coffee waste grounds | 0.71 | 3.45 at 0.21 V/RHE | [63] |
| 250 °C 12 h, activated in KOH and incorporation of MnO2 | rice hull | 0.61 | 2.84 at 0.21 V/RHE | [63] |
| 250 °C 12 h, activated in KOH and incorporation of MnO2 | coconut sawdust | 0.60 | 3.23 at 0.21 V/RHE | [63] |
Disclaimer/Publisher’s Note: The statements, opinions and data contained in all publications are solely those of the individual author(s) and contributor(s) and not of MDPI and/or the editor(s). MDPI and/or the editor(s) disclaim responsibility for any injury to people or property resulting from any ideas, methods, instructions or products referred to in the content. |
© 2024 by the authors. Licensee MDPI, Basel, Switzerland. This article is an open access article distributed under the terms and conditions of the Creative Commons Attribution (CC BY) license (https://creativecommons.org/licenses/by/4.0/).
Share and Cite
Marrocchi, A.; Cerza, E.; Chandrasekaran, S.; Sgreccia, E.; Kaciulis, S.; Vaccaro, L.; Syahputra, S.; Vacandio, F.; Knauth, P.; Di Vona, M.L. Hydrochar from Pine Needles as a Green Alternative for Catalytic Electrodes in Energy Applications. Molecules 2024, 29, 3286. https://doi.org/10.3390/molecules29143286
Marrocchi A, Cerza E, Chandrasekaran S, Sgreccia E, Kaciulis S, Vaccaro L, Syahputra S, Vacandio F, Knauth P, Di Vona ML. Hydrochar from Pine Needles as a Green Alternative for Catalytic Electrodes in Energy Applications. Molecules. 2024; 29(14):3286. https://doi.org/10.3390/molecules29143286
Chicago/Turabian StyleMarrocchi, Assunta, Elisa Cerza, Suhas Chandrasekaran, Emanuela Sgreccia, Saulius Kaciulis, Luigi Vaccaro, Suanto Syahputra, Florence Vacandio, Philippe Knauth, and Maria Luisa Di Vona. 2024. "Hydrochar from Pine Needles as a Green Alternative for Catalytic Electrodes in Energy Applications" Molecules 29, no. 14: 3286. https://doi.org/10.3390/molecules29143286
APA StyleMarrocchi, A., Cerza, E., Chandrasekaran, S., Sgreccia, E., Kaciulis, S., Vaccaro, L., Syahputra, S., Vacandio, F., Knauth, P., & Di Vona, M. L. (2024). Hydrochar from Pine Needles as a Green Alternative for Catalytic Electrodes in Energy Applications. Molecules, 29(14), 3286. https://doi.org/10.3390/molecules29143286