
Novel TiO2-Supported Gold Nanoflowers for Efficient Photocatalytic NOx Abatement
 , , and
Abstract
:
1. Introduction
2. Results and Discussion
2.1. NFs suspension Characterization
2.2. Catalyst Characterization
2.2.1. TEM, SEM-EDXS, XRD and N2 Physisorption Analyses
2.2.2. ATR-FTIR, CO-DRIFTS and XPS Analyses
2.2.3. UV-Vis DR, PL and EPR Analyses
2.3. H2-Assisted NO2 Photocatalytic Reduction
- In the case of the TNR + NF(1.4) sample, the Au NPs have the form of deformed nanoflowers (TEM, Figure 2). The LSPR effect is most pronounced at the edges of the Au NPs (LSPR hot spots) and thus favors a nanostar or nanoflower-like shape of the Au NPs [87,88]. Since the form of Au NPs in the sample with the high Na-citrate content is more similar to a nanosphere, the LSPR effect is limited. This was also observed in the UV-Vis DR spectrum (Figure 9) due to the absence of the characteristic hump. Moreover, the Au NPs could partially behave like metals due to the low Schottky barrier (Table 1). Consequently, the utilization of visible light is limited.
- As we found in the EPR measurements, the C-containing species left over from the synthesis probably cover most of the surface of the TNR + NF(1.4) material. This acts as a protective shield that limits the absorption of visible light and hinders the adsorption of NO2. NO2 is probably activated in a similar way to NO [89] by the transfer of electrons from the excited metal to the anti-bonding π orbital of NO2. As access to the NO2 molecule is restricted, it is not activated and cannot be further reduced to other products.
- In addition, the C-containing species have a high tendency to trap (scavenge) photogenerated electrons (EPR measurements), which means that they intercept the charge carriers. If more Na-citrate is used in the synthesis, more C-containing species are likely to remain near or at the Au/TiO2 interface after the synthesis process. Therefore, in the case of the TNR + NF(1.4) sample, they can easily capture the photogenerated electrons of Ti3+, which means that they cannot be injected into the Au NPs even with a low Schottky barrier and vice versa. Even if the NO2 molecules are adsorbed or could interact with the Au NPs, the electron transfer cannot take place as no electrons reach the Au NPs. In the case of the TNR + NF(0.7) sample, some of the photogenerated electrons are transferred to the Au NPs, even with some content of the C-containing species (electron scavengers), where they can activate H2 or NO2. Similar results for analog systems were obtained by Huang et al. [90] and Siemer et al. [91]. This is possible for the TNR + NF(0.7) material as the Au NPs have sharper edges in the nanoflower structure and thus provide an improved Au/TiO2 interface as well as an enhanced LSPR effect at the hot spots (Au NP edges) [87,88].
3. Experimental
3.1. Materials
3.2. Catalyst Synthesis
3.3. Catalyst Characterization
3.4. H2-Assisted NO2 Photocatalytic Reduction
4. Conclusions
Supplementary Materials
Author Contributions
Funding
Institutional Review Board Statement
Informed Consent Statement
Data Availability Statement
Conflicts of Interest
References
- Schneider, J.; Matsuoka, M.; Takeuchi, M.; Zhang, J.; Horiuchi, Y.; Anpo, M.; Bahnemann, D.W. Understanding TiO2 Photocatalysis: Mechanisms and Materials. Chem. Rev. 2014, 114, 9919–9986. [Google Scholar] [CrossRef]
- Hoffmann, M.R.; Martin, S.T.; Choi, W.; Bahnemann, D.W. Environmental Applications of Semiconductor Photocatalysis. Chem. Rev. 1995, 95, 69–96. [Google Scholar] [CrossRef]
- Fujishima, A.; Rao, T.N.; Tryk, D.A. Titanium dioxide photocatalysis. J. Photochem. Photobiol. C 2000, 1, 1–21. [Google Scholar] [CrossRef]
- Andreozzi, R.; Caprio, V.; Insola, A.; Marotta, R. Advanced oxidation processes (AOP) for water purification and recovery. Catal. Today 1999, 53, 51–59. [Google Scholar] [CrossRef]
- Pelaez, M.; Nolan, N.T.; Pillai, S.C.; Seery, M.K.; Falaras, P.; Kontos, A.G.; Dunlop, P.S.M.; Hamilton, J.W.J.; Byrn, J.A.; O’Shea, K.; et al. A review on the visible light active titanium dioxide photocatalysts for environmental applications. Appl. Catal. B 2012, 125, 331–349. [Google Scholar] [CrossRef]
- Žerjav, G.; Žižek, K.; Zavašnik, J.; Pintar, A. Brookite vs. rutile vs. anatase: What’s behind their various photocatalytic activities? J. Environ. Chem. Eng. 2022, 10, 107722. [Google Scholar] [CrossRef]
- Dette, C.; Pérez-Osorio, M.A.; Kley, C.S.; Punke, P.; Patrick, C.E.; Jacobson, P.; Giustino, F.; Jung, S.; Kern, K. TiO2 anatase with a bandgap in the visible region. Nano Lett. 2014, 14, 6533–6538. [Google Scholar] [CrossRef]
- Bahnemann, D.; Bochelmann, D.; Goslich, R. Mechanistic studies of water detoxification in illuminated TiO2 suspensions. Sol. Energy Mater. 1991, 24, 564–583. [Google Scholar] [CrossRef]
- Zhang, J.; Suo, X.; Zhang, J.; Han, B.; Li, P.; Xue, Y.; Shi, H. One-pot synthesis of Au/TiO2 heteronanostructure composites with SPR effect and its antibacterial activity. Mat. Lett. 2016, 162, 235–237. [Google Scholar] [CrossRef]
- Faraday, M. Experimental relations of gold (and other metals) to light. Philos. Trans. R. Soc. Lond. 1857, 147, 36. [Google Scholar] [CrossRef]
- Sharma, V.; Park, K.; Srinivasarao, M. Colloidal dispersion of gold nanorods: Historical background, optical properties, seed-mediated synthesis, shape separation and self-assembly. Mater. Sci. Eng. R 2009, 65, 1–38. [Google Scholar] [CrossRef]
- Das, M.; Shim, K.H.; An, S.S.A.; Yi, D.K. Review on gold nanoparticles and their applications. Toxicol. Environ. Health Sci. 2011, 3, 193–205. [Google Scholar] [CrossRef]
- Zsigmondy, R. The Chemistry of Colloids; John Wiley & Sons, Inc.: New York, NY, USA, 1917. [Google Scholar]
- Zsigmondy, R. Colloids and the Ultramicroscope; John Wiley & Sons, Inc.: New York, NY, USA, 1909. [Google Scholar]
- Amrollahi, R.; Hamdy, M.S.; Mul, G. Understanding promotion of photocatalytic activity of TiO2 by Au nanoparticles. J. Catal. 2014, 319, 194–199. [Google Scholar] [CrossRef]
- Peng, G.; Tisch, U.; Adams, O.; Hakim, M.; Shehada, N.; Broza, Y.Y.; Billan, S.; Abdah-Bortnyak, R.; Kuten, A.; Haick, H. Diagnosing lung cancer in exhaled breath using gold nanoparticles. Nat. Nanotech. 2009, 4, 669–673. [Google Scholar] [CrossRef]
- Brown, S.D.; Nativo, P.; Smith, J.-A.; Stirling, D.; Edwards, P.R.; Venugopal, B.; Flint, D.J.; Plumb, J.A.; Graham, D.; Wheate, N.J. Gold nanoparticles for the improved anticancer drug delivery of the active component of oxaliplatin. J. Am. Chem. Soc. 2010, 132, 4678–4684. [Google Scholar] [CrossRef]
- Wu, X.; Centeno, A.; Zhang, X.; Darvill, D.; Ryan, M.P.; Riley, D.J.; Alford, N.M.; Xie, F. Broadband plasmon photocurrent generation from Au nanoparticles/mesoporous TiO2 nanotube electrode. Sol. Energy Mater. Sol. Cells 2015, 138, 80–85. [Google Scholar] [CrossRef]
- Zhu, J.; Xu, Z.; Lu, B. Ultrafine Au nanoparticles decorated NiCo2O4 nanotubes as anode material for high-performance supercapacitor and lithium-ion battery applications. Nano Energy 2014, 7, 114–123. [Google Scholar] [CrossRef]
- Daniel, M.-C.; Astruc, D. Gold Nanoparticles: Assembly, Supramolecular Chemistry Quantum-Size-Related Properties, and Applications toward Biology, Catalysis, and Nanotechnology. Chem. Rev. 2004, 104, 293–346. [Google Scholar] [CrossRef]
- Smoak, E.M.; Carlo, A.D.; Fowles, C.C.; Banerjee, I.A. Self-assembly of gibberellic amide assemblies and their applications in the growth and fabrication of ordered gold nanoparticles. Nanotechnology 2010, 21, 025603. [Google Scholar] [CrossRef]
- Bouhadoun, S.; Guillard, C.; Dapozze, F.; Singh, S.; Amans, D.; Bouclé, J.; Herlin-Boime, N. One-step synthesis of N-doped and Au-loaded TiO2 nanoparticles by laser pyrolysis: Application in photocatalysis. Appl. Catal. B 2015, 174–175, 367–375. [Google Scholar] [CrossRef]
- Li, J.; Wu, J.; Zhang, X.; Liu, Y.; Zhou, D.; Sun, H.; Zhang, H.; Yang, B. Controllable Synthesis of Stable Urchin-like Gold Nanoparticles Using Hydroquinone to Tune the Reactivity of Gold Chloride. J. Phys. Chem. C 2011, 115, 3630–3637. [Google Scholar] [CrossRef]
- Ji, Y.; Ren, M.; Li, Y.; Huang, Z.; Shu, M.; Yang, H.; Xiong, Y.; Xu, Y. Detection of Aflatoxin B1 with Immunochromatographic Test Strips: Enhanced Signal Sensitivity using Gold Nanoflowers. Talanta 2015, 142, 206–212. [Google Scholar] [CrossRef]
- Pacaud, M.; Hervé-Aubert, K.; Soucé, M.; Makki, A.A.; Bonnier, F.; Fahmi, A.; Feofanov, A.; Chourpa, I. One-step synthesis of gold nanoflowers of tunable size and adsorption wavelength in the red & deep red range for SERS spectroscopy. Spectrochim. Acta Part A 2020, 225, 117502. [Google Scholar] [CrossRef]
- Patel, A.S.; Juneja, S.; Kanaujia, P.K.; Maurya, V.; Prakash, G.V.; Chakraborti, A.; Bhattacharya, J. Gold nanoflowers as efficient hosts for SERS based sensing and bio-imaging. Nano-Struct. Nano-Objects 2018, 16, 329–336. [Google Scholar] [CrossRef]
- Huang, X.; Huang, T.; Li, X.; Huang, Z. Flower-like gold nanoparticles-based immunochromatographic test strip for rapid simultaneous detection of fumonisin B1 and deoxynivalenol in Chinese traditional medicine. J. Pharm. Biomed. Anal. 2020, 177, 112895. [Google Scholar] [CrossRef]
- Arshad, M.S.; Trafela, Š.; Žužek Rožman, K.; Kovač, J.; Djinović, P.; Pintar, A. Determination of Schottky barrier height and enhanced photoelectron generation in novel plasmonic immobilized multisegmented (Au/TiO2) nanorod arrays (NRAs) suitable for solar energy conversion applications. J. Mater. Chem. 2017, 5, 10509–10516. [Google Scholar] [CrossRef]
- Gołąbiewska, A.; Malankowska, A.; Jarek, M.; Lisowski, W.; Nowaczyk, G.; Jurga, S.; Zaleska-Medynska, A. The effect of gold shape and size on the properties and visible light-induced photoactivity of Au-TiO2. Appl. Catal. B 2016, 196, 27–40. [Google Scholar] [CrossRef]
- Kaur, R.; Pal, B. Size and shape dependent attachments of Au nanostructures of TiO2 for optimum reactivity of Au-TiO2 photocatalysis. J. Mol. Catal. A 2012, 355, 39–43. [Google Scholar] [CrossRef]
- Žerjav, G.; Albreht, A.; Vovk, I.; Pintar, A. Revisiting terephthalic acid and coumarin as probes for photoluminescent determination of hydroxyl radical formation rate in heterogeneous photocatalysis. Appl. Catal. A 2021, 598, 117566. [Google Scholar] [CrossRef]
- Žerjav, G.; Zavašnik, J.; Kovač, J.; Pintar, A. The influence of Schottky barrier height onto visible-light triggered photocatalytic activity of TiO2+Au composites. Appl. Surf. Sci. 2021, 543, 148799. [Google Scholar] [CrossRef]
- Bamola, P.; Sharma, M.; Dwivedi, C.; Singh, B.; Ramakrishna, S.; Dalapati, G.K.; Sharma, H. Interfacial interaction of plasmonic nanoparticles (Ag, Au) decorated floweret TiO2 nanorod hybrids for enhanced visible light driven photocatalytic activity. Mat. Sci. Eng. B 2021, 273, 115403. [Google Scholar] [CrossRef]
- Mora-Seró, I.; Bisquert, J. Fermi Level of Surface States in TiO2 Nanoparticles. Nano Lett. 2003, 3, 945–949. [Google Scholar] [CrossRef]
- McCarron, G. Air Pollution and human health hazards: A compilation of air toxins acknowledged by the gas industry in Queensland’s Darling Downs. Int. J. Environ. 2018, 75, 171–185. [Google Scholar] [CrossRef]
- Morrow, P.E. Toxicological data on NOX: An overview. J. Toxicol. Environ. Health 1984, 13, 205–227. [Google Scholar] [CrossRef]
- More, P.M.; Nguyen, D.L.; Granger, P.; Dujardin, C.; Dongare, M.K.; Umbarkar, S.B. Activation by pretreatment of Ag-Au/Al2O3 bimetallic catalysts to improve low temperature HC-SCR of NOX for lean burn engine exhaust. Appl. Catal. B 2015, 174–175, 145–156. [Google Scholar] [CrossRef]
- Hahn, C.; Endisch, M.; Schott, F.J.P.; Kureti, S. Kinetic modelling of the NOX reduction by H2 on Pt/WO3/ZrO2 catalysts in excess of O2. Appl. Catal. B 2015, 168–169, 429–440. [Google Scholar] [CrossRef]
- Costa, C.N.; Efstathiou, A.M. Mechanistic Aspects of the H2-SCR of NO on a Novel Pt/MgO-CeO2 Catalyst. J. Phys. Chem. C 2007, 111, 3010–3020. [Google Scholar] [CrossRef]
- Pekkari, A.; Say, Z.; Susarrey-Arce, A.; Langhammer, C.; Härelind, H.; Sebastian, V.; Moth-Poulsen, K. Continuous Microfluidic Synthesis of Pd Nanocubes and PdPt Core-Shell Nanoparticles and Their Catalysis of NO2 Reduction. ACS Appl. Mater. Interfaces 2019, 11, 36196–36204. [Google Scholar] [CrossRef]
- Žerjav, G.; Say, Z.; Zavašnik, J.; Finšgar, M.; Langhammer, C.; Pintar, A. Photo, thermal and photothermal activity of TiO2 supported Pt catalysts for plasmon-driven environmental applications. J. Environ. Chem. Eng. 2023, 11, 110209. [Google Scholar] [CrossRef]
- Das, A.; Dagar, P.; Kumar, S.; Ganguli, A.K. Effect of Au nanoparticles loading on the photo-electrochemical response of Au-P25-TiO2 catalysts. J. Sol. State Chem. 2020, 281, 121051. [Google Scholar] [CrossRef]
- Jovic, V.; Chen, W.-T.; Sun-Waterhouse, D.; Blackford, M.G.; Idriss, H.; Waterhouse, G.I.N. Effect of gold loading and TiO2 support composition on the activity of Au/TiO2 photocatalysts for H2 production from ethanol-water mixtures. J. Catal. 2013, 305, 307–317. [Google Scholar] [CrossRef]
- Žerjav, G.; Roškarič, M.; Zavašnik, J.; Kovač, J.; Pintar, A. Effect of Au loading on Schottky barrier height in TiO2+Au plasmonic photocatalysts. Appl. Surf. Sci. 2022, 579, 152196. [Google Scholar] [CrossRef]
- Du, M.; Sun, D.; Yang, H.; Huang, J.; Jing, X.; Odoom-Wubah, T.; Wang, H.; Jia, L.; Li, Q. Influence of Au Particle Size on Au/TiO2 Catalysts for CO Oxidation. J. Phys. Chem. C 2014, 118, 19150–19157. [Google Scholar] [CrossRef]
- Murdoch, M.; Waterhouse, G.I.N.; Nadeem, M.A.; Metson, J.B.; Keane, M.A.; Howe, R.F.; Lloca, J.; Idriss, H. The effect of gold loading and particle size on photocatalytic hydrogen production from ethanol over Au/TiO2 nanoparticles. Nat. Chem. 2011, 3, 489–492. [Google Scholar] [CrossRef] [PubMed]
- Ayati, A.; Ahmadpour, A.; Bamoharram, F.F.; Tanhaei, B.; Mänttäri, M.; Sillanpää, M. A review on catalytic applications of Au/TiO2 nanoparticles in the removal of water pollutant. Chemosphere 2014, 107, 163–174. [Google Scholar] [CrossRef] [PubMed]
- Primo, A.; Corma, A.; Garcia, H. Titania supported gold nanoparticles as photocatalyst. Phys. Chem. Chem. Phys. 2011, 13, 886–910. [Google Scholar] [CrossRef]
- Kaplan, R.; Erjavec, B.; Dražić, G.; Grdadolnik, J.; Pintar, A. Simple synthesis of anatase/rutile/brookite TiO2 nanocomposite with superior mineralization potential for photocatalytic degradation of water pollutants. Appl. Catal. B 2016, 181, 465–474. [Google Scholar] [CrossRef]
- Kaplan, R.; Erjavec, B.; Pintar, A. Enhanced photocatalytic activity of single-phase, nanocomposite and physically mixed TiO2 polymorphs. Appl. Catal. A 2015, 489, 51–60. [Google Scholar] [CrossRef]
- Bagheri, S.; Julkapli, N.M. Mixed-phase TiO2 photocatalysis: Correlation between phase composition and photodecomposition of water pollutants. Rev. Inorg. Chem. 2017, 37, 11–28. [Google Scholar] [CrossRef]
- Nehl, C.L.; Liao, H.; Hafner, J.H. Optical properties of star-shaped gold nanoparticles. Nano Lett. 2006, 6, 683–688. [Google Scholar] [CrossRef]
- Chen, X.; Zhang, J.; Xie, J.; Huang, Z. Development of two immunochromatographic test strips based on gold nanospheres and gold nanoflowers for the rapid and simultaneous detection of aflatoxin B1 and aristolochic acid a in dual-use medicinal and food ingredients. Microchem. J. 2023, 186, 108307. [Google Scholar] [CrossRef]
- Zavašnik, J.; Šestan, A.; Shvalya, V. Chapter Seven—Microscopic tecniques for the characterisation of metal-based nanoparticles. Compr. Anal. Chem. 2021, 93, 241–284. [Google Scholar] [CrossRef]
- Zhao, L.; Jiang, D.; Cai, Y.; Ji, X.; Xie, R.; Yang, W. Tuning the size of gold nanoparticles in the citrate reduction by chloride ions. Nanoscale 2012, 4, 5071. [Google Scholar] [CrossRef] [PubMed]
- Ji, X.; Song, X.; Li, J.; Bai, Y.; Yang, W.; Peng, X. Size control of gold nanocrystals in citrate reduction: The third role of citrate. J. Am. Chem. Soc. 2007, 129, 13939–13948. [Google Scholar] [CrossRef]
- Lin, L.; Zhong, Q.; Zheng, Y.; Cheng, Y.; Qi, R.; Huang, R. Size effect of Au nanoparticles in Au-TiO2−X photocatalyst. Chem. Phys. Lett. 2021, 770, 138457. [Google Scholar] [CrossRef]
- García-Bordejé, E.; Dongil, A.B.; Moral, J.; Conesa, J.M.; Guerrero-Ruiz, A.; Rodríguez-Ramos, I. Cyclic performance in CO2 capture-methanation of bifunctional Ru with different base metals: Effect of the reactivity of COX ad-species. J. CO2 Util. 2023, 68, 102370. [Google Scholar] [CrossRef]
- Sotomayor, F.J.; Cychosz, K.A.; Thommes, M. Characterization of micro/mesoporous materials by physisorption: Concepts and case studies. Acc. Mater. Surf. Res. 2018, 3, 34–50. [Google Scholar]
- Biesinger, M.C.; Payne, B.P.; Grosvenor, A.P.; Lau, L.W.M.; Gerson, A.R. Resolving surface chemical states in XPS analysis of first row transition metals, oxides and hydroxides: Sc, Ti, V, Cu and Zn. App. Surf. Sci. 2010, 257, 887–898. [Google Scholar] [CrossRef]
- Max, J.J.; Chapados, C. Infrared spectroscopy of aqueous carboxylic acids: Comparison between different acids and their salts. J. Phys. Chem. A 2004, 108, 3324–3337. [Google Scholar] [CrossRef]
- Park, J.W.; Shumaker-Parry, J.S. Structural study of citrate layers on gold nanoparticles: Role of intermolecular interactions in stabilizing nanoparticles. J. Am. Chem. Soc. 2014, 136, 1907–1921. [Google Scholar] [CrossRef]
- Wulandari, P.; Nagahiro, T.; Fukada, N.; Kimura, Y.; Niwano, M.; Tamada, K. Characterization of citrates on gold and silver nanoparticles. J. Colloid Interf. Sci. 2015, 438, 244–248. [Google Scholar] [CrossRef] [PubMed]
- Sankar, M.; He, Q.; Morad, M.; Pritchard, J.; Freakley, S.J.; Edwards, J.K.; Taylor, S.H.; Morgan, D.J.; Carley, A.F.; Knight, D.W.; et al. Synthesis of stable ligand-free gold-palladium nanoparticles using a simple excess anion method. ACS Nano 2012, 6, 6600–6613. [Google Scholar] [CrossRef] [PubMed]
- Jiang, P.; Porsgaard, S.; Borondics, F.; Köber, M.; Caballero, A.; Bluhm, H.; Besenbacher, F.; Salmeron, M. Room-temperature reaction of oxygen with gold: An in situ ambient-pressure X-ray photoelectron spectroscopy investigation. J. Am. Chem. Soc. 2010, 132, 2858–2859. [Google Scholar] [CrossRef]
- Ayiania, M.; Smith, M.; Hensley, A.J.R.; Scudiero, L.; McEwen, J.S.; Garcia-Perez, M. Deconvoluting the XPS spectra for nitrogen-doped chars: An analysis from first principles. Carbon 2020, 162, 528–544. [Google Scholar] [CrossRef]
- La Spina, R.; Spampinato, V.; Gilliland, D.; Ojea-Jimenez, I.; Ceccone, G. Influence of different cleaning processes on the surface chemistry of gold nanoparticles. Biointerphases 2017, 12, 031003. [Google Scholar] [CrossRef] [PubMed]
- Arciniegas Jaimes, D.M.; Márquez, P.; Ovalle, A.; Escrig, J.; Pérez, O.L.; Bajales, N. Permalloy nanowires/graphene oxide composite with enhanced conductive properties. Sci. Rep. 2020, 10, 13742. [Google Scholar] [CrossRef] [PubMed]
- Shimada, S.; Hiroi, T.; Ida, T.; Mizuno, M.; Endo, K.; Kurmaev, E.Z.; Moewes, A. X-ray photoelectron and carbon Kα emission measurements and calculations of O-, CO-, N-, and S-containing substances. J. Polym. Sci. Part B Polym. Phys. 2007, 45, 162–172. [Google Scholar] [CrossRef]
- Marri, I.; Ossicini, S. Oxygen vacancy effects on the Schottky barrier height at the Au/TiO2 (110) interface: A first principle study. Solid State Commun. 2008, 147, 205–207. [Google Scholar] [CrossRef]
- Slapničar, Š.; Žerjav, G.; Zavašnik, J.; Finšgar, M.; Pintar, A. Synthesis and characterization of plasmonic Au/TiO2 nanorod solids for heterogeneous photocatalysis. J. Environ. Chem. Eng. 2023, 11, 109835. [Google Scholar] [CrossRef]
- Priebe, J.B.; Radnik, J.; Lennox, A.J.J.; Pohl, M.-M.; Karnahl, M.; Hollmann, D.; Grabow, K.; Bentrup, U.; Junge, H.; Beller, M.; et al. Solar Hydrogen Production by Plasmonic Au-TiO2 Catalysts: Impact of Synthesis Protocol and TiO2 Phase on Charge Transfer Efficiency and H2 Evolution Rates. ACS Catal. 2015, 5, 2137–2148. [Google Scholar] [CrossRef]
- Abdel-Mageed, A.M.; Wiese, K.; Hauble, A.; Bansmann, J.; Rabeah, J.; Parlinska-Wojtan, M.; Brückner, A.; Behm, R.J. Steering the selectivity in CO2 reduction on highly active Ru/TiO2 catalysts: Support particle size effects. J. Catal. 2021, 401, 160–173. [Google Scholar] [CrossRef]
- Attwood, A.L.; Murphy, D.M.; Edwards, J.L.; Egerton, T.A.; Harrison, R.W. An EPR study of thermally and photochemically generated oxygen radicals on hydrated and dehydrated titania surfaces. Res. Chem. Intermed. 2003, 29, 449–465. [Google Scholar] [CrossRef]
- Coronado, J.M.; Maira, A.J.; Conesa, J.C.; Yeung, K.L.; Augugliaro, V.; Soria, J. EPR Study of the Surface Characteristics of Nanostructured TiO2 under UV Irradiation. Langmuir 2001, 17, 5368–5374. [Google Scholar] [CrossRef]
- Al-Madanat, O.; Nunes, B.N.; AlSalka, Y.; Hakki, A.; Curti, M.; Patrocinio, A.O.T.; Bahnemann, D.W. Application of EPR Spectroscopy in TiO2 and Nb2O5 Photocatalysis. Catalysts 2021, 11, 1514. [Google Scholar] [CrossRef]
- Rajh, T.; Poluektov, O.G.; Thurnauer, M.C. Charge Separation in Titanium Oxide Nanocrystalline Semiconductors Revialed by Magnetic Resonance. In Chemical Physics of Nanostructured Semiconductors; Kokorin, A.I., Bahnemann, D.W., Eds.; VSP-Brill Academic Publishers: Utrecht, The Netherlands, 2003; pp. 1–34. [Google Scholar]
- Kobkeatthawin, T.; Trakulmututa, J.; Amornsakchai, T.; Kajitvichyanukul, P.; Smith, S.M. Identification of Active Species in Photodegradation of Aqueous Imidacloprid over gC3N4/TiO2 Nanocomposites. Catalysts 2022, 12, 120. [Google Scholar] [CrossRef]
- Roškarič, M.; Zavašnik, J.; Zámbó, D.; Kotnik, T.; Kovačič, S.; Žerjav, G.; Pintar, A. Optimization Method Based on Simplex for Surface Area Improved Photocatalytic Performance of gC3N4. ACS Catal. 2023, 13, 13282–13300. [Google Scholar] [CrossRef]
- Caretti, I.; Keulemans, M.; Verbruggen, S.W.; Lenaerts, S.; Doorslaer, S.V. Light-Induced Processes in Plasmonic Gold/TiO2 Photocatalysts Studied by Electron Paramagnetic Resonance. Top. Catal. 2015, 58, 776–782. [Google Scholar] [CrossRef]
- Chiesa, M.; Paganini, M.C.; Livraghi, S.; Giamello, E. Charge trapping in TiO2 polymorphs as seen by Electron Paramagnetic Resonance spectroscopy. Phys. Chem. Chem. Phys. 2013, 15, 9435–9447. [Google Scholar] [CrossRef]
- Debska, B.; Spychaj-Fabisiak, E.; Szulc, W.; Gaj, R.; Banach-Szott, M. EPR Spectroscopy as a tool to characterize the maturity degree of humic acids. Materials 2021, 14, 3410. [Google Scholar] [CrossRef]
- Karunakaran, C.; Rajkumar, R.; Balamurugan, M. Principles of Nuclear Magnetic Resonance and Pulsed Nuclear Magnetic Resonance. Spin Reson. Spectros. 2018, 1–47. [Google Scholar] [CrossRef]
- Priebe, J.B.; Karnahl, M.; Junge, H.; Beller, M.; Hollmann, D.; Bruckner, A. Water Reduction with Visible Light: Synergy between Optical Transitions and Electron Transfer in Au-TiO2 Catalysts Visualized by In situ EPR Spectroscopy. Angew. Chem. Int. Ed. 2013, 52, 11420–11424. [Google Scholar] [CrossRef] [PubMed]
- Yang, L.; Hakki, A.; Wang, F.; Macphee, D.E. Different Roles of Water in Photocatalytic DeNOX Mechanisms on TiO2: Basis for Engineering Nitrate Selectivity? ACS Appl. Mater. Interfaces 2017, 9, 17034–17041. [Google Scholar] [CrossRef] [PubMed]
- Yazaydin, A.Ö.; Benin, A.I.; Faheem, S.A.; Jakubczak, P.; Low, J.J.; Willis, R.R.; Snurr, R.Q. Enhanced CO2 Adsorption in Metal-Organic Frameworks via Occupation of Open-Metal Sites by Coordinated Water Molecules. Chem. Mater. 2009, 21, 1425–1430. [Google Scholar] [CrossRef]
- Castillo, A.S.; Hermo, M.C.; González, B.R.; Lorenzo, M.P.; Wang, Z.; Kong, X.T.; Govorov, A.O.; Duarte, M.A.C. Boosting Hot Electron-Driven Photocatalysis through Anisotropic Plasmonic Nanoparticles with Hot Spots in Au-TiO2 Nanoarchitectures. J. Phys. Chem. C 2016, 120, 11690–11699. [Google Scholar] [CrossRef]
- Luna, M.; Gatica, J.M.; Vidal, H.; Mosquera, M.J. Au-TiO2-SiO2 photocatalysts with NOX depolluting activity: Influence of gold particle size and loading. Chem. Eng. J. 2019, 368, 417–427. [Google Scholar] [CrossRef]
- Anpo, M.; Nomura, T.; Kitao, T.; Giamello, E.; Murphy, D.; Che, M.; Fox, M.A. Approach to De-NOX-ing photocatalysis. II excited state of copper ions supported on silica and photocatalytic activity for no decoposition. Res. Chem. Intermed. 1991, 15, 225–237. [Google Scholar] [CrossRef]
- Huang, J.; He, S.; Goodsell, J.L.; Mulcahy, J.R.; Guo, W.; Angerhofer, A.; Wei, W.D. Manipulating Atomic Structures at the Au/TiO2 Interface for O2 Activation. J. Am. Chem. Soc. 2020, 142, 6456–6460. [Google Scholar] [CrossRef] [PubMed]
- Siemer, N.; Luken, A.; Zalibera, M.; Frenzel, J.; Santiburcio, D.M.; Savitsky, A.; Lubitz, W.; Muhler, M.; Marx, D.; Strunk, J. Atomic-Scale Explanation of O2 Activation at the Au-TiO2 Interface. J. Am. Chem. Soc. 2018, 140, 18082–18092. [Google Scholar] [CrossRef]
- Diebold, U. The surface science of titanium dioxide. Surf. Sci. Rep. 2003, 48, 53–229. [Google Scholar] [CrossRef]
- Hu, Y.; Martra, G.; Zhang, J.; Higashimoto, S.; Coluccia, S.; Anpo, M. Characterization of the Local Structures of Ti-MCM-41 and Their Photocatalytic Reactivity for the Decomposition of NO into N2 and O2. J. Phys. Chem. B 2006, 110, 1680–1685. [Google Scholar] [CrossRef]
- Yamashita, H.; Ichihashi, Y.; Zhang, S.G.; Matsumura, Y.; Souma, Y.; Tatsumi, T.; Anpo, M. Photocatalytic decomposition of NO at 275 K on titanium oxide catalysts anchored within zeolite cavities and framework. Appl. Surf. Sci. 1997, 121, 305–309. [Google Scholar] [CrossRef]
- Wu, Q.; van de Krol, R. Selective Photoreduction of Nitric Oxide to Nitrogen by Nanostructured TiO2 Photocatalysts: Role of Oxygen Vacancies and Iron Dopant. J. Am. Chem. Soc. 2012, 134, 9369–9375. [Google Scholar] [CrossRef] [PubMed]
- Mino, L.; Cazzaniga, M.; Moriggi, F.; Ceotto, M. Elucidating NOX Surface Chemistry at the Anatase (101) Surface in TiO2 Nanoparticles. J. Phys. Chem. C 2023, 127, 437–449. [Google Scholar] [CrossRef] [PubMed]
- Žerjav, G.; Arshad, M.S.; Djinović, P.; Zavašnik, J.; Pintar, A. Electron trapping energy states of TiO2-WO3 composites and their influence on photocatalytic degradation of bisphenol A. Appl. Catal. B 2017, 209, 273–284. [Google Scholar] [CrossRef]
- Turkevich, J.; Stevenson, P.C.; Hillier, J. A study of the nucleation and growth processes in the synthesis of colloidal gold. J. Discuss. Faraday Soc. 1951, 11, 55–74. [Google Scholar] [CrossRef]
- Boccuzzi, F.; Chiorino, A. Chemisorption and catalytic properties of gold nanoparticles on different oxides: Electronic or structural effects? Stud. Surf. Sci. Catal. 2001, 140, 77–86. [Google Scholar] [CrossRef]
- Hartshorn, H.; Purshell, C.J.; Chandler, B.D. Adsorption of CO on Supported Gold Nanoparticle Catalysts: A Comparative Study. J. Phys. Chem. C 2009, 113, 10718–10725. [Google Scholar] [CrossRef]


| Sample | TNR + NF(0.7) | TNR + NF(1.4) | TNR + NF(0.7, heated) | TNR + NF(1.4, heated) |
|---|---|---|---|---|
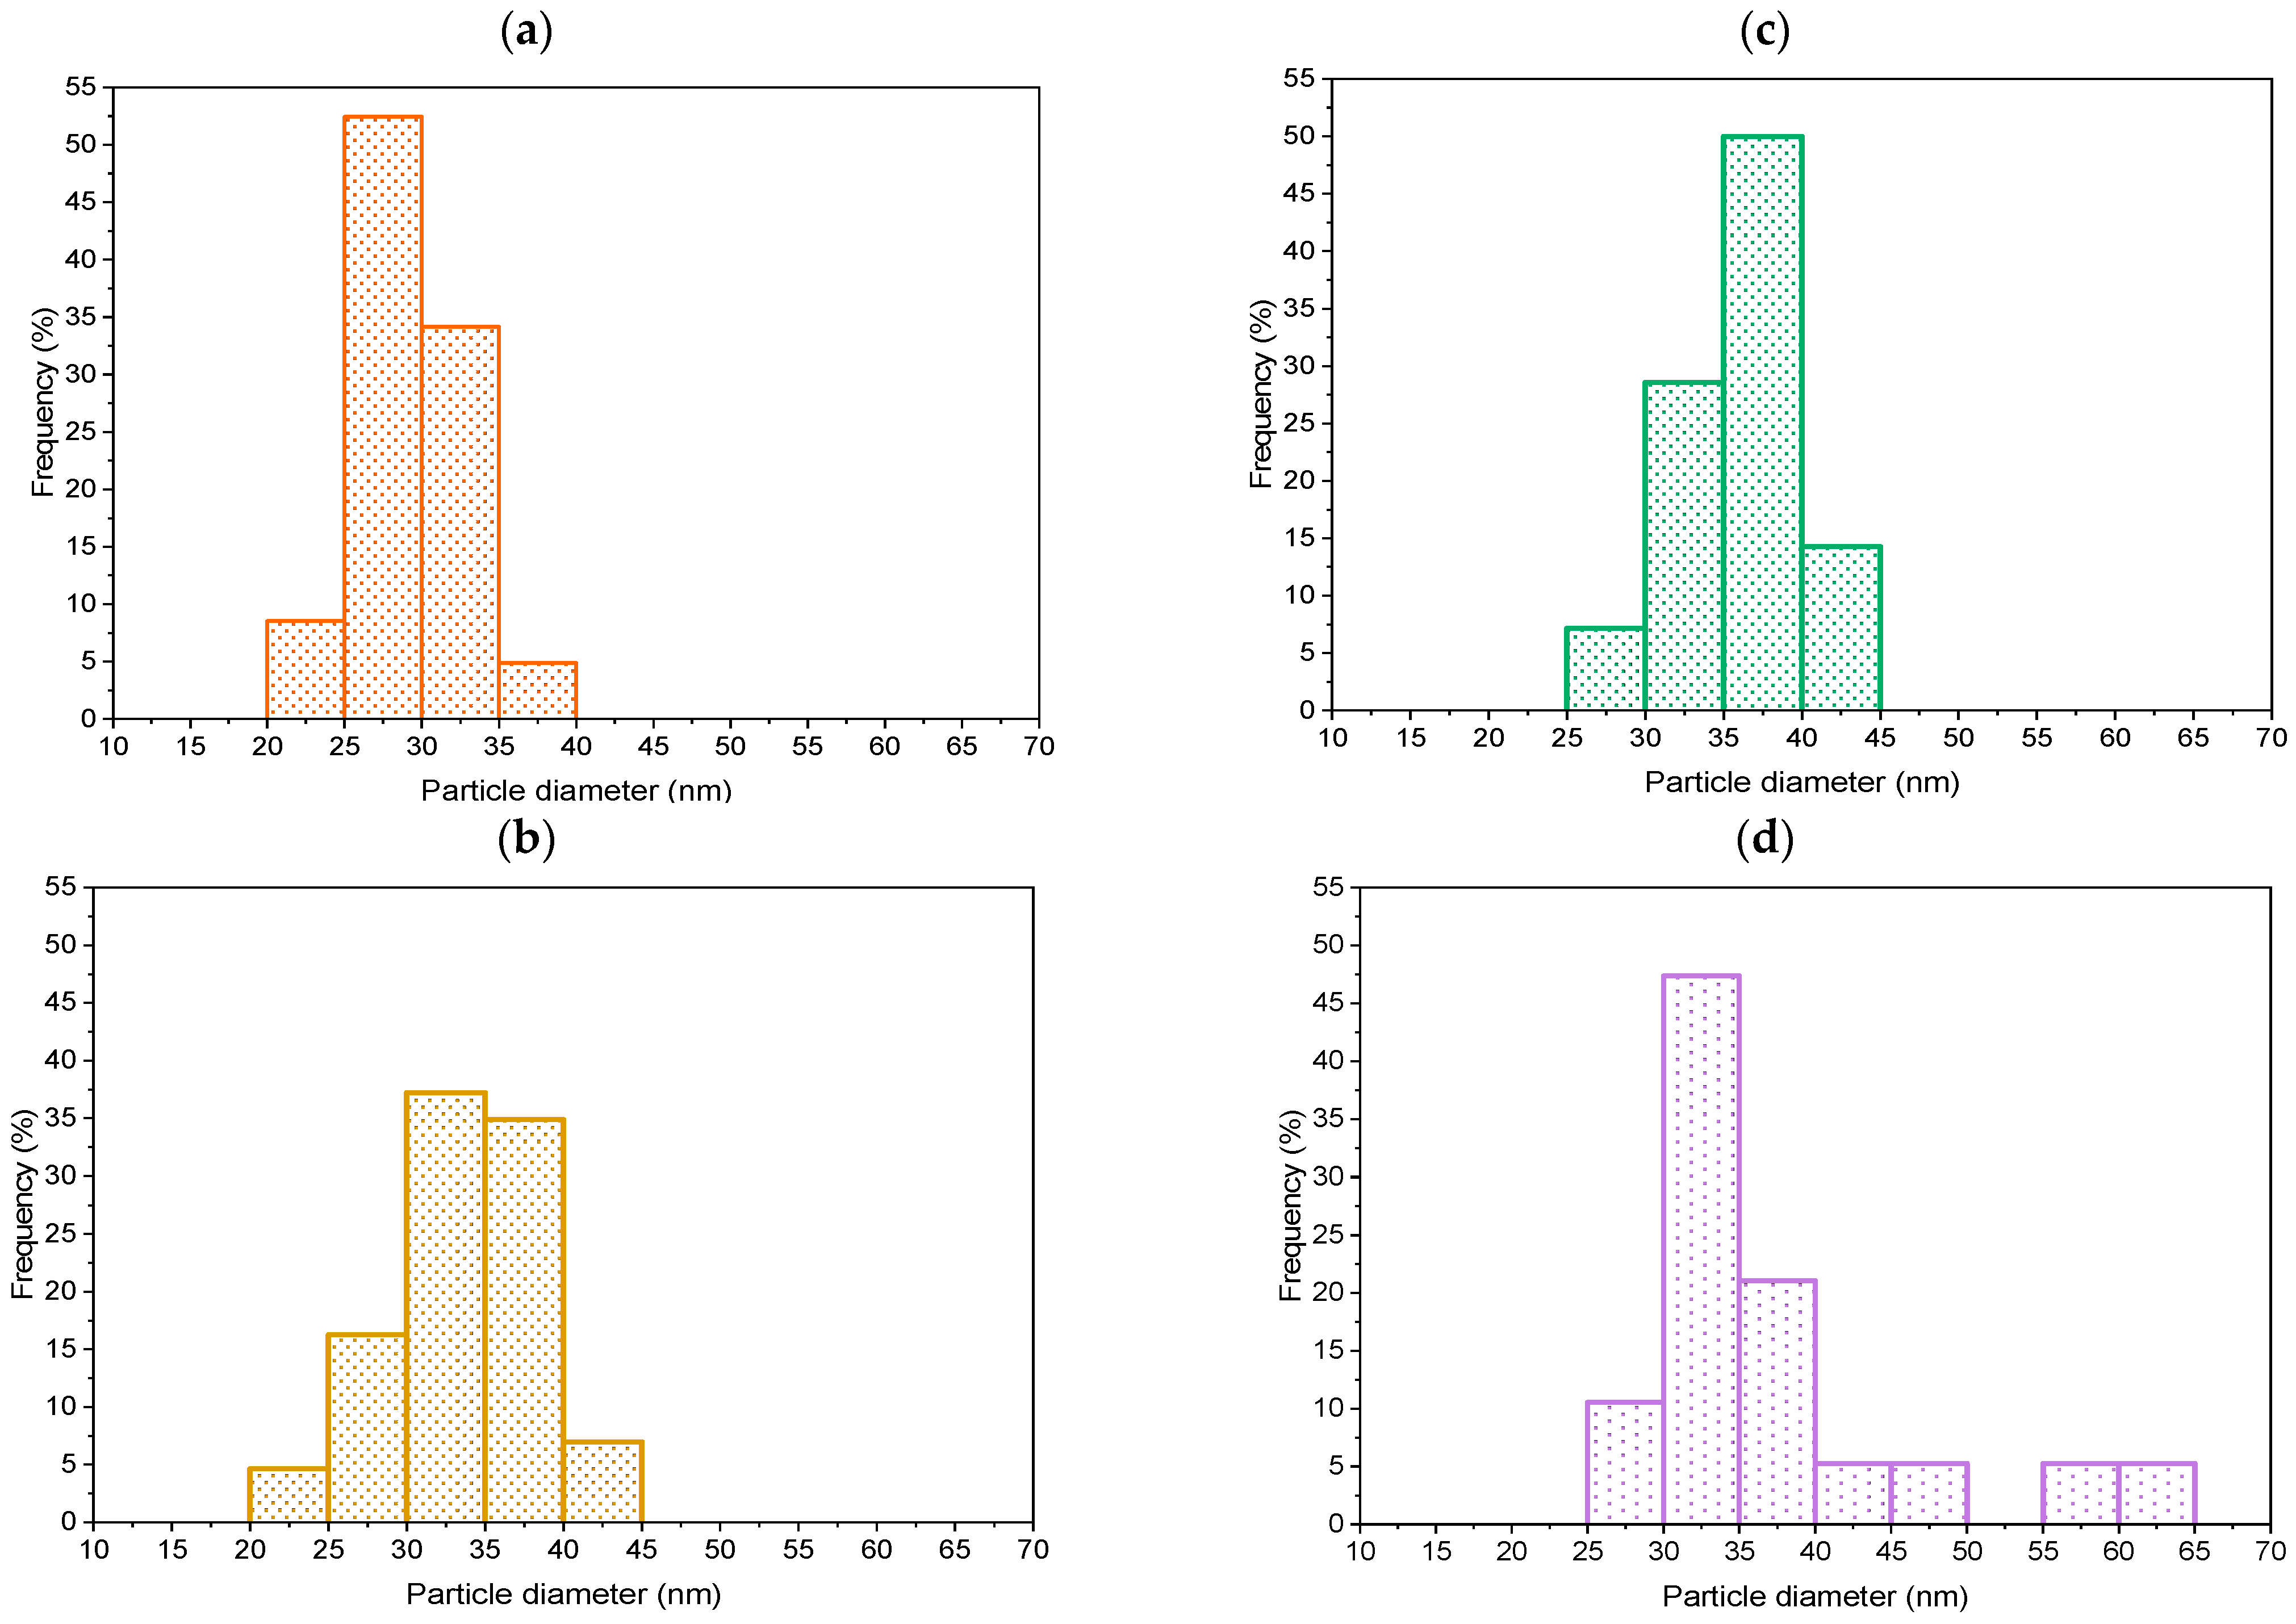
| Feret diameter of Au particles (nm) | 30 ± 4 | 36 ± 4 | 35 ± 4 | 40 ± 4 |
| SBH (eV) | 0.04 | 0.01 | 0.07 | 0.01 |
| Sample | TNR | TNR + NF(0.7) | TNR + NF(1.4) | TNR + NF(0.7, Heated) | TNR + NF(1.4, Heated) | |
|---|---|---|---|---|---|---|
| Ti | wt.% | 54 ± 0.3 | 57.7 ± 0.3 | 50.4 ± 0.3 | 56 ± 0.3 | 57.1 ± 0.3 |
| O | 46 ± 0.3 | 41.5 ± 0.3 | 48.8 ± 0.3 | 43.1 ± 0.3 | 42.1 ± 0.3 | |
| Au | - | 0.9 ± 0.2 b (0.98) | 0.8 ± 0.2 (0.93) | 0.9 ± 0.2 (1.03) | 0.7 ± 0.1 (0.95) | |
| C | 0.3 | 1.2 | 1.7 | 1.0 | 1.4 |
| Sample | TNR | TNR + NF(0.7) | TNR + NF(1.4) |
|---|---|---|---|
| a Apparent anatase crystallite size (nm) | 17 | 17 | 17 |
| SBET (m2/g) | 106 | 86 | 85 |
| Vpore (cm3/g) | 0.48 | 0.43 | 0.42 |
| dpore (nm) | 18.3 | 19.9 | 19.9 |
Disclaimer/Publisher’s Note: The statements, opinions and data contained in all publications are solely those of the individual author(s) and contributor(s) and not of MDPI and/or the editor(s). MDPI and/or the editor(s) disclaim responsibility for any injury to people or property resulting from any ideas, methods, instructions or products referred to in the content. |
© 2024 by the authors. Licensee MDPI, Basel, Switzerland. This article is an open access article distributed under the terms and conditions of the Creative Commons Attribution (CC BY) license (https://creativecommons.org/licenses/by/4.0/).
Share and Cite
Slapničar, Š.; Žerjav, G.; Zavašnik, J.; Roškarič, M.; Finšgar, M.; Pintar, A. Novel TiO2-Supported Gold Nanoflowers for Efficient Photocatalytic NOx Abatement. Molecules 2024, 29, 3333. https://doi.org/10.3390/molecules29143333
Slapničar Š, Žerjav G, Zavašnik J, Roškarič M, Finšgar M, Pintar A. Novel TiO2-Supported Gold Nanoflowers for Efficient Photocatalytic NOx Abatement. Molecules. 2024; 29(14):3333. https://doi.org/10.3390/molecules29143333
Chicago/Turabian StyleSlapničar, Špela, Gregor Žerjav, Janez Zavašnik, Matevž Roškarič, Matjaž Finšgar, and Albin Pintar. 2024. "Novel TiO2-Supported Gold Nanoflowers for Efficient Photocatalytic NOx Abatement" Molecules 29, no. 14: 3333. https://doi.org/10.3390/molecules29143333