Article

Deep Eutectic Solvents-Based Ultrasonic-Assisted Dispersive Liquid–Liquid Microextraction for the Determination of Organophosphorus Pesticides in Honeysuckle Dew Samples

1
College of Chinese Materia Medica, Tianjin University of Traditional Chinese Medicine, 10 Poyanghu Road, West Area, Tuanbo New Town, Jinghai District, Tianjin 301617, China
2
Department of Neurology, North China University of Science and Technology Affiliated Hospital, Tangshan 063000, China
*
Author to whom correspondence should be addressed.
Molecules 2024, 29(14), 3423; https://doi.org/10.3390/molecules29143423 (registering DOI)
Submission received: 17 May 2024 / Revised: 8 July 2024 / Accepted: 11 July 2024 / Published: 21 July 2024
(This article belongs to the Special Issue Chromatography and Extraction Techniques for Chemical Applications)

Abstract

:
A deep eutectic solvent (DES) with the ability to change from hydrophilic to hydrophobic was designed and synthesized and applied to the determination of organophosphorus (OPP) pesticides in honeysuckle dew samples. Choline chloride, phenol, and tetrahydrofuran (THF) were used as the hydrogen bond acceptor, hydrogen bond donor, and demulsifier, respectively. Eight OPP pesticides were extracted by DES coupled with ultrasonic-assisted extraction (UA) and then chromatographed by GC-MS. DES used as an extract solvent has the advantages of high extraction efficiency, low cost, and environmental protection. Furthermore, DES is compatible with GC-MS. The single factor experiment design and Box–Behnken design (BBD) were applied to the optimization of experimental factors, including the type and composition of extraction solvent, type of demulsifier solvent, the volume of DES and THF, pH of sample solution, and ultrasonic time. Under the optimum experimental conditions, the high degree of linearity from 0.1 to 20.0 ng mL−1 (R2 ≥ 0.9989), the limits of detection from 0.014 to 0.051 ng mL−1 (S/N = 3), and the recoveries of analytes from 81.4 to 104.4% with relative standard deviation below 8.6%. In addition, the adsorption mechanism of OPPs on DES was explored by adsorption kinetic studies. These results have demonstrated that the present method has offered an effective, accurate, and sensitive methodology for OPP pesticides in honeysuckle dew samples, and this method provides a reference for the detection of pesticide residues in traditional Chinese medicine.

1. Introduction

Lonicerae Japonicae Flos (LJF) (Lonicera japonica Thun.) as a traditional Chinese medicine with a main property of clearing heat and eliminating toxins has been used widely in the treatment of diseases; it can cure wind-heat common cold and hot blood poison dysentery [1]. There are many kinds of Chinese patent medicines based on LJF, such as honeysuckle dew, Yinhuang granules, Shuanghuanglian oral liquid, Qingkailing oral liquid, etc. Among them, honeysuckle dew is widely used. Honeysuckle dew is an over-the-counter Chinese patent medicine mainly composed of LJF. The function of honeysuckle dew is mainly to clear away heat and detoxify heat. It is suitable for sunstroke, miliaria rash, furuncle, and so on, which affect the lung and stomach and are caused by summer heat. When a large number of heat rashes appear due to summer heat and humidity in children, honeysuckle dew can also be used to wipe the skin to relieve symptoms. Thus, honeysuckle dew is widely used in life [2].
However, the problem of insect pests is serious in the planting of LJF, and the use of organophosphorus (OPP) insecticides is more common. In recent years, a scandal of pesticide residues in honeysuckle has been reported from time to time [3,4,5]. OPP pesticides are mostly phosphoric acid or phosphoric acid derivatives containing phosphoryl (P=O) or thiophosphoryl (P=S). It has become one of the most widely used pesticides in the world due to its broad spectrum, high efficiency, and fast degradation [6,7]. Studies have pointed out that long-term exposure to low-dose OPPs can lead to neurological conduction dysfunction and irreversible damage to the nervous system [8]. With the increasing demand for LJF, the food and drug safety risks caused by pesticide residues are receiving more and more attention. Therefore, it is necessary to establish a simple, rapid, efficient, and green method for the detection of OPP pesticides in Chinese patent medicines containing LJF.
The traditional methods for the separation and enrichment of OPPs are solid phase extraction (SPE), liquid–liquid extraction (LLE), solid phase microextraction (SPME), and liquid phase microextraction (LPME). However, these methods are time-consuming and cumbersome. Dispersed liquid–liquid microextraction (DLLME) was proposed by Ahmadi in 2006. It is a miniature liquid–liquid extraction form which uses a micro-liter volume of extraction solvent. It has the obvious advantages of a high preconcentration coefficient, rapid operation, simple operation, high extraction efficiency, and low sample requirements. It has been widely used in the determination of toxic and harmful substances in food and environmental samples [9,10,11].
In order to conform to the concept of “green chemistry”, deep eutectic solvents (DESs) were first proposed by Abbott et al. [12]. A ‘deep eutectic solvent’ is a mixture of pure compounds for which the eutectic point temperature is below that of an ideal liquid mixture [13]. DESs are defined as homogeneous eutectic mixtures obtained by mixing two or more pure components (liquids or solids, ions or neutral molecules) acting as a hydrogen bond acceptor (HBA) and hydrogen bond donor (HBD) [14]. The properties of DESs used as an extraction solvent in LPME methods provide significant advantages. DESs have good solubility and can dissolve inorganic substances such as gas, metal ions, and a variety of organic substances insoluble in water. It is widely used in sample pretreatment [15]. In addition, DESs have the characteristics of biocompatibility, recyclability, biodegradability, and low or non-toxicity [16]. It is a kind of analog of ionic liquid and is one of the five green solvents recognized by scientists today. It has been successfully used in DLLME as extraction solvents for the preconcentration and separation of organic pollutants such as methadone [17], heavy metals [18], endocrine disrupting chemicals [19], pesticides [20], aromatic amines [21], oxyprenylated phenylpropanoids [22], and warfarin [23] in environmental samples, food, and biological samples. Compared with conventional extraction methods, DES coupled with DLLME could obtain more advantages [24]. However, there are no reports about the extraction of pesticide residues from traditional Chinese medicine such as honeysuckle dew samples.
In this study, a rapid, effective, and eco-friendly DES-UA-DLLME method for the separation and preconcentration of eight OPPs, including diazinon, tolclofos-methyl, pirimiphos-methly, phosalone, malathion, fenthion, fenamiphos, and bolster in honeysuckle dew samples prior to GC-MS determination, was developed. This technique combines extraction and preconcentration of the analytes into one step, simplifies the analytical step, and saves operation time. The developed method was successfully applied to the simultaneous determination of trace levels of OPPs in real samples.

2. Results and Discussion

2.1. Characterization of DES

The FT-IR spectra of choline chloride, phenol, and synthesized DES using choline chloride and phenol at a molar ratio of 1:4 were investigated. In the FT-IR spectra of phenol (Figure 1B), characteristic vibrations of O-H at 3338.2 cm−1 and C=C (1450–1600) cm−1 were observed. C-N and O-H vibrations of choline chloride were positioned at 1051.5 cm−1 and 3405.3 cm−1, respectively (Figure 1A). In the spectrum of DES of choline chloride–phenol (1:4) (Figure 1C), the stretching vibration of the hydroxyl (O-H) group shifted to 3273.9 cm−1, and the absorption peak of the hydroxyl group in DES was broader than that in phenol, which indicated that intermolecular hydrogen bonds were formed between choline chloride and phenol [17,25].

2.2. Optimization of DES-UA-DLLME Conditions

To achieve the best extraction efficiency, extraction conditions were optimized using a working sample (5 ng mL−1). Experimental parameters such as the type and composition of extraction solvent, type of demulsifier solvent, the volume of DES and THF, pH of the sample solution, and ultrasonic time affecting the extraction efficiency were carefully investigated.

2.2.1. Single Factor Optimization

Effect of Type and Composition of Extraction Solvent

The choice of a suitable extraction solvent is important in DES-UA-DLLME methods. In order to fully contact the DES with the sample, the hydrophilic DES was prepared to accelerate the mass transfer of the analyte between two phases. Choline chloride (ChCl) is non-toxic, biodegradable, and inexpensive and can form DES with HBD via hydrogen bonds. The HBD usually includes carboxylic acids, urea, or polyols [26,27]. In this experiment, ethylene glycol, glycerol, and phenol mixed with ChCl to prepare DES were investigated. The experiment showed that those kinds of DESs were hydrophilic, but the DES synthesized by ethylene glycol and glycerol could not be converted into hydrophobic after adding THF, meaning that it was not easy to carry out the next phase separation operation. Therefore, DES synthesized by ChCl and phenol was selected for subsequent experiments.
The molar ratio of HBA and HBD also has a significant impact on the densities of DESs. Different molar ratios, including 1:2, 1:3, 1:4, 1:5, and 1:6 of ChCl to phenol, were examined to prepare DES-1, DES-2, DES-3, DES-4, and DES-5. The results are shown in Figure S1. It can be observed that DES-3 showed good extraction efficiency for targeted analyte. The recoveries of analytes achieved were in the range of 83.2–103.8%. So, the optimum ChCl–phenol ratio of DES was selected as 1:4 for the remaining work.

Effect of Type of Demulsifier Solvent

The developed method is based on the emulsification and self-aggregation of DES in aqueous solution, so the selection of a suitable demulsifier plays an important role in the effective completion of the self-aggregation and separation process. By adding an aprotic demulsifier solvent to homogenous DES aqueous phase, the interaction of water molecules with DES molecules is decreased, DES molecules could leave the water molecules and the self-aggregation process of DES molecules occurs, and an immiscible liquid is separated. The most credible and rational mechanism of DESs self-aggregation involves π-π overlap between the aromatic ring, hydrogen bonding between functional groups of DESs, and other charge transfer interactions [28]. Three kinds of demulsifier solvents, including 1,4-dioxane, THF, and dichloromethane, were investigated on the extraction efficiency. The extraction recoveries obtained with THF were much higher than 1,4-dioxane and dichloromethane. The recoveries of eight OPPs from 82.6 to 104.1% were acquired. Therefore, THF was adopted as a demulsifier solvent in the following studies.

Effect of pH of Sample Solution

To evaluate the sample solution pH effect on the efficiency of the method, 3.0–11.0 was investigated. The results given in Figure S2 show that the pH does not affect the recoveries obviously. However, the pH of the three samples used in this experiment was about 5.0, and satisfactory recoveries were obtained in the range of 81.6–1005.5%. So, in order to simplify the operation, the pH was not adjusted in the following experiment.

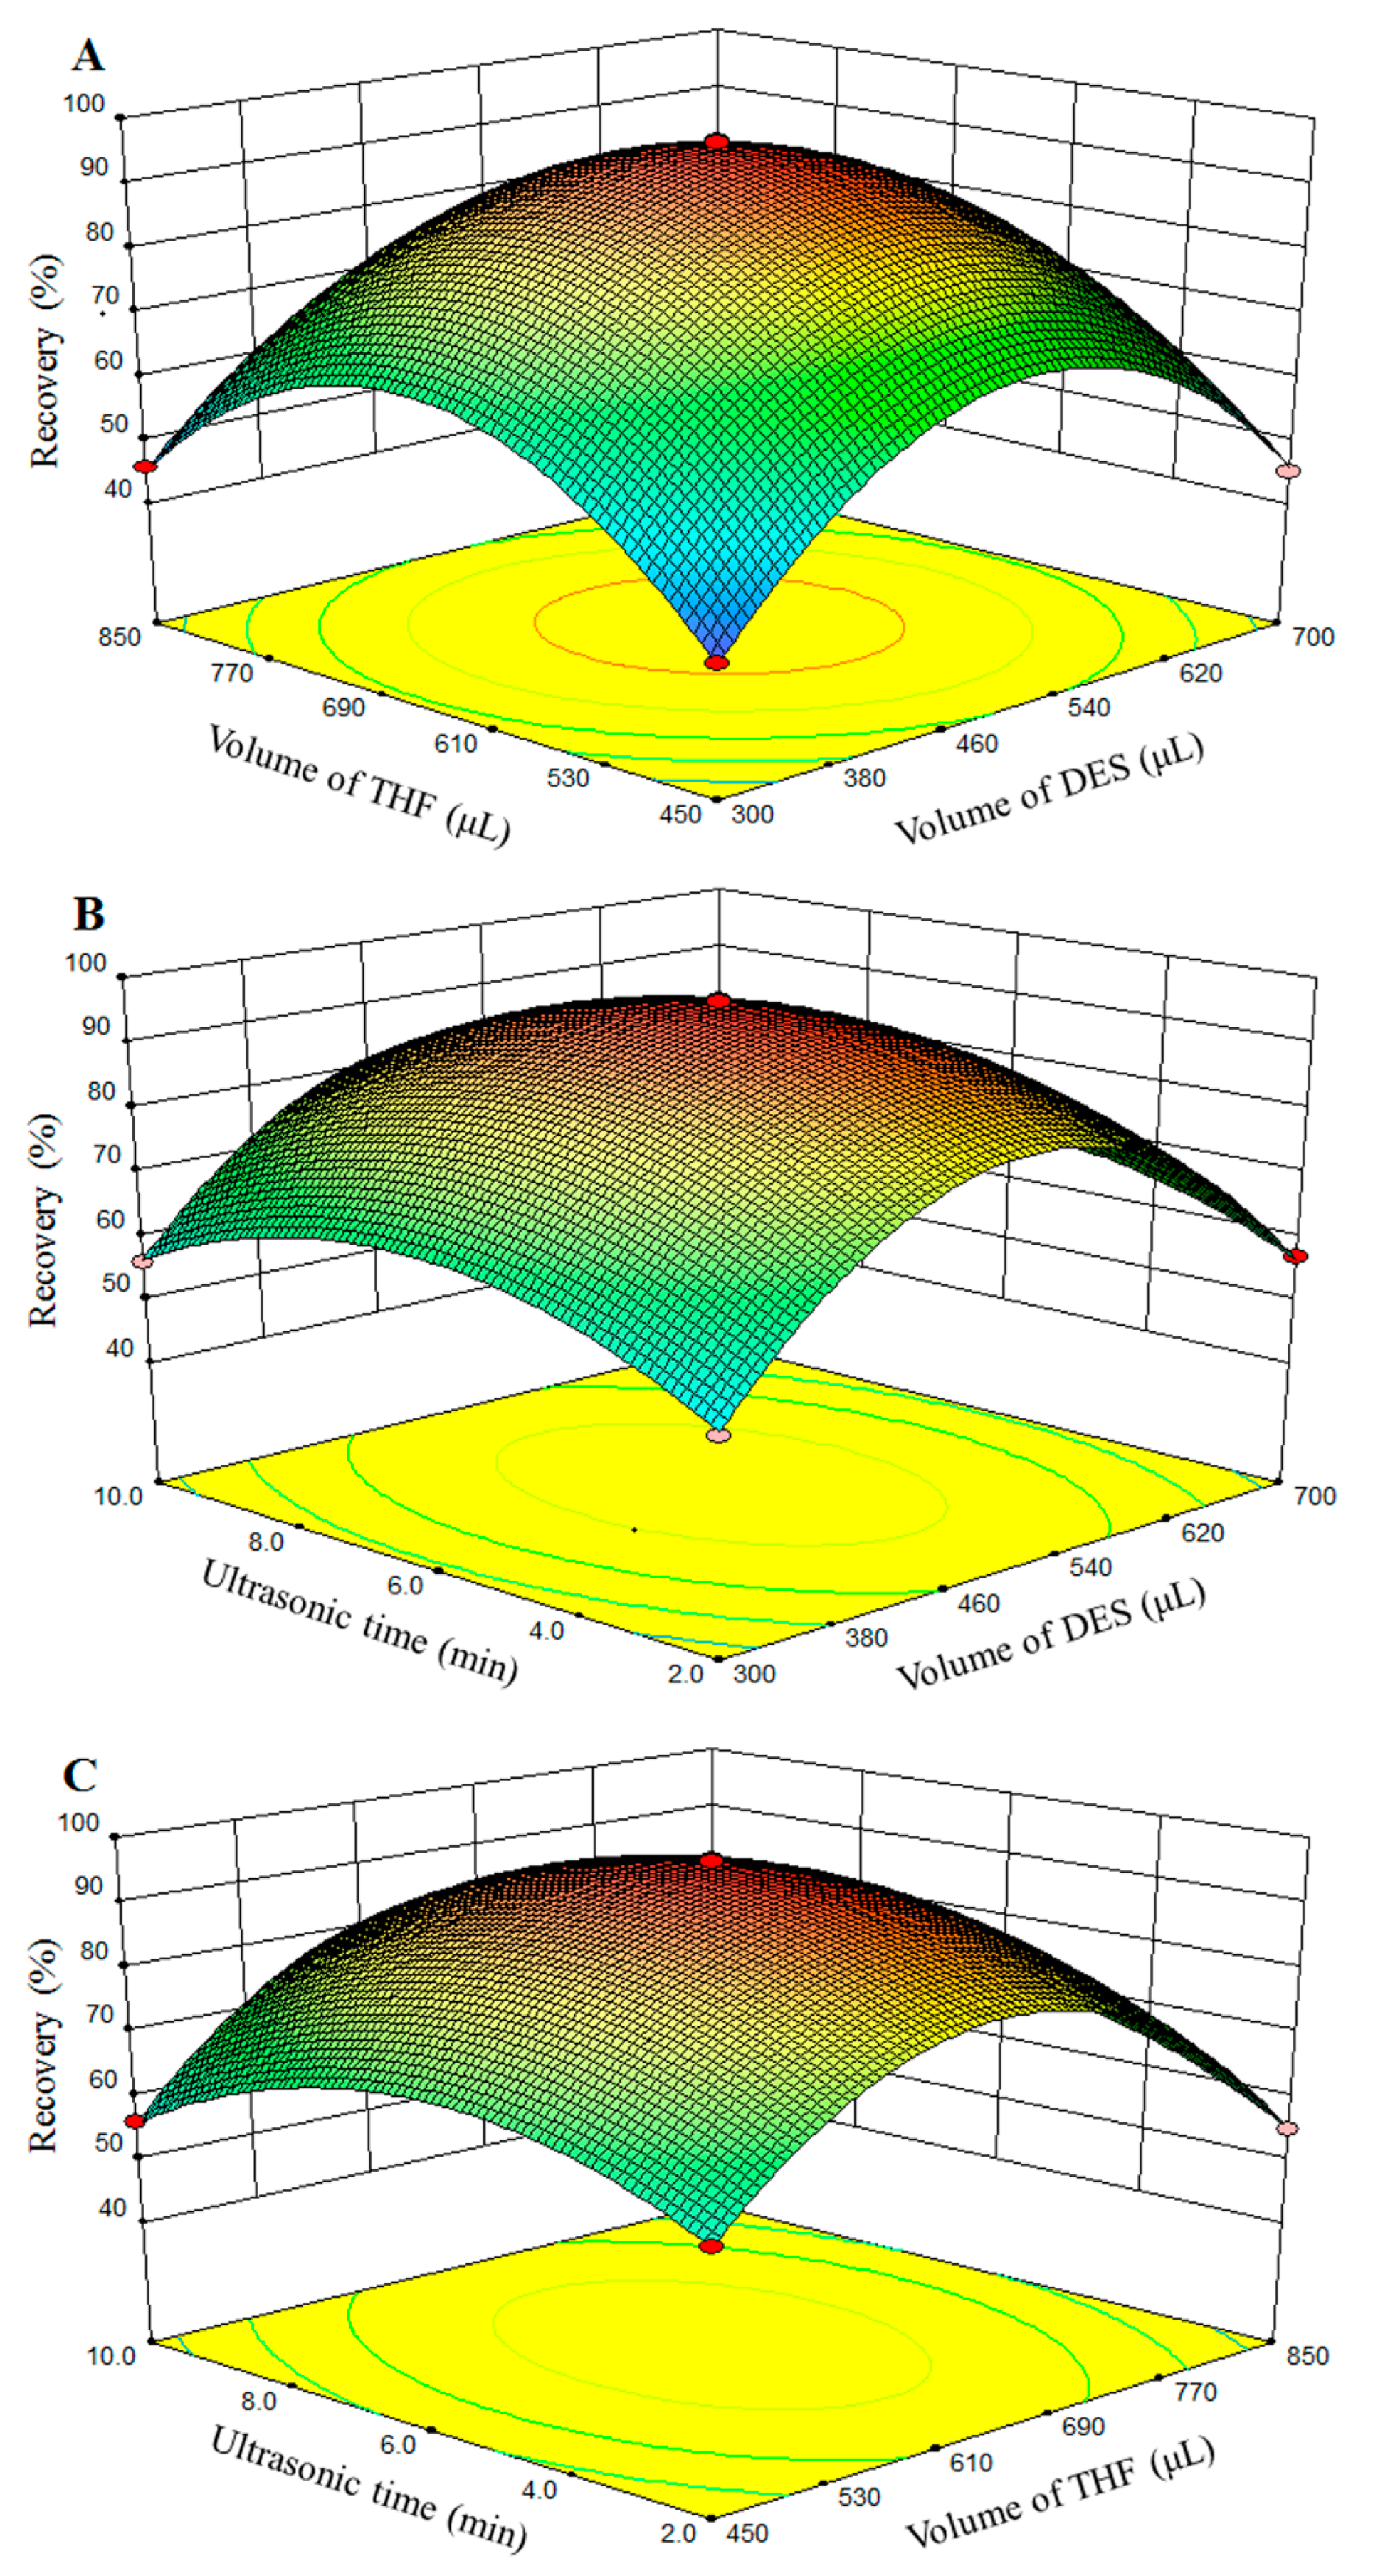
2.2.2. Optimization by BBD

To optimize extraction conditions (volume of DES, volume of THF, and ultrasonic time), a 17-run BBD was applied to study the possible interaction between the parameters.
The applicability of the model was evaluated by the square of the correlation coefficient (R2), the F-test, and the p-value in the analysis of variance (ANOVA). The analytical results are shown in Table 1 and Table 2. The R2 of Diazinon, tolclofos-methyl, pirimiphos-methly, phosalone, malathion, fenthion, fenamiphos, and bolster was 0.9995, 0.9991, 0.9982, 0.9975, 0.9993, 0.9982, 0.9984, and 0.9987, respectively, which indicated a good correlation. The p-value of the model was lower than 0.0001 (significant), and the lack of fit value was higher than 0.6362 (not significant), which showed that this model accurately represents the experimental data. Three response surfaces obtained in the BBD are illustrated in Figure 2. Tolclofos was selected as a representative analyte. The volume of DES and THF can affect the volume of hydrophobic DES directly. The smaller the volume of hydrophobic DES obtained, the higher the concentration of OPPs. However, quite a small volume of hydrophobic DES caused the extraction to become difficult and insufficient. Conversely, a large volume of hydrophobic DES may reduce the extraction efficiency, which can lead to the low preconcentration of the analyte in DES phase. It can be seen that the extraction recoveries of the target analytes increase with the increase in the volume of the THF increase and then reach a plateau. The main reason for this is that the hydrophobic DES phase reached its largest point. DES used as an extraction solvent interacts with target analyte molecules via strong hydrogen bonding and π-π interactions. According to the results, the volume of DES and ultrasonic time showed a significant influence on the extraction yields, and the volume of THF had only an insignificant effect on the extraction efficiencies. Finally, the optimal conditions for the extraction of OPPs were as follows: volume 650 μL of DES, 550 μL of THF, and 6 min of ultrasonic time.

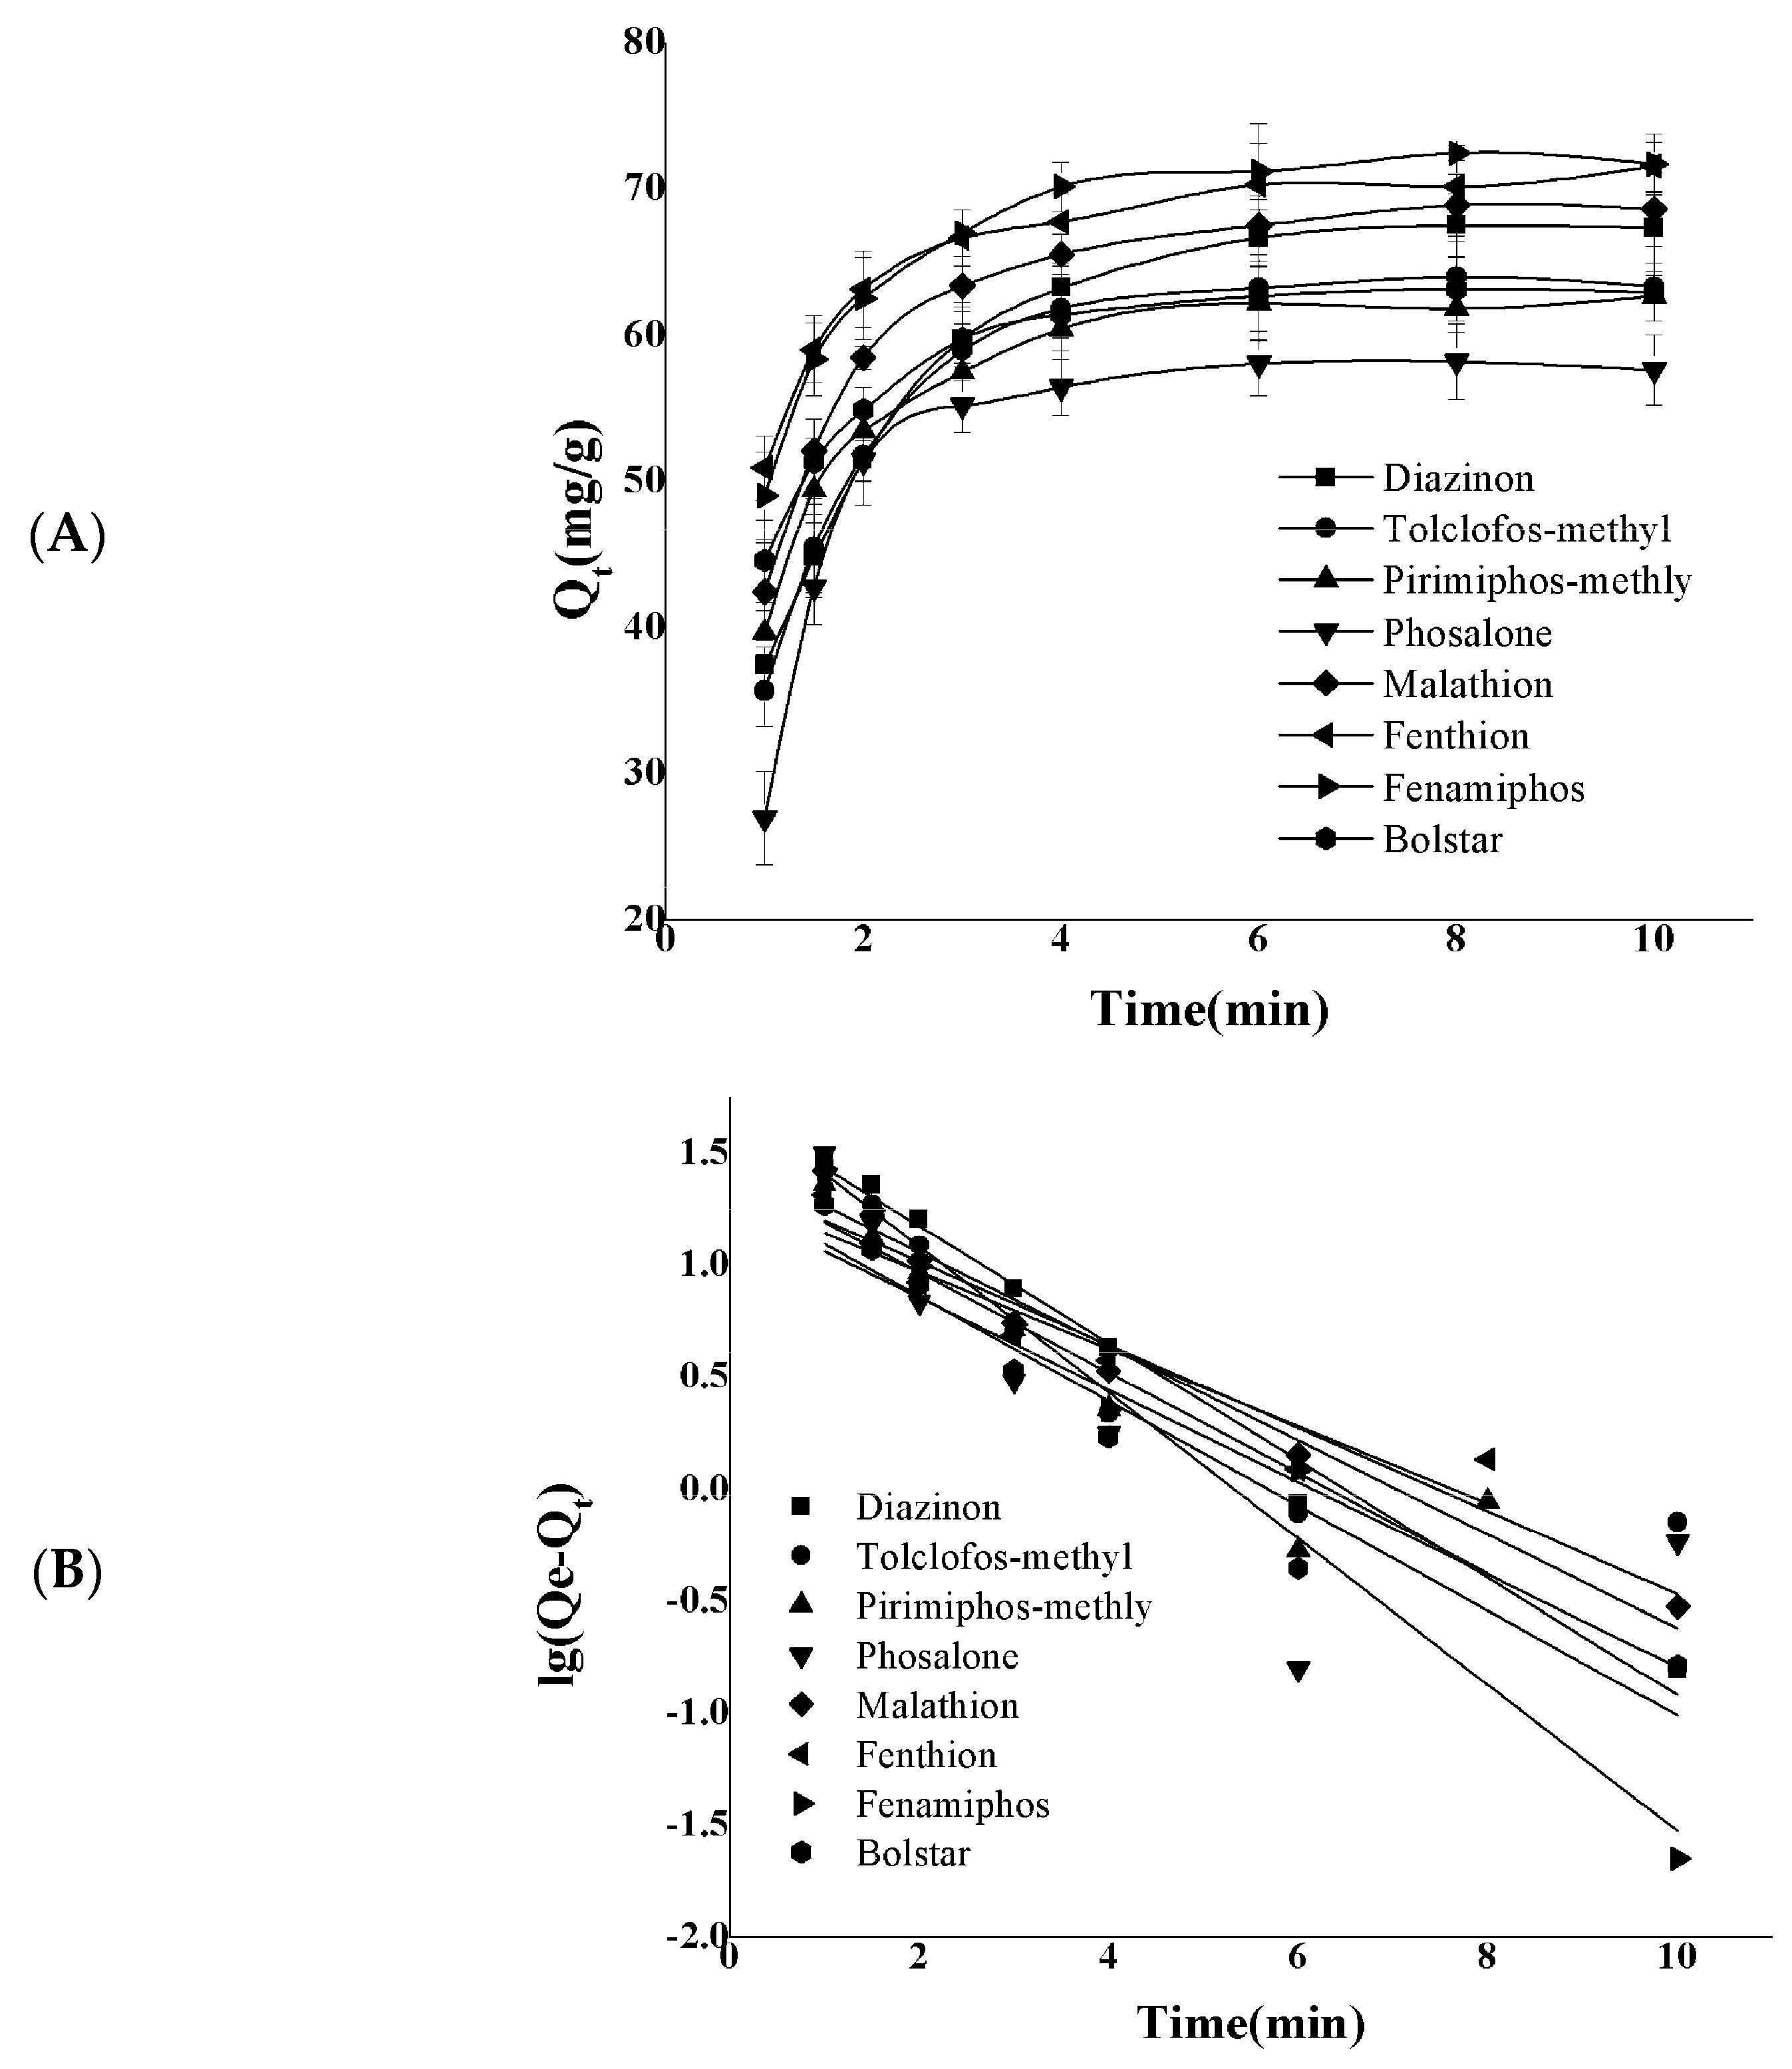
2.3. Extraction Kinetics Studies

In order to discuss the extraction rate better, the extraction kinetics of eight OPPs by DES in different time periods were investigated. The pseudo first-order kinetic model assumes that the adsorption efficiency is controlled by diffusion. The pseudo second-order kinetic model assumes that the adsorption efficiency is determined by the square value of the number of adsorption vacancies on the adsorbent surface. The formulas of the model are as follows:
lg q e - q t = lgq e - k 1 t 2.303
t q t = 1 k 2 q e 2 + t q e
qe is the adsorption capacity at equilibrium (mg g−1) and qt is the adsorption capacity (mg g−1) at time t. k1 and k2 are the extraction rate constants of the pseudo first-order and the pseudo second-order model, separately.
The adsorption rates of the eight analytes were fast before 2.5 min due to the large number of active sites available in the initial phase and then gradually decreased until the adsorption reached equilibrium, which was about 6 min. The kinetic data and fitting results of eight OPPs are described in Figure 3 and Table 2, and it was found that the correlation coefficient (R2) of the pseudo second-order kinetic model is higher than 0.991, which indicates that the main process of adsorption is chemisorption rather than diffusion.

2.4. Method Validation

2.4.1. Analytical Performances

In order to evaluate the present method performance, the analytical characteristics of the DES-UA- DLLME procedure, including linear range, precision, the limit of detection (LOD, S/N = 3, signal-to-noise ratio), and quantification (LOQ, S/N = 10), were systematically performed. The working curves were obtained by plotting these peak areas of the analytes versus the corresponding concentrations of the analytes in the spiked honeysuckle dew samples with a wide range of 0.1–20.0 ng mL−1 at nine different levels (0.1, 0.2, 0.5, 1.0, 2.0, 5.0, 10.0, 15.0, and 20.0 ng mL−1). Good linearities were obtained with high values of the linearity and the correlation coefficient (r2), small values of the standard deviation of the residuals (Sy/x), the intercept (SDa), and the slope (SDb). The LODs and the LOQs of the method for actual samples are listed in Table 3. LODs and LOQs were in the range of 0.014–0.051 ng mL−1 and 0.045–0.170 ng mL−1, respectively. The experimental results demonstrated that the proposed method was appropriate for the detection of trace OPPs in honeysuckle dew samples.

2.4.2. Matrix Effect

The matrix effect due to co-extracting and co-eluting matrix substances can seriously affect the analyte signals. So, the matrix effect was investigated in this work. Working curves based on the honeysuckle dew mixture sample and water were created. The matrix effect was studied and calculated by using the following equation:
Matrix   effect   % = k 2 k 1 × 100
where k2 and k1 are the slope of the working curve based on honeysuckle dew mixture and water samples, respectively. The matrix effects are 98.3%, 93.2%, 96.7%, 97.7%, 95.1%, 98.6%, 102.6%, and 100.5% by calculation. The result shows that the working curve can perform quantitative determination, resulting in more accurate results.

2.4.3. Analysis of Samples

In order to evaluate the applicability of the present method, three kinds of honeysuckle dew samples were analyzed. The typical chromatograms of the spiked sample are shown in Figure S3. No significant interference peaks were found at the retention positions of four OPPs. The spiked samples at low and high (1.0, 10.0 ng mL−1) degrees were analyzed to evaluate the precision and accuracy of the proposed method. The analytical results are shown in Table S1. Good recoveries of the analytes were obtained in the range of 81.4–104.4%, with relative standard deviations (RSDs) of 1.0–7.5%. In general, this present method could be satisfactorily applied for the determination of trace amounts of BAs in food samples.

2.4.4. Comparison with Other Methods

The presented method based on DES-UA-DLLME was compared with other reported methods for the detection of OPPs and is listed in Table 4, including magnetic solid phase extraction (MSPE) [29], dispersive liquid–liquid microextraction (DLLME) [30], solid phase extraction (SPE) [31,32,33], and DES-DLLME [34]. It could be clearly seen that the proposed method revealed lower LODs, a wider linearity range, and satisfactory recoveries.

3. Materials and Methods

3.1. Chemicals and Reagents

Diazinon, tolclofos-methyl, pirimiphos-methly, phosalone, malathion, fenthion, fenamiphos, and bolster (≥98%) were obtained from Aladdin Chemicals (Shanghai, China), and the structures can be seen in Figure S4. Standard stock solutions for the herbicides at a concentration level of 100 μg mL−1 were prepared in methanol. All of the stock standard solutions were stored in a refrigerator at 4 °C. The working and mixed working standard solutions were prepared every week by diluting stock standard solutions with methanol. Analytical-reagent-grade choline chloride, phenol, glycol, glycerol, tetrahydrofuran (THF), and sodium chloride were obtained from Beijing Chemicals (Beijing, China).

3.2. Instrumentation

The synthesized DES was characterized by Fourier transform infrared spectroscopy (FT-IR, Nicolet FT-IR 5700, Thermo Fisher Scientific Inc., Waltham, MA, USA). A KQ3200DE ultrasonicator (Kunshan, China) was used for the sample treatment. A DELTA-320 acidity meter (Mettler-Toledo Instruments Co., Ltd., Shanghai, China) was used for the pH measurement. The phase separation was performed on an LDZ4-1.2 centrifuge (Jingli centrifuge Co. Ltd., Beijing, China).

3.3. Sample Preparation

Three kinds of honeysuckle dew (Samples 1–3) from different manufacturers were purchased from pharmacies (Tianjin, China). The honeysuckle dew samples were filtered. The resulting solution was shaken until it was mixed well, and then it was stored at 4 °C. The spiked honeysuckle dew samples were obtained by spiking the appropriate amount of working solution (10 μg mL−1) into 10 mL of sample.

3.4. Synthesis and Characterization of DES

In this study, choline chloride and phenol were chosen to prepare DES by results reported in the previous literature [35]. In brief, choline chloride and HBD were accurately weighed, and the mixture was then heated and stirred at 50 °C until a clear liquid was obtained. During this step, the chlorine atom of choline chloride formed a hydrogen bonding with the hydrogen atom in aqueous phase, and the desired DES was formed [25]. The DES was kept in the dark at room temperature. The structure of DES formation is shown in Figure 4.

3.5. DES-UA-DLLME Procedure

A schematic diagram of the DES-UA-DLLME procedure is illustrated in Figure 5. In total, 650 µL of DES as an extraction solvent was added to 10 mL of spiked honeysuckle dew sample solutions; the mixture was ultrasonicated for 6 min, and the target analytes were extracted into the extraction solvent. After extraction, 550 μL of THF was added into the homogeneous solution to aggregate the DES, and a turbid solution was formed. The solution was centrifuged at 4000 rpm for 2 min, and the upper phase was collected on the surface of the sample. Finally, an aliquot (1 μL) of the extract was injected into the GC system for analysis.

3.6. GC-MS Analysis

Instrumental analyses were carried out on a GCMS-QP 2010 plus (Shimadzu, Kyoto, Japan). Separations were performed on a DB-5MS capillary column (30 m × 0.25 mm I.D., film thickness of 0.25 μm, J & W Scientific, Folsom, CA, USA). The temperature program was as follows: from 70 °C to 200 °C at 15 °C min−1, 3 min at 200 °C, up to 250 °C at 20 °C min−1, 5 min at 250 °C, up to 280 °C at 25 °C min−1, and 2 min at 280 °C. The injection volume was 1.0 μL in the splitless mode. The mass spectrometer was operated in selective ion monitoring (SIM) mode, and the characteristic ions are given in Table 3. The injector temperature was maintained at 280 °C. The ion source and interface temperatures were 200 °C and 250 °C, respectively, and electron impact ionization energy was 70 eV.

3.7. Box–Behnken Design

To optimize the experimental parameters of the extraction, the volume of DES (X1, 350–600 μL), volume of THF (X2, 450–700 μL), and ultrasonic time (X3, 1–10 min) were employed in the Box–Behnken design (BBD) for the study. The actual design experiment is shown in Table 5. For the three factors, the equation is as follows:
Y = β 0 + β 1 X 1 + β 2 X 2 + β 3 X 3 + β 12 X 1 X 2 + β 13 X 1 X 3 + β 23 X 2 X 3 + β 11 X 1 2 + β 22 X 2 2 + β 33 X 3 2

4. Conclusions

A rapid, simple, effective, and eco-friendly method of DES-UA-DLLME combined with GC-MS was successfully applied to the determination of trace amounts of OPPs in honeysuckle dew samples. The extraction, cleanup, separation, and enrichment were carried out in a single step. The smart DES was designed and synthesized as an extractant for the enrichment of trace level OPPs, which has some advantages in terms of extraction time, consumption of organic solvent, and detectability. The present method promises to have great application potential for the monitoring of pesticides at trace levels in samples.

Supplementary Materials

The following supporting information can be downloaded at: https://www.mdpi.com/article/10.3390/molecules29143423/s1, Figure S1: Effect of molar ratio of choline chloride to phenol on recoveries of OPPs; Figure S2: Effect of pH of sample solution on recoveries of OPPs; Figure S3: Typical chromatograms chromatograms for the spiked sample. 1. Diazinon; 2. Tolclofos-methyl; 3. Pirimiphos-methly; 4. Phosalone; 5. Malathion; 6. Fenthion; 7. Fenamiphos; 8. Bolster; Figure S4: Structures of OPPs; Table S1: Analytical results of real samples (n = 3).

Author Contributions

Conceptualization, X.W., Y.C., Z.T., S.X. and L.W.; formal analysis, Y.C.; investigation, K.G., F.Z., Z.T., S.X. and L.W.; methodology, K.G., X.W., Y.C. and L.W.; project administration, L.W.; resources, S.X.; software, K.G.; supervision, Y.C. and L.W.; validation, Z.T.; visualization, K.G.; writing—original draft, K.G.; writing—review and editing, X.W., F.Z., Y.C. and L.W. All authors have read and agreed to the published version of the manuscript.

Funding

This work was financially supported by the National Natural Science Foundation of China (No. 82104369).

Institutional Review Board Statement

Not applicable.

Informed Consent Statement

Not applicable.

Data Availability Statement

The data are contained within the article and Supplementary Materials.

Conflicts of Interest

The authors declare no conflicts of interest.

References

  1. Guo, X.; Yu, X.; Zheng, B.; Zhang, L.; Zhang, F.; Zhang, Y.; Li, J.; Pu, G.; Zhang, L.; Wu, H. Network Pharmacology-Based Identification of Potential Targets of Lonicerae japonicae Flos Acting on Anti-Inflammatory Effects. BioMed Res. Int. 2021, 1, 5507003. [Google Scholar] [CrossRef] [PubMed]
  2. Zhao, H.; Zeng, S.; Chen, L.; Sun, Q.; Liu, M.; Yang, H.; Ren, S.; Ming, T.; Meng, X.; Xu, H. Updated pharmacological effects of Lonicerae japonicae flos, with a focus on its potential efficacy on coronavirus disease-2019 (COVID-19). Curr. Opin. Pharmacol. 2021, 60, 200–207. [Google Scholar] [CrossRef] [PubMed]
  3. Pan, H.Q.; Zhou, H.; Miao, S.; Guo, D.A.; Zhang, X.L.; Hu, Q.; Mao, X.H.; Ji, S. Plant metabolomics for studying the effect of two insecticides on comprehensive constituents of Lonicerae Japonicae Flos. Chin. J. Nat. Med. 2021, 19, 70–80. [Google Scholar] [CrossRef] [PubMed]
  4. Fang, Q.; Shi, Y.; Cao, H.; Tong, Z.; Xiao, J.; Liao, M.; Wu, X.; Hua, R. Degradation Dynamics and Dietary Risk Assessments of Two Neonicotinoid Insecticides during Lonicera japonica Planting, Drying, and Tea Brewing Processes. J. Agric. Food Chem. 2017, 65, 1483–1488. [Google Scholar] [CrossRef] [PubMed]
  5. Wu, P.; Wang, P.; Gu, M.; Xue, J.; Wu, X. Human health risk assessment of pesticide residues in honeysuckle samples from different planting bases in China. Sci. Total Environ. 2021, 759, 142747. [Google Scholar] [CrossRef] [PubMed]
  6. Li, H.; Chen, H.; Li, M.; Lu, Q.; Zhang, Y.; Yao, S. Template protection of gold nanoclusters for the detection of organophosphorus pesticides. New J. Chem. 2019, 43, 5423–5428. [Google Scholar] [CrossRef]
  7. Yao, Y.; Wang, G.; Chu, G.; An, X.; Guo, Y.; Sun, X. The development of a novel biosensor based on gold nanocages/graphene oxide–chitosan modified acetylcholinesterase for organophosphorus pesticide detection. New J. Chem. 2019, 43, 13816–13826. [Google Scholar] [CrossRef]
  8. Wang, L.; Kong, W.; Yang, M.; Han, J.; Chen, S. Safety issues and new rapid detection methods in traditional Chinese medicinal materials. Acta Pharm. Sin. B 2015, 5, 38–46. [Google Scholar] [CrossRef] [PubMed]
  9. Yıldız, E.; Çabuk, H. Dispersive liquid-liquid microextraction method combined with sugaring-out homogeneous liquid-liquid extraction for the determination of some pesticides in molasses samples. J. Sep. Sci. 2021, 44, 4151–4166. [Google Scholar] [CrossRef]
  10. Zeiadi, S.; Mogaddam, M.R.A.; Farajzadeh, M.A.; Khandaghi, J. Combination of dispersive solid phase extraction with lighter than water dispersive liquid-liquid microextraction for the extraction of organophosphorous pesticides from milk. Int. J. Environ. Anal. Chem. 2022, 102, 5873–5886. [Google Scholar] [CrossRef]
  11. Xu, X.; Gao, J.; Zhang, Y.; Zhang, L. Tailored novel multifunctional benzyl-functionalized magnetic ionic liquid for rapid and efficient monitoring of trace fluoroquinolones in food samples. Food Chem. 2023, 404, 134654. [Google Scholar] [CrossRef] [PubMed]
  12. Abbott, A.P.; Capper, G.; Davies, D.L.; Rasheed, R.K.; Tambyrajah, V. Novel solvent properties of choline chloride/urea mixtures. Chem. Commun. 2003, 7, 70–71. [Google Scholar] [CrossRef] [PubMed]
  13. Martins, M.A.; Pinho, S.P.; Coutinho, J.A. Insights into the nature of eutectic and deep eutectic mixtures. J. Solut. Chem. 2019, 48, 962–982. [Google Scholar] [CrossRef]
  14. Mero, A.; Koutsoumpos, S.; Giannios, P.; Stavrakas, I.; Moutzouris, K.; Mezzetta, A.; Guazzelli, L. Comparison of physicochemical and thermal properties of choline chloride and betaine-based deep eutectic solvents: The influence of hydrogen bond acceptor and hydrogen bond donor nature and their molar ratios. J. Mol. Liq. 2023, 377, 121563. [Google Scholar] [CrossRef]
  15. Shishov, A.; Gorbunov, A.; Moskvin, L.; Bulatov, A. Decomposition of deep eutectic solvents based on choline chloride and phenol in aqueous phase. J. Mol. Liq. 2020, 301, 112380. [Google Scholar] [CrossRef]
  16. Pateli, I.M.; Abbott, A.P.; Binnemans, K.; Rodriguez Rodriguez, N. Recovery of yttrium and europium from spent fluorescent lamps using pure levulinic acid and the deep eutectic solvent levulinic acid-choline chloride. RSC Adv. 2020, 10, 28879–28890. [Google Scholar] [CrossRef] [PubMed]
  17. Lamei, N.; Ezoddin, M.; Abdi, K. Air assisted emulsification liquid-liquid microextraction based on deep eutectic solvent for preconcentration of methadone in water and biological samples. Talanta 2017, 165, 176–181. [Google Scholar] [CrossRef] [PubMed]
  18. Ezoddin, M.; Lamei, N.; Siami, F.; Abdi, K.; Karimi, M.A. Deep Eutectic Solvent Based Air Assisted Ligandless Emulsification Liquid-Liquid Microextraction for Preconcentration of Some Heavy Metals in Biological and Environmental Samples. Bull. Environ. Contam. Toxicol. 2018, 101, 814–819. [Google Scholar] [CrossRef]
  19. Yuan, K.; Kang, H.; Yue, Z.; Yang, L.; Lin, L.; Wang, X.; Luan, T. Determination of 13 endocrine disrupting chemicals in sediments by gas chromatography-mass spectrometry using subcritical water extraction coupled with dispersed liquid-liquid microextraction and derivatization. Anal. Chim. Acta 2015, 866, 41–47. [Google Scholar] [CrossRef]
  20. Tomai, P.; Lippiello, A.; D’Angelo, P.; Persson, I.; Martinelli, A.; Di Lisio, V.; Curini, R.; Fanali, C.; Gentili, A. A low transition temperature mixture for the dispersive liquid-liquid microextraction of pesticides from surface waters. J. Chromatogr. A 2019, 1605, 360329. [Google Scholar] [CrossRef]
  21. Werner, J. Novel deep eutectic solvent-based ultrasounds-assisted dispersive liquid-liquid microextraction with solidification of the aqueous phase for HPLC-UV determination of aromatic amines in environmental samples. Microchem. J. 2020, 153, 104405. [Google Scholar] [CrossRef]
  22. Ferrone, V.; Genovese, S.; Carlucci, M.; Tiecco, M.; Germani, R.; Preziuso, F.; Epifano, F.; Carlucci, G.; Taddeo, V.A. A green deep eutectic solvent dispersive liquid-liquid micro-extraction (DES-DLLME) for the UHPLC-PDA determination of oxyprenylated phenylpropanoids in olive, soy, peanuts, corn, and sunflower oil. Food Chem. 2018, 245, 578–585. [Google Scholar] [CrossRef] [PubMed]
  23. Majidi, S.M.; Hadjmohammadi, M.R. Hydrophobic borneol-based natural deep eutectic solvents as a green extraction media for air-assisted liquid-liquid micro-extraction of warfarin in biological samples. J. Chromatogr. A 2020, 1621, 461030. [Google Scholar] [CrossRef] [PubMed]
  24. El Achkar, T.; Greige-Gerges, H.; Fourmentin, S. Basics and properties of deep eutectic solvents: A review. Environ. Chem. Lett. 2021, 19, 3397–3408. [Google Scholar] [CrossRef]
  25. Xin, R.; Qi, S.; Zeng, C.; Khan, F.I.; Yang, B.; Wang, Y. A functional natural deep eutectic solvent based on trehalose: Structural and physicochemical properties. Food Chem. 2017, 217, 560–567. [Google Scholar] [CrossRef] [PubMed]
  26. Maugeri, Z.; Leitner, W.; de María, P.D. Practical separation of alcohol-ester mixtures using Deep-Eutectic-Solvents. Tetrahedron Lett. 2012, 53, 6968–6971. [Google Scholar] [CrossRef]
  27. Habibi, E.; Ghanemi, K.; Fallah-Mehrjardi, M.; Dadolahi-Sohrab, A. A novel digestion method based on a choline chloride-oxalic acid deep eutectic solvent for determining Cu, Fe, and Zn in fish samples. Anal. Chim. Acta 2013, 762, 61–67. [Google Scholar] [CrossRef] [PubMed]
  28. Khezeli, T.; Daneshfar, A.; Sahraei, R. Emulsification liquid-liquid microextraction based on deep eutectic solvent: An extraction method for the determination of benzene, toluene, ethylbenzene and seven polycyclic aromatic hydrocarbons from water samples. J. Chromatogr. A 2015, 1425, 25–33. [Google Scholar] [CrossRef] [PubMed]
  29. Chen, B.; Wu, F.Q.; Wu, W.D.; Jin, B.H.; Xie, L.Q.; Feng, W.; Ouyang, G.F. Determination of 27 pesticides in wine by dispersive liquid-liquid microextraction and gas chromatography-mass spectrometry. Microchem. J. 2016, 126, 415–422. [Google Scholar] [CrossRef]
  30. Wang, P.; Luo, M.; Liu, D.; Zhan, J.; Liu, X.; Wang, F.; Zhou, Z.; Wang, P. Application of a magnetic graphene nanocomposite for organophosphorus pesticide extraction in environmental water samples. J. Chromatogr. A 2018, 1535, 9–16. [Google Scholar] [CrossRef]
  31. Veloo, K.V.; Ibrahim, N.A.S. Solid-phase extraction using chloropropyl functionalized sol-gel hybrid sorbent for simultaneous determination of organophosphorus pesticides in selected fruit samples. J. Sep. Sci. 2020, 43, 3027–3035. [Google Scholar] [CrossRef]
  32. Li, Y.; Li, B.; Qi, Y.; Zhang, Z.; Cong, S.; She, Y.; Cao, X. Synthesis of metal-organic framework @molecularly imprinted polymer adsorbents for solid phase extraction of organophosphorus pesticides from agricultural products. J. Chromatogr. B Analyt Technol. Biomed. Life Sci. 2022, 1188, 123081. [Google Scholar] [CrossRef]
  33. Özer, E.T.; Osman, B.; Parlak, B. An experimental design approach for the solid phase extraction of some organophosphorus pesticides from water samples with polymeric microbeads. Microchem. J. 2020, 154, 104537. [Google Scholar] [CrossRef]
  34. Heidari, H.; Ghanbari-Rad, S.; Habibi, E. Optimization deep eutectic solvent-based ultrasound-assisted liquid-liquid microextraction by using the desirability function approach for extraction and preconcentration of organophosphorus pesticides from fruit juice samples. J. Food Compos. Anal. 2020, 87, 103389. [Google Scholar] [CrossRef]
  35. Zhao, M.Y.; Zhao, E.; Wu, J.X.; Li, Y.Q.; Li, B.T. Application of deep eutectic solvents combined with vortex assisted dispersive liquid-liquid microextraction for five organophosphorus pesticides in juice and green tea beverage. Acta Chromatogr. 2022, 34, 53–60. [Google Scholar] [CrossRef]
Figure 1. FT-IR spectra of (A) choline chloride (B) phenol and (C) DES.
Molecules 29 03423 g001
Figure 2. Three-dimensional response surfaces. Variables for extraction of tolclofos-methyl, (A) volume of THF, and volume of DES (ultrasonic time, 6 min); (B) ultrasonic time and volume of DES (volume of THF, 550 μL) and (C) ultrasonic time and volume of THF ((volume of DES, 650 μL).
Molecules 29 03423 g002
Figure 3. (A) Variation in extraction capacity of DES with time for diazinon, tolclofos-methyl, pi-imiphos-methly, phosalone, malathion, fenthion, fenamiphos, and bolster. (B) The pseudo first-order model, (C) the pseudo second-order model.
Molecules 29 03423 g003aMolecules 29 03423 g003b
Figure 4. The structure of DES formation.
Molecules 29 03423 g004
Figure 5. Schematic diagram of DES-UA-DLLM E system.
Molecules 29 03423 g005
Table 1. Experimental results based on BBD.
Experiments Coded LevelsResponse: Recoveries (%)
X1
Volume of DES (μL)
X2
Volume of THF (μL)
X3
Ultrasonic Time (min)
DiazinonTolclofos-MethylPirimiphos-MethylPhosaloneMalathionFenthionFenamphosBolstar
1−1 (300)0 (650)1 (10)57.154.755.351.467.769.470.457.3
20 (500)0 (650)0 (6)94.187.488.281.398.299.9103.290.3
3−1 (300)0 (650)−1 (2)5347.248.845.661.155.666.653.8
40 (500)0 (650)0 (6)95.186.287.380.298.399.3100.388.5
5−1 (300)1 (850)0 (6)45.838.739.933.750.454.654.142.3
60 (500)−1 (450)−1 (2)57.751.652.845.761.562.766.553.5
7−1 (300)−1 (450)0 (6)39.733.234.529.445.748.950.739.4
80 (500)1 (850)−1 (2)5548.650.137.554.662.359.348.7
90 (500)0 (650)0 (6)96.288.289.783.299.5102.6102.190.9
100 (500)0 (650)0 (6)96.588.990.183.296.8100.5103.591.8
110 (500)0 (650)0 (6)95.289.291.884.599.298.5104.688.5
121 (700)1 (850)0 (6)40.934.736.329.346.348.550.835.4
131 (700)0 (650)−1 (2)56.556.657.853.467.769.47361.4
141 (700)0 (650)1 (10)55.248.249.243.260.857.365.744.5
150 (500)1 (850)1 (10)59.55152.645.161.363.265.344.6
161 (700)−1 (450)0 (6)45.940.141.433.349.753.154.841.7
170 (500)−1 (450)1 (10)56.748.749.339.654.461.858.644.6
Table 2. Adsorption kinetics constants for eight OPPs.
AnalytesPseudo First-OrderPseudo Second-Order
k1 (min−1)R2k2 (g mg−1min−1)R2
Diazinon0.6020.98620.0190.9982
Tolclofos-methyl0.4270.82120.0250.9971
Pirimiphos-methyl0.5160.87540.0330.9991
Phosalone0.4740.66140.0500.9994
Malathion 0.4830.97570.0270.9991
Fenthion0.3970.90330.0380.9998
Fenamiphos0.7510.98120.0280.9990
Bolstar0.5380.94130.0430.9995
Table 3. Analytical performances.
AnalytesRetention
Time
(min)
Main Fragment Ion
(m/z)
Regression Equation
A = (a ± SDa)c + (b ± SDb)
Linear Range
(ng mL−1)
Correlation CoefficientLOD
(ng mL−1)
LOQ
(ng mL−1)
RSD n = 5
Intraday Interday
Diazinon15.790304 *, 137,
152, 179
A = (848.76 ± 10.28)c − (134.75 ± 85.53)0.2–20.00.99890.0320.1103.54.9
Tolclofos-methyl19.094265 *, 267,
250, 125
A = (2551.67 ± 11.20)c + (103.98 ± 21.67)0.1–20.00.99990.0160.0512.73.7
Pirimiphos-methyl20.878290 *, 276,
305, 125
A = (1756.98 ± 16.90)c + (48.79 ± 13.54)0.1–20.00.99940.0150.0485.52.9
Phosalone22.085182 *, 367 154,112A = (693.12 ± 3.18)c + (42.08 ± 6.48)0.2–20.00.99910.0510.1706.38.1
Malathion23.209173 *, 93,
125, 127
A = (1766.14 ± 10.36)c + (17.25 ± 5.73)0.2–20.00.99910.0140.0452.65.3
Fenthion27.457278 *, 125,
109, 169
A = (1521.96 ± 5.75)c + (70.43 ± 14.80)0.2–20.00.99970.0180.0602.54.8
Fenamiphos29.872303 *, 154,
80, 217
A = (1705.25 ± 3.76)c − (32.11 ± 11.23)0.2–20.00.99960.0340.1204.84.6
Bolstar30.611157 *, 146,
118, 129
A = (1422.77 ± 8.00)c + (95.70 ± 6.59)0.2–20.00.99920.0230.0765.23.8
* The ion for quantitative analysis. A, peak area of analyte; c, concentration of analyte in μg L−1; a, slope; b, intercept; SDa and SDb, standard deviations of slope and intercept, respectively.
Table 4. Comparison of some methods used for determination of OPPs.
MethodMatrixLinear Range
μg/L
LOD
μg/L
Recovery
(%)
RSD
(%)
Ref.
MSPEWater100–500016.0–33.090.2–102.90.7–10.5[29]
DLLMEWine0.2–25.00.025–0.8866.7–126.12.0–27.2[30]
SPEFruits50.0–1000.010–7088.33–120.7 1.6–3.3[31]
SPEAgricultural products1–2000.01–4.9382.5–123.01.11–8.24[32]
SPEWater1–500.002−0.11869 to 1390.58–8.17[33]
DES-DLLMEFruit juice1–5000.070–0.09687.3–116.75.8–6.6[34]
DES-UA-DLLMEHoneysuckle dew0.1–20.00.014–0.05181.4–104.41.0–8.6this work
Table 5. Parameters for the BBD.
β0β1β2β3β12β13β23β11β22β33p-Value of the ModeLack of Fit ValueR2
Diazinon95.420.360.150.79−2.78−1.351.38−27.06−25.29−12.91<0.00010.97200.9995
Tolclofos-methyl87.980.73−0.075−0.17−2.73−3.981.32−24.80−26.50−11.50<0.00010.99470.9991
Pirimiphos-methyl89.420.770.11−0.39−2.62−3.771.50−24.91−26.48−11.74<0.00010.99560.9982
Phosalone82.48−0.11−0.30−0.36−2.08−4.003.43−22.32−28.74−11.76<0.00010. 63620.9975
Malathion98.40−0.0500.16−0.088−2.03−3.383.45−22.00−28.38−12.07<0.00010.97560.9993
Fenthion100.16−0.0250.260.21−2.58−6.480.45−24.23−24.66−13.00<0.00010.84180.9982
Fenamiphos102.740.31−0.14−0.67−1.85−2.783.47−21.82−28.32−11.99<0.00010.98170.9984
Bolstar90.00−1.22−1.02−0.30−2.30−5.101.20−21.95−28.35−13.80<0.00010.98420.9987
Disclaimer/Publisher’s Note: The statements, opinions and data contained in all publications are solely those of the individual author(s) and contributor(s) and not of MDPI and/or the editor(s). MDPI and/or the editor(s) disclaim responsibility for any injury to people or property resulting from any ideas, methods, instructions or products referred to in the content.

