
Unveiling Allosteric Regulation and Binding Mechanism of BRD9 through Molecular Dynamics Simulations and Markov Modeling


Abstract
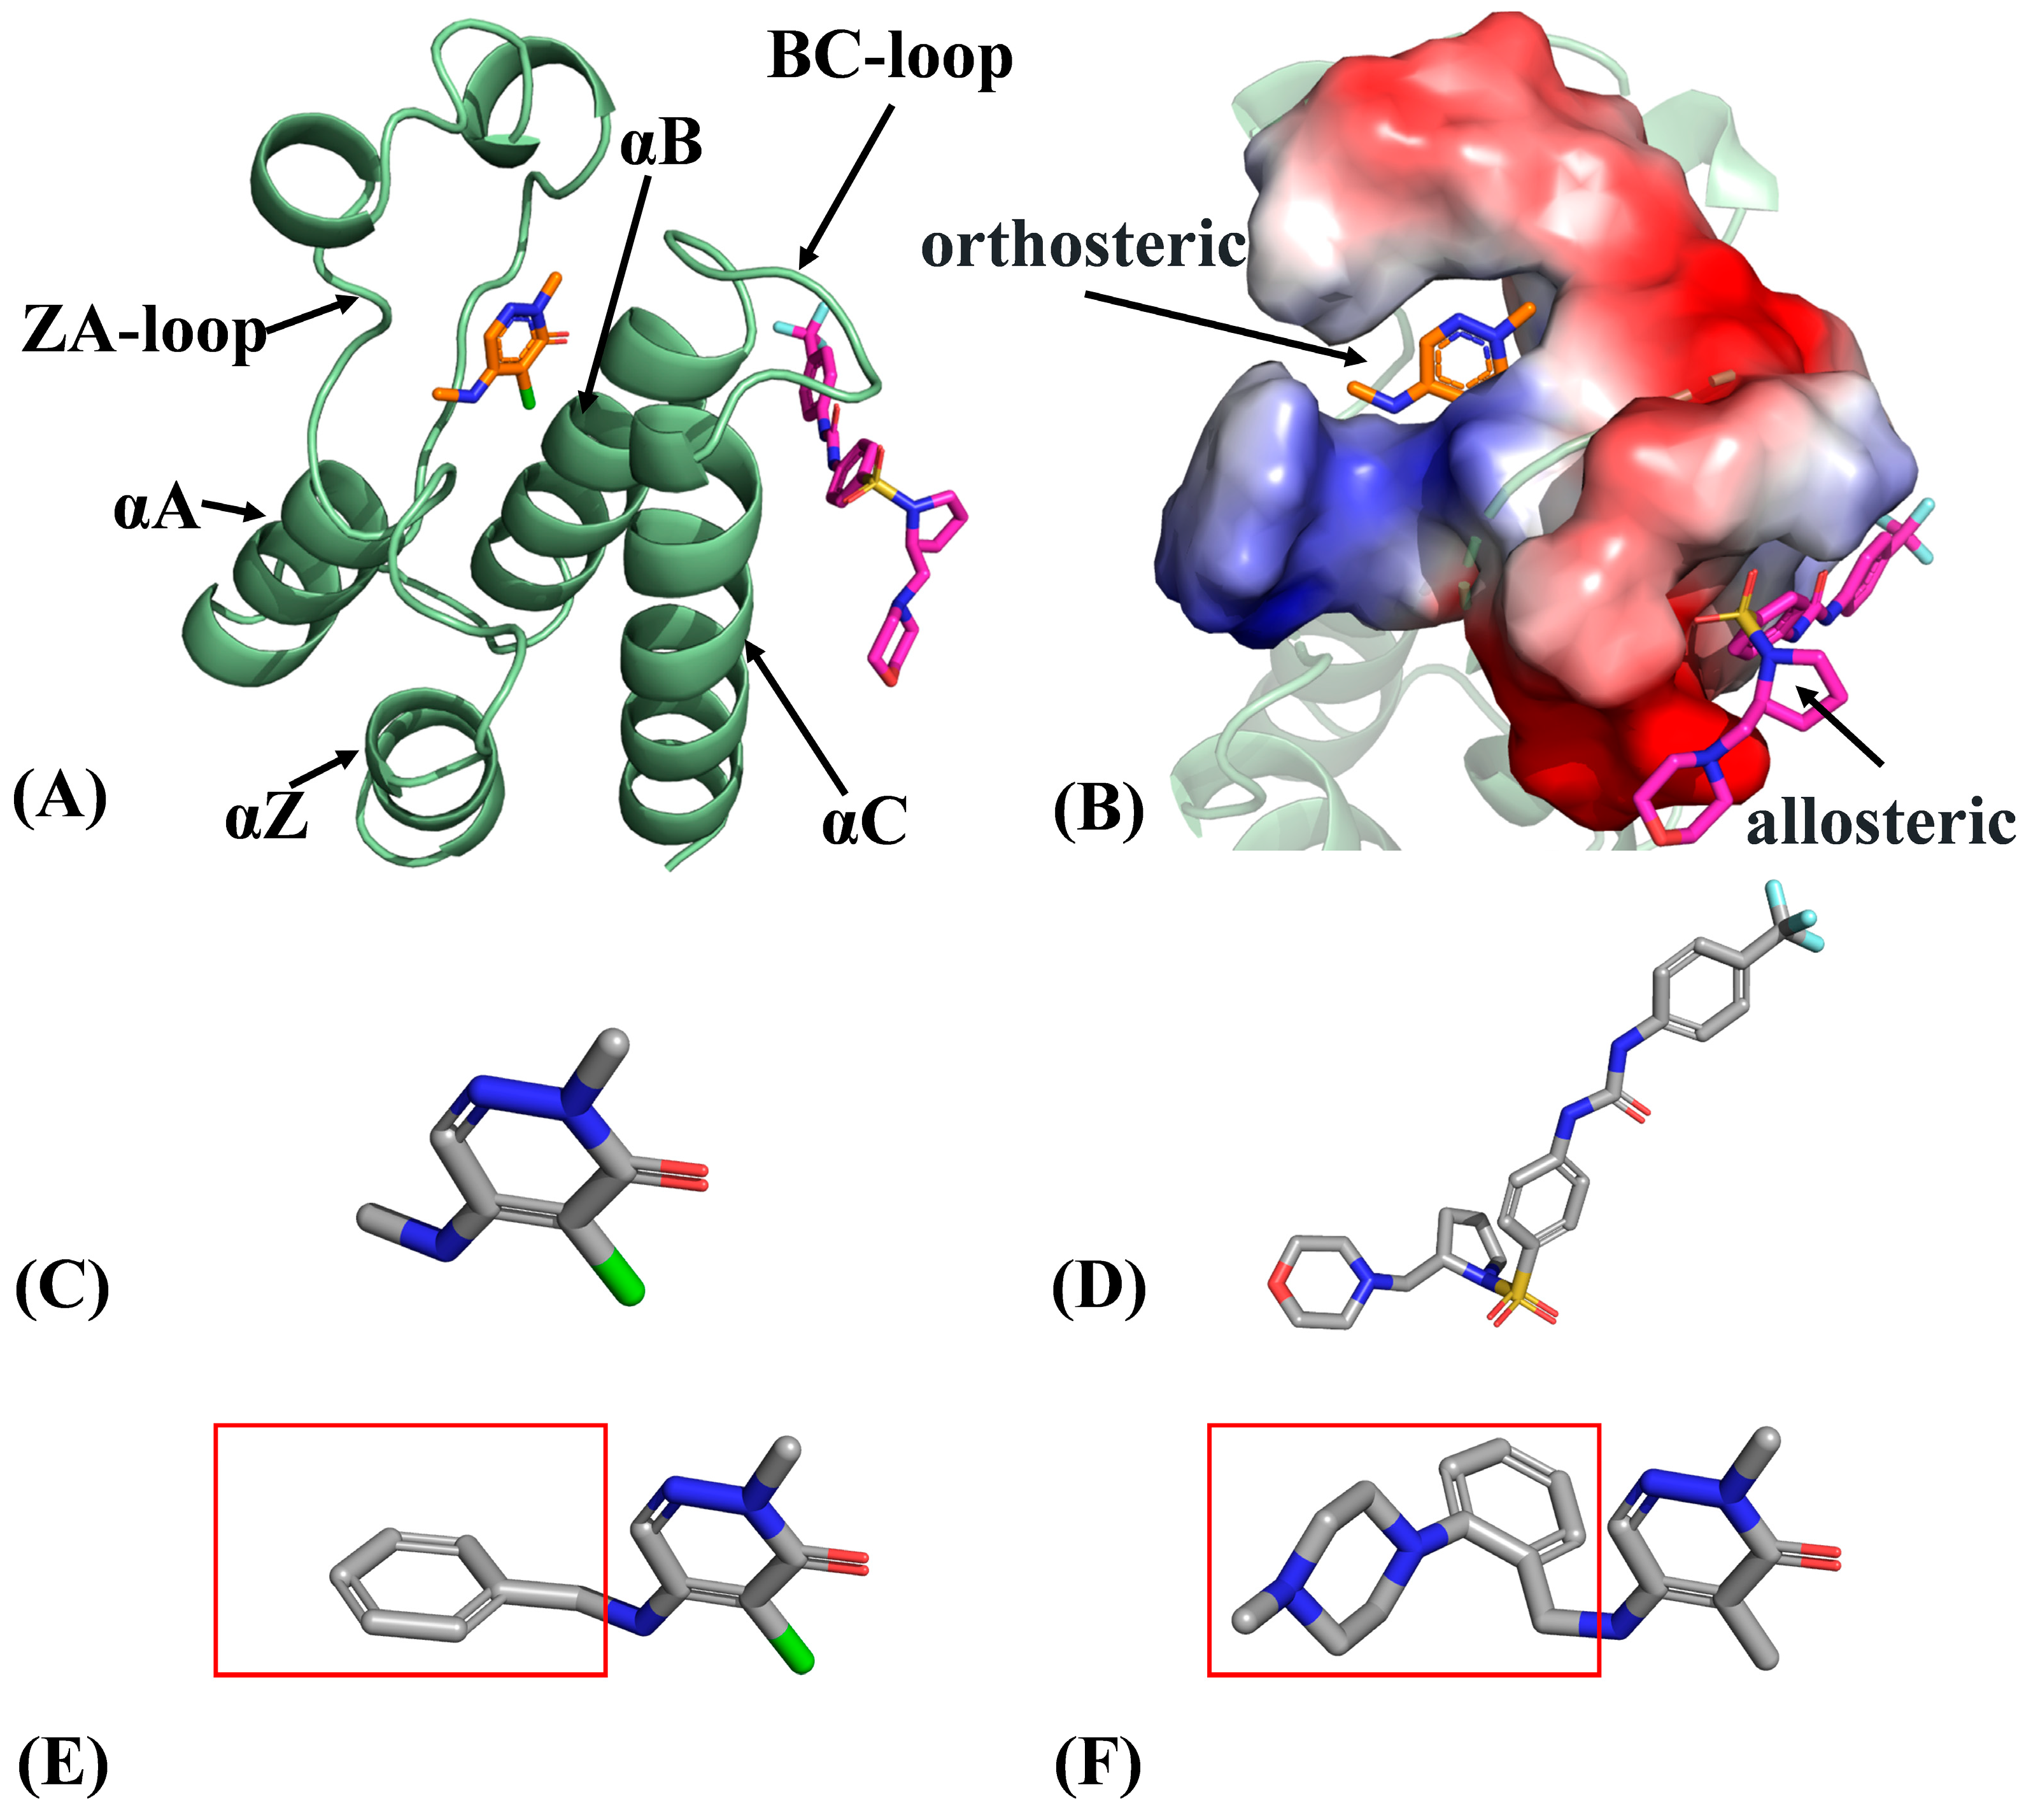
1. Introduction
2. Results and Discussion
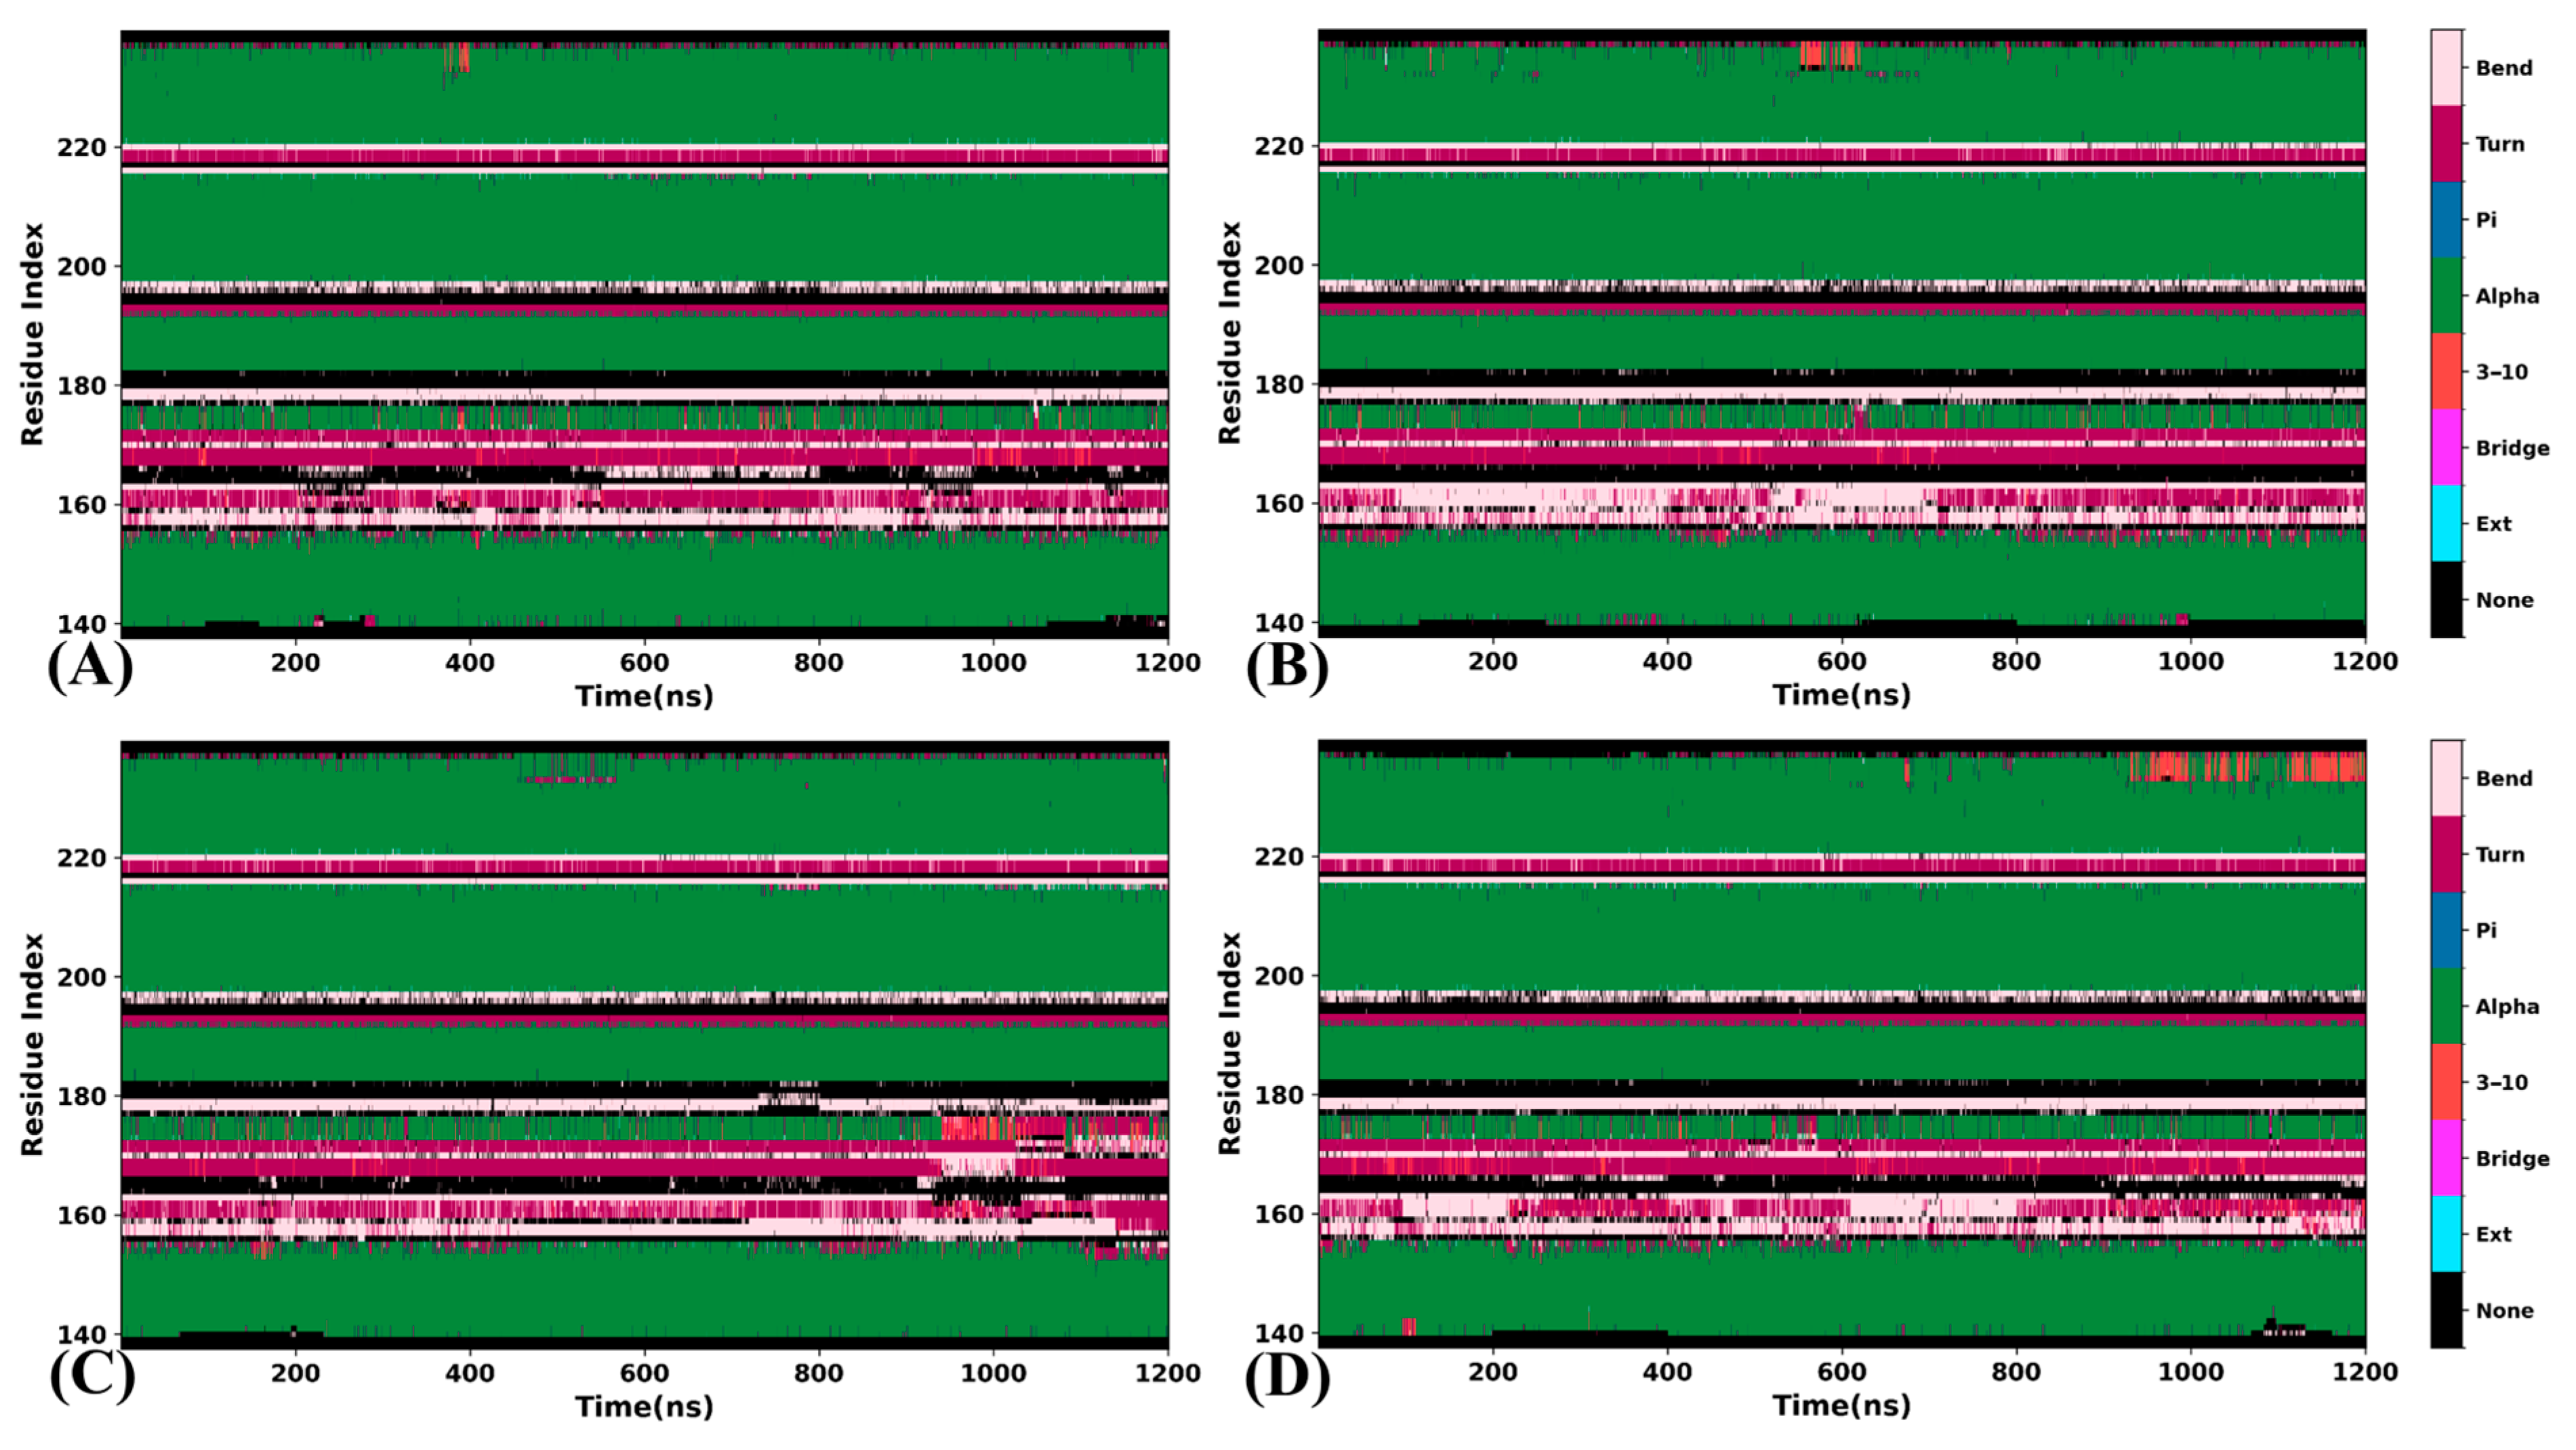
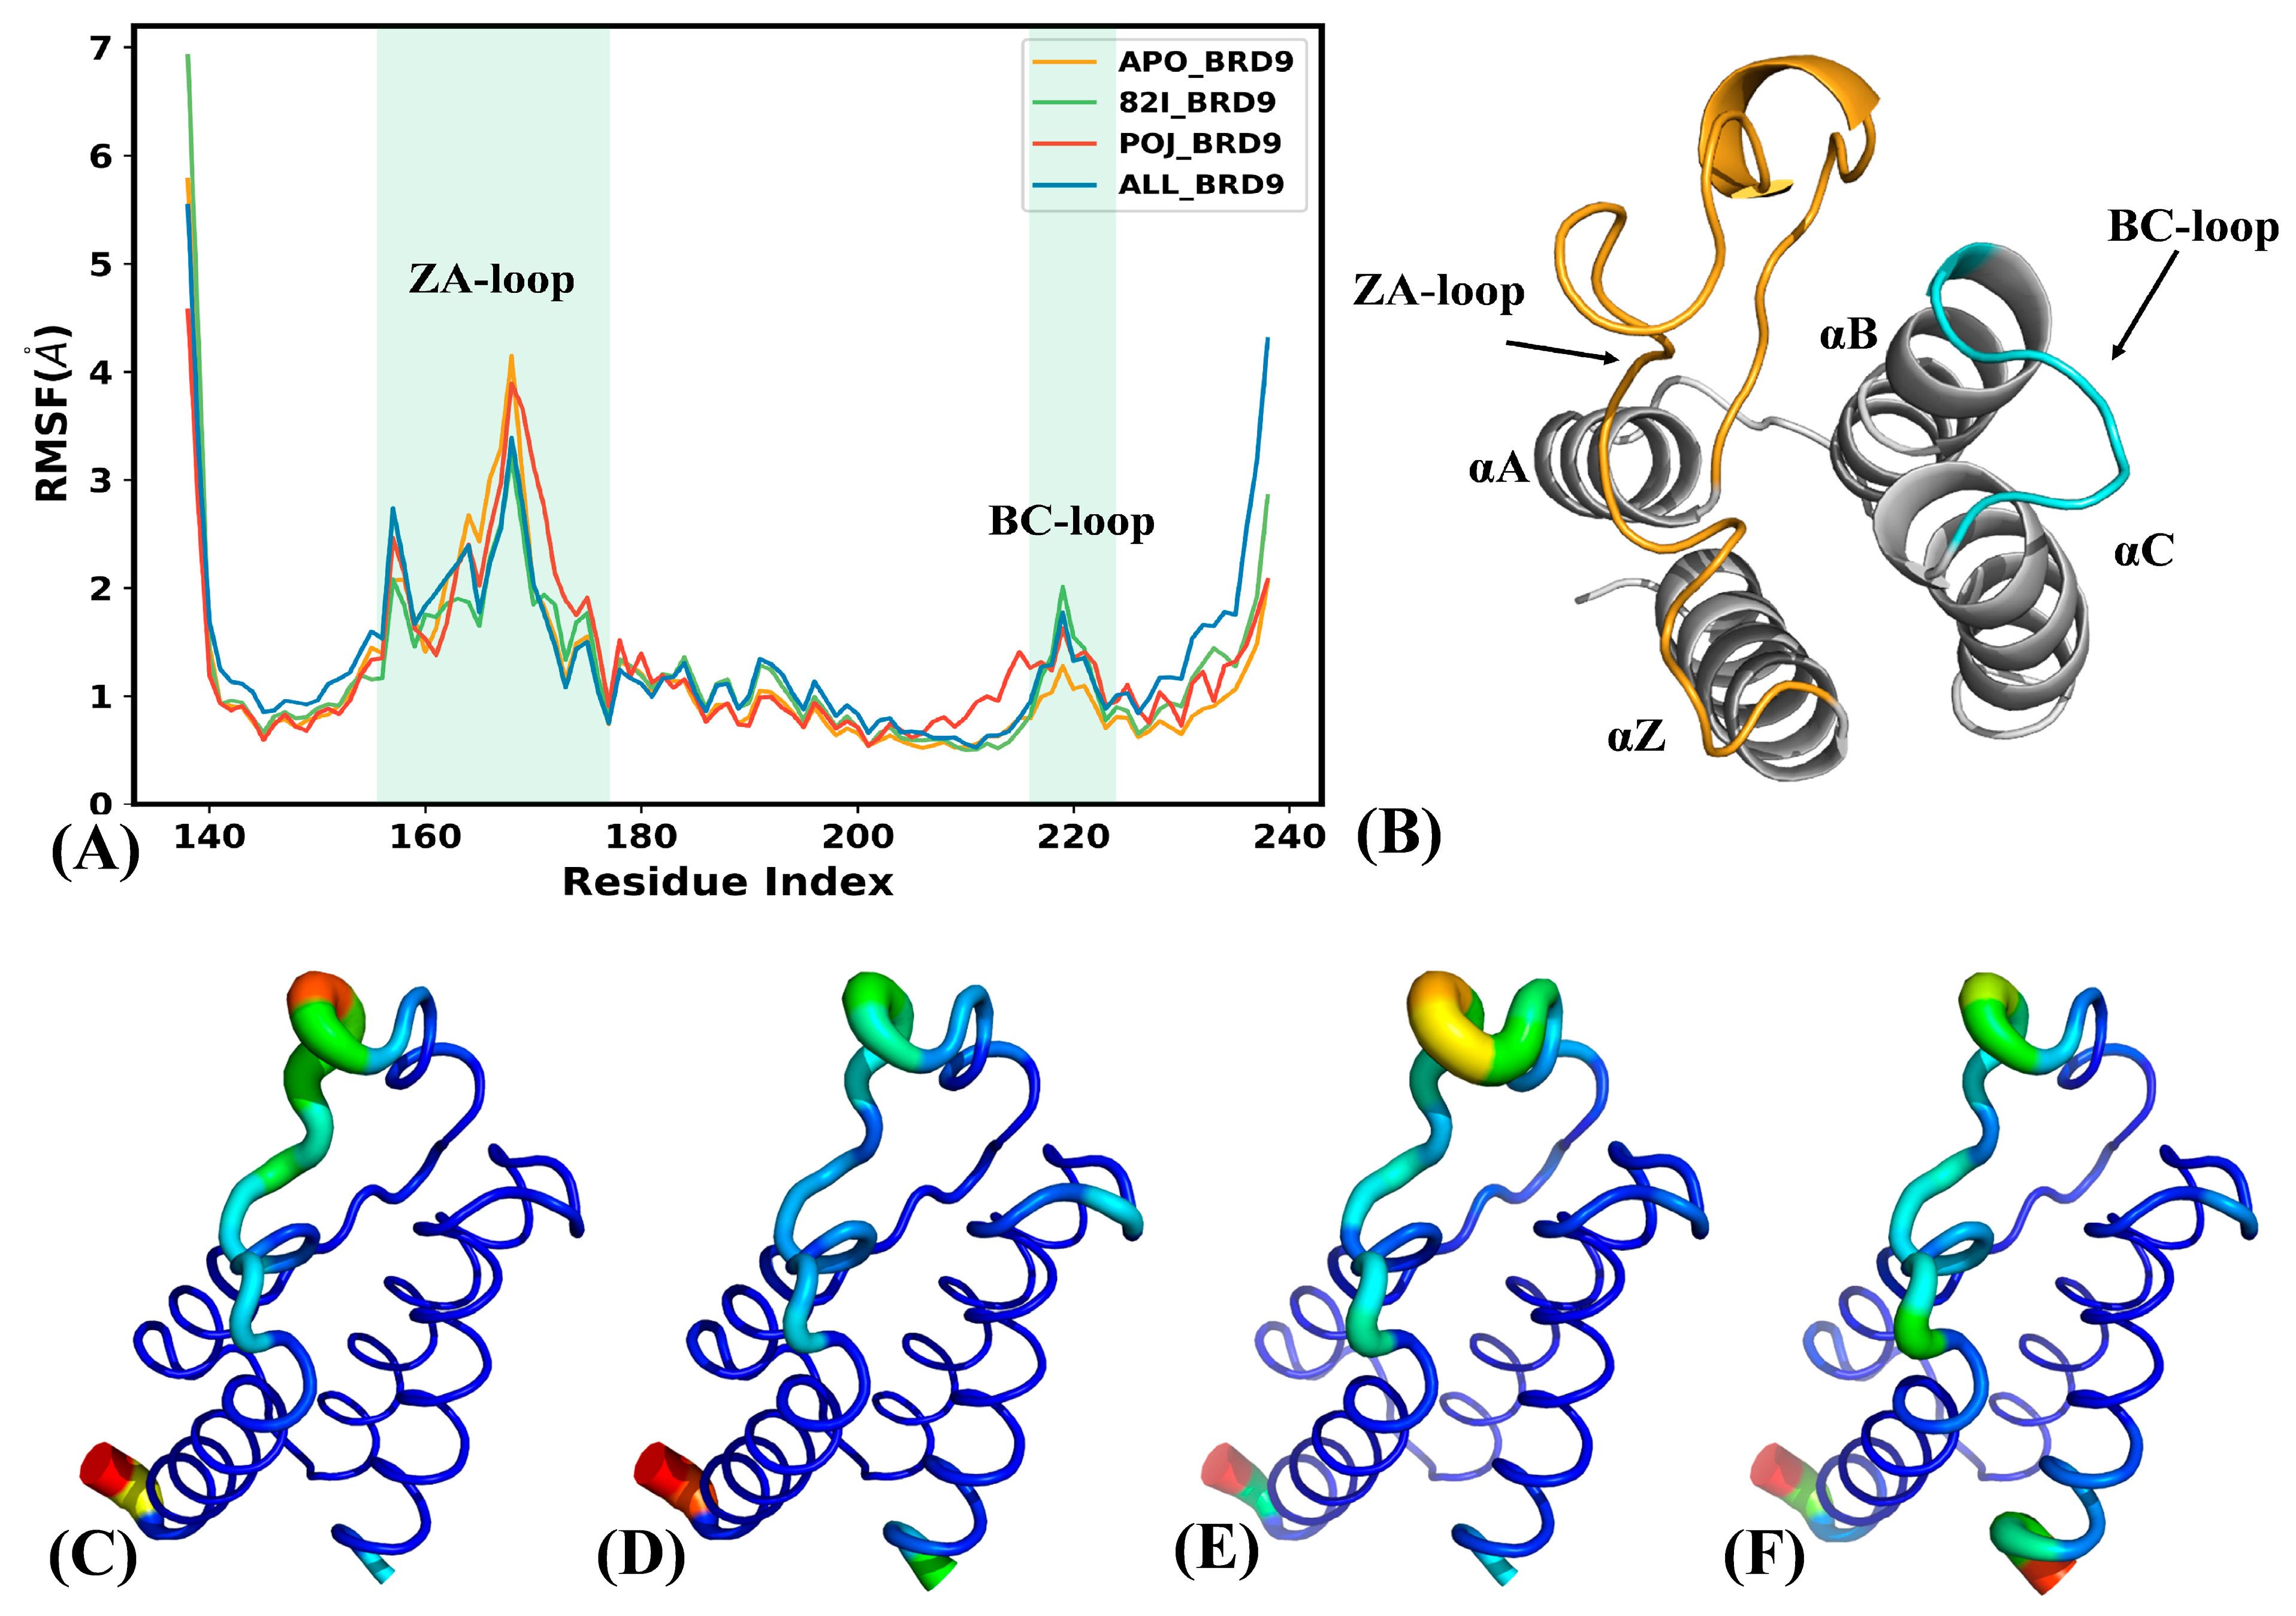
2.1. Structural Stability and Flexibility
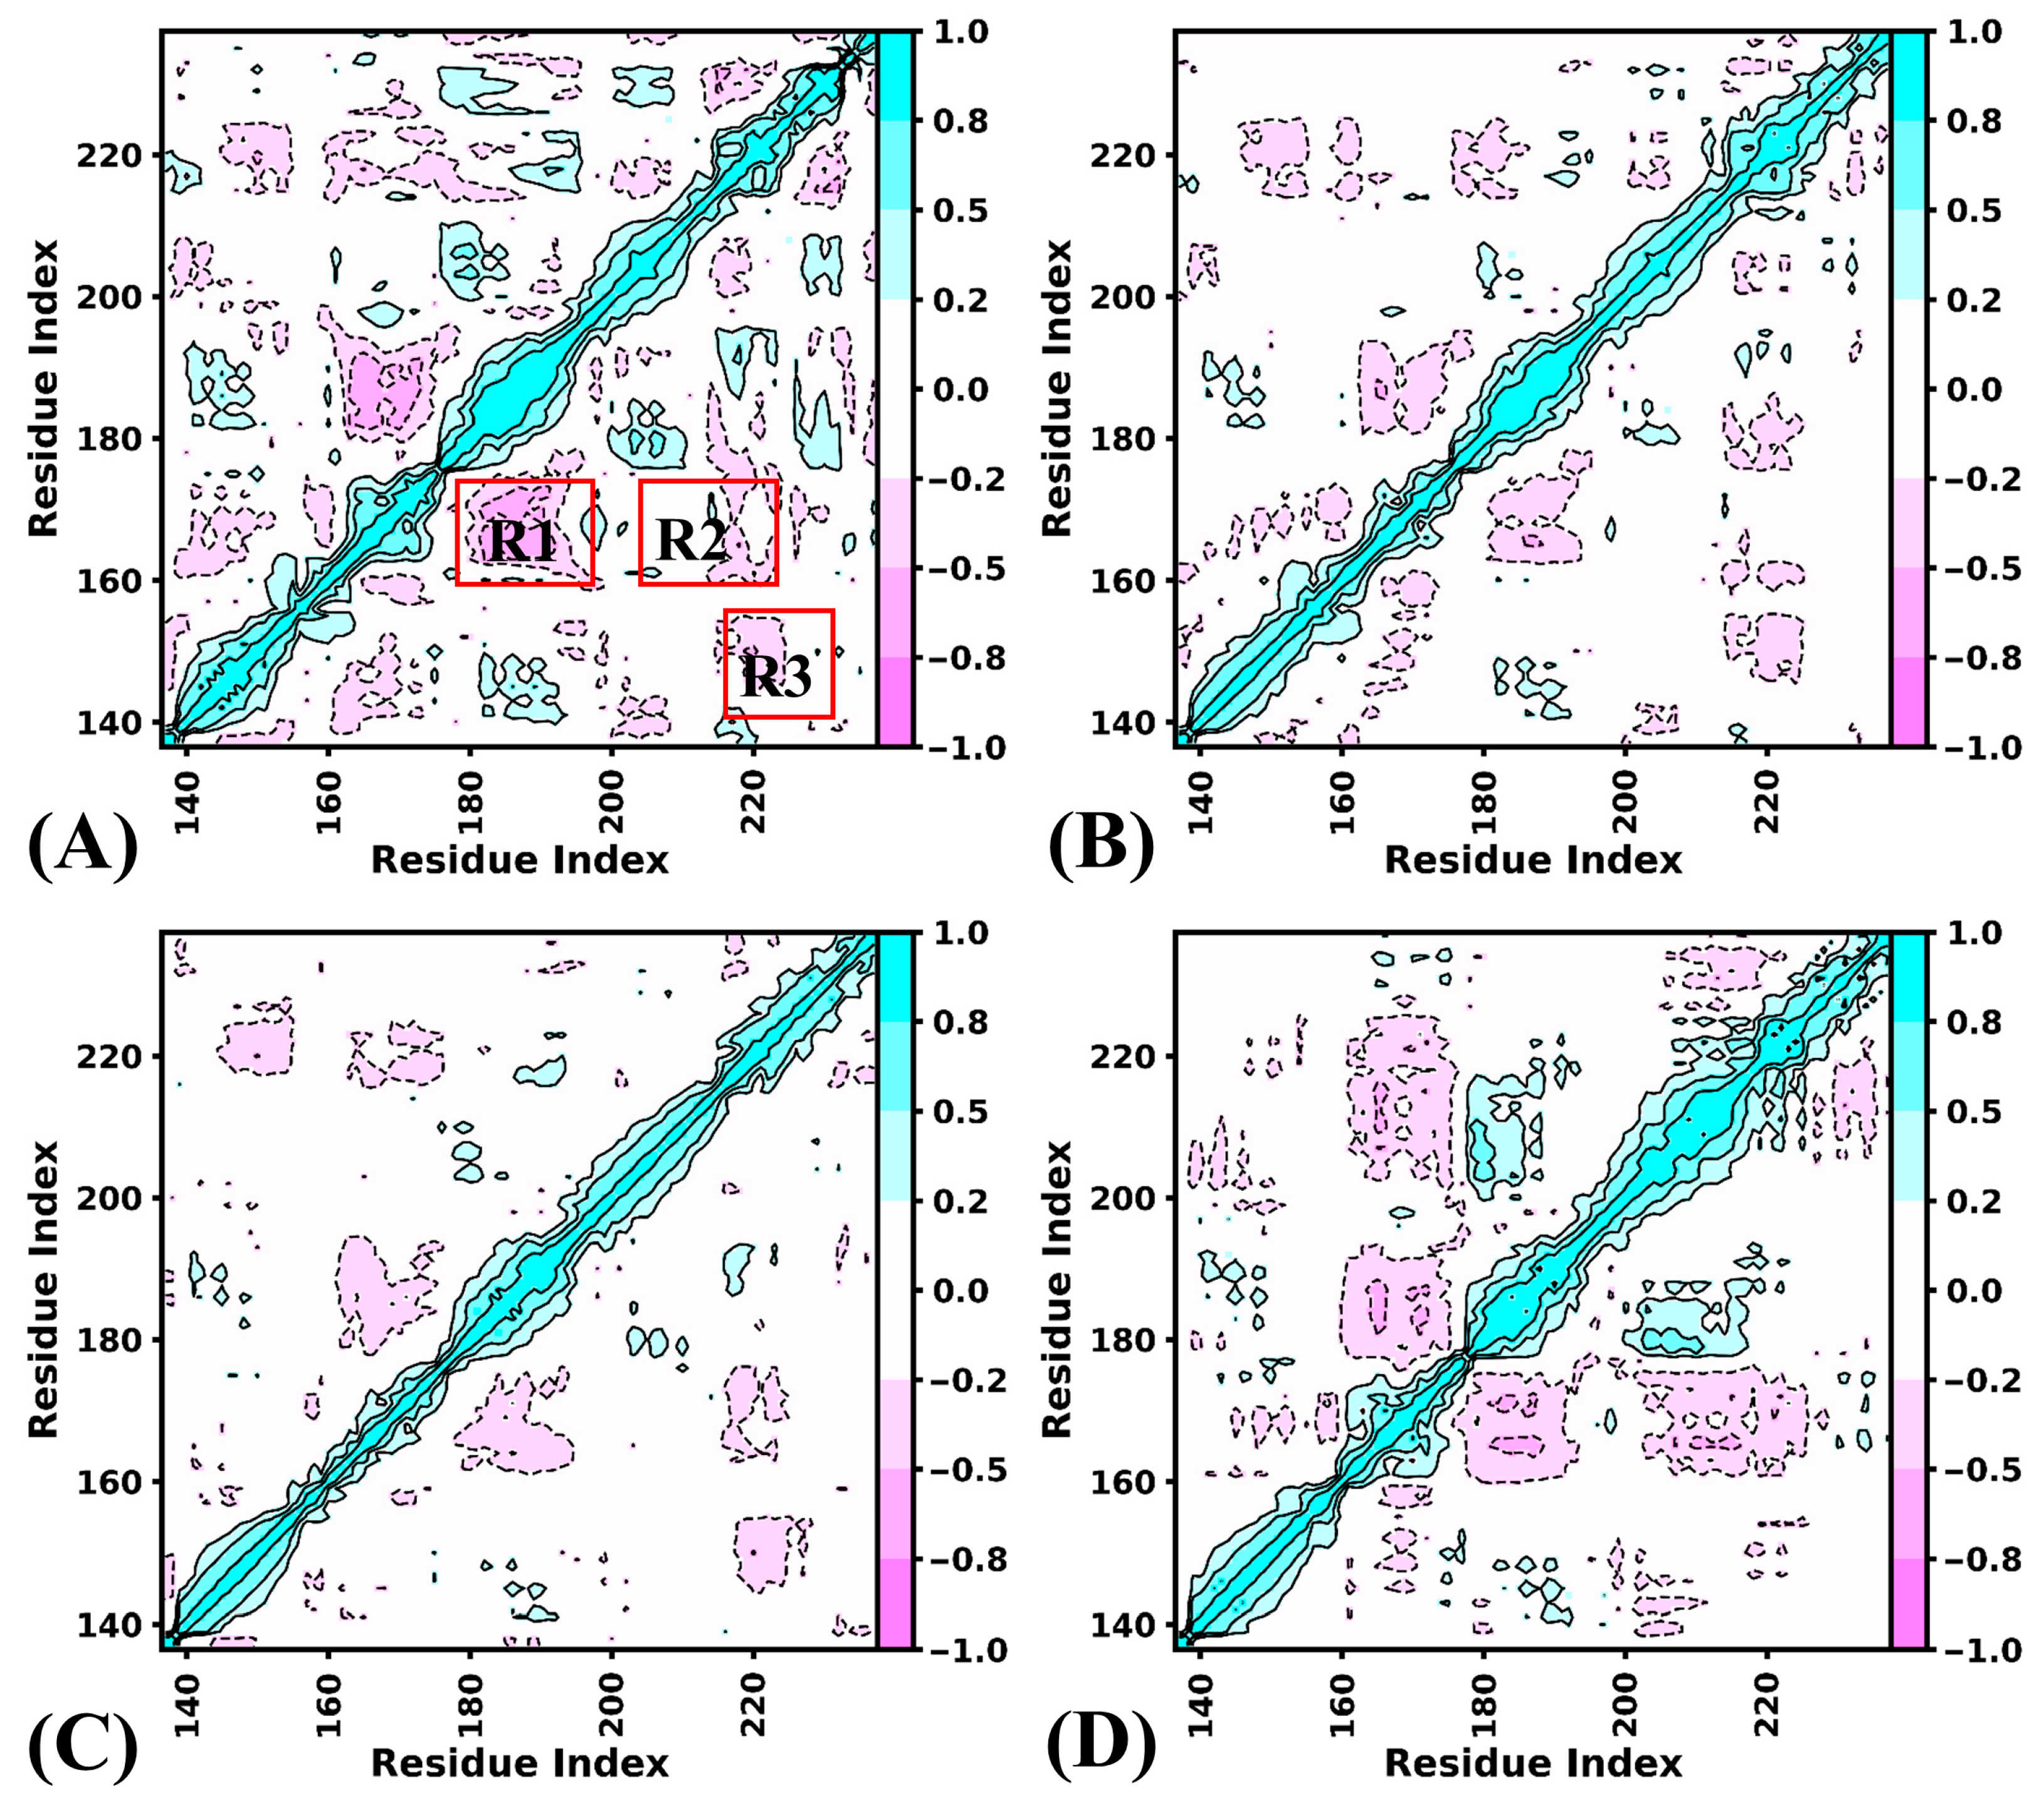
2.2. Internal Dynamics of BRD9 Affected by Binding of 82I and POJ
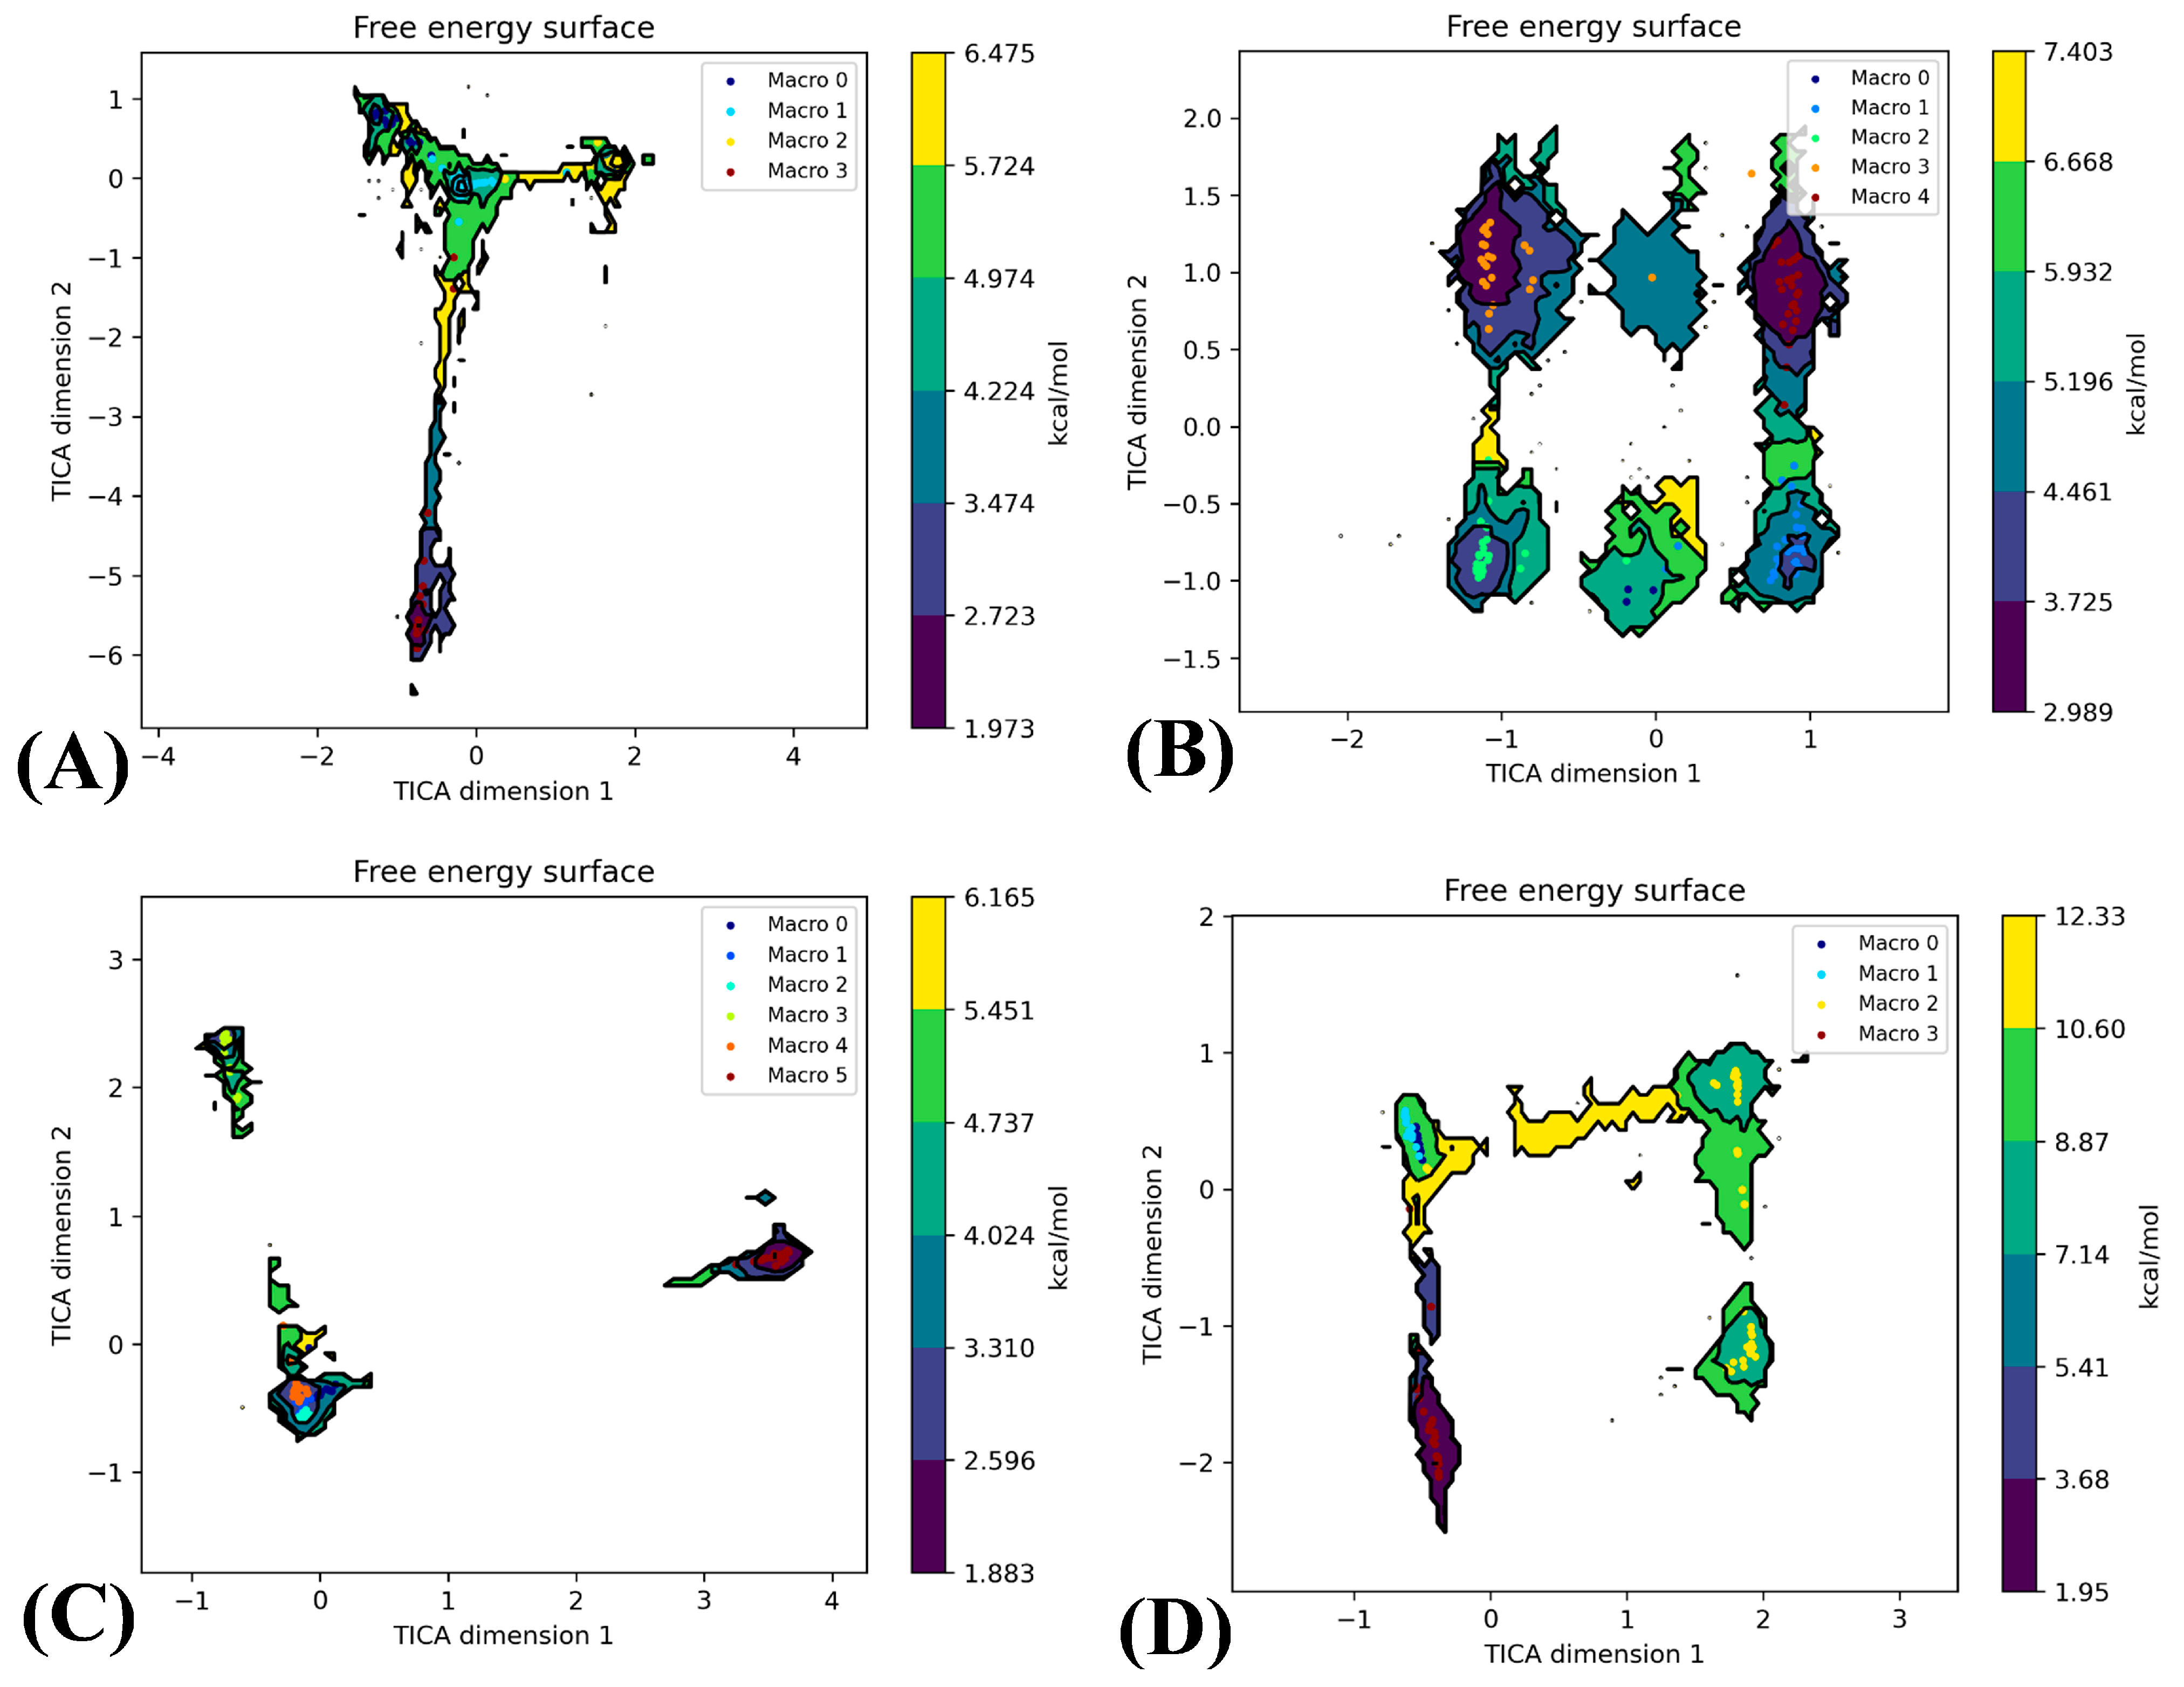
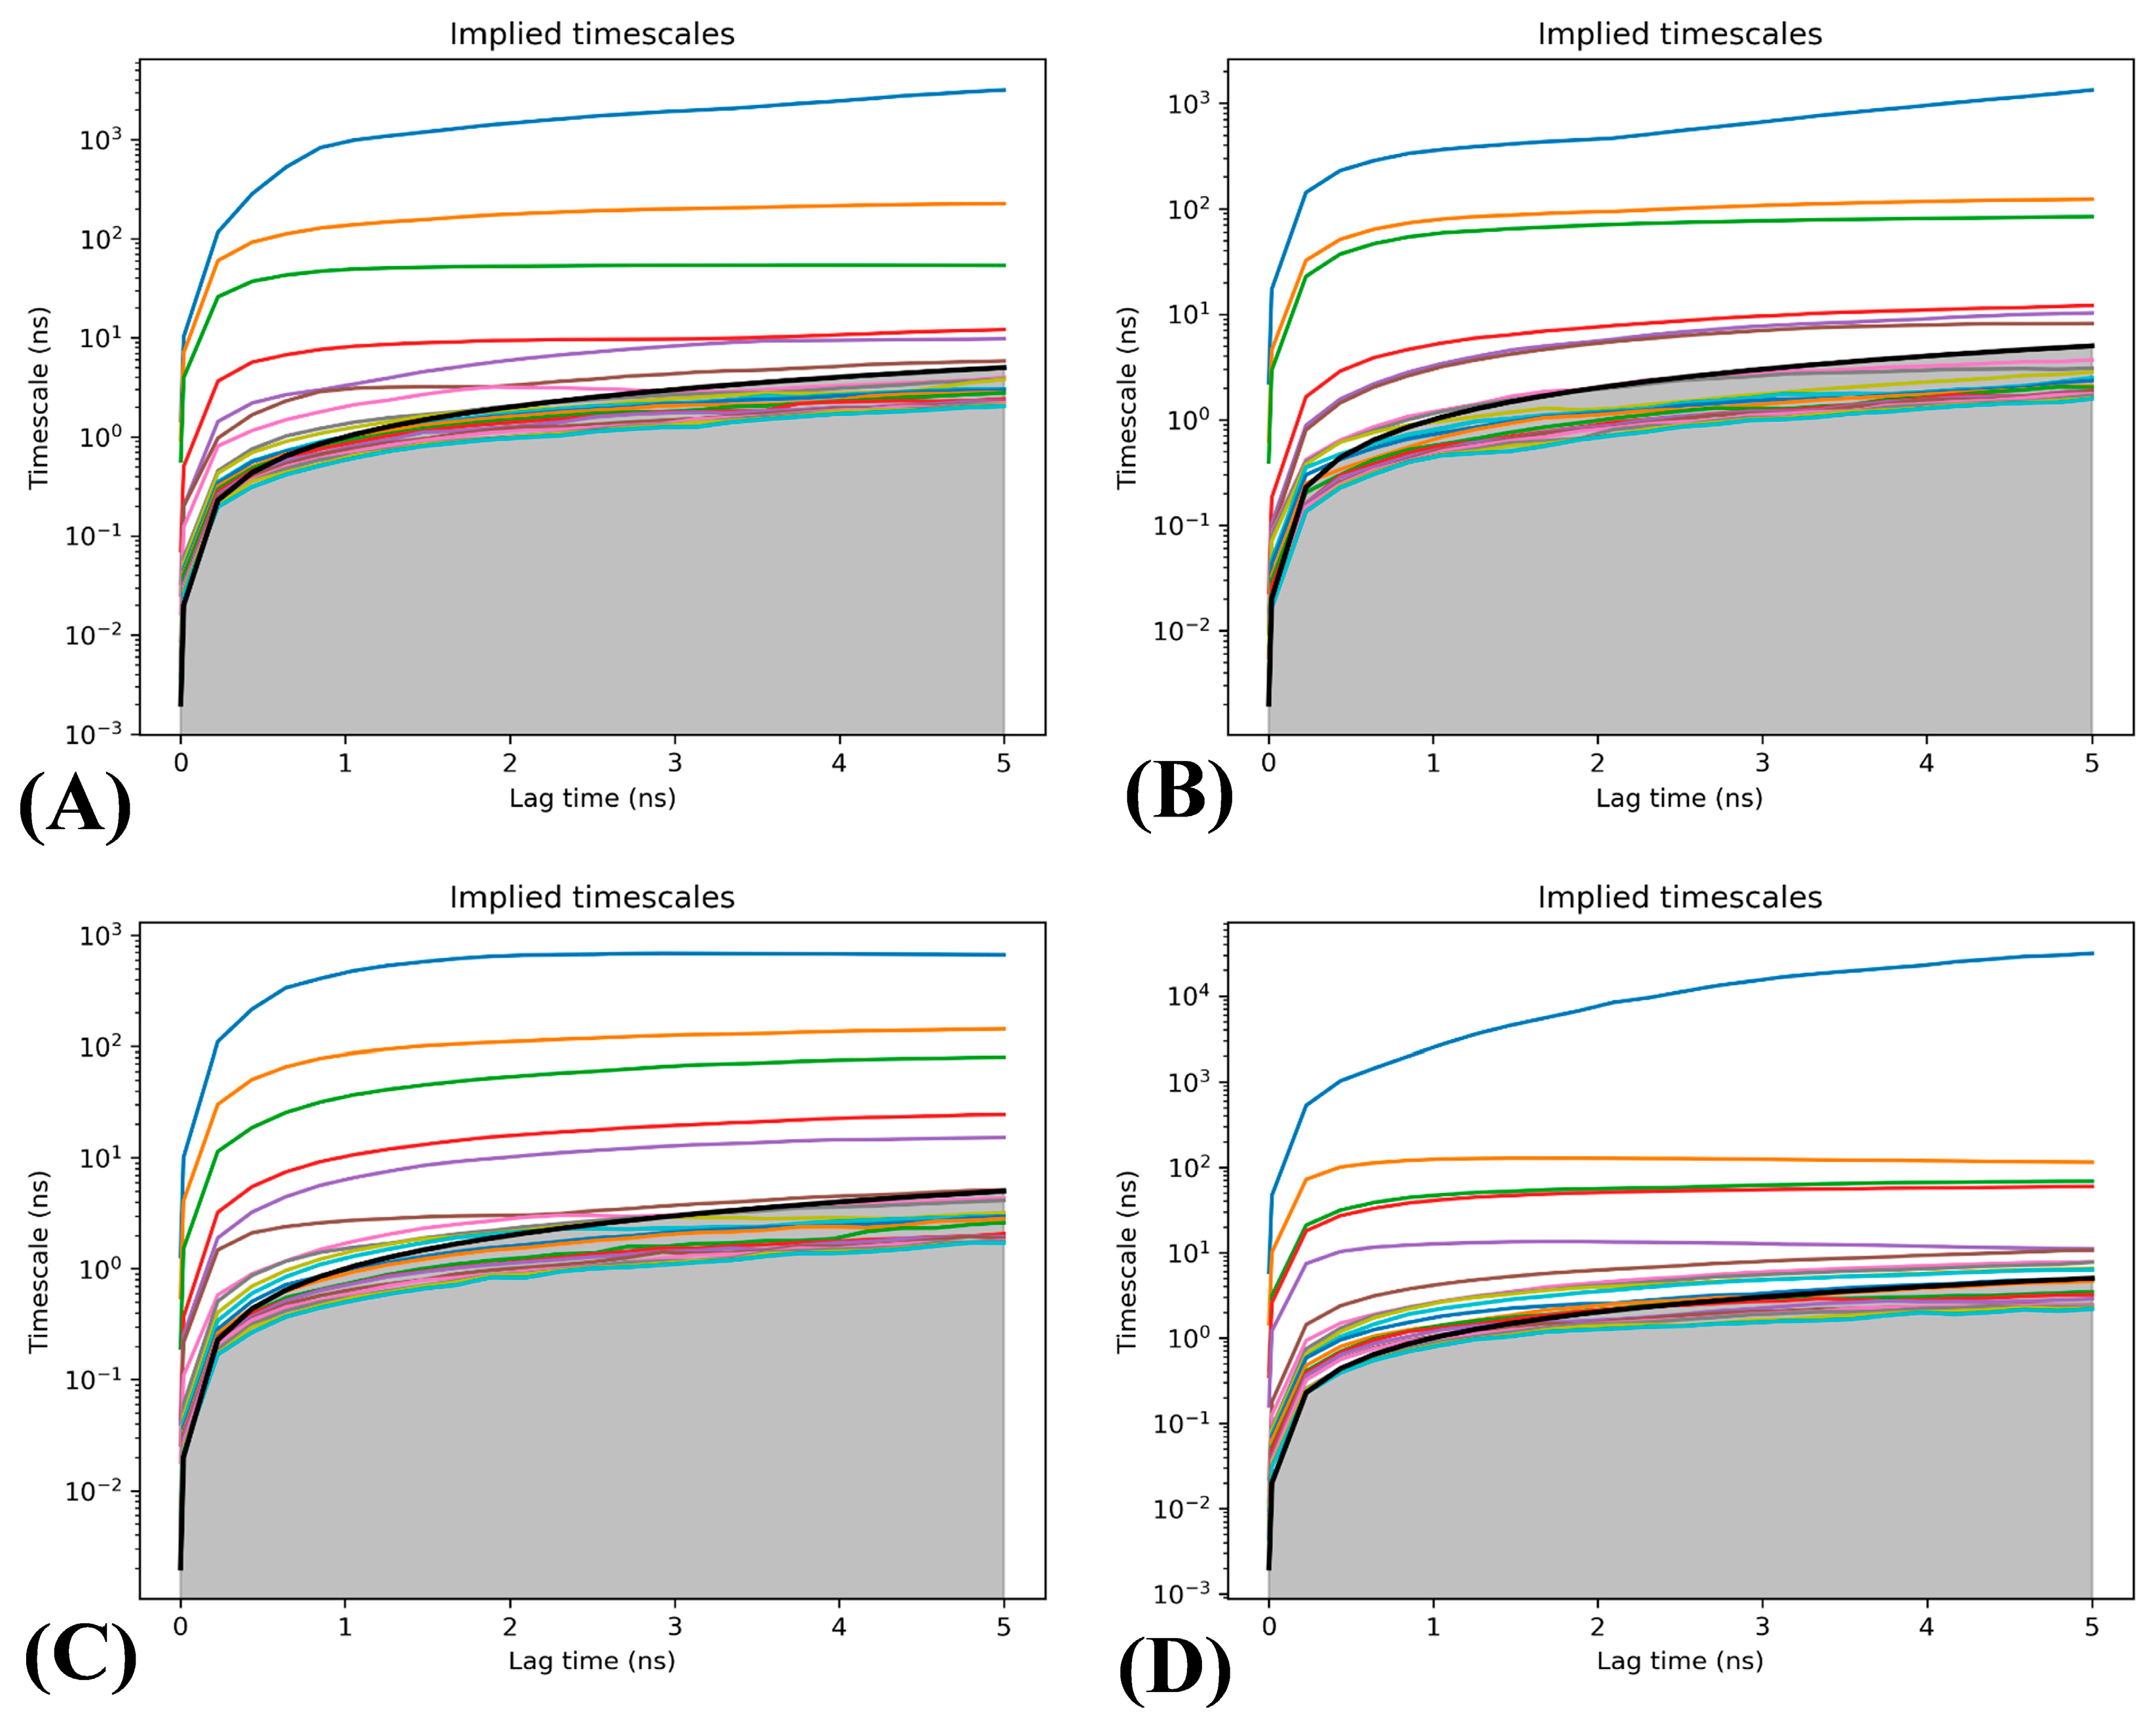
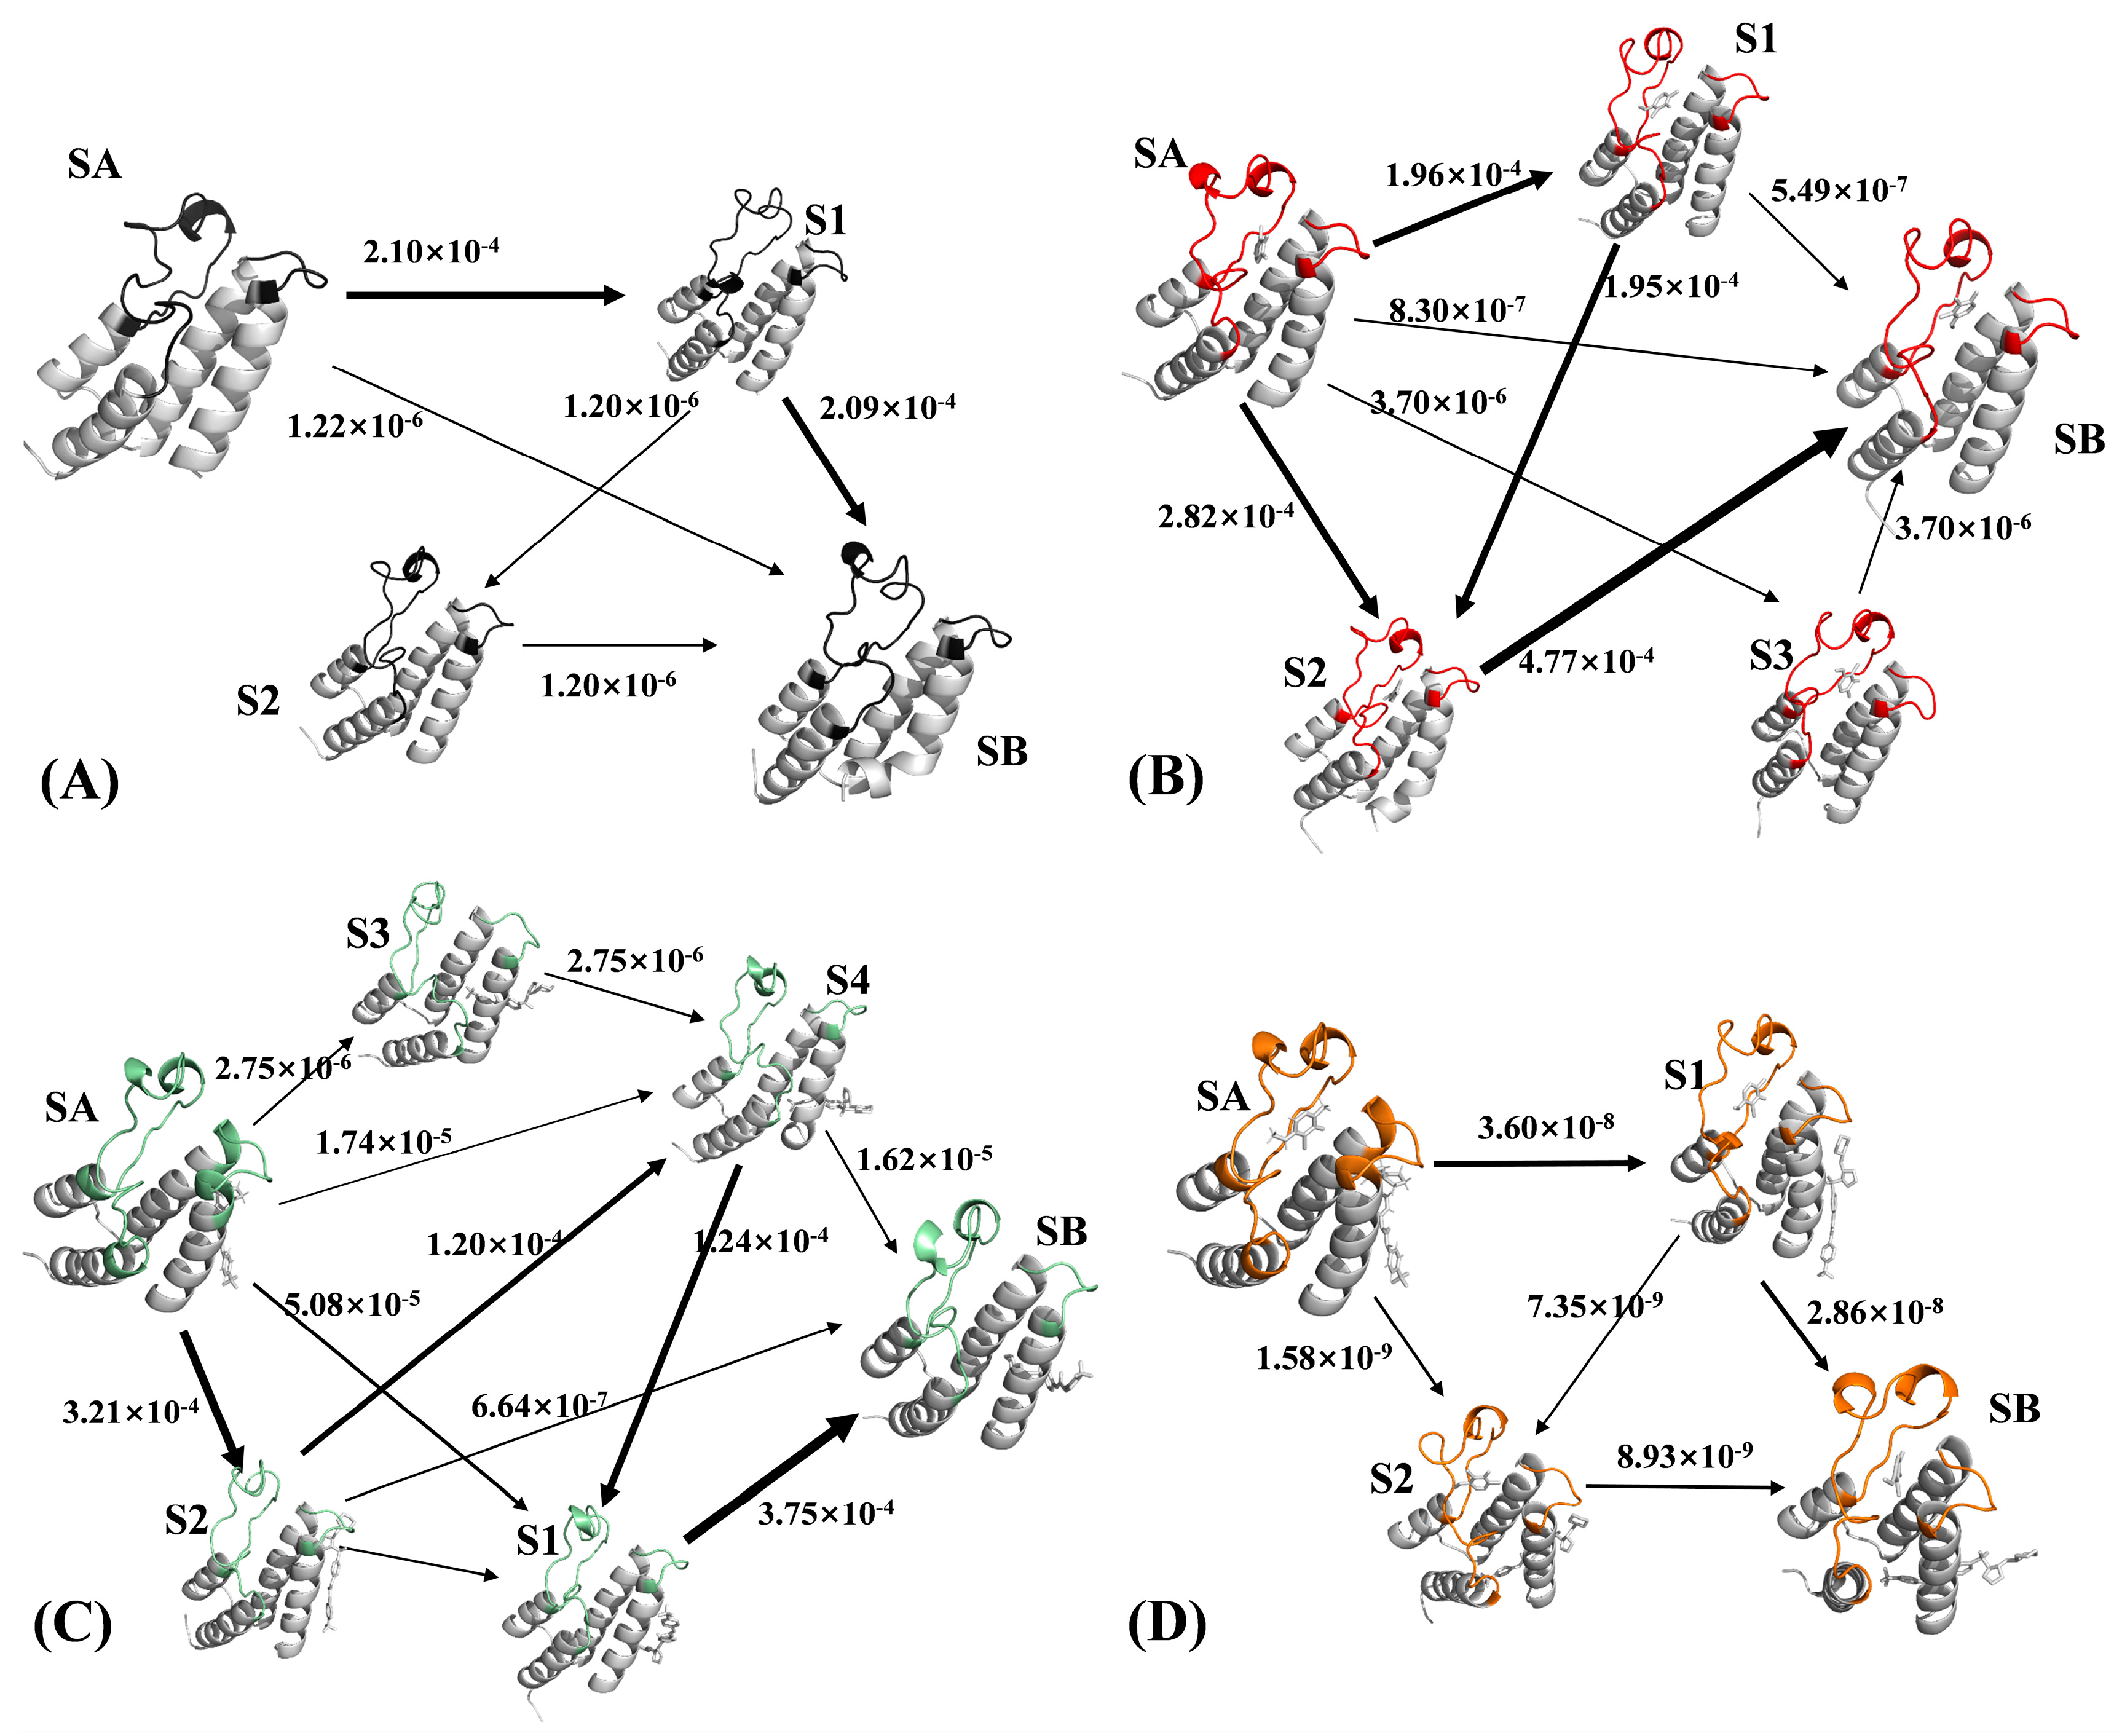
2.3. Analyses of Markov Model
2.4. Binding Ability of Two Types of Inhibitors to BRD9
3. Materials and Methods
3.1. Preparation of Simulation Systems
3.2. Multiple Independent Molecular Dynamics Simulations
3.3. Markov Models
3.3.1. TICA Dimensionality Reduction Method
3.3.2. K-Means Clustering Algorithm
3.3.3. Determination of Lag Time
3.3.4. Flux Analysis
3.4. MM-GBSA Calculations
3.5. Solvated Interaction Energy Method
4. Conclusions
Supplementary Materials
Author Contributions
Funding
Institutional Review Board Statement
Informed Consent Statement
Data Availability Statement
Conflicts of Interest
References
- Sterner, D.E.; Berger, S.L. Acetylation of Histones and Transcription-Related Factors. Microbiol. Mol. Biol. Rev. 2000, 64, 435–459. [Google Scholar] [CrossRef]
- Peterson, C.L.; Laniel, M.-A. Histones and histone modifications. Curr. Biol. 2004, 14, R546–R551. [Google Scholar] [CrossRef]
- Damiani, E.; Duran, M.N.; Mohan, N.; Rajendran, P.; Dashwood, R.H. Targeting Epigenetic ‘Readers’ with Natural Compounds for Cancer Interception. J. Cancer Prev. 2020, 25, 189–203. [Google Scholar] [CrossRef]
- Borck, P.C.; Guo, L.-W.; Plutzky, J. BET Epigenetic Reader Proteins in Cardiovascular Transcriptional Programs. Circ. Res. 2020, 126, 1190–1208. [Google Scholar] [CrossRef]
- James, A.M.; Smith, A.C.; Smith, C.L.; Robinson, A.J.; Murphy, M.P. Proximal Cysteines that Enhance Lysine N-Acetylation of Cytosolic Proteins in Mice Are Less Conserved in Longer-Living Species. Cell Rep. 2018, 24, 1445–1455. [Google Scholar] [CrossRef]
- Chiu, L.-Y.; Gong, F.; Miller, K.M. Bromodomain proteins: Repairing DNA damage within chromatin. Philos. Trans. R. Soc. B 2017, 372, 20160286. [Google Scholar] [CrossRef]
- Hnilicová, J.; Hozeifi, S.; Stejskalová, E.; Dušková, E.; Poser, I.; Humpolíčková, J.; Hof, M.; Staněk, D. The C-terminal domain of Brd2 is important for chromatin interaction and regulation of transcription and alternative splicing. Mol. Biol. Cell 2013, 24, 3557–3568. [Google Scholar] [CrossRef]
- Filippakopoulos, P.; Picaud, S.; Mangos, M.; Keates, T.; Lambert, J.-P.; Barsyte-Lovejoy, D.; Felletar, I.; Volkmer, R.; Müller, S.; Pawson, T.; et al. Histone Recognition and Large-Scale Structural Analysis of the Human Bromodomain Family. Cell 2012, 149, 214–231. [Google Scholar] [CrossRef]
- Xu, C.; Yu, M.; Zhang, Q.; Ma, Z.; Du, K.; You, H.; Wei, J.; Wang, D.; Tao, W. Genome-Wide Identification and Characterization of the BRD Family in Nile Tilapia (Oreochromis niloticus). Animals 2022, 12, 2266. [Google Scholar] [CrossRef]
- Lloyd, J.T.; Glass, K.C. Biological function and histone recognition of family IV bromodomain-containing proteins. J. Cell. Physiol. 2018, 233, 1877–1886. [Google Scholar] [CrossRef]
- White, M.E.; Fenger, J.M.; Carson, W.E. Emerging roles of and therapeutic strategies targeting BRD4 in cancer. Cell. Immunol. 2019, 337, 48–53. [Google Scholar] [CrossRef]
- Andrieu, G.P.; Shafran, J.S.; Deeney, J.T.; Bharadwaj, K.R.; Rangarajan, A.; Denis, G.V. BET proteins in abnormal metabolism, inflammation, and the breast cancer microenvironment. J. Leukoc. Biol. 2018, 104, 265–274. [Google Scholar] [CrossRef]
- Yang, X.; Gao, Y.; Cao, F.; Wang, S. Molecular Dynamics Simulations Combined with Markov Model to Explore the Effect of Allosteric Inhibitor Binding on Bromodomain-Containing Protein 4. Int. J. Mol. Sci. 2023, 24, 10831. [Google Scholar] [CrossRef]
- Allen, B.K.; Mehta, S.; Ember, S.W.J.; Zhu, J.-Y.; Schönbrunn, E.; Ayad, N.G.; Schürer, S.C. Identification of a Novel Class of BRD4 Inhibitors by Computational Screening and Binding Simulations. ACS Omega 2017, 2, 4760–4771. [Google Scholar] [CrossRef]
- Johansson, K.; Ramaswamy, S.; Ljungcrantz, C.; Knecht, W.; Piškur, J.; Munch-Petersen, B.; Eriksson, S.; Eklund, H. Structural basis for substrate specificities of cellular deoxyribonucleoside kinases. Nat. Struct. Biol. 2001, 8, 616–620. [Google Scholar] [CrossRef]
- Haynes, S.R.; Dollard, C.; Winston, F.; Beck, S.; Trowsdale, J.; Dawid, I.B. The bromodomain: A conserved sequence found in human, Drosophila and yeast proteins. Nucleic Acids Res. 1992, 20, 2603. [Google Scholar] [CrossRef]
- Su, J.; Liu, X.; Zhang, S.; Yan, F.; Zhang, Q.; Chen, J. A theoretical insight into selectivity of inhibitors toward two domains of bromodomain-containing protein 4 using molecular dynamics simulations. Chem. Biol. Drug Des. 2018, 91, 828–840. [Google Scholar] [CrossRef]
- Donati, B.; Lorenzini, E.; Ciarrocchi, A. BRD4 and Cancer: Going beyond transcriptional regulation. Mol. Cancer 2018, 17, 164. [Google Scholar] [CrossRef]
- Duan, Y.; Guan, Y.; Qin, W.; Zhai, X.; Yu, B.; Liu, H. Targeting Brd4 for cancer therapy: Inhibitors and degraders. MedChemComm 2018, 9, 1779–1802. [Google Scholar] [CrossRef]
- Yin, M.; Guo, Y.; Hu, R.; Cai, W.L.; Li, Y.; Pei, S.; Sun, H.; Peng, C.; Li, J.; Ye, R.; et al. Potent BRD4 inhibitor suppresses cancer cell-macrophage interaction. Nat. Commun. 2020, 11, 1833. [Google Scholar] [CrossRef]
- Lu, S.; He, X.; Ni, D.; Zhang, J. Allosteric Modulator Discovery: From Serendipity to Structure-Based Design. J. Med. Chem. 2019, 62, 6405–6421. [Google Scholar] [CrossRef]
- Clegg, M.A.; Bamborough, P.; Chung, C.-w.; Craggs, P.D.; Gordon, L.; Grandi, P.; Leveridge, M.; Lindon, M.; Liwicki, G.M.; Michon, A.-M.; et al. Application of Atypical Acetyl-lysine Methyl Mimetics in the Development of Selective Inhibitors of the Bromodomain-Containing Protein 7 (BRD7)/Bromodomain-Containing Protein 9 (BRD9) Bromodomains. J. Med. Chem. 2020, 63, 5816–5840. [Google Scholar] [CrossRef] [PubMed]
- Du, J.; Liu, Y.; Wu, X.; Sun, J.; Shi, J.; Zhang, H.; Zheng, A.; Zhou, M.; Jiang, X. BRD9-mediated chromatin remodeling suppresses osteoclastogenesis through negative feedback mechanism. Nat. Commun. 2023, 14, 1413. [Google Scholar] [CrossRef] [PubMed]
- Gatchalian, J.; Malik, S.; Ho, J.; Lee, D.-S.; Kelso, T.W.R.; Shokhirev, M.N.; Dixon, J.R.; Hargreaves, D.C. A non-canonical BRD9-containing BAF chromatin remodeling complex regulates naive pluripotency in mouse embryonic stem cells. Nat. Commun. 2018, 9, 5139. [Google Scholar] [CrossRef] [PubMed]
- Xiao, M.; Kondo, S.; Nomura, M.; Kato, S.; Nishimura, K.; Zang, W.; Zhang, Y.; Akashi, T.; Viny, A.; Shigehiro, T.; et al. BRD9 determines the cell fate of hematopoietic stem cells by regulating chromatin state. Nat. Commun. 2023, 14, 8372. [Google Scholar] [CrossRef] [PubMed]
- Alpsoy, A.; Utturkar, S.M.; Carter, B.C.; Dhiman, A.; Torregrosa-Allen, S.E.; Currie, M.P.; Elzey, B.D.; Dykhuizen, E.C. BRD9 Is a Critical Regulator of Androgen Receptor Signaling and Prostate Cancer Progression. Cancer Res. 2021, 81, 820–833. [Google Scholar] [CrossRef]
- Wang, J.; Yang, W.; Zhao, L.; Wei, B.; Chen, J. Binding Mechanism of Inhibitors to BRD4 and BRD9 Decoded by Multiple Independent Molecular Dynamics Simulations and Deep Learning. Molecules 2024, 29, 1857. [Google Scholar] [CrossRef] [PubMed]
- Wang, L.; Wang, Y.; Zhao, J.; Yu, Y.; Kang, N.; Yang, Z. Theoretical exploration of the binding selectivity of inhibitors to BRD7 and BRD9 with multiple short molecular dynamics simulations. RSC Adv. 2022, 12, 16663–16676. [Google Scholar] [CrossRef] [PubMed]
- Theodoulou, N.H.; Bamborough, P.; Bannister, A.J.; Becher, I.; Bit, R.A.; Che, K.H.; Chung, C.-w.; Dittmann, A.; Drewes, G.; Drewry, D.H.; et al. Discovery of I-BRD9, a Selective Cell Active Chemical Probe for Bromodomain Containing Protein 9 Inhibition. J. Med. Chem. 2016, 59, 1425–1439. [Google Scholar] [CrossRef] [PubMed]
- Weisberg, E.; Chowdhury, B.; Meng, C.; Case, A.E.; Ni, W.; Garg, S.; Sattler, M.; Azab, A.K.; Sun, J.; Muz, B.; et al. BRD9 degraders as chemosensitizers in acute leukemia and multiple myeloma. Blood Cancer J. 2022, 12, 110. [Google Scholar] [CrossRef]
- Liu, Z.; Li, Y.; Chen, H.; Lai, H.-T.; Wang, P.; Wu, S.-Y.; Wold, E.A.; Leonard, P.G.; Joseph, S.; Hu, H.; et al. Discovery, X-ray Crystallography, and Anti-inflammatory Activity of Bromodomain-containing Protein 4 (BRD4) BD1 Inhibitors Targeting a Distinct New Binding Site. J. Med. Chem. 2022, 65, 2388–2408. [Google Scholar] [CrossRef] [PubMed]
- Sun, Z.; Gong, Z.; Xia, F.; He, X. Ion dynamics and selectivity of Nav channels from molecular dynamics simulation. Chem. Phys. 2021, 548, 111245. [Google Scholar] [CrossRef]
- Xue, W.; Yang, F.; Wang, P.; Zheng, G.; Chen, Y.; Yao, X.; Zhu, F. What Contributes to Serotonin-Norepinephrine Reuptake Inhibitors’ Dual-Targeting Mechanism? The Key Role of Transmembrane Domain 6 in Human Serotonin and Norepinephrine Transporters Revealed by Molecular Dynamics Simulation. ACS Chem. Neurosci. 2018, 9, 1128–1140. [Google Scholar] [CrossRef]
- Sun, H.; Li, Y.; Shen, M.; Tian, S.; Xu, L.; Pan, P.; Guan, Y.; Hou, T. Assessing the performance of MM/PBSA and MM/GBSA methods. 5. Improved docking performance using high solute dielectric constant MM/GBSA and MM/PBSA rescoring. Phys. Chem. Chem. Phys. 2014, 16, 22035–22045. [Google Scholar] [CrossRef]
- Wang, J.; Miao, Y. Mechanistic Insights into Specific G Protein Interactions with Adenosine Receptors. J. Phys. Chem. B 2019, 123, 6462–6473. [Google Scholar] [CrossRef] [PubMed]
- Chen, J.; Wang, J.; Yang, W.; Zhao, L.; Zhao, J.; Hu, G. Molecular Mechanism of Phosphorylation-Mediated Impacts on the Conformation Dynamics of GTP-Bound KRAS Probed by GaMD Trajectory-Based Deep Learning. Molecules 2024, 29, 2317. [Google Scholar] [CrossRef] [PubMed]
- Sun, H.; Li, Y.; Tian, S.; Xu, L.; Hou, T. Assessing the performance of MM/PBSA and MM/GBSA methods. 4. Accuracies of MM/PBSA and MM/GBSA methodologies evaluated by various simulation protocols using PDBbind data set. Phys. Chem. Chem. Phys. 2014, 16, 16719–16729. [Google Scholar] [CrossRef]
- Sun, Z.; Huai, Z.; He, Q.; Liu, Z. A General Picture of Cucurbit [8] uril Host-Guest Binding. J. Chem. Inf. Model. 2021, 61, 6107–6134. [Google Scholar] [CrossRef] [PubMed]
- Xue, W.; Wang, P.; Tu, G.; Yang, F.; Zheng, G.; Li, X.; Li, X.; Chen, Y.; Yao, X.; Zhu, F. Computational identification of the binding mechanism of a triple reuptake inhibitor amitifadine for the treatment of major depressive disorder. Phys. Chem. Chem. Phys. 2018, 20, 6606–6616. [Google Scholar] [CrossRef]
- Zhao, L.; Wang, J.; Yang, W.; Zhao, K.; Sun, Q.; Chen, J. Unveiling Conformational States of CDK6 Caused by Binding of Vcyclin Protein and Inhibitor by Combining Gaussian Accelerated Molecular Dynamics and Deep Learning. Molecules 2024, 29, 2681. [Google Scholar] [CrossRef]
- Wang, J.; Miao, Y. Peptide Gaussian accelerated molecular dynamics (Pep-GaMD): Enhanced sampling and free energy and kinetics calculations of peptide binding. J. Chem. Phys. 2020, 153, 154109. [Google Scholar] [CrossRef]
- Dong, J.; Wang, X. Identification of novel BRD4 inhibitors by pharmacophore screening, molecular docking, and molecular dynamics simulation. J. Mol. Struct. 2023, 1274, 134363. [Google Scholar] [CrossRef]
- Wang, Y.; Yang, F.; Yan, D.; Zeng, Y.; Wei, B.; Chen, J.; He, W. Identification Mechanism of BACE1 on Inhibitors Probed by Using Multiple Separate Molecular Dynamics Simulations and Comparative Calculations of Binding Free Energies. Molecules 2023, 28, 4773. [Google Scholar] [CrossRef]
- Chodera, J.D.; Noé, F. Markov state models of biomolecular conformational dynamics. Curr. Opin. Struct. Biol. 2014, 25, 135–144. [Google Scholar] [CrossRef]
- Pérez-Hernández, G.; Noé, F. Hierarchical Time-Lagged Independent Component Analysis: Computing Slow Modes and Reaction Coordinates for Large Molecular Systems. J. Chem. Theory Comput. 2016, 12, 6118–6129. [Google Scholar] [CrossRef]
- Scherer, M.K.; Trendelkamp-Schroer, B.; Paul, F.; Pérez-Hernández, G.; Hoffmann, M.; Plattner, N.; Wehmeyer, C.; Prinz, J.-H.; Noé, F. PyEMMA 2: A Software Package for Estimation, Validation, and Analysis of Markov Models. J. Chem. Theory Comput. 2015, 11, 5525–5542. [Google Scholar] [CrossRef]
- Schultze, S.; Grubmüller, H. Time-Lagged Independent Component Analysis of Random Walks and Protein Dynamics. J. Chem. Theory Comput. 2021, 17, 5766–5776. [Google Scholar] [CrossRef] [PubMed]
- Amadei, A.; Linssen, A.B.M.; Berendsen, H.J.C. Essential dynamics of proteins. Proteins 1993, 17, 412–425. [Google Scholar] [CrossRef] [PubMed]
- Ichiye, T.; Karplus, M. Collective motions in proteins: A covariance analysis of atomic fluctuations in molecular dynamics and normal mode simulations. Proteins 1991, 11, 205–217. [Google Scholar] [CrossRef] [PubMed]
- Chen, J.; Zeng, Q.; Wang, W.; Sun, H.; Hu, G. Decoding the Identification Mechanism of an SAM-III Riboswitch on Ligands through Multiple Independent Gaussian-Accelerated Molecular Dynamics Simulations. J. Chem. Inf. Model. 2022, 62, 6118–6132. [Google Scholar] [CrossRef] [PubMed]
- Wu, S.L.; Wang, L.F.; Sun, H.B.; Wang, W.; Yu, Y.X. Probing molecular mechanism of inhibitor bindings to bromodomain-containing protein 4 based on molecular dynamics simulations and principal component analysis. SAR QSAR Environ. Res. 2020, 31, 547–570. [Google Scholar] [CrossRef] [PubMed]
- Bernetti, M.; Masetti, M.; Recanatini, M.; Amaro, R.E.; Cavalli, A. An Integrated Markov State Model and Path Metadynamics Approach To Characterize Drug Binding Processes. J. Chem. Theory Comput. 2019, 15, 5689–5702. [Google Scholar] [CrossRef] [PubMed]
- Meng, Y.; Shukla, D.; Pande, V.S.; Roux, B. Transition path theory analysis of c-Src kinase activation. Proc. Natl. Acad. Sci. USA 2016, 113, 9193–9198. [Google Scholar] [CrossRef] [PubMed]
- Vanden-Eijnden, E. Transition-Path Theory and Path-Finding Algorithms for the Study of Rare Events. Annu. Rev. Phys. Chem. 2010, 61, 391–420. [Google Scholar]
- Doerr, S.; Harvey, M.J.; Noé, F.; De Fabritiis, G. HTMD: High-Throughput Molecular Dynamics for Molecular Discovery. J. Chem. Theory. Comput. 2016, 12, 1845–1852. [Google Scholar] [CrossRef]
- Anandakrishnan, R.; Aguilar, B.; Onufriev, A.V. H++ 3.0: Automating pK prediction and the preparation of biomolecular structures for atomistic molecular modeling and simulations. Nucleic Acids Res. 2012, 40, W537–W541. [Google Scholar] [CrossRef] [PubMed]
- Case, D.A.; Cheatham, T.E., III; Darden, T.; Gohlke, H.; Luo, R.; Merz, K.M., Jr.; Onufriev, A.; Simmerling, C.; Wang, B.; Woods, R.J. The Amber biomolecular simulation programs. J. Comput. Chem. 2005, 26, 1668–1688. [Google Scholar] [CrossRef] [PubMed]
- Salomon-Ferrer, R.; Case, D.A.; Walker, R.C. An overview of the Amber biomolecular simulation package. WIREs Comput. Mol. Sci. 2013, 3, 198–210. [Google Scholar] [CrossRef]
- Tian, C.; Kasavajhala, K.; Belfon, K.A.A.; Raguette, L.; Huang, H.; Migues, A.N.; Bickel, J.; Wang, Y.; Pincay, J.; Wu, Q.; et al. ff19SB: Amino-Acid-Specific Protein Backbone Parameters Trained against Quantum Mechanics Energy Surfaces in Solution. J. Chem. Theory Comput. 2020, 16, 528–552. [Google Scholar] [CrossRef] [PubMed]
- Jakalian, A.; Jack, D.B.; Bayly, C.I. Fast, efficient generation of high-quality atomic charges. AM1-BCC model: II. Parameterization and validation. J. Comput. Chem. 2002, 23, 1623–1641. [Google Scholar] [CrossRef]
- Wang, J.; Wang, W.; Kollman, P.A.; Case, D.A. Automatic atom type and bond type perception in molecular mechanical calculations. J. Mol. Graph. Model. 2006, 25, 247–260. [Google Scholar] [CrossRef] [PubMed]
- Wang, J.; Wolf, R.M.; Caldwell, J.W.; Kollman, P.A.; Case, D.A. Development and testing of a general amber force field. J. Comput. Chem. 2004, 25, 1157–1174. [Google Scholar] [CrossRef] [PubMed]
- He, X.; Man, V.H.; Yang, W.; Lee, T.-S.; Wang, J. A fast and high-quality charge model for the next generation general AMBER force field. J. Chem. Phys. 2020, 153, 114502. [Google Scholar] [CrossRef] [PubMed]
- Jorgensen, W.L.; Chandrasekhar, J.; Madura, J.D.; Impey, R.W.; Klein, M.L. Comparison of simple potential functions for simulating liquid water. J. Chem. Phys. 1983, 79, 926–935. [Google Scholar] [CrossRef]
- Joung, I.S.; Cheatham, T.E., III. Determination of Alkali and Halide Monovalent Ion Parameters for Use in Explicitly Solvated Biomolecular Simulations. J. Phys. Chem. B 2008, 112, 9020–9041. [Google Scholar] [CrossRef]
- Joung, I.S.; Cheatham, T.E., III. Molecular Dynamics Simulations of the Dynamic and Energetic Properties of Alkali and Halide Ions Using Water-Model-Specific Ion Parameters. J. Phys. Chem. B 2009, 113, 13279–13290. [Google Scholar] [CrossRef]
- Essmann, U.; Perera, L.; Berkowitz, M.L.; Darden, T.; Lee, H.; Pedersen, L.G. A smooth particle mesh Ewald method. J. Chem. Phys. 1995, 103, 8577–8593. [Google Scholar] [CrossRef]
- Ryckaert, J.-P.; Ciccotti, G.; Berendsen, H.J.C. Numerical integration of the cartesian equations of motion of a system with constraints: Molecular dynamics of n-alkanes. J. Comput. Phys. 1977, 23, 327–341. [Google Scholar] [CrossRef]
- Izaguirre, J.A.; Catarello, D.P.; Wozniak, J.M.; Skeel, R.D. Langevin stabilization of molecular dynamics. J. Chem. Phys. 2001, 114, 2090–2098. [Google Scholar] [CrossRef]
- Salomon-Ferrer, R.; Götz, A.W.; Poole, D.; Le Grand, S.; Walker, R.C. Routine Microsecond Molecular Dynamics Simulations with AMBER on GPUs. 2. Explicit Solvent Particle Mesh Ewald. J. Chem. Theory Comput. 2013, 9, 3878–3888. [Google Scholar] [CrossRef] [PubMed]
- Götz, A.W.; Williamson, M.J.; Xu, D.; Poole, D.; Le Grand, S.; Walker, R.C. Routine Microsecond Molecular Dynamics Simulations with AMBER on GPUs. 1. Generalized Born. J. Chem. Theory Comput. 2012, 8, 1542–1555. [Google Scholar] [CrossRef] [PubMed]
- Roe, D.R.; Cheatham, T.E., III. PTRAJ and CPPTRAJ: Software for Processing and Analysis of Molecular Dynamics Trajectory Data. J. Chem. Theory Comput. 2013, 9, 3084–3095. [Google Scholar] [CrossRef] [PubMed]
- Humphrey, W.; Dalke, A.; Schulten, K. VMD: Visual molecular dynamics. J. Mol. Graph. 1996, 14, 33–38. [Google Scholar] [CrossRef] [PubMed]
- Pérez-Hernández, G.; Paul, F.; Giorgino, T.; De Fabritiis, G.; Noé, F. Identification of slow molecular order parameters for Markov model construction. J. Chem. Phys. 2013, 139, 015102. [Google Scholar] [CrossRef] [PubMed]
- Ikotun, A.M.; Ezugwu, A.E. Boosting k-means clustering with symbiotic organisms search for automatic clustering problems. PLoS ONE 2022, 17, e0272861. [Google Scholar] [CrossRef]
- Han, N.; Qiao, S.; Yuan, G.; Huang, P.; Liu, D.; Yue, K. A novel Chinese herbal medicine clustering algorithm via artificial bee colony optimization. Artif. Intell. Med. 2019, 101, 101760. [Google Scholar] [CrossRef]
- Prinz, J.-H.; Wu, H.; Sarich, M.; Keller, B.; Senne, M.; Held, M.; Chodera, J.D.; Schütte, C.; Noé, F. Markov models of molecular kinetics: Generation and validation. J. Chem. Phys. 2011, 134, 174105. [Google Scholar] [CrossRef] [PubMed]
- Bowman, G.R. An Introduction to Markov State Models and Their Application to Long Timescale Molecular Simulation; Bowman, G.R., Pande, V.S., Noé, F., Eds.; Springer: Dordrecht, The Netherlands, 2014; pp. 7–22. [Google Scholar]
- Noé, F.; Schütte, C.; Vanden-Eijnden, E.; Reich, L.; Weikl, T.R. Constructing the equilibrium ensemble of folding pathways from short off-equilibrium simulations. Proc. Natl. Acad. Sci. USA 2009, 106, 19011–19016. [Google Scholar] [CrossRef] [PubMed]
- Wang, J.; Morin, P.; Wang, W.; Kollman, P.A. Use of MM-PBSA in Reproducing the Binding Free Energies to HIV-1 RT of TIBO Derivatives and Predicting the Binding Mode to HIV-1 RT of Efavirenz by Docking and MM-PBSA. J. Am. Chem. Soc. 2001, 123, 5221–5230. [Google Scholar] [CrossRef] [PubMed]
- Sun, H.; Duan, L.; Chen, F.; Liu, H.; Wang, Z.; Pan, P.; Zhu, F.; Zhang, J.Z.H.; Hou, T. Assessing the performance of MM/PBSA and MM/GBSA methods. 7. Entropy effects on the performance of end-point binding free energy calculation approaches. Phys. Chem. Chem. Phys. 2018, 20, 14450–14460. [Google Scholar] [CrossRef]
- Onufriev, A.; Bashford, D.; Case, D.A. Exploring protein native states and large-scale conformational changes with a modified generalized born model. Proteins 2004, 55, 383–394. [Google Scholar] [CrossRef]
- Miller, B.R., III; McGee, T.D., Jr.; Swails, J.M.; Homeyer, N.; Gohlke, H.; Roitberg, A.E. MMPBSA.py: An Efficient Program for End-State Free Energy Calculations. J. Chem. Theory Comput. 2012, 8, 3314–3321. [Google Scholar] [CrossRef]
- Naïm, M.; Bhat, S.; Rankin, K.N.; Dennis, S.; Chowdhury, S.F.; Siddiqi, I.; Drabik, P.; Sulea, T.; Bayly, C.I.; Jakalian, A.; et al. Solvated Interaction Energy (SIE) for Scoring Protein-Ligand Binding Affinities. 1. Exploring the Parameter Space. J. Chem. Inf. Model. 2007, 47, 122–133. [Google Scholar] [CrossRef]
- Purisima, E.O. Fast summation boundary element method for calculating solvation free energies of macromolecules. J. Comput. Chem. 1998, 19, 1494–1504. [Google Scholar] [CrossRef]
- Purisima, E.O.; Nilar, S.H. A simple yet accurate boundary element method for continuum dielectric calculations. J. Comput. Chem. 1995, 16, 681–689. [Google Scholar] [CrossRef]
- Bhat, S.; Purisima, E.O. Molecular surface generation using a variable-radius solvent probe. Proteins 2006, 62, 244–261. [Google Scholar] [CrossRef]
- Perdih, A.; Bren, U.; Solmajer, T. Binding free energy calculations of N-sulphonyl-glutamic acid inhibitors of MurD ligase. J. Mol. Model. 2009, 15, 983–996. [Google Scholar] [CrossRef]
- Cui, Q.; Sulea, T.; Schrag, J.D.; Munger, C.; Hung, M.-N.; Naïm, M.; Cygler, M.; Purisima, E.O. Molecular Dynamics—Solvated Interaction Energy Studies of Protein–Protein Interactions: The MP1–p14 Scaffolding Complex. J. Mol. Biol. 2008, 379, 787–802. [Google Scholar] [CrossRef] [PubMed]


| Pathways | Path Flux (s−1) | Percentage of Total Coarse Flux (%) |
|---|---|---|
| SA → S1 → SB | 2.09 × 10⁻⁴ | 98.9 |
| SA → SB | 1.22 × 10⁻⁶ | 0.6 |
| SA → S1 → S2 → SB | 1.20 × 10⁻⁶ | 0.6 |
| Total | 2.11 × 10⁻⁴ | 100 |
| Complex | 82I-BRD9 | POJ-BRD9 | 82I (ALL-BRD9) | POJ (ALL-BRD9) | ||||
|---|---|---|---|---|---|---|---|---|
| Average | Std | Average | Std | Average | Std | Average | Std | |
| −10.96 | 6.42 | −21.51 | 17.71 | −9.27 | 7.60 | −22.60 | 16.56 | |
| −23.37 | 5.20 | −27.77 | 8.52 | −18.50 | 8.54 | −30.66 | 9.30 | |
| 17.59 | 5.46 | 30.09 | 16.44 | 15.06 | 7.63 | 32.76 | 14.66 | |
| −3.02 | 0.62 | −3.83 | 1.04 | −2.45 | 1.09 | −4.29 | 1.14 | |
| 6.63 | 5.94 | 8.58 | 17.08 | 5.79 | 7.62 | 10.16 | 15.61 | |
| 14.94 | 3.84 | 20.60 | 4.68 | 13.85 | 5.24 | 21.19 | 3.88 | |
| −4.83 | −2.42 | −1.31 | −3.59 | |||||
Disclaimer/Publisher’s Note: The statements, opinions and data contained in all publications are solely those of the individual author(s) and contributor(s) and not of MDPI and/or the editor(s). MDPI and/or the editor(s) disclaim responsibility for any injury to people or property resulting from any ideas, methods, instructions or products referred to in the content. |
© 2024 by the authors. Licensee MDPI, Basel, Switzerland. This article is an open access article distributed under the terms and conditions of the Creative Commons Attribution (CC BY) license (https://creativecommons.org/licenses/by/4.0/).
Share and Cite
Wang, B.; Wang, J.; Yang, W.; Zhao, L.; Wei, B.; Chen, J. Unveiling Allosteric Regulation and Binding Mechanism of BRD9 through Molecular Dynamics Simulations and Markov Modeling. Molecules 2024, 29, 3496. https://doi.org/10.3390/molecules29153496
Wang B, Wang J, Yang W, Zhao L, Wei B, Chen J. Unveiling Allosteric Regulation and Binding Mechanism of BRD9 through Molecular Dynamics Simulations and Markov Modeling. Molecules. 2024; 29(15):3496. https://doi.org/10.3390/molecules29153496
Chicago/Turabian StyleWang, Bin, Jian Wang, Wanchun Yang, Lu Zhao, Benzheng Wei, and Jianzhong Chen. 2024. "Unveiling Allosteric Regulation and Binding Mechanism of BRD9 through Molecular Dynamics Simulations and Markov Modeling" Molecules 29, no. 15: 3496. https://doi.org/10.3390/molecules29153496
APA StyleWang, B., Wang, J., Yang, W., Zhao, L., Wei, B., & Chen, J. (2024). Unveiling Allosteric Regulation and Binding Mechanism of BRD9 through Molecular Dynamics Simulations and Markov Modeling. Molecules, 29(15), 3496. https://doi.org/10.3390/molecules29153496