

Phenolic Profiles in Olive Leaves from Different Cultivars in Tuscany and Their Use as a Marker of Varietal and Geographical Origin on a Small Scale
 , , , and
Abstract
:1. Introduction
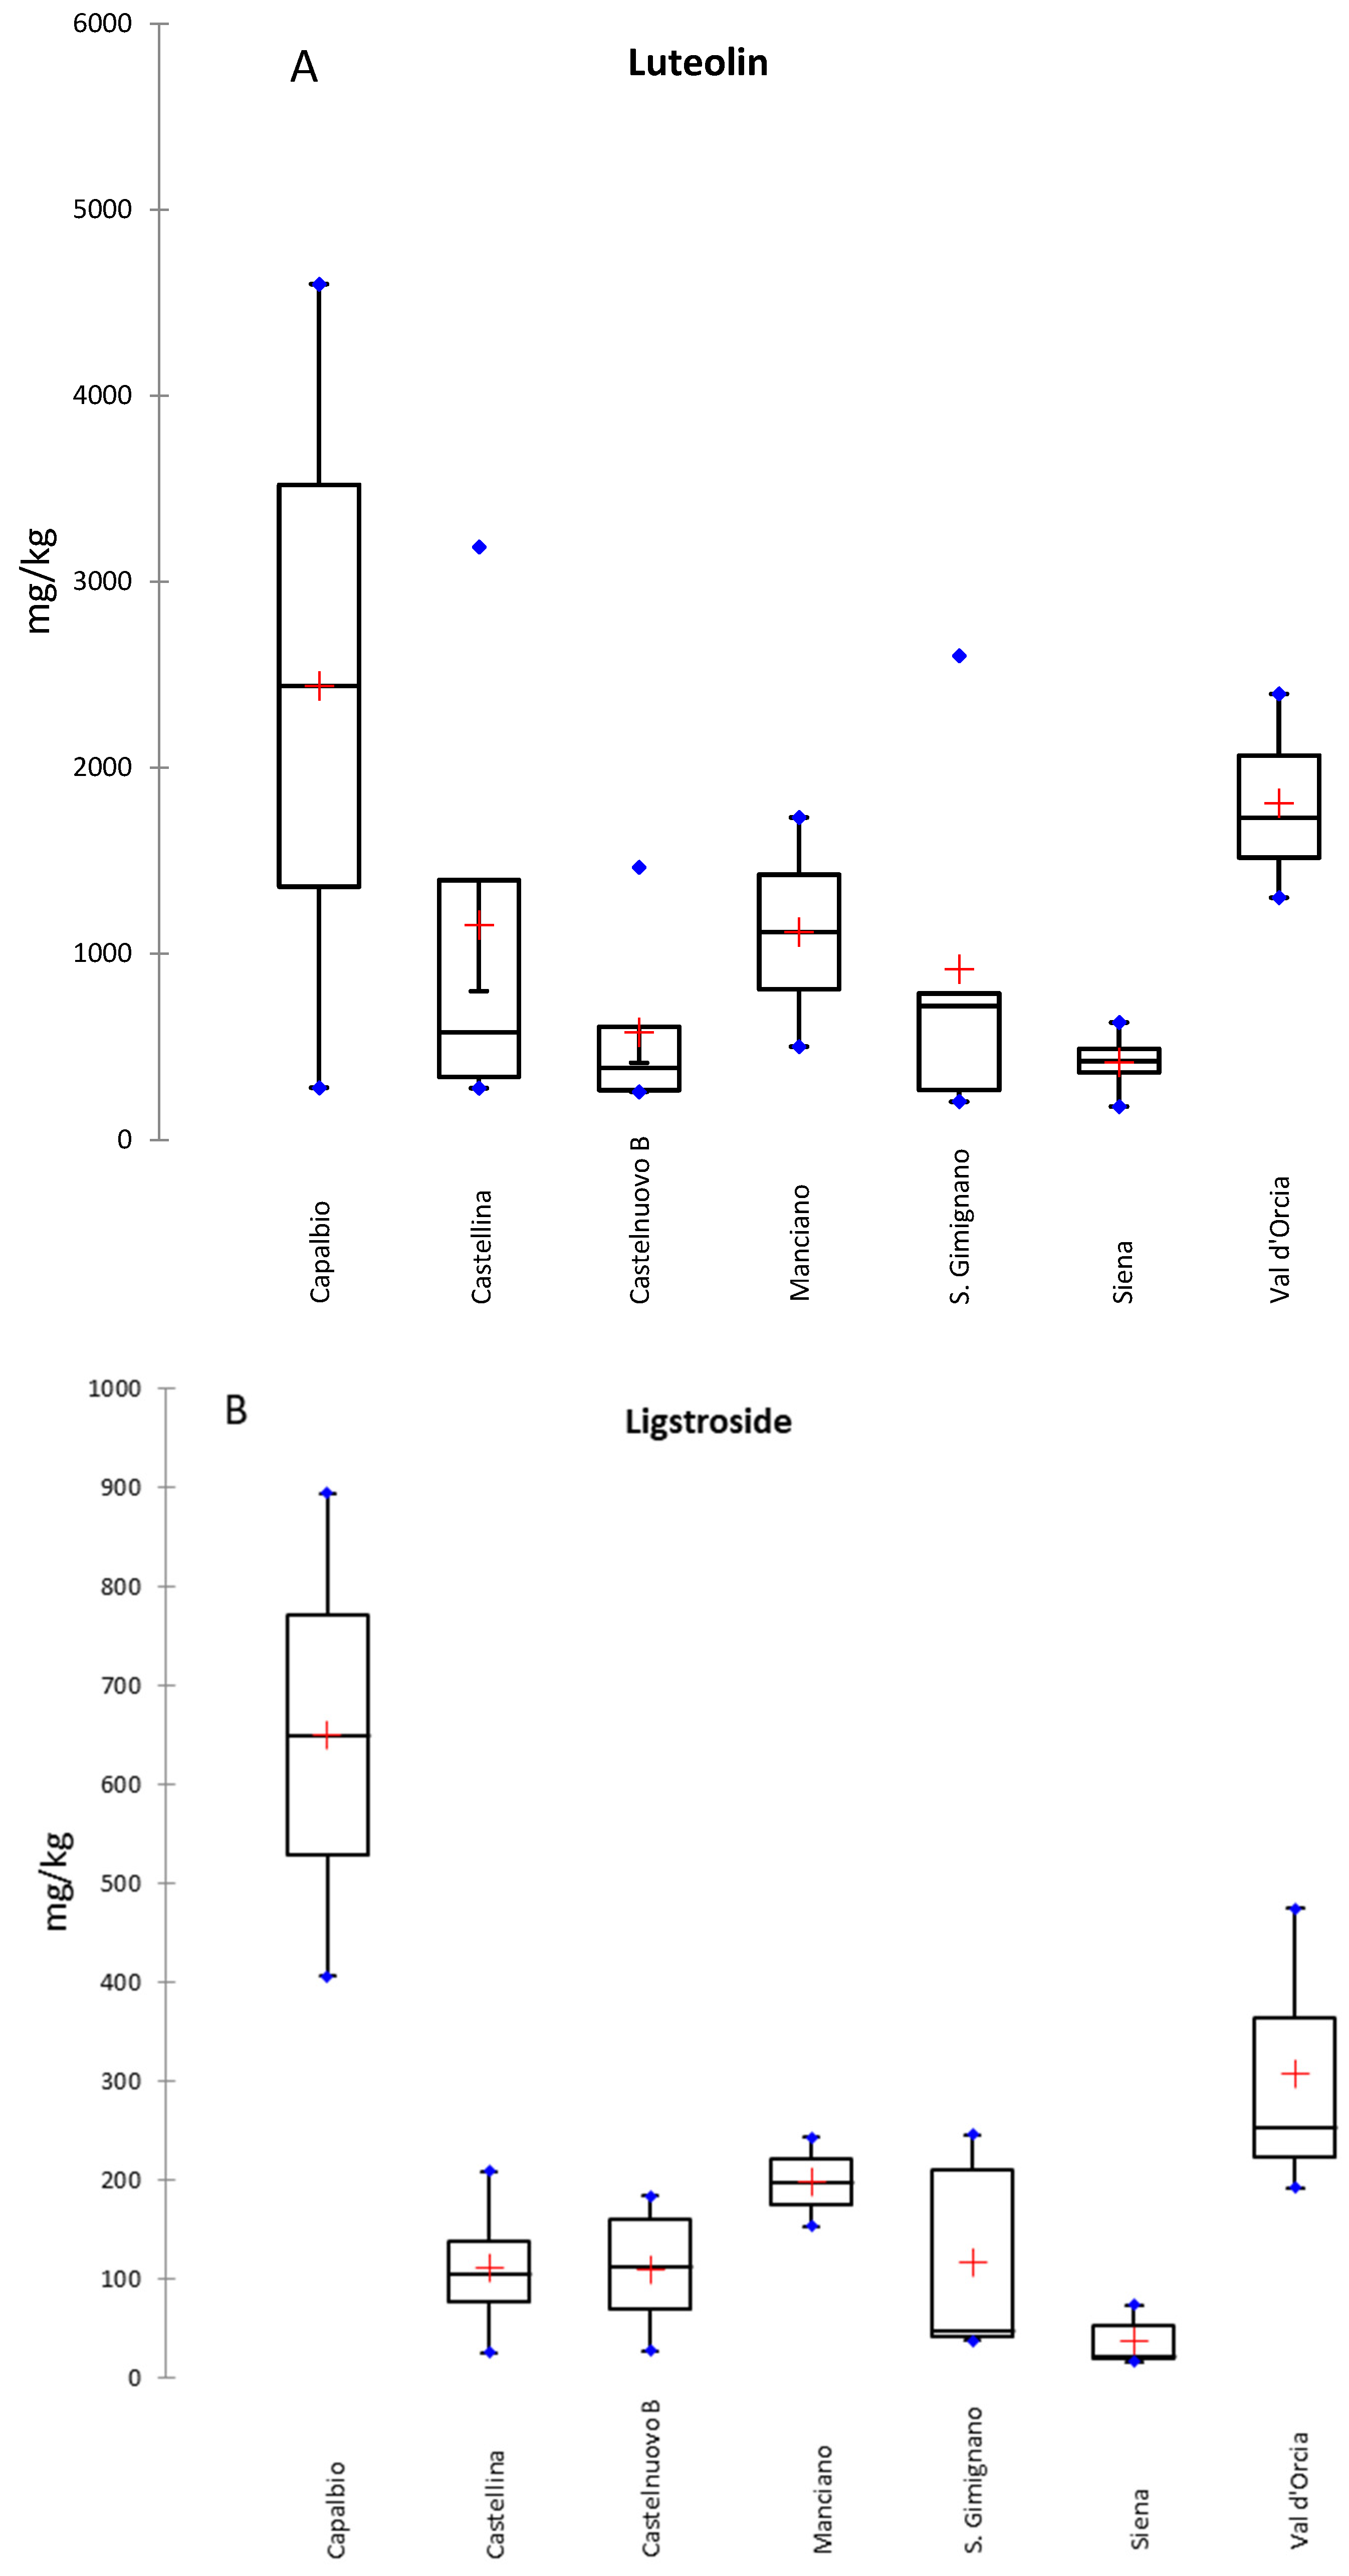
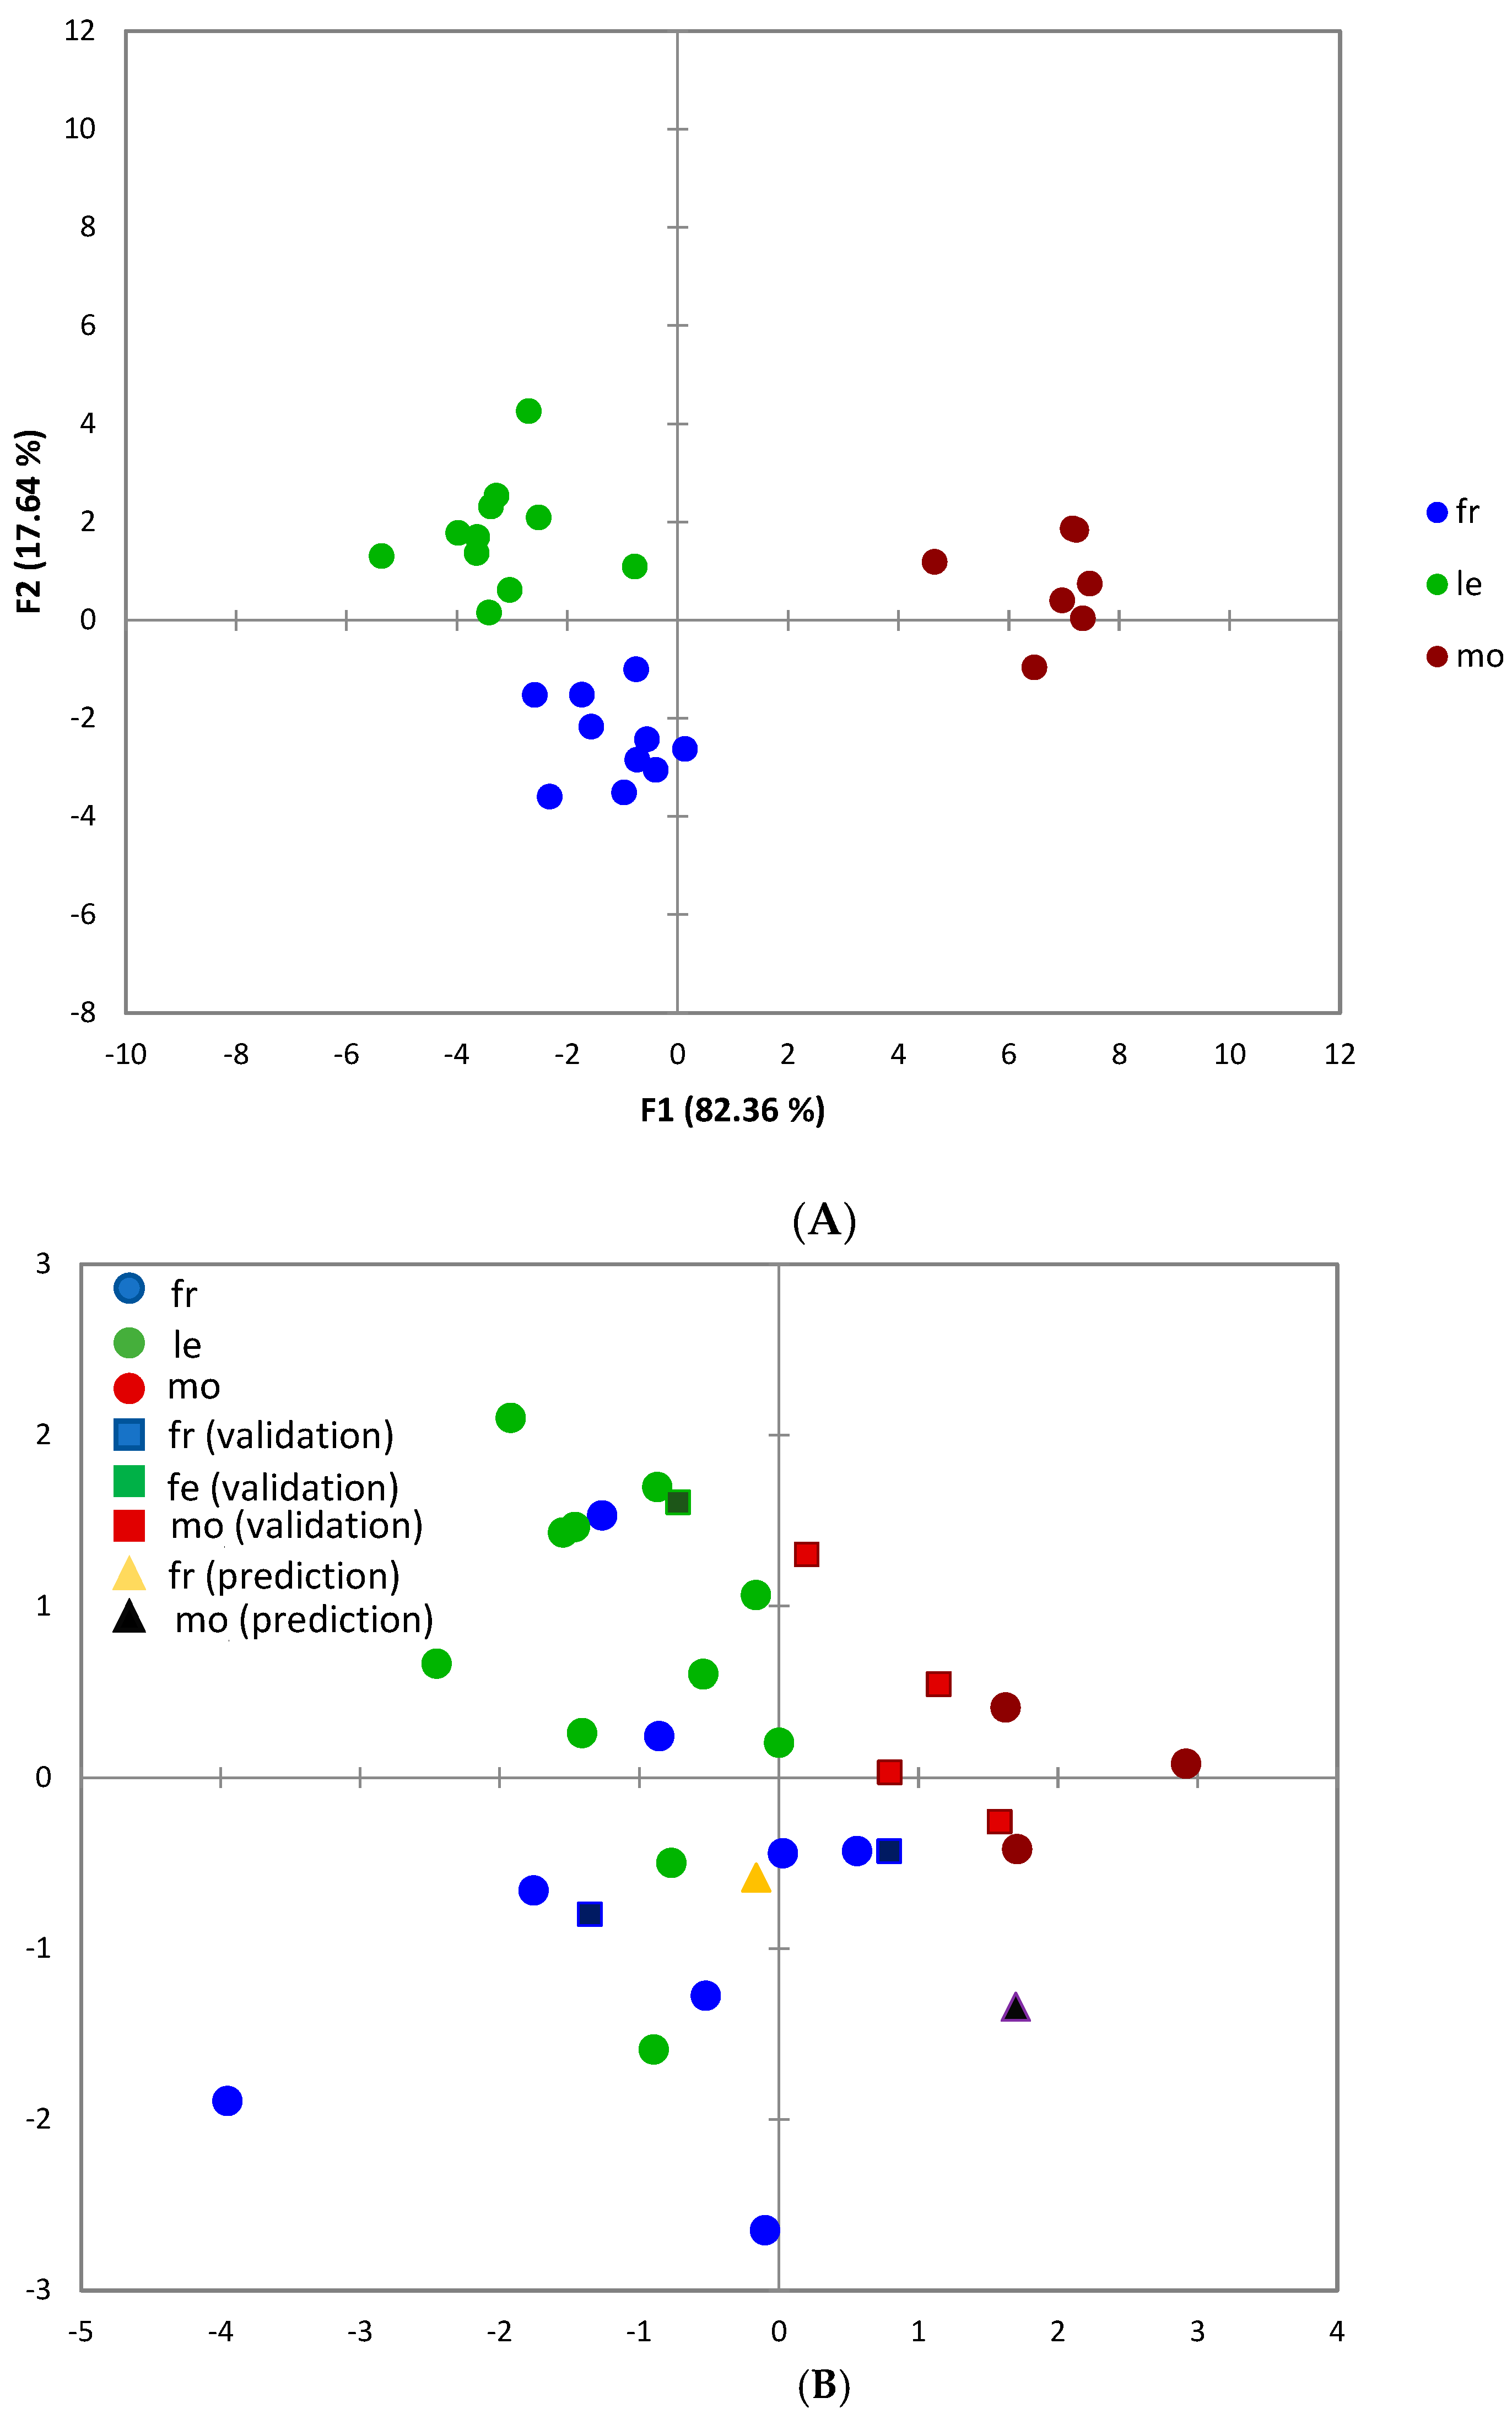
2. Results
3. Materials and Methods
3.1. Chemicals
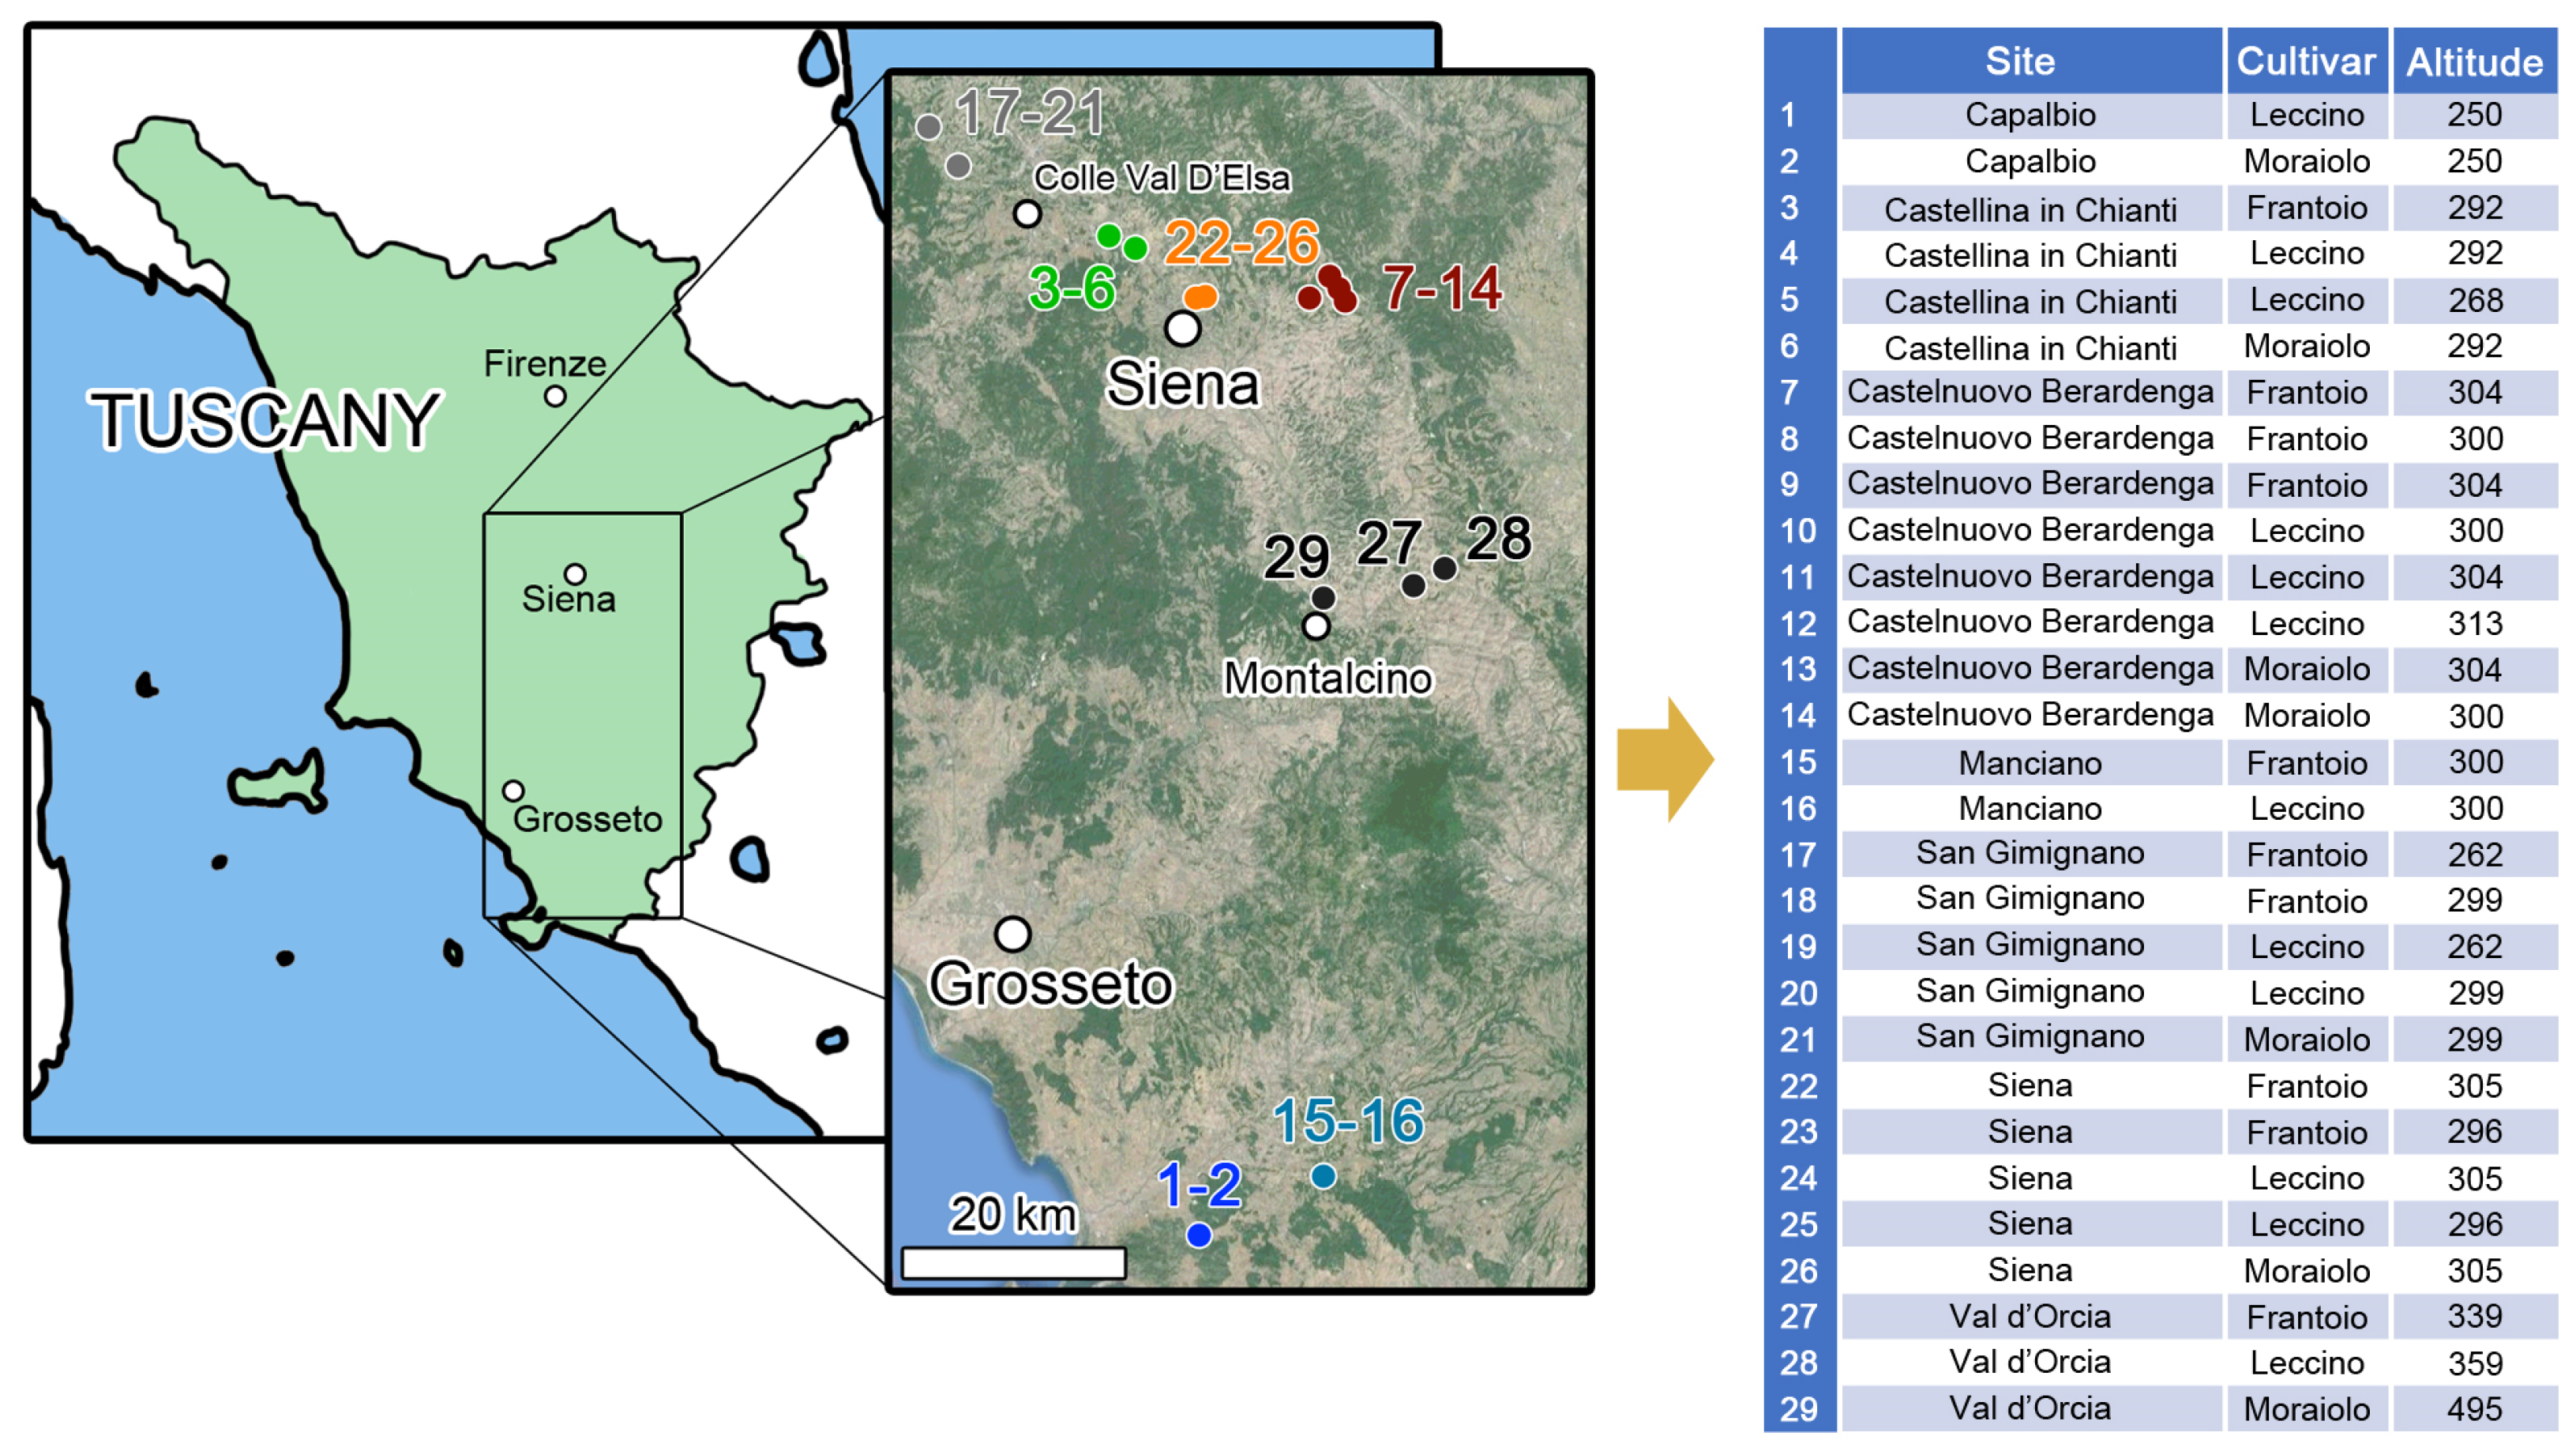
3.2. Samples and Extraction Protocol
3.3. Determination of Total Phenol Content (TPC)
3.4. HPLC-HRMS Analysis
3.5. Statistical Analysis
4. Conclusions
Author Contributions
Funding
Institutional Review Board Statement
Informed Consent Statement
Data Availability Statement
Acknowledgments
Conflicts of Interest
References
- Duque-Soto, C.; Quirantes-Piné, R.; Borrás-Linares, I.; Segura-Carretero, A.; Lozano-Sánchez, J. Characterization and Influence of Static In Vitro Digestion on Bioaccessibility of Bioactive Polyphenols from an Olive Leaf Extract. Foods 2022, 11, 743. [Google Scholar] [CrossRef] [PubMed]
- Omar, S.H.; Kerr, P.G.; Scott, C.J.; Hamlin, A.S.; Obied, H.K. Olive (Olea europaea L.) Biophenols: A Nutraceutical against Oxidative Stress in SH-SY5Y Cells. Molecules 2017, 22, 1858. [Google Scholar] [CrossRef] [PubMed]
- Ghalandari, M.; Naghmachi, M.; Oliverio, M.; Nardi, M.; Shirazi, H.R.G.; Eilami, O. Antimicrobial effect of hydroxytyrosol, hydroxytyrosol acetate and hydroxytyrosol oleate on staphylococcus aureus and staphylococcus epidermidis. Electron. J. Gen. Med. 2018, 15, 1–7. [Google Scholar] [CrossRef] [PubMed]
- Wei, J.; Wang, S.; Pei, D.; Qu, L.; Li, Y.; Chen, J.; Di, D.; Gao, K. Antibacterial Activity of Hydroxytyrosol Acetate from Olive Leaves (Olea europaea L.). Nat. Prod. Res. 2018, 32, 1967–1970. [Google Scholar] [CrossRef]
- Tamasi, G.; Baratto, M.C.; Bonechi, C.; Byelyakova, A.; Pardini, A.; Donati, A.; Leone, G.; Consumi, M.; Lamponi, S.; Magnani, A.; et al. Chemical characterization and antioxidant properties of products and by-products from Olea europaea L. Food Sci. Nut. 2019, 7, 2907–2920. [Google Scholar] [CrossRef] [PubMed]
- Romero-Márquez, J.M.; Navarro-Hortal, M.D.; Jiménez-Trigo, V.; Vera-Ramírez, L.; Forbes-Hernández, T.J.; Esteban-Muñoz, A.; Giampieri, F.; Bullón, P.; Battino, M.; Sánchez-González, C.; et al. An oleuropein rich-olive (Olea europaea L.) leaf extract reduces β-amyloid and tau proteotoxicity through regulation of oxidative- and heat shock-stress responses in Caenorhabditis elegans. Food Chem. Toxicol. 2022, 162, 112914. [Google Scholar] [CrossRef] [PubMed]
- Ronca, C.L.; Marques, S.S.; Ritieni, A.; Giménez-Martínez, R.; Barreiros, L.; Segundo, M.A. Olive Oil Waste as a Source of Functional Food Ingredients: Assessing Polyphenolic Content and Antioxidant Activity in Olive Leaves. Foods 2024, 13, 189. [Google Scholar] [CrossRef]
- Kermanshah, Z.; Samadanifard, H.; Moradi Moghaddam, O.; Hejrati, A. Olive Leaf and Its Various Health-Benefitting Effects: A Review Study. Pak. J. Med. Health Sci. 2020, 14, 1301–1312. [Google Scholar]
- Ronca, C.L.; Duque-Soto, C.; Samaniego-Sánchez, C.; Morales-Hernández, M.E.; Olalla-Herrera, M.; Lozano-Sánchez, J.; Giménez Martínez, R. Exploring the Nutritional and Bioactive Potential of Olive Leaf Residues: A Focus on Minerals and Polyphenols in the Context of Spain’s Olive Oil Production. Foods 2024, 13, 1036. [Google Scholar] [CrossRef]
- Selim, S.; Albqmi, M.; Al-Sanea, M.M.; Alnusaire, T.S.; Taghreed, S.A.; Almuhayawi, M.S.; AbdElgawad, H.; Al Jaouni, S.K.; Elkelish, A.; Hussein, S.; et al. Valorizing the usage of olive leaves, bioactive compounds, biological activities, and food applications: A comprehensive review. Front. Nutr. 2022, 9, 1–27. [Google Scholar] [CrossRef]
- Abbattista, R.; Ventura, G.; Calvano, C.D.; Cataldi, T.R.I.; Losito, I. Bioactive Compounds in Waste By-Products from Olive Oil Production: Applications and Structural Characterization by Mass Spectrometry Techniques. Foods 2021, 10, 1236. [Google Scholar] [CrossRef]
- Şahin, S.; Bilgin, M. Olive Tree (Olea europaea L.) Leaf as a Waste by-Product of Table Olive and Olive Oil Industry: A Review. J. Sci. Food Agric. 2018, 98, 1271–1279. [Google Scholar] [CrossRef]
- Markhali, F.S.; Teixeira, J.A.; Rocha, C.M.R. Olive Tree Leaves—A Source of Valuable Active Compounds. Processes 2020, 8, 1177. [Google Scholar] [CrossRef]
- Espeso, J.; Isaza, A.; Lee, J.Y.; Sörensen, P.M.; Jurado, P.; Avena-Bustillos, R.d.J.; Olaizola, M.; Arboleya, J.C. Olive Leaf Waste Management. Front. Sustain. Food Syst. 2021, 5, 660582. [Google Scholar] [CrossRef]
- Gullón, P.; Gullón, B.; Astray, G.; Carpena, M.; Fraga-Corral, M.; Prieto, M.A.; Simal-Gandara, J. Valorization of By-Products from Olive Oil Industry and Added-Value Applications for Innovative Functional Foods. Food Res. Int. 2020, 137, 109683. [Google Scholar] [CrossRef] [PubMed]
- Romero-García, J.; Niño, L.; Martínez-Patiño, C.; Álvarez, C.; Castro, E.; Negro, M. Biorefinery based on olive biomass. State of the art and future trends. Bioresour. Technol. 2014, 159, 421–432. [Google Scholar] [CrossRef] [PubMed]
- Difonzo, G.; Squeo, G.; Pasqualone, A.; Summo, C.; Paradiso, V.M.; Caponio, F. The challenge of exploiting polyphenols from olive leaves: Addition to foods to improve their shelf-life and nutritional value. J. Sci. Food Agric. 2020, 101, 3099–3116. [Google Scholar] [CrossRef]
- Cuffaro, D.; Bertini, S.; Macchia, M.; Digiacomo, M. Enhanced Nutraceutical Properties of Extra Virgin Olive Oil Extract by Olive Leaf Enrichment. Nutrients 2023, 15, 1073. [Google Scholar] [CrossRef] [PubMed]
- Markhali, F.S.; Teixeira, J.A. Comparative study of different particle sizes of added olive leaves for the content of target polyphenols in virgin olive oil. Sustain. Food Technol. 2023, 1, 896–905. [Google Scholar] [CrossRef]
- Kesente, M.; Kavetsou, E.; Roussaki, M.; Blidi, S.; Loupassaki, S.; Chanioti, S.; Siamandoura, P.; Stamatogianni, C.; Philippou, E.; Papaspyrides, C.; et al. Encapsulation of olive leaves extracts in biodegradable PLA Nanoparticles for use in cosmetic formulation. Bioengineering 2017, 4, 75. [Google Scholar] [CrossRef]
- Romani, A.; Mulas, S.; Heimler, D. Polyphenols and Secoiridoids in Raw Material (Olea europaea L. Leaves) and Commercial Food Supplements. Eur. Food Res. Technol. 2017, 243, 429–435. [Google Scholar] [CrossRef]
- Talhaoui, N.; Taamalli, A.; Gómez-Caravaca, A.M.; Fernández-Gutiérrez, A.; Segura-Carretero, A. Phenolic compounds in olive leaves: Analytical determination, biotic and abiotic influence, and health benefits. Food Res. Int. 2015, 77, 92–108. [Google Scholar] [CrossRef]
- Nicolì, F.; Negro, C.; Vergine, M.; Aprile, A.; Nutricati, E.; Sabella, E.; Miceli, A.; Luvisi, A.; De Bellis, L. Evaluation of Phytochemical and Antioxidant Properties of 15 Italian Olea europaea L. Cultivar Leaves. Molecules 2019, 24, 1998. [Google Scholar] [CrossRef] [PubMed]
- Feng, S.; Zhang, C.; Liu, L.; Xu, Z.; Chen, T.; Zhou, L.; Yuan, M.; Li, T.; Ding, C. Comparison of Phenolic Compounds in Olive Leaves by Different Drying and Storage Methods. Separations 2021, 8, 156. [Google Scholar] [CrossRef]
- Gucci, R.; Caruso, G.; Gennai, C.; Esposto, S.; Urbani, S.; Servili, M. Fruit Growth, Yield and Oil Quality Changes Induced by Deficit Irrigation at Different Stages of Olive Fruit Development. Agric. Water Manag. 2019, 212, 88–98. [Google Scholar] [CrossRef]
- Medina, G.; Sanz, C.; Leon, L.; Perez, A.G.; De la Rosa, R. Phenolic variability in fruit from the ‘Arbequina’ olive cultivar under Mediterranean and Subtropical climatic conditions. Grasas Aceites 2021, 72, e438. [Google Scholar] [CrossRef]
- Yılmaz-Düzyaman, H.; Medina-Alonso, M.G.; Sanz, C.; Pérez, A.G.; de la Rosa, R.; León, L. Influence of Genotype and Environment on Fruit Phenolic Composition of Olive. Horticulture 2023, 9, 1087. [Google Scholar] [CrossRef]
- García, J.M.; Hueso, A.; Gómez-del-Campo, M. Deficit irrigation during the oil synthesis period affects olive oil quality in high-density orchards (cv. Arbequina). Agric. Water Manag. 2020, 230, 105858. [Google Scholar] [CrossRef]
- Mansour-Gueddes, S.; Saidana-Naija, D.; Bchir, A.; Braham, M. Climate change effects on phytochemical compounds and antioxidant activity of Olea europaea L. Not. Bot. Horti Agrobot. 2020, 48, 436–455. [Google Scholar] [CrossRef]
- Bilgin, M.; Selin, S. Effects of geographical origin and extraction methods on total phenolic yield of olive tree (Olea europaea) leaves. J. Taiwan Inst. Chem. Eng. 2013, 44, 8–12. [Google Scholar] [CrossRef]
- Zakraoui, M.; Hannachi, H.; Pasković, I.; Vidović, N.; Pasković, M.P.; Palčić, I.; Major, N.; Ban, S.G.; Hamrouni, L. Effect of Geographical Location on the Phenolic and Mineral Composition of Chetoui Olive Leaves. Foods 2023, 12, 2565. [Google Scholar] [CrossRef]
- Taamalli, A.; Arráez Román, D.; Gómez Caravaca, A.M.; Zarrouk, M.; Segura Carretero, A. Geographical Characterization of Tunisian Olive Tree Leaves (cv. Chemlali) Using HPLC-ESI-TOF and IT/MS Fingerprinting with Hierarchical Cluster Analysis. J. Anal. Methods Chem. 2018, 2018, 6789704. [Google Scholar] [CrossRef]
- Giannakopoulou, E.; Mitsopoulos, G.; Hagidimitriou, M.; Papageorgiou, V.; Komaitis, M. Influence of cultivar, harvesting season and geographical origin on phenolic content in leaves of Greek olive cultivars. Acta Hortic. 2011, 924, 437–444. [Google Scholar] [CrossRef]
- Brahmi, F.; Mechri, B.; Dhibi, M.; Hammami, M. Variation in antioxidant activity and phenolic content in different organs of two Tunisian cultivars of Olea europaea L. Acta Physiol. Plant. 2013, 36, 169–178. [Google Scholar] [CrossRef]
- Rossouw, M.; Geldenhuys, G.G.; Marini, F.; Manley, M. Multivariate statistical visualization and modelling of GC–MS data for sensory quality prediction of flavoured cider as influenced by storage time and temperature. Microchem. J. 2023, 195, 109393. [Google Scholar] [CrossRef]
- Ingallina, C.; Cerreto, A.; Mannina, L.; Circi, S.; Vista, S.; Capitani, D.; Spano, M.; Sobolev, A.P.; Marini, F. Extra-virgin olive oils from nine Italian regions: An 1H NMR-chemometric characterization. Metabolites 2019, 9, 65. [Google Scholar] [CrossRef]
- Croce, R.; Malegori, C.; Oliveri, P.; Medici, I.; Cavaglioni, A.; Rossi, C. Prediction of quality parameters in straw wine by means of FT-IR spectroscopy combined with multivariate data processing. Food Chem. 2020, 305, 125512. [Google Scholar] [CrossRef]
- Tamasi, G.; Pardini, A.; Croce, R.; Consumi, M.; Leone, G.; Bonechi, C.; Rossi, C.; Magnani, A. Combined experimental and multivariate model approaches for glycoalkaloid quantification in tomatoes. Molecules 2021, 26, 3068. [Google Scholar] [CrossRef] [PubMed]
- Tamasi, G.; Bonechi, C.; Leone, G.; Andreassi, M.; Consumi, M.; Sangiorgio, P.; Verardi, A.; Rossi, C.; Magnani, A. Varietal and geographical origin characterization of peaches and nectarines by combining analytical techniques and statistical approach. Molecules 2021, 26, 4128. [Google Scholar] [CrossRef] [PubMed]
- Orak, H.H.; Karamać, M.; Amarowicz, R.; Orak, A.; Penkacik, K. Genotype-Related Differences in the Phenolic Compound Profile and Antioxidant Activity of Extracts from Olive (Olea europaea L.) Leaves. Molecules 2019, 24, 1130. [Google Scholar] [CrossRef]
- Martínez-Navarro, M.E.; Cebrián-Tarancón, C.; Alonso, G.L.; Salinas, M.R. Determination of the Variability of Bioactive Compounds and Minerals in Olive Leaf along an Agronomic Cycle. Agronomy 2021, 11, 2447. [Google Scholar] [CrossRef]
- Lukić, I.; Pasković, I.; Žurga, P.; Germek, V.M.; Brkljača, M.; Marcelić, Š.; Ban, D.; Grozić, K.; Lukić, M.; Užila, Z.; et al. Determination of the Variability of Biophenols and Mineral Nutrients in Olive Leaves with Respect to Cultivar, Collection Period and Geographical Location for Their Targeted and Well-Timed Exploitation. Plants 2020, 9, 1667. [Google Scholar] [CrossRef]
- Kabbash, E.M.; Abdel-Shakour, Z.T.; El-Ahmady, S.H.; Wink, M.; Ayoub, I.M. Comparative metabolic profiling of olive leaf extracts from twelve different cultivars collected in both fruiting and flowering seasons. Sci. Rep. 2023, 13, 612. [Google Scholar] [CrossRef]
- Japón-Lujan, R.; Ruiz-Jiménez, J.; de Castro, M.D.L. Discrimination and classification of olive tree varieties and cultivation zones by biophenol contents. J. Agric. Food Chem. 2006, 54, 9706–9712. [Google Scholar] [CrossRef]
- Ranalli, A.; Contento, S.; Lucera, L.; Di Febo, M.; Marchegiani, D.; Di Fonzo, V. Factors affecting the contents of iridoid oleuropein in olive leaves (Olea europaea L.). J. Agric. Food Chem. 2006, 54, 434–440. [Google Scholar] [CrossRef] [PubMed]
- Talhaoui, N.; Gomez-Caravaca, A.M.; Leon, L.; De la Rosa, R.; Segura-Carretero, A.; Fernandez-Gutierrez, A. Determination of phenolic compounds of ’Sikitita’ olive leaves by HPLC-DAD-TOF-MS. Comparison with its parents ’Arbequina’ and ’Picual’ olive leaves. LWT Food Sci. Technol. 2014, 58, 28–34. [Google Scholar] [CrossRef]
- Romero, C.; Medina, E.; Mateo, M.A.; Brenes, M. Quantification of bioactive compounds in Picual and Arbequina olive leaves and fruit. J. Sci. Food Agric. 2017, 97, 1725–1732. [Google Scholar] [CrossRef] [PubMed]
- Blasi, F.; Urbani, E.; Simonetti, M.A.; Chiesi, C.; Cossignani, L. Seasonal variations in antioxidant compounds of Olea europea leaves collected from different Italian cultivars. J. Appl. Bot. Food Qual. 2016, 89, 202–207. [Google Scholar] [CrossRef]
- Kontogianni, V.G.; Gerothanassis, I.P. Phenolic compounds and antioxidant activity of olive leaf extracts. Nat. Prod. Res. 2012, 26, 186–189. [Google Scholar] [CrossRef] [PubMed]
- Pasković, M.P.; Vidović, N.; Lukić, I.; Žurga, P.; Germek, V.M.; Ban, S.G.; Kos, T.; Čoga, L.; Tomljanović, T.; Simonić-Kocijan, S.; et al. Phenolic Potential of Olive Leaves from Different Istrian Cultivars in Croatia. Horticulturae 2023, 9, 594. [Google Scholar] [CrossRef]
- Martìn-Vertedor, D.; Garrido, M.; Pariente, J.A.; Espino, J.; Delgado-Adàmez, J. Bioavailability of bioactive molecules from olive leaf extracts and its functional value. Phytother. Res. 2016, 30, 1172–1179. [Google Scholar] [CrossRef]
- Hernández-Fernández, A.; Garrido, Y.; Iniesta-López, E.; Pérez de los Ríos, A.; Quesada-Medina, J.; Hernández-Fernández, F.J. Recovering Polyphenols in Aqueous Solutions from Olive Mill Wastewater and Olive Leaf for Biological Applications. Processes 2023, 11, 2668. [Google Scholar] [CrossRef]
- Cantini, C.; Cimato, A.; Autino, A.; Redi, A.; Cresti, M. Assessment of the Tuscan olive germplasm by microsatellite markers reveals genetic identities and different discrimination capacity among and within cultivars. J. Am. Soc. Hortic. Sci. 2008, 133, 598–604. [Google Scholar] [CrossRef]
- Amarowicz, R.; Karamac, M.; Weidner, S.; Abe, S.; Shahidi, F. Antioxidant activity of wheat caryopses and embryos extracts. J. Food Lipids 2002, 9, 201–210. [Google Scholar] [CrossRef]


| Site | cv | Hydroxytyrosol | Hydroxytyrosol acetate | Hydroxytyrosol glucoside | Luteolin | Luteolin-7-O-glucoside | Apigenin | Rutin | TPC |
|---|---|---|---|---|---|---|---|---|---|
| Capalbio | Mo | 1.5 ± 0.1 | 36.7 ± 2.5 | 2.2 ± 0.2 | 0.28 ± 0.02 | 1.6 ± 0.1 | 0.53 ± 0.04 | 0.46 ± 0.04 | 37.5 ± 2.5 |
| Capalbio | Le | 2.6 ± 0.1 | 49.8 ± 3.2 | 14.5 ± 0.8 | 4.6 ± 0.3 | 4.3 ± 0.3 | 7.95 ± 0.75 | 0.56 ± 0.09 | 42.6 ± 3.2 |
| Castellina | Mo | 0.56 ± 0.08 | 37.1 ± 3.1 | 0.16 ± 0.013 | 3.2 ± 0.2 | 2.2 ± 0.2 | 0.97 ± 0.09 | 0.31 ± 0.02 | 42.1 ± 3.9 |
| Castellina | Le | 1.8 ± 0.1 | 5.1 ± 0.2 | 11.0 ± 0.6 | 0.28 ± 0.02 | 6.3 ± 0.6 | 0.45 ± 0.09 | 0.65 ± 0.05 | 44.2 ± 2.9 |
| Castellina | Le | 0.61 ± 0.05 | 16.6 ± 1.2 | 3. 7 ± 0.2 | 0.80 ± 0.05 | 5.6 ± 0.5 | 0.67 ± 0.07 | 0.47 ± 0.04 | 49.7 ± 3.6 |
| Castellina | Fr | 0.79 ± 0.05 | 10.5 ± 0.6 | 5.8 ± 0.3 | 0.36 ± 0.02 | 6.3 ± 0.9 | 0.53 ± 0.08 | 0.45 ± 0.04 | 41.8 ± 3.3 |
| Castelnuovo B. | Le | 3.0 ± 0.1 | 5.1 ± 0.2 | 24.7 ± 1.6 | 0.27 ± 0.02 | 7.2 ± 0.7 | 0.40 ± 0.08 | 0.98 ± 0.15 | 60.2 ± 5.2 |
| Castelnuovo B. | Fr | 0.44 ± 0.08 | 35.2 ± 1.6 | 3.2 ± 0.2 | 1.19 ± 0.07 | 4.1 ± 0.4 | 0.55 ± 0.09 | 0.49 ± 0.09 | 40.6 ± 3.8 |
| Castelnuovo B. | Le | 1.8 ± 0.1 | 39.5 ± 2.8 | 18.2 ± 0.9 | 1.47 ± 0.08 | 6.6 ± 0.7 | 3.32 ± 0.41 | 0.77 ± 0.14 | 60.5 ± 4.6 |
| Castelnuovo B. | Mo | 0.69 ± 0.08 | 14.3 ± 0.8 | 7.8 ± 0.5 | 0.26 ± 0.02 | 4.4 ± 0.3 | 0.08 ± 0.01 | 0.52 ± 0.10 | 58.8 ± 4.6 |
| Castelnuovo B. | Fr | 1.6 ± 0.1 | 8.3 ± 0.6 | 12.4 ± 0.7 | 0.26 ± 0.02 | 6.7 ± 0.5 | 0.14 ± 0.03 | 0.47 ± 0.08 | 57.3 ± 4.9 |
| Castelnuovo B. | Le | 3.1 ± 0.1 | 25.8 ± 1.8 | 22.7 ± 0.7 | 0.40 ± 0.03 | 8.2 ± 0.8 | 1.48 ± 0.21 | 0.88 ± 0.11 | 55.8 ± 3.9 |
| Castelnuovo B. | Mo | 1.1 ± 0.1 | 13.9 ± 1.1 | 10.9 ± 0.7 | 0.41 ± 0.03 | 5.6 ± 0.5 | 0.13 ± 0.03 | 0.67 ± 0.09 | 53.2 ± 4.2 |
| Castelnuovo B. | Fr | 1.9 ± 0.1 | 11.6 ± 0.9 | 14.8 ± 0.9 | 0.38 ± 0.02 | 11.9 ± 0.8 | 0.19 ± 0.03 | 0.88 ± 0.11 | 55.1 ± 4.3 |
| Manciano | Fr | 0.68 ± 0.08 | 49.6 ± 2.6 | 5.9 ± 0.3 | 1.73 ± 0.12 | 7.7 ± 0.7 | 0.74 ± 0.09 | 0.49 ± 0.09 | 52.5 ± 3.8 |
| Manciano | Le | 1.32 ± 0.05 | 10.0 ± 0.7 | 12.1 ± 0.9 | 0.50 ± 0.03 | 3.4 ± 0.3 | 0.81 ± 0.09 | 0.55 ± 0.11 | 46.2 ± 3.6 |
| San Gimignano | Mo | 1.75 ± 0.05 | 22.8 ± 1.0 | 14.4 ± 1.0 | 0.72 ± 0.06 | 8.8 ± 0.8 | 0.17 ± 0.03 | 1.18 ± 0.12 | 66.3 ± 5.2 |
| San Gimignano | Fr | 0.93 ± 0.06 | 6.6 ± 0.4 | 6.9 ± 0.3 | 0.21 ± 0.02 | 6.0 ± 0.6 | 0.12 ± 0.02 | 0.68 ± 0.11 | 58.3 ± 2.9 |
| San Gimignano | Fr | 1.7 ± 0.1 | 80.6 ± 5.6 | 8.9 ± 0.6 | 2.60 ± 0.22 | 5.0 ± 0.4 | 3.85 ± 0.35 | 1.47 ± 0.14 | 72.4 ± 4.1 |
| San Gimignano | Le | 1.4 ± 0.1 | 33.6 ± 2.3 | 18.6 ± 1.2 | 0.79 ± 0.06 | 9.5 ± 0.9 | 3.69 ± 0.55 | 0.78 ± 0.12 | 57.6 ± 3.9 |
| San Gimignano | Le | 1.3 ± 0.1 | 7.3 ± 0.4 | 12.6 ± 0.8 | 0.27 ± 0.02 | 5.3 ± 0.5 | 0.30 ± 0.06 | 0.61 ± 0.11 | 42.5 ± 2.9 |
| Siena | Mo | 2.7 ± 0.1 | 10.1 ± 0.6 | 26.6 ± 1.3 | 0.49 ± 0.04 | 5.8 ± 0. 5 | 0.41 ± 0.08 | 0.83 ± 0.11 | 54.8 ± 3.2 |
| Siena | Fr | 0.79 ± 0.05 | 6.2 ± 0.4 | 4.5 ± 0.2 | 0.63 ± 0.05 | 7.2 ± 0.6 | 1.33 ± 0.24 | 0.71 ± 0.12 | 35.7 ± 1.9 |
| Siena | Le | 1.07 ± 0.06 | 13.1 ± 0.7 | 6.5 ± 0.4 | 0.42 ± 0.05 | 6.4 ± 0.6 | 0.24 ± 0.02 | 0.44 ± 0.09 | 51.6 ± 2.6 |
| Siena | Le | 2.0 ± 0.1 | 18. 6 ± 1.0 | 17.7 ± 1.0 | 0.36 ± 0.04 | 5.2 ± 0.5 | 0.24 ± 0.01 | 0.70 ± 0.11 | 59.5 ± 4.1 |
| Siena | Fr | 3.8 ± 0.2 | 3.7 ± 0.3 | 21.3 ± 1.3 | 0.18 ± 0.02 | 3.2 ± 0.3 | 0.25 ± 0.02 | 0.53 ± 0.08 | 41.8 ± 3.6 |
| Val d’Orcia | Le | 1.8 ± 0.1 | 25.5 ± 1.8 | 17.7 ± 1.0 | 2.40 ± 0.21 | 6.4 ± 0.5 | 3.76 ± 0.33 | 0.56 ± 0.09 | 51.8 ± 3.2 |
| Val d’Orcia | Fr | 0.74 ± 0.09 | 72.3 ± 5.2 | 5.8 ± 0.5 | 1.30 ± 0.11 | 7.7 ± 0.5 | 0.88 ± 0.15 | 0.63 ± 0.09 | 56.8 ± 2.9 |
| Val d’Orcia | Mo | 0.97 ± 0.05 | 78.2 ± 5.4 | 0.29 ± 0.05 | 1.73 ± 0.11 | 0.17 ± 0.02 | 0.70 ± 0.12 | 0.26 ± 0.05 | 37.3 ± 1.5 |
| Site | Cultivar | OLE | OLE agly | OLC | LIGS | LIGS agly | Olacein | Oleoside |
|---|---|---|---|---|---|---|---|---|
| Capalbio | Mo | 12.0 ± 0.9 | 5.7 ± 0.5 | 0.47 ± 0.05 | 3.5 ± 0.3 | 0.89 ± 0.05 | 40.0 ± 2.8 | 4.3 ± 0.4 |
| Capalbio | Le | 14. 9 ± 1.5 | 5.5 ± 0.8 | 0.85 ± 0.13 | 3.1 ± 0.3 | 0.41 ± 0.08 | 54.1 ± 3.8 | 2.2 ± 0.3 |
| Castellina | Mo | 6. 8 ± 0.7 | 3.8 ± 0.5 | 0.80 ± 0.09 | 3.1 ± 0.3 | 0.21 ± 0.04 | 40.6 ± 3.2 | 2.4 ± 0.4 |
| Castellina | Le | 15.3 ± 1.2 | 7.2 ± 0.8 | 0.09 ± 0.02 | 4.3 ± 0.5 | 0.02 ± 0.003 | 9.7 ± 0.9 | 8.2 ± 1.1 |
| Castellina | Lle | 24.0 ± 1.8 | 3.4 ± 0.6 | 0.33 ± 0.05 | 8.2 ± 0.8 | 0.11 ± 0.02 | 18.5 ± 1.6 | 7. 4 ± 0.8 |
| Castellina | Fr | 26.2 ± 2.2 | 2.6 ± 0.4 | 0.25 ± 0.05 | 6.8 ± 1.0 | 0.09 ± 0.02 | 11.4 ± 1.5 | 3.7 ± 0.6 |
| Castelnuovo B. | Le | 35.6 ± 2.9 | 2.5 ± 0.3 | 0.43 ± 0.06 | 9.0 ± 0.8 | 0.05 ± 0.01 | 9.2 ± 1.2 | 9.3 ± 1.2 |
| Castelnuovo B. | Fr | 15.1 ± 1.8 | 3.3 ± 0.4 | 1.07 ± 0.15 | 4.4 ± 0.5 | 0.13 ± 0.02 | 38.9 ± 2.9 | 3.6 ± 0.7 |
| Castelnuovo B. | Le | 23.0 ± 3.2 | 7.5 ± 1.1 | 0.85 ± 0.11 | 7.3 ± 0.8 | 0.18 ± 0.03 | 43.6 ± 4.2 | 5.5 ± 0.7 |
| Castelnuovo B. | Mo | 38.5 ± 2.5 | 4.6 ± 0.7 | 0.45 ± 0.06 | 6.7 ± 1.0 | 0.16 ± 0.03 | 15.9 ± 2.1 | 11.1 ± 1.6 |
| Castelnuovo B. | Fr | 44.2 ± 3.9 | 2.6 ± 0.3 | 0.32 ± 0.06 | 10.7 ± 1. | 0.09 ± 0.02 | 9.4 ± 1.1 | 7.7 ± 1.0 |
| Castelnuovo B. | Le | 12.6 ± 0.9 | 9.7 ± 1.1 | 0.50 ± 0.07 | 3.4 ± 0.5 | 0.16 ± 0.03 | 27.5 ± 1.9 | 3.3 ± 0.4 |
| Castelnuovo B. | Mo | 44.4 ± 3.9 | 4.9 ± 0.7 | 0.58 ± 0.08 | 8.9 ± 0.9 | 0.08 ± 0.01 | 15.0 ± 1.5 | 15.3 ± 2.1 |
| Castelnuovo B. | Fr | 36.8 ± 3.3 | 3.7 ± 0.6 | 0.45 ± 0.06 | 8.1 ± 1.1 | 0.03 ± 0.01 | 13.0 ± 1.8 | 6.6 ± 1.0 |
| Manciano | Fr | 18.9 ± 1.7 | 6.8 ± 1.0 | 0.78 ± 0.09 | 6.2 ± 0.9 | 0.24 ± 0.04 | 54.2 ± 4.8 | 2.2 ± 0.4 |
| Manciano | Le | 28.8 ± 2.1 | 2.9 ± 0.5 | 0.22 ± 0.04 | 7.9 ± 1.1 | 0.15 ± 0.03 | 11.0 ± 1.1 | 5.5 ± 0.8 |
| San Gimignano | Mo | 23.4 ± 2.4 | 6.2 ± 0.9 | 0.60 ± 0.09 | 5.7 ± 0.8 | 0.21 ± 0.04 | 25.5 ± 1.9 | 4.3 ± 0.5 |
| San Gimignano | Fr | 42.6 ± 3.8 | 3.4 ± 0.6 | 0.29 ± 0.05 | 11.8 ± 1.5 | 0.04 ± 0.01 | 8.0 ± 1.0 | 11.7 ± 1.1 |
| San Gimignano | Fr | 4.7 ± 0.7 | 9.4 ± 1.1 | 1.90 ± 0.25 | 1.7 ± 0.3 | 0.25 ± 0.04 | 86.8 ± 7.9 | 0.6 ± 0.1 |
| San Gimignano | Le | 34.2 ± 2.9 | 4.6 ± 0.6 | 2.48 ± 0.33 | 11.0 ± 1.3 | 0.04 ± 0.01 | 37.8 ± 5.2 | 8.2 ± 1.2 |
| San Gimignano | Le | 31.5 ± 2.8 | 5.4 ± 0.7 | 0.13 ± 0.03 | 7.7 ± 1.1 | 0.05 ± 0.01 | 8.2 ± 1.1 | 7.3 ± 1.0 |
| Siena | Mo | 36.1 ± 2.8 | 2.2 ± 0.4 | 0.78 ± 0.11 | 10.1 ± 1.2 | 0.02 ± 0.004 | 10.8 ± 1.3 | 4.3 ± 0.6 |
| Siena | Fr | 7.4 ± 1.1 | 1.7 ± 0.2 | 0.53 ± 0.08 | 3.8 ± 0.6 | 0.02 ± 0.004 | 7.8 ± 1.2 | 2.6 ± 0.4 |
| Siena | Le | 26.5 ± 1.9 | 3.1 ± 0.6 | 0.52 ± 0.07 | 9.2 ± 1.1 | 0.07 ± 0.01 | 14.8 ± 0.9 | 7.6 ± 1.1 |
| Siena | Le | 34.9 ± 2.5 | 3.2 ± 0.5 | 0.86 ± 0.12 | 10.5 ± 1.2 | 0.05 ± 0.01 | 20.5 ± 1.9 | 5.9 ± 0.8 |
| Siena | Fr | 16.0 ± 1.5 | 2.4 ± 0.4 | 0.05 ± 0.01 | 4.1 ± 0.6 | 0.02 ± 0.004 | 5.7 ± 0.8 | 3.7 ± 0.7 |
| Val d’Orcia | Le | 38.0 ± 2.8 | 3.7 ± 0.7 | 0.57 ± 0.09 | 7.6 ± 1.0 | 0.19 ± 0.03 | 27.9 ± 3.5 | 20.7 ± 2.8 |
| Val d’Orcia | Fr | 28.6 ± 2.5 | 7.4 ± 1.0 | 0.93 ± 0.11 | 8.9 ± 1.3 | 0.25 ± 0.05 | 78.1 ± 6.6 | 4.8 ± 0.7 |
| Val d’ Orcia | Mo | 7.5 ± 1.1 | 3. 7 ± 0.5 | 0.79 ± 0.11 | 1.6 ± 0.3 | 0.47 ± 0.07 | 85.9 ± 7.2 | 2.4 ± 0.4 |
| Site | Cultivar | Nuzheide | Secologanoside | Caffeoyl- secologanoside | Coumaroyl- secologanoside |
|---|---|---|---|---|---|
| Capalbio | Mo | 0.08 ± 0.01 | 0.08 ± 0.01 | 0.05 ± 0.01 | 10.8 ± 1.4 |
| Capalbio | Le | 0.05 ± 0.01 | 0.10 ± 0.01 | 0.05 ± 0.01 | 0.05 ± 0.01 |
| Castellina | Mo | 0.07 ± 0.01 | 0.14 ± 0.02 | 0.04 ± 0.01 | 0.05 ± 0.01 |
| Castellina | Le | 0.05 ± 0.01 | 0.57 ± 0.09 | 0.05 ± 0.01 | 0.05 ± 0.01 |
| Castellina | Le | 0.06 ± 0.01 | 0.31 ± 0.05 | 7.7 ± 1.1 | 21.7 ± 2.4 |
| Castellina | Fr | 0.05 ± 0.01 | 0.31 ± 0.04 | 0.05 ± 0.01 | 0.05 ± 0.01 |
| Castelnuovo B. | Le | 42.6 ± 3.9 | 0.52 ± 0.08 | 0.05 ± 0.01 | 0.05 ± 0.01 |
| Castelnuovo B. | Fr | 36.8 ± 5.1 | 0.13 ± 0.02 | 0.05 ± 0.01 | 2.0 ± 0.3 |
| Castelnuovo B. | Le | 46.3 ± 3.9 | 0.33 ± 0.04 | 0.06 ± 0.01 | 0.05 ± 0.01 |
| Castelnuovo B. | Mo | 97.8 ± 5.1 | 0.39 ± 0.05 | 0.05 ± 0.01 | 3.7 ± 0.5 |
| Castelnuovo B. | Fr | 32.5 ± 2.5 | 0.65 ± 0.09 | 8.0 ± 1.2 | 15.1 ± 1.2 |
| Castelnuovo B. | Le | 21.6 ± 1.9 | 0.32 ± 0.05 | 0.05 ± 0.01 | 0.05 ± 0.01 |
| Castelnuovo B. | Mo | 149.3 ± 11.9 | 0.57 ± 0.09 | 0.05 ± 0.01 | 0.88 ± 0.12 |
| Castelnuovo B. | Fr | 52.2 ± 4.8 | 0.53 ± 0.09 | 13.0 ± 0.9 | 17.8 ± 1.9 |
| Manciano | Fr | 63.0 ± 5.2 | 0.12 ± 0.02 | 0.05 ± 0.01 | 3.02 ± 0.36 |
| Manciano | Lle | 58.4 ± 4.5 | 0.38 ± 0.06 | 0.05 ± 0.01 | 0.05 ± 0.01 |
| San Gimignano | Mo | 0.10 ± 0.01 | 0.39 ± 0.04 | 0.05 ± 0.01 | 24.8 ± 2.9 |
| San Gimignano | Fr | 0.05 ± 0.01 | 0.57 ± 0.07 | 7.5 ± 1.0 | 12.0 ± 1.3 |
| San Gimignano | Fr | 0.08 ± 0.01 | 0.28 ± 0.05 | 3.6 ± 0.6 | 47.0 ± 3.9 |
| San Gimignano | Le | 56.5 ± 3.8 | 0.33 ± 0.06 | 4.5 ± 0.7 | 10.8 ± 1.2 |
| San Gimignano | Le | 57.2 ± 4.2 | 0.33 ± 0.05 | 0.05 ± 0.01 | 2.2 ± 0.3 |
| Siena | Mo | 133.2 ± 9.6 | 0.44 ± 0.07 | 7.9 ± 1.2 | 48.7 ± 3.9 |
| Siena | Fr | 26.4 ± 3.2 | 0.23 ± 0.04 | 0.05 ± 0.01 | 0.05 ± 0.01 |
| Siena | Le | 38.7 ± 2.8 | 0.37 ± 0.07 | 0.05 ± 0.01 | 6.6 ± 0.8 |
| Siena | Le | 140.1 ± 8.5 | 0.38 ± 0.07 | 0.06 ± 0.01 | 34.5 ± 2.7 |
| Siena | Fr | 23.6 ± 1.9 | 0.38 ± 0.07 | 0.05 ± 0.01 | 0.05 ± 0.01 |
| Val d’Orcia | Le | 0.08 ± 0.02 | 0.35 ± 0.07 | 0.05 ± 0.01 | 7.0 ± 0.8 |
| Val d’Orcia | Fr | 0.07 ± 0.01 | 0.29 ± 0.05 | 19.3 ± 1.5 | 47.6 ± 3.9 |
| Val d’Orcia | Mo | 0.05 ± 0.01 | 0.05 ± 0.01 | 0.10 ± 0.01 | 0.05 ± 0.01 |
| Site | Cultivar | Elenoic acid | Verbascoside | Maslinic acid | Oleanolic acid |
|---|---|---|---|---|---|
| Capalbio Grosseto | Mo | 0.29 ± 0.05 | 1109 ± 112 | 779 ± 94 | 822 ± 99 |
| Capalbio Grosseto | Le | 5.6 ± 0.7 | 389 ± 43 | 846 ± 105 | 938 ± 113 |
| Castellina | Mo | 14.9 ± 1.4 | 4.0 ± 0.6 | 1062 ± 118 | 1077 ± 130 |
| Castellina | Le | 25.2 ± 1.8 | 37 ± 5 | 1126 ± 136 | 1215 ± 158 |
| Castellina | Le | 8.7 ± 1.0 | 25 ± 3 | 532 ± 64 | 700 ± 92 |
| Castellina | Fr | 7.8 ± 0.9 | 32 ± 4 | 448 ± 54 | 597 ± 78 |
| Castelnuovo B. | Le | 0.05 ± 0.01 | 1522 ± 160 | 1101 ± 135 | 1107 ± 144 |
| Castelnuovo B. | Fr | 5.6 ± 0.4 | 81 ± 9 | 1005 ± 121 | 983 ± 125 |
| Castelnuovo B. | Le | 34.2 ± 2.5 | 500 ± 57 | 957 ± 106 | 1055 ± 127 |
| Castelnuovo B. | Mo | 7.0 ± 0.8 | 323 ± 36 | 1022 ± 132 | 1015 ± 132 |
| Castelnuovo B. | Fr | 0.05 ± 0.01 | 216 ± 27 | 567 ± 72 | 696 ± 85 |
| Castelnuovo B. | Le | 46.8 ± 5.5 | 1362 ± 150 | 952 ± 110 | 1077 ± 115 |
| Castelnuovo B. | Mo | 7.2 ± 0.8 | 198 ± 26 | 1505 ± 179 | 1353 ± 158 |
| Castelnuovo B. | Fr | 11.9 ± 1.5 | 410 ± 50 | 220 ± 29 | 278 ± 35 |
| Manciano | Fr | 10.5 ± 1.4 | 57 ± 7 | 1012 ± 128 | 1080 ± 115 |
| Manciano | Le | 0.05 ± 0.01 | 172 ± 22 | 661 ± 86 | 751 ± 85 |
| San Gimignano | Mo | 30.3 ± 3.6 | 433 ± 52 | 1556 ± 181 | 1356 ± 142 |
| San Gimignano | Fr | 25.0 ± 3.0 | 283 ± 36 | 741 ± 89 | 958 ± 103 |
| San Gimignano | Fr | 55.6 ± 6.7 | 305 ± 37 | 833 ± 99 | 950 ± 108 |
| San Gimignano | Le | 9.3 ± 1.2 | 245 ± 34 | 998 ± 100 | 1152 ± 125 |
| San Gimignano | Le | 9.5 ± 1.3 | 1598 ± 192 | 593 ± 77 | 712 ± 77 |
| Siena | Mo | 0.05 ± 0.01 | 599 ± 180 | 1283 ± 154 | 1085 ± 122 |
| Siena | Fr | 0.05 ± 0.01 | 97 ± 14 | 1381 ± 175 | 1360 ± 158 |
| Siena | Le | 7.5 ± 0.9 | 110 ± 14 | 762 ± 92 | 858 ± 92 |
| Siena | Le | 3.0 ± 0.4 | 283 ± 34 | 1035 ± 123 | 994 ± 110 |
| Siena | Fr | 7.1 ± 0.9 | 936 ± 115 | 607 ± 79 | 723 ± 82 |
| Val d’Orcia | Le | 1.8 ± 0.3 | 94 ± 13 | 1204 ± 145 | 1234 ± 145 |
| Val d’Orcia | Fr | 21.2 ± 2.4 | 242 ± 30 | 742 ± 96 | 852 ± 92 |
| Val d’Orcia | Mo | 7.2 ± 0.9 | 63 ± 9 | 595 ± 16 | 697 ± 58 |
Disclaimer/Publisher’s Note: The statements, opinions and data contained in all publications are solely those of the individual author(s) and contributor(s) and not of MDPI and/or the editor(s). MDPI and/or the editor(s) disclaim responsibility for any injury to people or property resulting from any ideas, methods, instructions or products referred to in the content. |
© 2024 by the authors. Licensee MDPI, Basel, Switzerland. This article is an open access article distributed under the terms and conditions of the Creative Commons Attribution (CC BY) license (https://creativecommons.org/licenses/by/4.0/).
Share and Cite
Borghini, F.; Tamasi, G.; Loiselle, S.A.; Baglioni, M.; Ferrari, S.; Bisozzi, F.; Costantini, S.; Tozzi, C.; Riccaboni, A.; Rossi, C. Phenolic Profiles in Olive Leaves from Different Cultivars in Tuscany and Their Use as a Marker of Varietal and Geographical Origin on a Small Scale. Molecules 2024, 29, 3617. https://doi.org/10.3390/molecules29153617
Borghini F, Tamasi G, Loiselle SA, Baglioni M, Ferrari S, Bisozzi F, Costantini S, Tozzi C, Riccaboni A, Rossi C. Phenolic Profiles in Olive Leaves from Different Cultivars in Tuscany and Their Use as a Marker of Varietal and Geographical Origin on a Small Scale. Molecules. 2024; 29(15):3617. https://doi.org/10.3390/molecules29153617
Chicago/Turabian StyleBorghini, Francesca, Gabriella Tamasi, Steven Arthur Loiselle, Michele Baglioni, Stefano Ferrari, Flavia Bisozzi, Sara Costantini, Cristiana Tozzi, Angelo Riccaboni, and Claudio Rossi. 2024. "Phenolic Profiles in Olive Leaves from Different Cultivars in Tuscany and Their Use as a Marker of Varietal and Geographical Origin on a Small Scale" Molecules 29, no. 15: 3617. https://doi.org/10.3390/molecules29153617