Article

Experimental and Theoretical Study of the Reaction of F2 with Thiirane

1
Institut de Combustion, Aérothermique, Réactivité et Environnement (ICARE), CNRS, 45071 Orléans, France
2
IMT Nord Europe, Institut Mines-Télécom, University Lille, Centre for Energy and Environment, 59000 Lille, France
3
University Lille, CNRS, UMR 8523-PhLAM-Physique des Lasers Atomes et Molécules, 59000 Lille, France
*
Author to whom correspondence should be addressed.
Molecules 2024, 29(15), 3636; https://doi.org/10.3390/molecules29153636
Submission received: 5 July 2024 / Revised: 29 July 2024 / Accepted: 30 July 2024 / Published: 31 July 2024
(This article belongs to the Section Physical Chemistry)

Abstract

:
The kinetics of the F2 reaction with thiirane (C2H4S) was studied for the first time in a flow reactor combined with mass spectrometry at a total helium pressure of 2 Torr and in the temperature range of 220 to 800 K. The rate constant of the title reaction was determined under pseudo-first-order conditions, either monitoring the kinetics of F2 or C2H4S consumption in excess of thiirane or of F2, respectively: k1 = (5.79 ± 0.17) × 10−12 exp(−(16 ± 10)/T) cm3 molecule−1 s−1 (the uncertainties represent precision of the fit at the 2σ level, with the total 2σ relative uncertainty, including statistical and systematic errors on the rate constant being 15% at all temperatures). HF and CH2CHSF were identified as primary products of the title reaction. The yield of HF was measured to be 100% (with an accuracy of 10%) across the entire temperature range of the study. Quantum computations revealed reaction enthalpies ranging from −409.9 to −509.1 kJ mol−1 for all the isomers/conformers of the products, indicating a strong exothermicity. Boltzmann relative populations were then established for different temperatures.

Graphical Abstract

1. Introduction

The reactivity of F2 molecules has certain specific features and is of interest for both experimental and theoretical studies. One notable feature is that molecular fluorine exhibits surprisingly high reactivity towards certain closed-shell molecules. For example, it has been demonstrated that reactions of F2 with organosulfur compounds, CH3SCH3 and CH3SSCH3, and with limonene are barrierless reactions [1,2,3]. Unexpectedly high rate constants (for reactions between two closed-shell molecules), 1.6 × 10⁻¹¹ at 298 K [4] and 1.9 × 10⁻¹² cm3 molecule−1 s−1 at T = 278–360 K [3], were reported for reaction of F2 with dimethyl sulfide (CH3SCH3) and limonene, respectively. The current kinetic and mechanistic database on F2 reactions with stable molecules is very limited [5], especially regarding information on reaction products and the temperature dependence of reaction rate constants. To better understand the nature of the specific reactivity of the F2 molecule, additional kinetic and mechanistic studies (preferably over a wide temperature range) are necessary.
In the present work, we report the results of combined experimental and theoretical study of the reaction of molecular fluorine with another organosulfur compound, thiirane (C2H4S), over a wide temperature range (from 220 to 800 K):
F2 + C2H4S → products
The reaction rate constant as well as the reaction products are reported for the first time. To our knowledge, no information exists in the literature regarding the spontaneity and thermodynamical stability of this reaction. Quantum computations have been carried out to determine the thermodynamical parameter of the reaction.

2. Results and Discussion

The reaction of F2 with C2H4S was studied at a total pressure of 2 Torr of He and at temperatures ranging from 220 to 800 K. The configuration of the flow reactors used in the experiments is shown in Figure 1 and Figure S1 (Supplementary Materials). It should be noted that the microwave discharge shown in Figure 1 and Figure S1 was only used in the HF calibration experiments (see experimental section), but was turned off during the kinetic study of the title reaction.

2.1. Products of Reaction (1)

2.1.1. Measurements of HF Yield

HF and C2H3SF were identified as primary products of reaction (1):
F2 + C2H4S → HF + C2H3SF
Both species were monitored by mass spectrometry on their parent peaks at m/z = 38 (F2+) and 78 (C2H3SF+), respectively. Experiments to determine the branching ratio of this reactive channel were carried out with an excess of thiirane over F2 and consisted of measuring the consumed concentrations of the reactants and those of the two products formed. With the initial C2H4S concentrations shown in Table 1 and a reaction time of 0.015 to 0.020 s, the consumed fraction of F2 (the initial F2 concentration was varied by a factor of approximately 10) was ≥ 90%. The initial concentrations of the two reactants were comparable, allowing the detection of not only the consumption of F2, but also that of the excess reagent, C2H4S.
Examples of the experimental data observed in these experiments are shown in Figure 2, where the formed concentrations of the reaction products are plotted against the [F2] and [C2H4S] consumed. Note that the concentrations of C2H3SF in Figure 2 are presented in relative units; absolute concentrations were measured only for HF. The yields of HF determined from the slopes of the black lines in Figure 2 ([HF]/Δ[F2] and [HF]/Δ[C2H4S]) at different temperatures are listed in Table 1. The results show that one molecule of HF is formed per one molecule of F2 and C2H4S consumed. This observation, along with the linearity of the corresponding plots for C2H3SF, seems to indicate a negligible impact of possible secondary and side reactions under the experimental conditions of the measurements and that the HF + C2H3SF forming channel is the main, if not only, reaction pathway in the entire temperature range of the study (220–800 K). Combining the statistical uncertainty of measurements with the accuracy of measuring the absolute concentrations of F2, C2H4S and HF of around 5%, a branching ratio equal to unity with an error of 10% can be recommended for the HF forming channel of reaction (1).
As previously noted, all measurements were carried out with an excess of C2H4S. The fact is that in an excess of F2, we observed signs of a secondary reaction of F2 with C2H3SF. The kinetics of C2H3SF exhibited a characteristic behavior: [C2H3SF] initially increased to a maximum and then decreased due to the secondary reaction with F2. Concurrently, we observed the formation of SF2 (at m/z = 70). Studying this secondary reaction was beyond the scope of this work, so we limited the branching ratio measurements to experiments with excess of C2H4S, where the secondary chemistry could be neglected. However, it should be noted that at T = 800 K (the highest temperature of the study), we observed evidence of C2H3SF removal, albeit slowly, even in the absence of F2 in the reactor. We are inclined to think that this is due to thermal decomposition of C2H3SF, although other processes of C2H3SF removal cannot be ruled out. For this reason, in Figure 2d we do not present the measurements of [C2H3SF].
The structure of the C2H3SF formed in reaction (1) was not determined, but some considerations can nevertheless be discussed. Most probably, reaction (1) proceeds through the addition of F2 to the sulfur atom followed by the elimination of HF, as proposed by Nelson et al. [6]:
F2 + C2H4S → [C2H4S(F-F)]* → HF+ C2H3SF
In this case, the most likely product is CH2=CH-SF (ethenyl thiohypofluorite). Mass spectrometry analysis of C2H3SF (formed in reaction (1)) revealed a prominent fragment peak at m/z = 51 (SF+), which, although indirectly, supports this hypothesis. The presence of this peak in the mass spectrum of other conformers, for example, 2-fluorotiirane or S=CH-CH2F, seems to be unlikely. In addition, signals at m/z = 63 and 64, which can be attributed to C-SF+ and CH-SF+, respectively, are observed and are consistent with the mass spectrometric fragments of CH2=CHSF.
For the analogous reaction of F2 with DMS, Turnipseed and Birks [4] observed a reaction product, thought to be H2C=S(F)CH3, when DMS was in excess over F2. This product was found to be destroyed in an excess of F2 in the reactor, similar to how CH2=CH-SF behaves in the present work. The authors proposed that the reaction proceeds through a charge-transfer complex with subsequent elimination of H and F atoms or of molecular HF. The HF production channel was thought to constitute a small part of the reaction pathway, although there was no experimental evidence for that. In contrast, for the F2 reaction with C2H4S investigated in the present work, a significant contribution of the F atom forming channel can apparently be excluded, given that in an excess of thiirane it was observed that [HF] = Δ[F2] = Δ[C2H4S].

2.1.2. Theoretical Findings

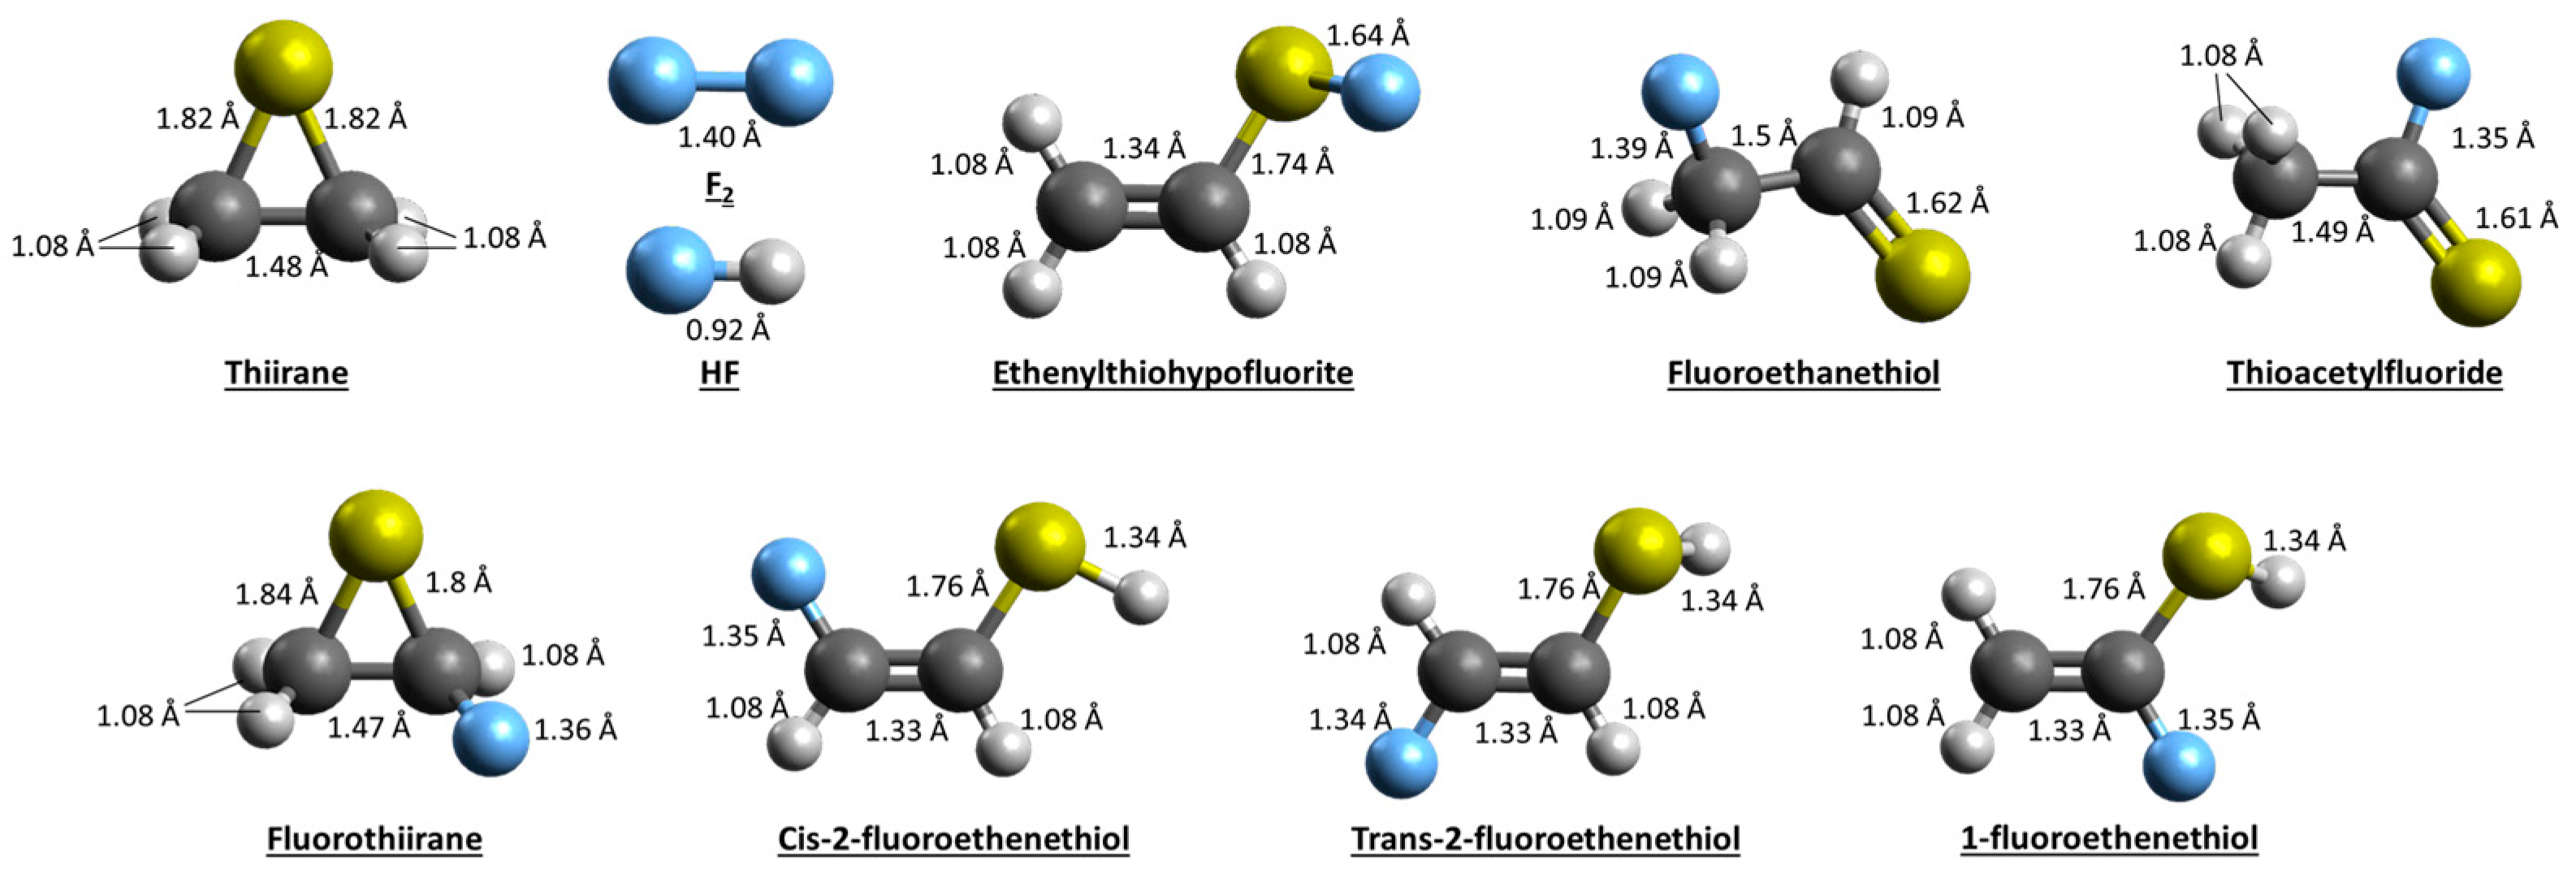
The enthalpies (including Zero-Point Energy, ZPE) and Gibbs free energies of the thiirane reaction with F2 were computed for all possible isomers and conformers of the products C2H3FS (Table 2). These isomers and conformers (for the case of 2-fluoroethenethiol) are shown in Figure 3. The computed reaction enthalpies range from −509.1 kJ mol−1 (for the case of thioacetylfluoride) to −409.9 kJ mol−1 (in the case of Ethenylhypofluorite). The Gibbs free energies are in the same order of magnitude, indicating a spontaneous reaction.
From the energies of the different products, we can compute the relative Boltzmann population as function of the temperature using the following equation:
B o l t z m a n n   p o p u l a t i o n = e Δ H R T / e Δ H R T
with ∆H being the relative enthalpy, R the gas constant and T the temperature. The Boltzmann population analysis indicates that thioacetylfluoride is the predominant species formed, with 1-fluoroethenethiol being the second most abundant species. These species could be source of CHSF and CSF fragments but not of the SF fragment, which was observed experimentally. It should be noted that calculations provide insights into the thermochemistry, pointing to a highly exergonic reaction, but not into the kinetics, since the energy barrier of the transition states was not calculated. Given the exergonic nature of the reaction, products that have high energy barriers, or include rearrangements, and could proceed through multiple transition states may not be kinetically favored.

2.2. Measurements of the Rate Constant of Reaction (1)

In most experiments, the reaction rate constant was determined from the kinetics of C2H4S consumption ([C2H4S]0 = (1.5 − 5.0) × 1011 molecule cm−3), monitored in an excess of F2 in the reactor (for concentrations of F2 see Table 3).
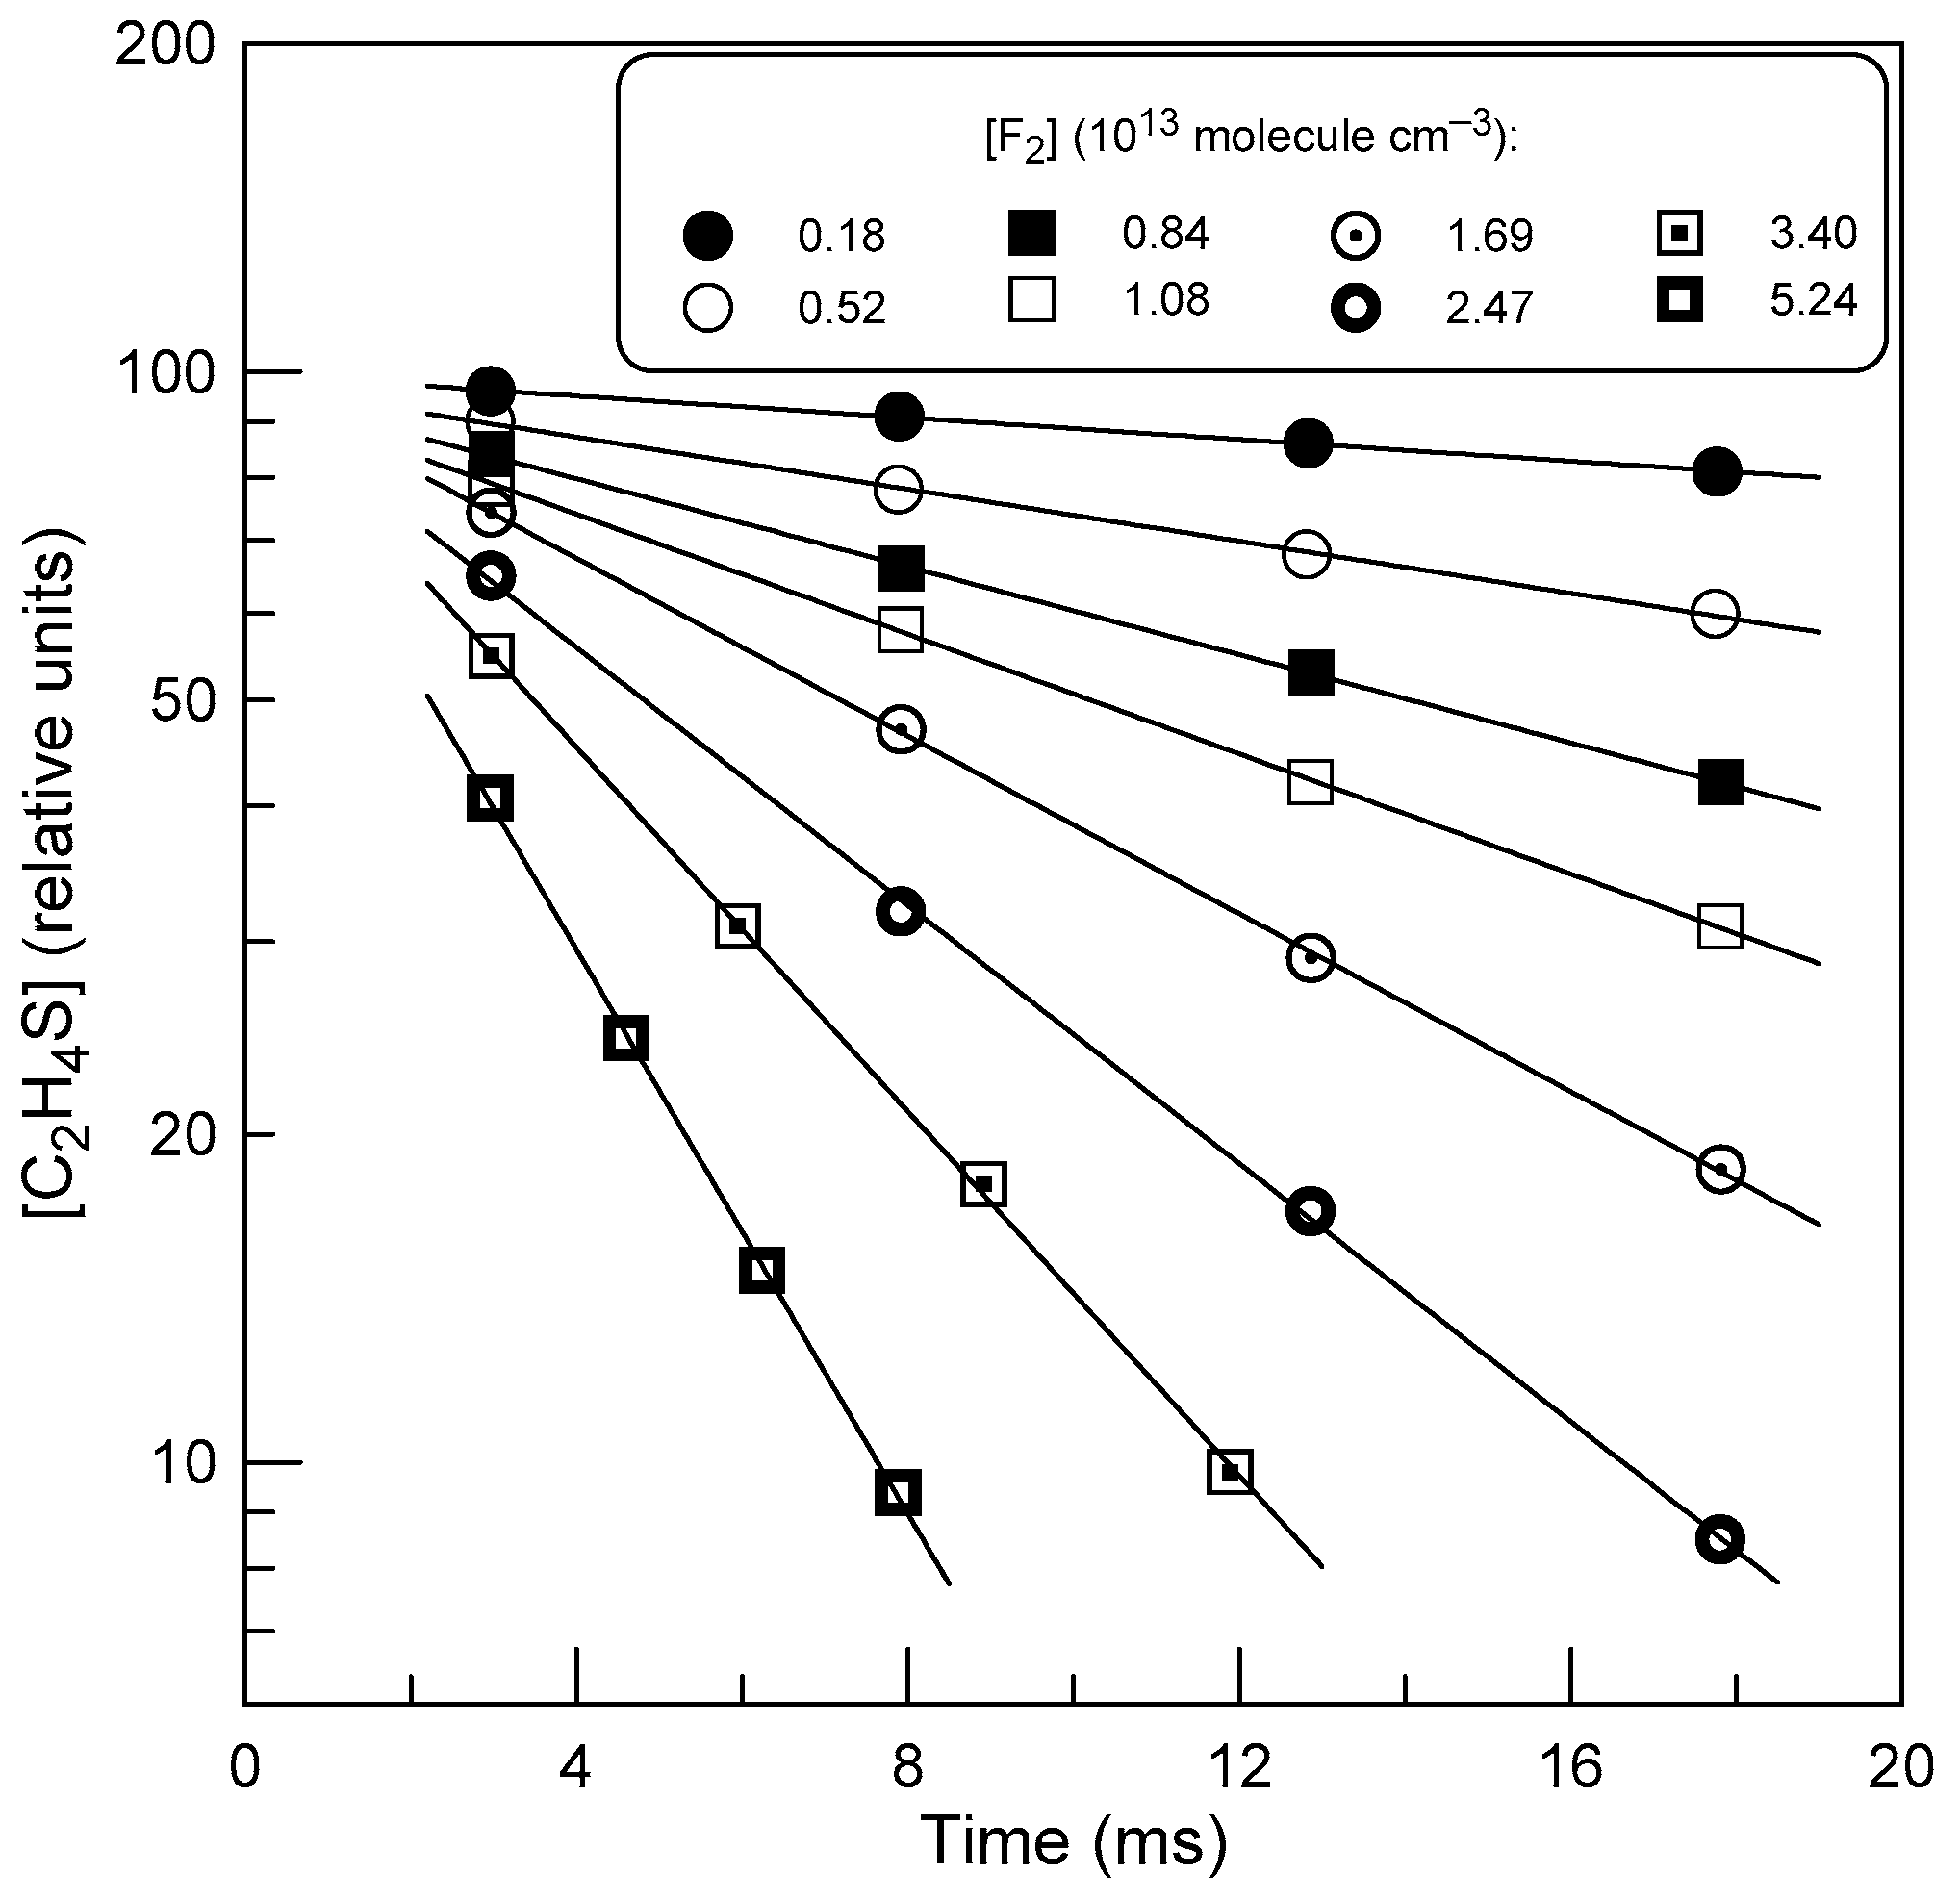
Examples of observed C2H4S decays are shown in Figure 4. The temporal profiles of C2H4S were fitted to an exponential function [C2H4S] = [C2H4S]0 × exp(−k1′ × t), where [C2H4S]0 and [C2H4S] are the initial and time-dependent concentrations of thiirane, respectively, and k1′ = k1 × [F2] is the pseudo-first-order rate constant. The diffusion corrections made in [7] to the k1′ values measured in this way were less than 10%.
Examples of second-order plots measured at different temperatures are shown in Figure 5. A linear least-square fit through the origin of the k1′ data as a function of [F2] provides the rate constant of reaction (1) at the corresponding temperature. All the results obtained for k1 are given in Table 3.
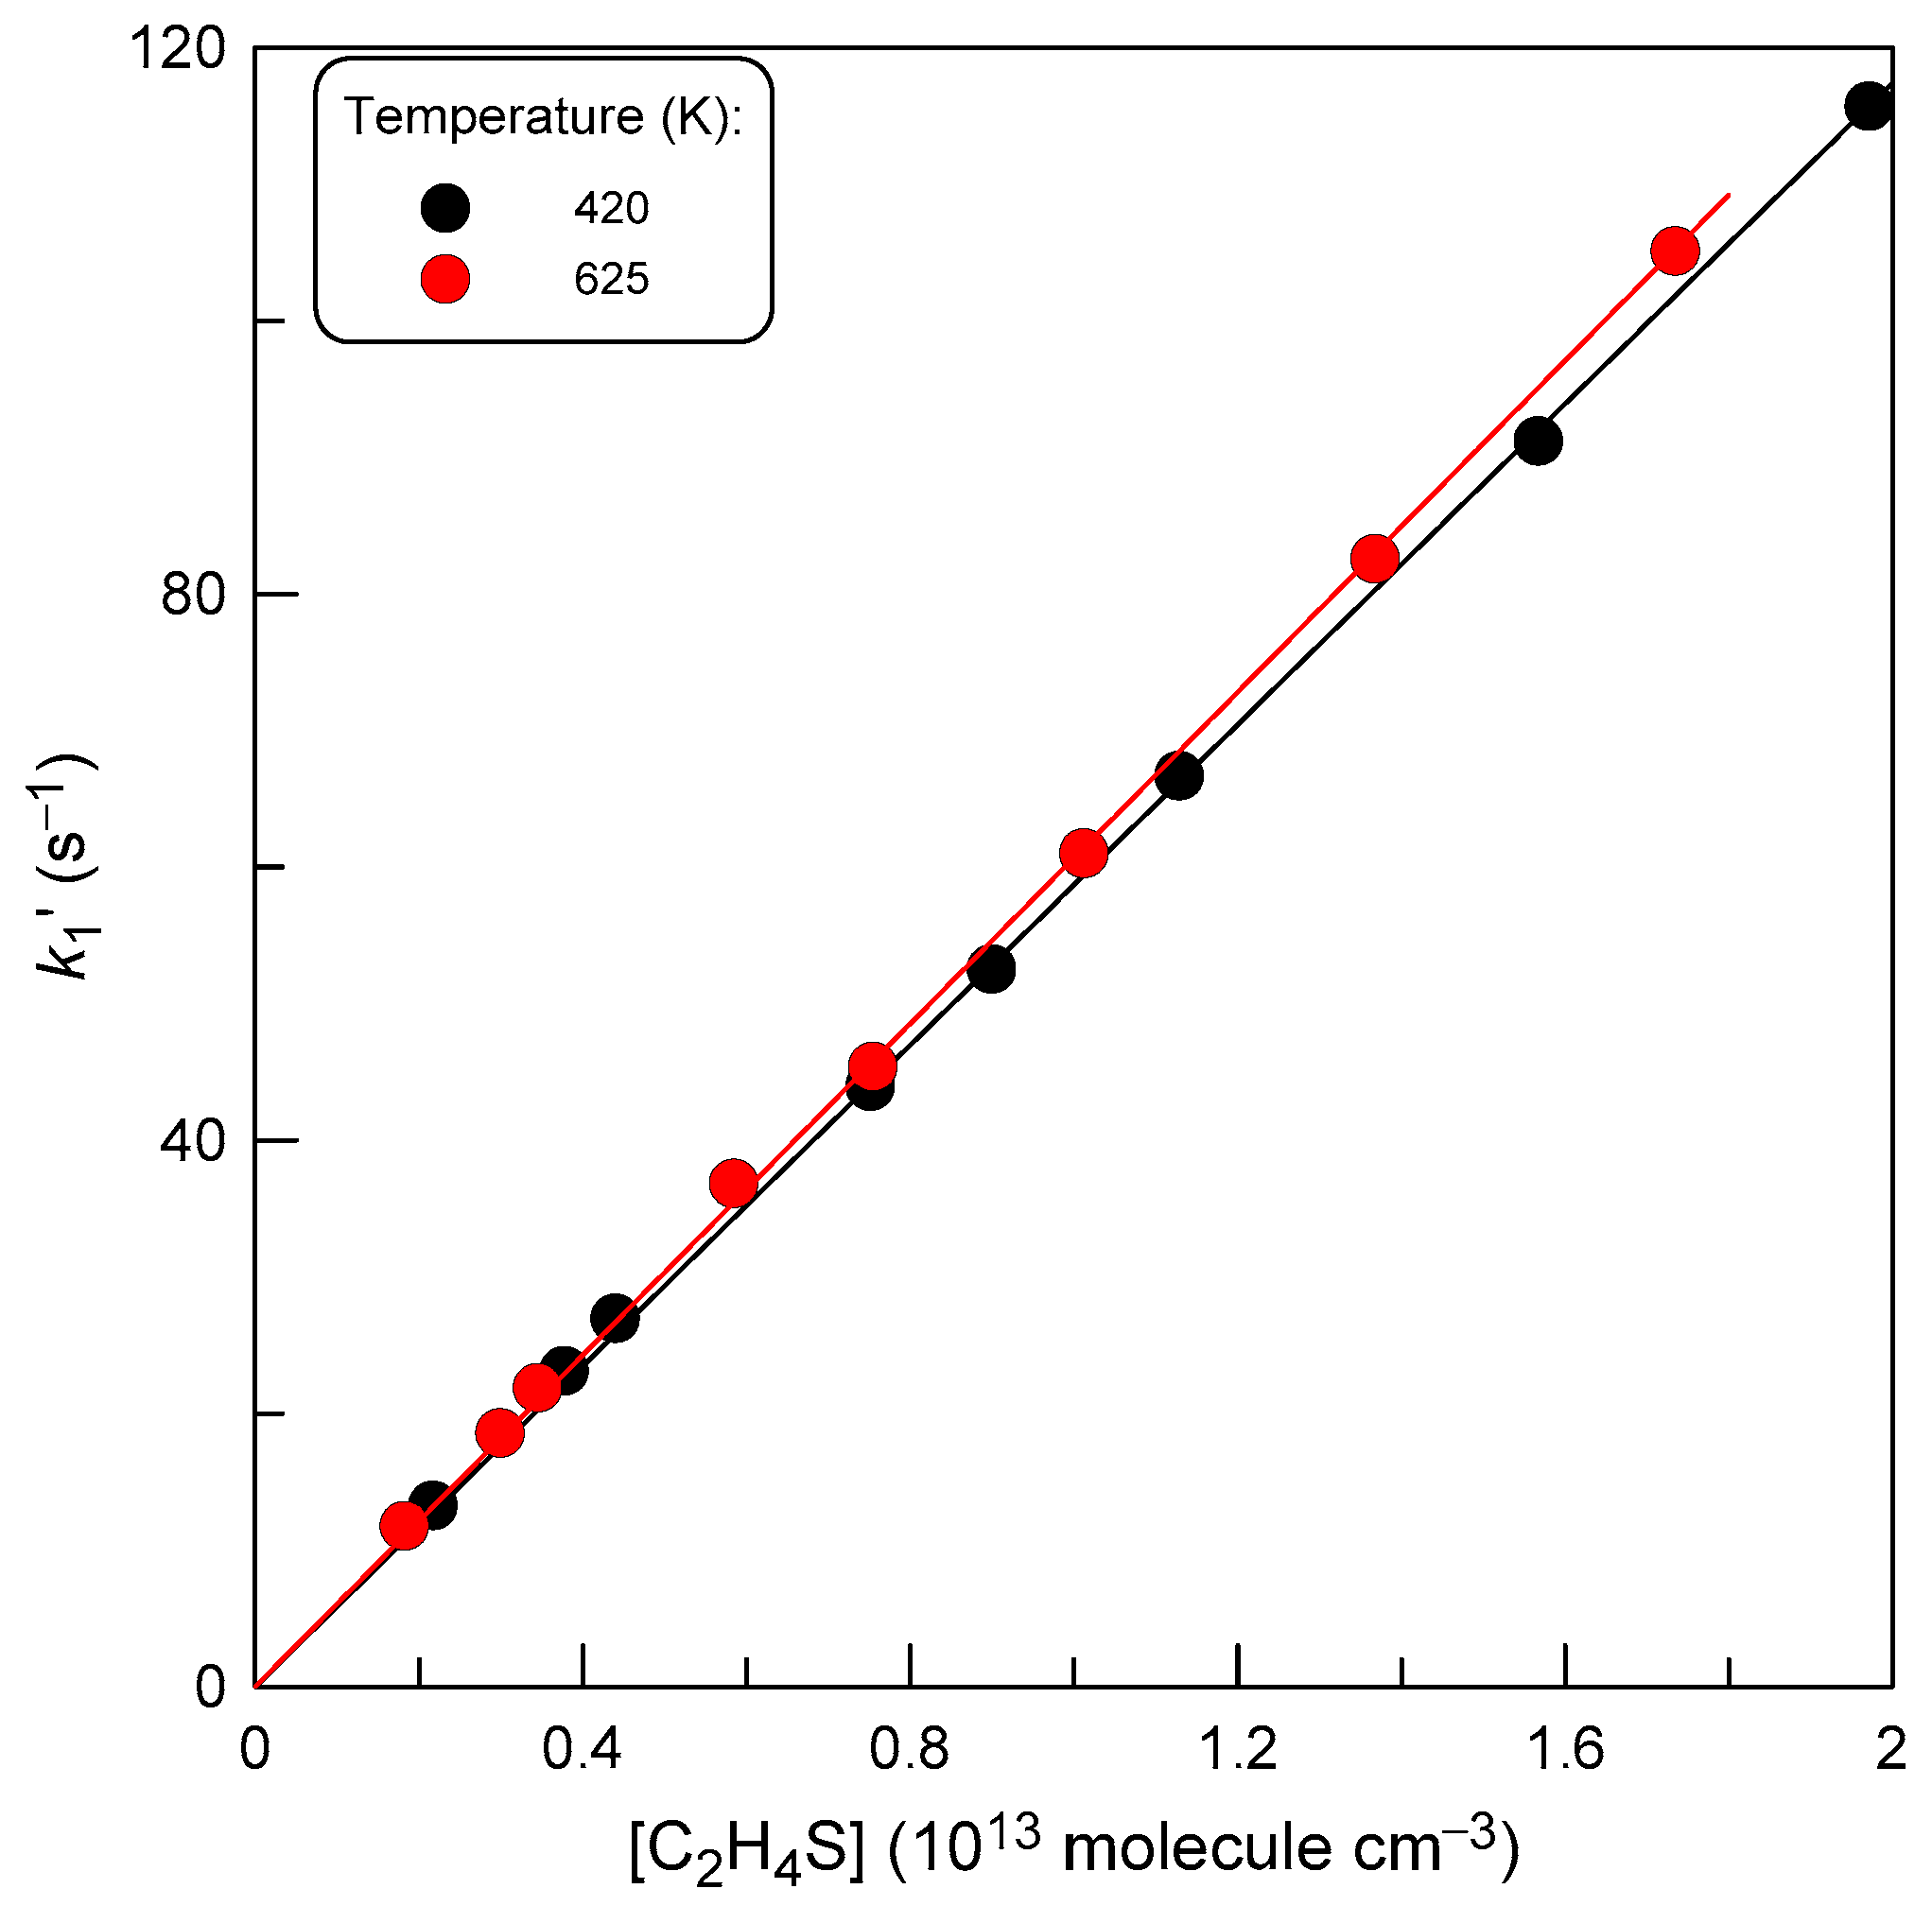
In some experiments, the rate constant of reaction (1) was determined from the kinetics of F2 consumption monitored in an excess of thiirane in the reactor. The initial concentration of F2 in these experiments was ≤ 1012 molecule cm−3. The observed C2H4S consumption (within a few %) was taken into account by using the average C2H4S concentration over the reaction zone. Examples of second-order plots and final values of k1 obtained in this series of experiments are shown in Figure 6 and Table 3, respectively.
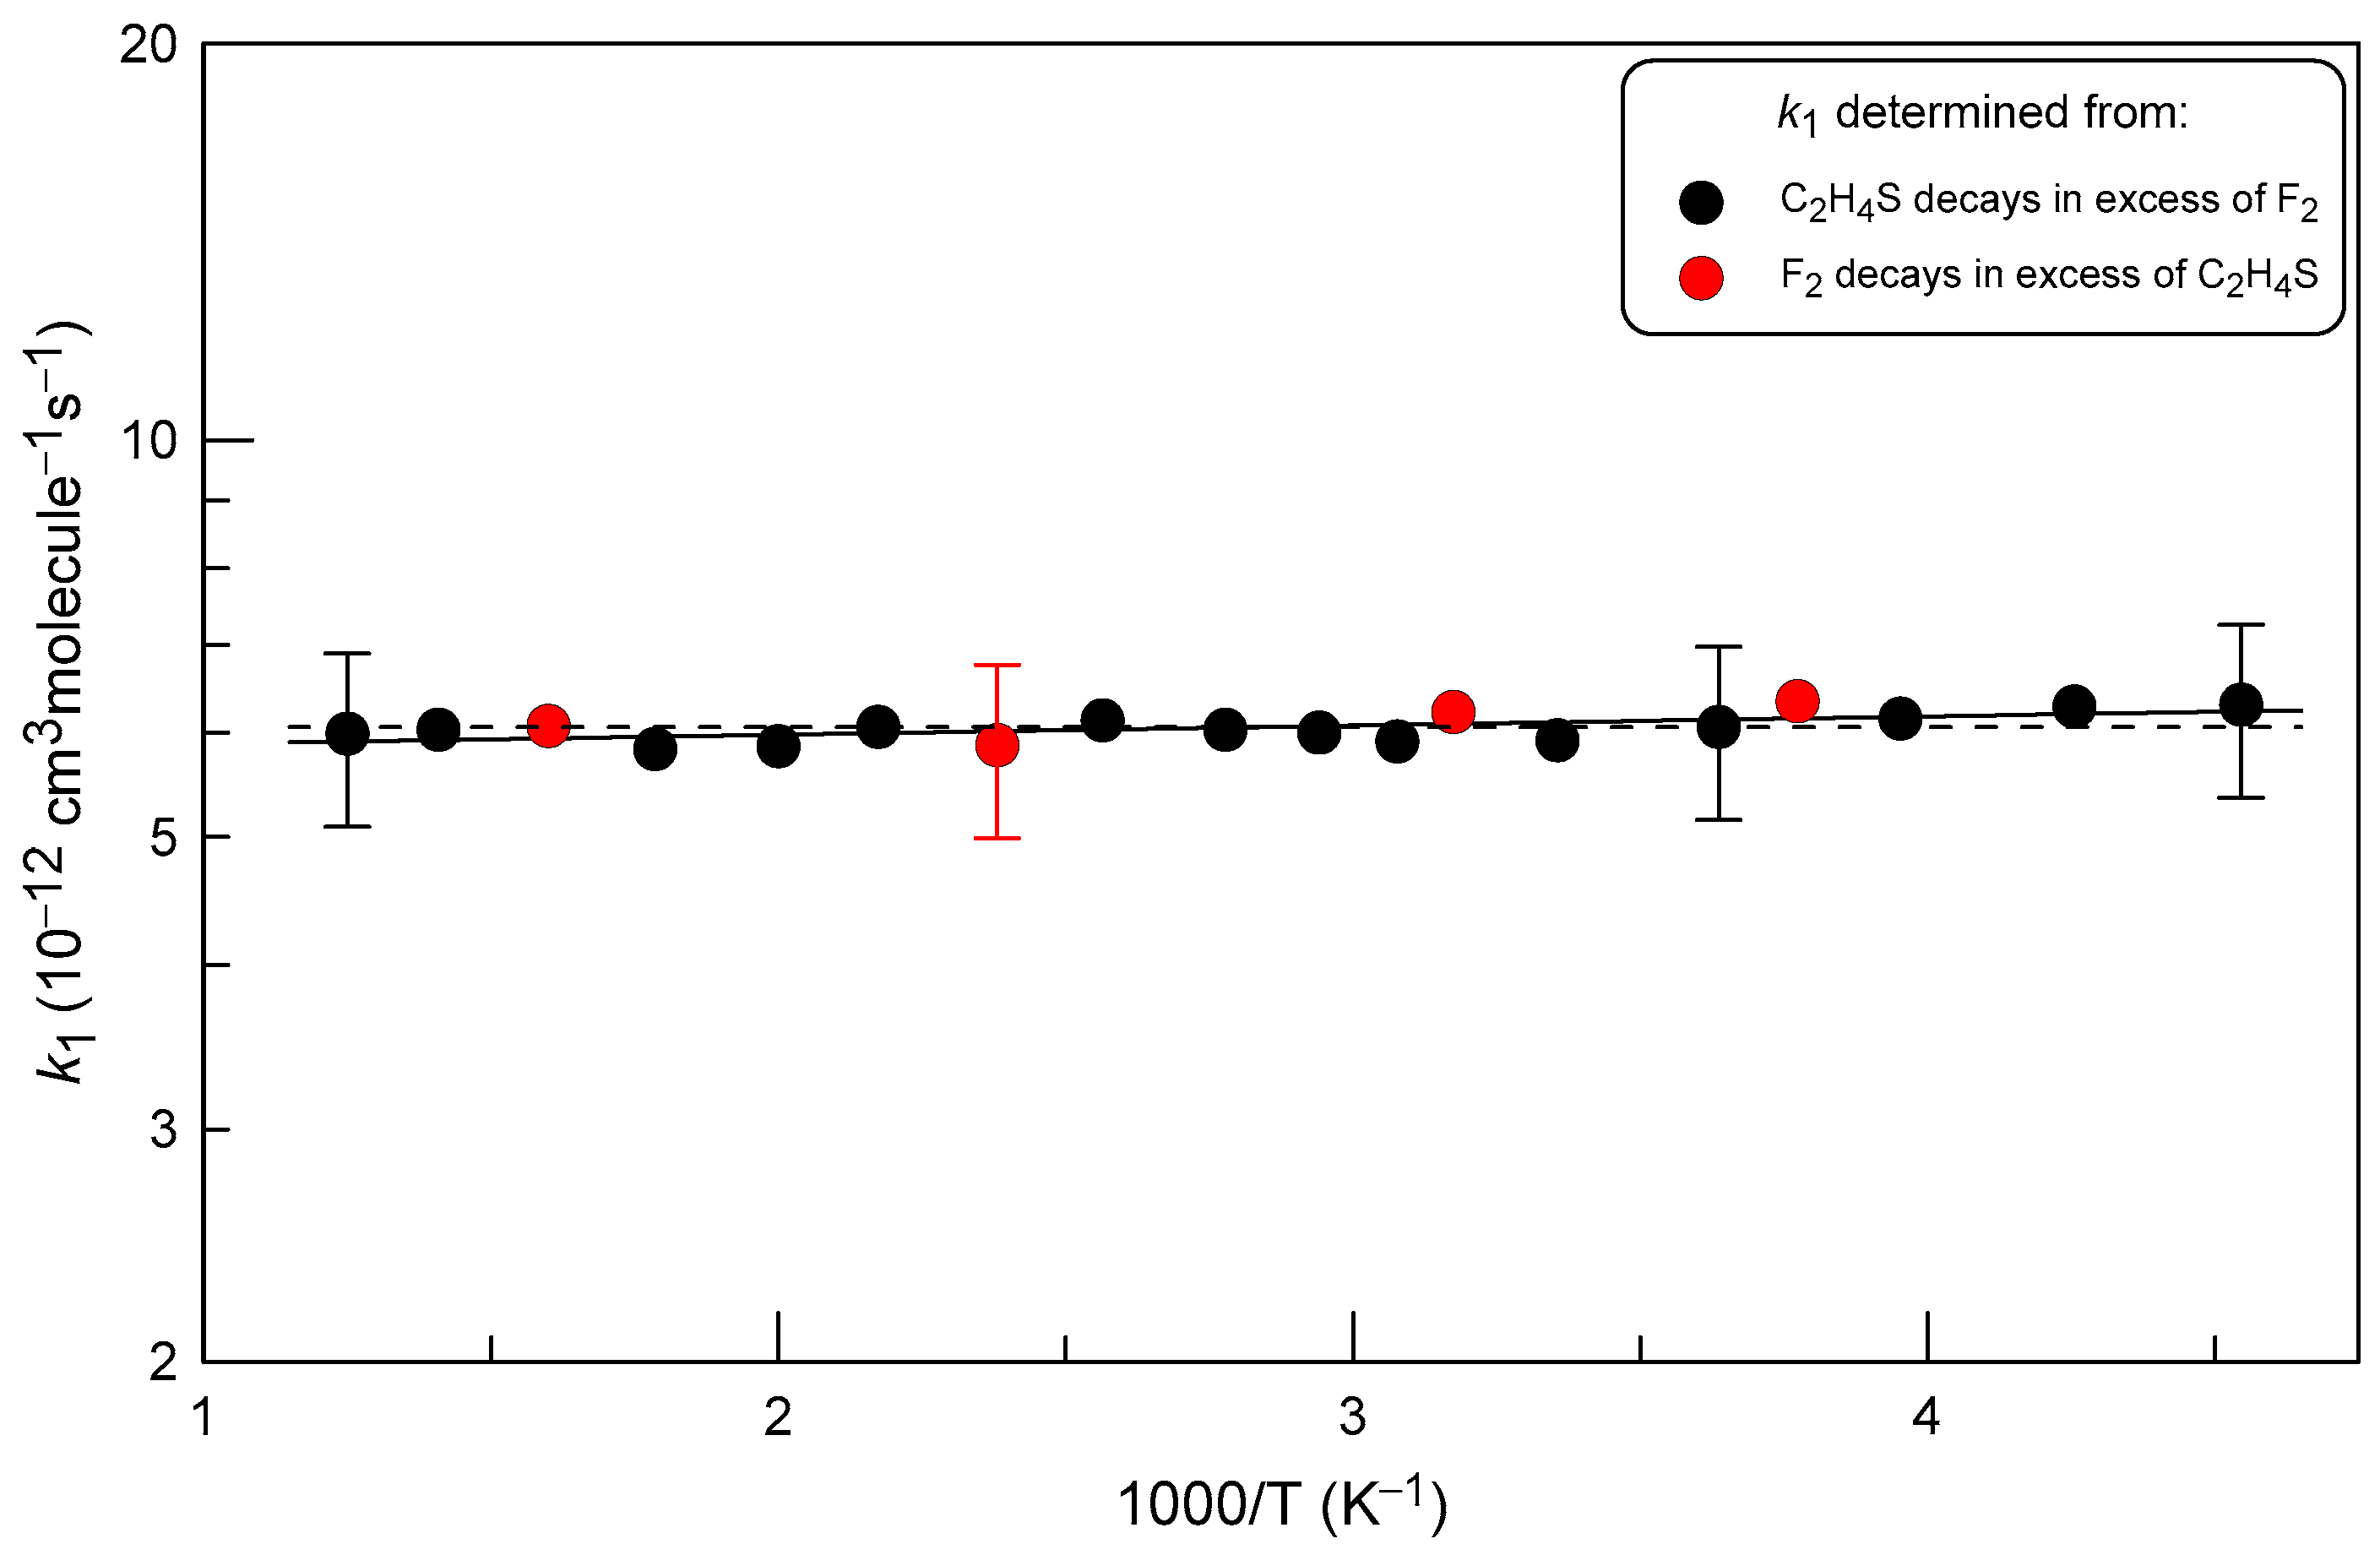
The results of all k1 measurements are summarized in Figure 7.
It can be noted that there is an excellent agreement between the data obtained under different experimental conditions, from F2 and C2H4S kinetics in excess of C2H4S and F2, respectively. Fitting the dependence of k1 on temperature to the exponential function (solid line in Figure 6) gives the following Arrhenius expression:
k1 = (5.79 ± 0.17)×10−2 exp(−(16 ± 10)/T) cm3 molecule−1 s−1
at T = 220–800 K with 2σ uncertainties representing the precision of the fit. We estimate this expression to be accurate within an overall 2σ uncertainty of 15% over the investigated temperature range. Considering the virtual independence of the rate constant of temperature, the temperature independent value of
k1 = (6.05 ± 0.90) × 10−12 cm3 molecule−1 s−1
can be recommended for the rate constant of reaction (1) (dashed line in Figure 6) in the temperature range (220−800) K. The observed temperature independence of k1 appears to be consistent with a reaction mechanism consisting of barrier-free formation of an intermediate followed by its decomposition into reactants or reaction products.
Turnipseed and Birks [4] in their study of the F2+DMS reaction speculated that the reaction can be initiated by the transfer of an electron from the sulfur compound to F2, forming a charge-transfer complex. Considering that the electron transfer process must be either exothermic or thermoneutral for the reaction to proceed at a measurable rate they calculated a critical distance, rc = 14.4/(IP(reactant) − EA(F2)), which corresponds to the maximum distance at which the charge-transfer complex can be stable and the electron can be transferred (EA(F2): electron affinity of molecular fluorine; IP(reactant): ionization potential of the second reactant). By analyzing the rc for F2 interactions with a number of compounds, the authors estimated that a critical distance greater than 2.3 Å is required for the reaction to occur [4]. The present data for the reaction of F2 with thiirane are consistent with this reasoning, given that rc = 2.4 Å (calculated with IP(C2H4S) = 9.05 eV [8] and EA(F2) = 3.08 eV [9]) and a relatively high value was measured for the reaction rate constant.

3. Materials and Methods

3.1. Experimental

The experimental setup consisted of a discharge flow reactor combined with a modulated molecular beam mass spectrometer with electron impact ionization operated at 30 eV energy (Figure 1) [10,11]. The reaction time was determined by the position of the movable injector relative to the sampling cone of the mass spectrometer; changing its position makes it possible to vary the reaction time. Linear flow velocities in the reactor ranged from 1730 to 2400 cm s−1. The chemical composition of the reactive system was monitored by sampling gas-phase molecules from the flow reactor and detecting them with a mass spectrometer. All species involved were detected at their parent peaks.
Two flow reactors were used in this study to cover a wide temperature range for kinetic measurements. The first reactor, operated at high temperatures (315–800 K), consisted of an electrically heated quartz tube (45 cm length and 2.5 cm i.d.) with water-cooled attachments (Figure 1) [12]. The temperature in the reactor was measured with a K-type thermocouple positioned in the middle of the reactor in contact with its outer surface [12]. The second flow reactor (Figure S1) used at lower temperatures (220–325 K) consisted of a Pyrex tube (45 cm length and 2.4 cm i.d.); temperature regulation was achieved by circulating thermostated ethanol. The walls of the Pyrex reactor, as well as the mobile injector of fluorine atoms, were coated with halocarbon wax to prevent the reaction of the F atom with the glass surface.
The absolute concentrations of F2, H2 and C2H4S were calculated from their flow rates, obtained from pressure drop measurements of their mixtures in He stored in calibrated volume flasks. Absolute calibration of the mass spectrometer to HF was carried out by titrating a known concentration of H2 with an excess of F atoms ([HF] = [H2]) in a fast reaction:
F + H2 → HF + H
k2 = 1.24 × 10⁻¹⁰ exp(−507/T) cm3 molecule−1 s−1 (T = 220–960 K) [13]. Fluorine atoms in these experiments were generated in a microwave discharge of trace amounts of F2 in He. It was verified by mass spectrometry that more than 95% of F2 was dissociated in the microwave discharge. To reduce F atom reactions with the glass surface inside the microwave cavity, a ceramic (Al2O3) tube was inserted in this part of the injector.
The purities of the gases used were as follows: He (>99.9995%, Alphagaz, Air Liquide, Paris, France), passed through liquid nitrogen trap; H2 (> 99.998%, Alphagaz); and F2, 5% in helium (Alphagaz); C2H4S (Merck, Merck SA, Lyon, France), 98%.

3.2. Computational Methodology

In order to select the correct methodology to perform the computation, a thorough benchmark was carried out. Based on Vila et al. [14], we used density functional theory (DFT) with a B3LYP function in comparison with the Schrödinger-based MP2 method and CCSD method, which is used as reference, having the highest level of accuracy among the benchmarked methods. In practice, DFT, MP2 and CCSD calculations were performed with the Gaussian 16 software [15], while the more time-consuming CCSD(T)-CBS calculations were carried out using the Molpro 2023.2.0 software [16,17,18].
B3LYP and MP2 methods were compared using the same basis set (6-311++G(3d2f,3p2d)) as the CCSD methodology. The criteria to determine the accuracy of B3LYP and MP2 compared to CCSD were based on the geometries of the molecules and their energies once corrected with single-point computation at the same level of methodology as when using CCSD(T) with a CBS correction (aug-cc-pVTZ:aug-cc-pVQZ). In Figure S2, the energy differences are introduced and it is shown that only the MP2 method remains with differences under chemical accuracy (4.18 kJ/mol). Figures S3–S10 illustrate the geometry differences for each product, showing negligible discrepancies in bond lengths (maximum of 0.02 Å), indicating the minimal impact of the method on this parameter. Concerning angles, small differences are observed with a maximum of 1.28 degrees. However, we can start to observe some indication that MP2 is slightly better than B3LYP to reproduce the angles. Finally, concerning dihedral angles, strong differences can be observed in the case of the B3LYP methodology compared to MP2. Indeed, in the case of cis-2-fluoroethenethiol, ethenylthiohypofluorite and fluoroethanethial some dihedral angles increase a lot (up to 127.55 degrees) in the case of B3LYP. Such differences indicate a clear change in the configuration of the molecule. In MP2, the differences are up to 7.02 degrees, which is more reasonable. In conclusion, the MP2 methodology seems more reliable in comparison to the CCSD method. The computational cost increases slightly compared to DFT but is still reasonable compared to the CCSD methodology, which is prohibitively expensive.
Using both B3LYP and MP2, which are reasonable in terms of computational cost, the 6-311++G(3d2f,3p2d) and aug-cc-pVDZ were compared to the aug-cc-pVTZ basis set, which is the largest among the three. Geometries and energies are compared, as they are in the benchmark of the method. In Figure S11, energy differences clearly indicate that basis set size has an effect, as the energy is above chemical accuracy in the case of 6-311++G(3d2f,3p2d) and for ethenylthiohypofluorite with the aug-cc-pVDZ. Figures S12–S19 introduce geometry differences. It is evident that the 6-311++G(3d2f,3p2d) basis set struggles to accurately represent bonds involving sulfur and fluorine atoms. It is even more remarkable in the case of ethenylthiohypofluorite, where the error is around 0.16 Å (B3LYP) and 0.18 Å (MP2). These differences can significantly impact the calculated energies. Dihedral angles are notably impacted by the size of the basis set for both methods. Therefore, the larger aug-cc-pVTZ basis set is recommended.

Supplementary Materials

The following supporting information can be downloaded at: https://www.mdpi.com/article/10.3390/molecules29153636/s1, Figure S1: configuration of the low-temperature flow reactor; Figure S2: single-point energy differences between B3LYP, MP2 and CCSD methods; Figures S3–S10: bond length differences calculated with different methods; Figure S11: single-point energy differences for different basis set sizes; Figures S12–S19: geometry differences between different basis sets; Figure S20: Boltzmann relative distribution of the reaction products as a function of temperature; optimized geometry; inputs.

Author Contributions

Conceptualization, experimental investigation, data analysis and interpretation, writing, Y.B.; computation, methodology, validation, formal analysis, writing, A.R.; validation, writing, supervision, V.V.; review, editing, supervision, M.N.R. All authors have read and agreed to the published version of the manuscript.

Funding

This research was partly funded by ANR through the PIA (Programme d’Investissement d’Avenir, grant number ANR-10-LABX-100-01), Labex CaPPA, funded by ANR through the PIA under contract ANR-11-LABX-0005-01, and CPER ECRIN project, both funded by the Hauts-de-France Regional Council and the European Regional Development Fund (ERDF).

Institutional Review Board Statement

Not applicable.

Informed Consent Statement

Not applicable.

Data Availability Statement

The data supporting reported results are available in this article.

Conflicts of Interest

The authors declare no conflicts of interest.

References

  1. Lu, Y.-J.; Lee, L.; Pan, J.-W.; Xie, T.; Witek, H.A.; Lin, J.J. Barrierless reactions between two closed-shell molecules. I. Dynamics of F2+CH3SCH3 reaction. J. Chem. Phys. 2008, 128, 104317. [Google Scholar] [CrossRef] [PubMed]
  2. Shao, H.-C.; Xie, T.; Lu, Y.-J.; Chang, C.-H.; Pan, J.-W.; Lin, J.J. Barrierless reactions between two closed-shell molecules. II. Dynamics of F2+CH3SSCH3 reaction. J. Chem. Phys. 2009, 130, 014301. [Google Scholar] [CrossRef] [PubMed]
  3. Bedjanian, Y.; Romanias, M.N.; Morin, J. Reaction of Limonene with F2: Rate Coefficient and Products. J. Phys. Chem. A 2014, 118, 10233–10239. [Google Scholar] [CrossRef] [PubMed]
  4. Turnipseed, A.A.; Birks, J.W. Kinetics of the reaction of molecular fluorine with dimethyl sulfide. J. Phys. Chem. 1991, 95, 6569–6574. [Google Scholar] [CrossRef]
  5. Manion, J.A.; Huie, R.E.; Levin, R.D.; Burgess, D.R.; Orkin, V.L.; Tsang, W.; McGivern, W.S.; Hudgens, J.W.; Knyazev, V.D.; Atkinson, D.B.; et al. NIST Chemical Kinetics Database, NIST Standard Reference Database 17, Version 7.0 (Web Version), Release 1.6.8, Data version 2015.12, National Institute of Standards and Technology, Gaithersburg, Maryland, 20899-8320. Available online: http://kinetics.nist.gov/ (accessed on 3 July 2024).
  6. Nelson, J.K.; Getty, R.H.; Birks, J.W. Fluorine induced chemiluminescence detector for reduced sulfur compounds. Anal. Chem. 1983, 55, 1767–1770. [Google Scholar] [CrossRef]
  7. Kaufman, F. Kinetics of elementary radical reactions in the gas phase. J. Phys. Chem. 1984, 88, 4909–4917. [Google Scholar] [CrossRef]
  8. Butler, J.J.; Baer, T. A photoionization study of organosulfur ring compounds—Thiirane, thietane and tetrahydrothiophene. Org. Mass Spectrom. 1983, 18, 248–253. [Google Scholar] [CrossRef]
  9. Bartmess, J.E.; McIver, R.T. Chapter 11—The gas-phase acidity scale. In Gas Phase Ion Chemistry; Bowers, M.T., Ed.; Academic Press: Cambridge, MA, USA, 1979; pp. 87–121. [Google Scholar]
  10. Bedjanian, Y. Rate Coefficients of the Reactions of Fluorine Atoms with H2S and SH over the Temperature Range 220–960 K. Molecules 2022, 27, 8365. [Google Scholar] [CrossRef] [PubMed]
  11. Bedjanian, Y. Temperature-Dependent Kinetic Study of the Reactions of Hydrogen Atoms with H2S and C2H4S. Molecules 2023, 28, 7883. [Google Scholar] [CrossRef] [PubMed]
  12. Morin, J.; Romanias, M.N.; Bedjanian, Y. Experimental study of the reactions of OH radicals with propane, n-pentane, and n-heptane over a wide temperature range. Int. J. Chem. Kinet. 2015, 47, 629–637. [Google Scholar] [CrossRef]
  13. Bedjanian, Y. Rate constants for the reactions of F atoms with H2 and D2 over the temperature range 220–960 K. Int. J. Chem. Kinet. 2021, 53, 527–535. [Google Scholar] [CrossRef]
  14. Vila, A.; Puente, E.d.l.; Mosquera, R.A. QTAIM study of the electronic structure and strain energy of fluorine substituted oxiranes and thiiranes. Chem. Phys. Lett. 2005, 405, 440–447. [Google Scholar] [CrossRef]
  15. Frisch, M.J.; Trucks, G.W.; Schlegel, H.B.; Scuseria, G.E.; Robb, M.A.; Cheeseman, J.R.; Scalmani, G.; Barone, V.; Petersson, G.A.; Nakatsuji, H.; et al. Gaussian 16, Rev. C.01; Gaussian, Inc.: Wallingford, CT, USA, 2016.
  16. Werner, H.-J.; Knowles, P.J.; Manby, F.R.; Black, J.A.; Doll, K.; Heßelmann, A.; Kats, D.; Köhn, A.; Korona, T.; Kreplin, D.A.; et al. The Molpro quantum chemistry package. J. Chem. Phys. 2020, 152. [Google Scholar] [CrossRef] [PubMed]
  17. Werner, H.-J.; Knowles, P.J.; Knizia, G.; Manby, F.R.; Schütz, M. Molpro: A general-purpose quantum chemistry program package. WIREs Comput. Mol. Sci. 2012, 2, 242–253. [Google Scholar] [CrossRef]
  18. Werner, H.-J.; Knowles, P.J.; Celani, P.; Györffy, W.; Hesselmann, A.; Kats, D.; Knizia, G.; Köhn, A.; Korona, T.; Kreplin, D.; et al. MOLPRO, Version, a Package of ab Initio Programs. Available online: https://www.molpro.net (accessed on 3 July 2024).
Figure 1. Configuration of the high-temperature flow reactor used in the study of reaction (1).
Molecules 29 03636 g001
Figure 2. Concentration of the products, HF and C2H3SF, formed in reaction (1) as a function of the consumed concentration of the reactants, C2H4S and F2: (a) T = 220 K; (b) T = 298 K; (c) T = 500 K; and (d) T = 800 K.
Molecules 29 03636 g002
Figure 3. Geometries of the reactants and C2H3SF isomers/conformers optimized at the MP2/aug-cc-pVTZ level of theory. Sulfur atoms are yellow, fluorine in blue, carbon atoms in dark gray and hydrogen in light gray.
Molecules 29 03636 g003
Figure 4. Example of the kinetics of C2H4S consumption in reaction (1) at different concentrations of F2 observed at T = 325 K.
Molecules 29 03636 g004
Figure 5. Pseudo-first-order rate constant, k1′ = k1 × [F2], as a function of F2 concentration at different temperatures: (a) T = 220 and 325 K; (b) T = 500 and 800 K.
Molecules 29 03636 g005
Figure 6. Pseudo-first-order rate constant, k1′ = k1 × [C2H4S], as a function of C2H4S concentration observed at T = 420 and 625 K.
Molecules 29 03636 g006
Figure 7. Temperature dependence of the rate constant of reaction (1). Partially shown error bars correspond to estimated total uncertainty of 15% on the measurements of k1.
Molecules 29 03636 g007
Table 1. Experimental conditions and results of the measurements of HF yield in reaction (1).
T (K)[C2H4S]0 aΔ[F2] bΔ[HF]/Δ[C2H4S] cΔ[HF]/Δ[F2] d
2203.5–3.80.18–1.801.04 ± 0.011.01±0.01
2534.5–5.00.12–2.081.02 ± 0.011.01±0.01
2983.2–5.00.19–2.071.01 ± 0.021.01±0.01
3254.5–5.00.15–2.041.06 ± 0.011.05 ± 0.01
3602.0–3.80.09–1.510.98 ± 0.010.95 ± 0.01
5003.1–3.50.10–1.091.01 ± 0.011.00 ± 0.01
6702.0–2.50.08–0.721.02 ± 0.011.00 ± 0.01
8003.32–4.00.10–1.890.97 ± 0.010.96 ± 0.01
a Initial concentration of C2H4S (units of 1013 molecule cm−3); b consumed concentration of F2 (units of 1013 cm3 molecule−1 s−1); c ratio of [HF] formed to [C2H4S] consumed; d ratio of [HF] formed to [F2] consumed. For HF yield statistical 2σ uncertainty is given, total estimated uncertainty is 10%.
Table 2. Summary of the enthalpies (in kJ/mol, including the ZPE correction), Gibbs free energies and Boltzmann population for the isomers and conformers at temperature of 298, 500 and 1000 K, computed at the CCSD(T)-CBS/(aug-cc-pVTZ:aug-cc-pVQZ)//MP2/aug-cc-pVTZ level.
Molecule∆G (kJ/mol)∆H (kJ/mol)Boltzmann Population T = 298 KBoltzmann Population T = 500 KBoltzmann Population T = 1000 K
1-fluoroethenethiol−470.7−473.12.0 × 10−71.0 × 10−49.8 × 10−3
Cis-2-fluoroethenethiol−467.1−467.82.4 × 10−82.9 × 10−55.2 × 10−3
Ethenylthyohypofluorite−409.9−411.33.0 × 10−183.6 × 10−115.9 × 10⁻⁶
Fluoroethanethiol−456.3−456.62.6 × 10−101.9 × 10−61.4 × 10−3
Fluorothiirane−462.0−466.21.3 × 10−82.0 × 10−54.3 × 10−3
Thioacetylfluoride−509.1−511.3119.8 × 10−1
Trans-2-fluoroethenethiol−463.4−465.59.3 × 10−91.6 × 10−54.0 × 10−3
Table 3. Summary of the measurements of the rate constant of reaction (1).
T (K) aExcess Reactant[Excess Reactant] bk1(±2σ) cReactor Surface d
220F20.52–5.356.30 ± 0.08HW
235F20.39–4.706.28 ± 0.09HW
253F20.39–5.536.15 ± 0.06HW
265C2H4S0.24–4.826.34 ± 0.05HW
275F20.30–4.606.06 ± 0.06HW
298F20.36–5.455.92 ± 0.07HW
315C2H4S0.23–2.316.22 ± 0.09Q
325F20.18–5.245.91 ± 0.09HW
340F20.20–4.006.00 ± 0.06Q
360F20.36–4.026.03 ± 0.07Q
390F20.35–4.686.13 ± 0.10Q
420C2H4S0.22–1.945.87 ± 0.05Q
460F20.36–3.696.06 ± 0.12Q
500F20.29–3.195.86 ± 0.06Q
560F20.22–3.305.83 ± 0.11Q
625C2H4S0.18–1.736.07 ± 0.06Q
710F20.21–2.886.03 ± 0.09Q
800F20.27–2.515.99 ± 0.06Q
a 8–12 decay traces at each temperature; b units of 1013 molecule cm−3; c units of 10−12 cm3 molecule−1 s−1, statistical 2σ uncertainty is given, total estimated uncertainty of k1 is 15%; d HW: halocarbon wax; Q: quartz.
Disclaimer/Publisher’s Note: The statements, opinions and data contained in all publications are solely those of the individual author(s) and contributor(s) and not of MDPI and/or the editor(s). MDPI and/or the editor(s) disclaim responsibility for any injury to people or property resulting from any ideas, methods, instructions or products referred to in the content.