
Fast Determination of Eleven Food Additives in River Water Using C18 Functionalized Magnetic Organic Polymer Nanocomposite Followed by High-Performance Liquid Chromatography


Abstract
:1. Introduction
2. Results and Discussion
2.1. Characterization of C18−PS−DVB−Fe3O4
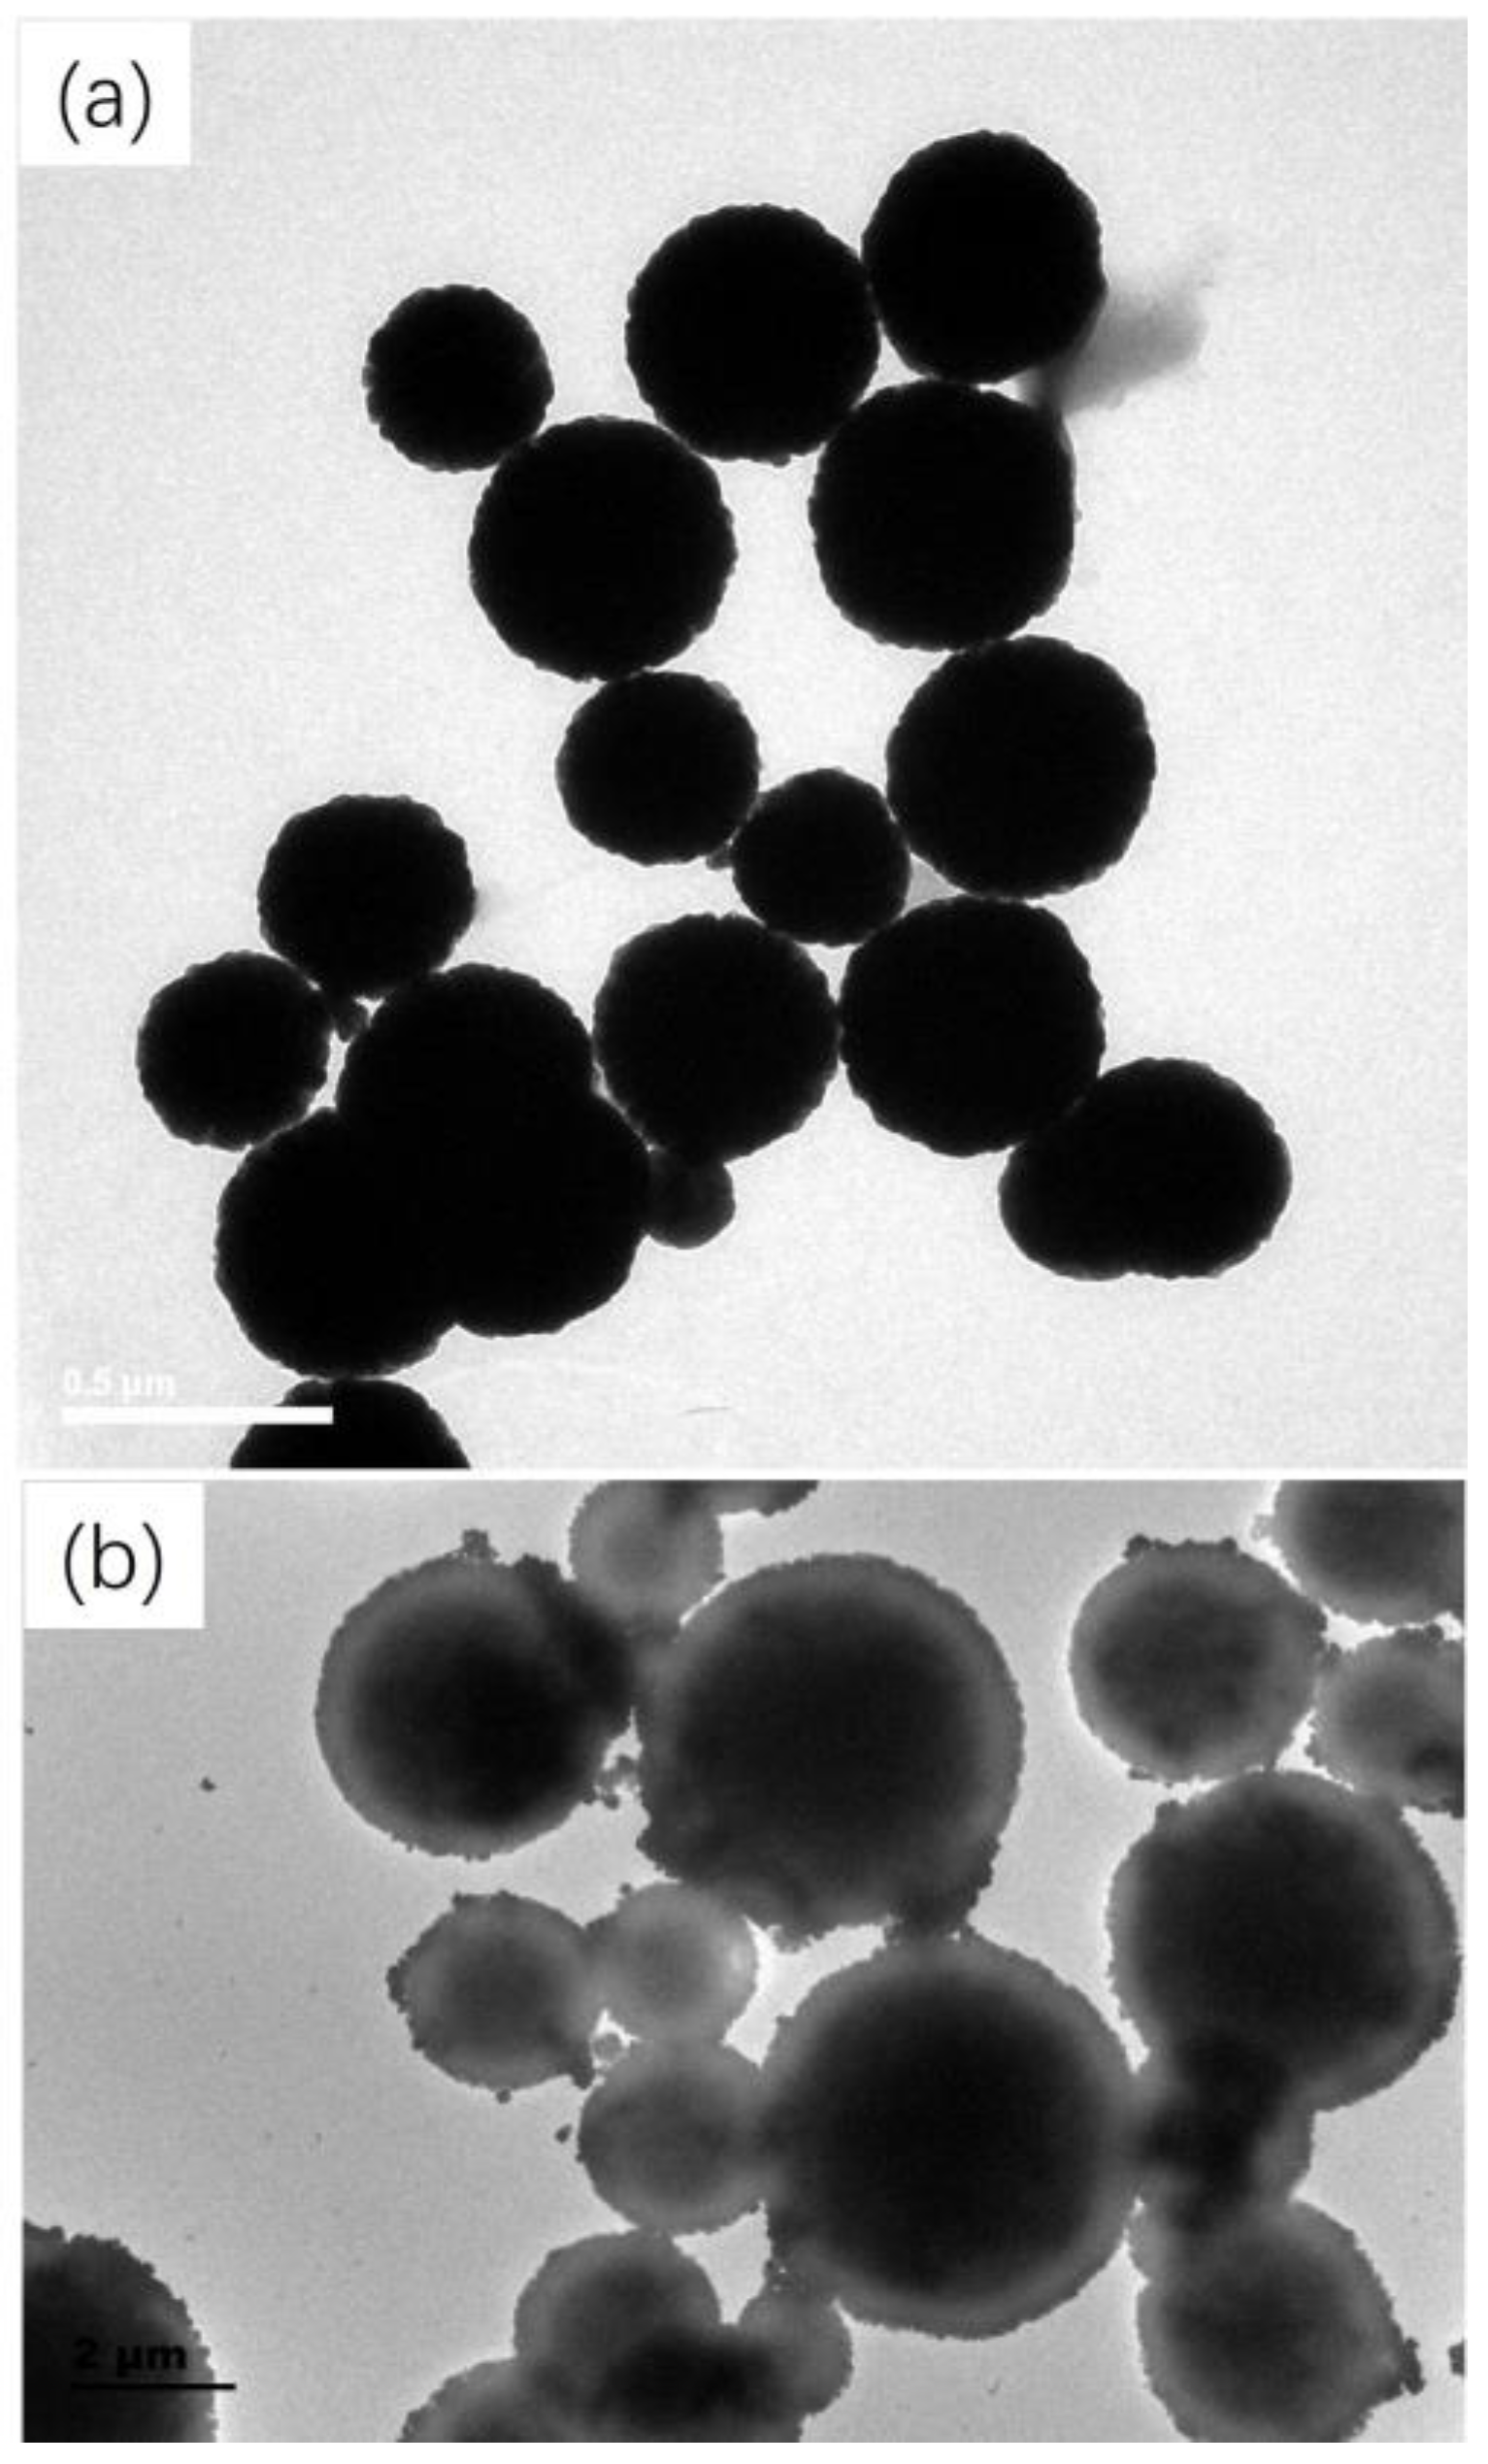
2.1.1. Morphological Characteristics
2.1.2. Magnetic Property
2.1.3. XPS Analysis
2.1.4. Specific Surface Area Analysis
2.1.5. FTIR Analysis
2.1.6. Nitrogen Content Analysis
2.2. C18−PS−DVB−Fe3O4 Mag-dSPE Procedure and Its Optimization
2.2.1. Optimization of Elution Solvent
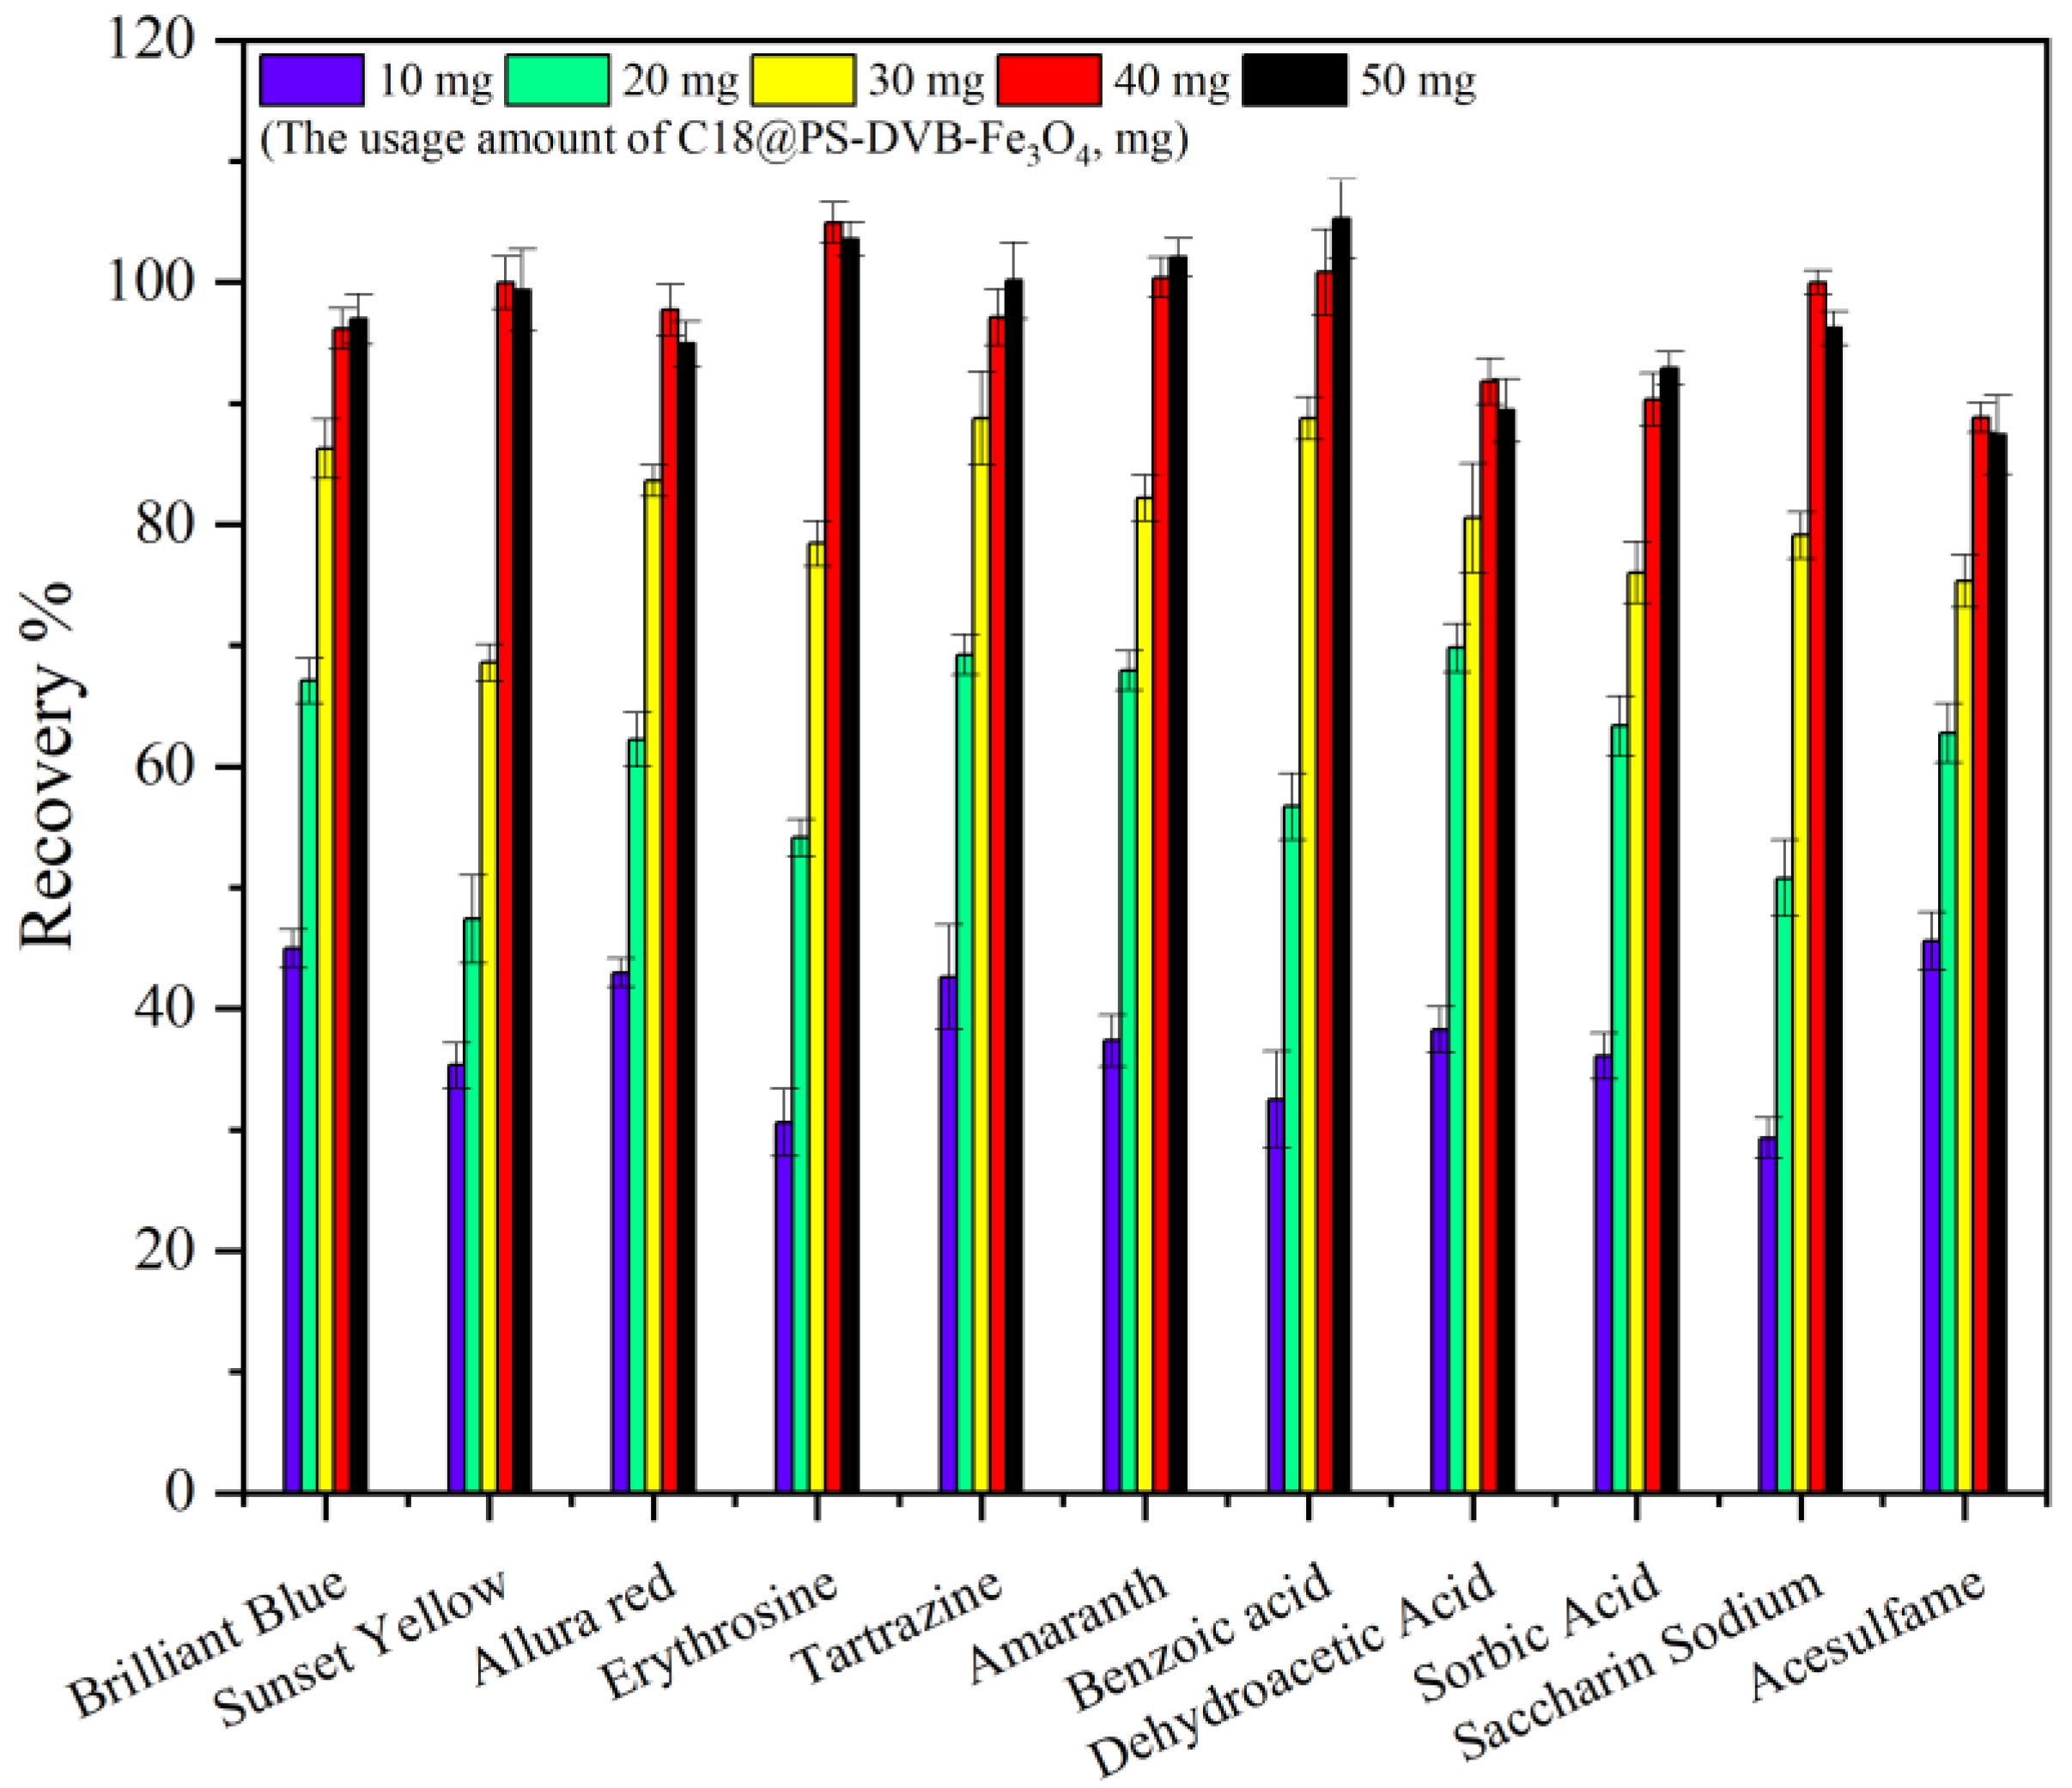
2.2.2. Optimization of Adsorbent Dosage
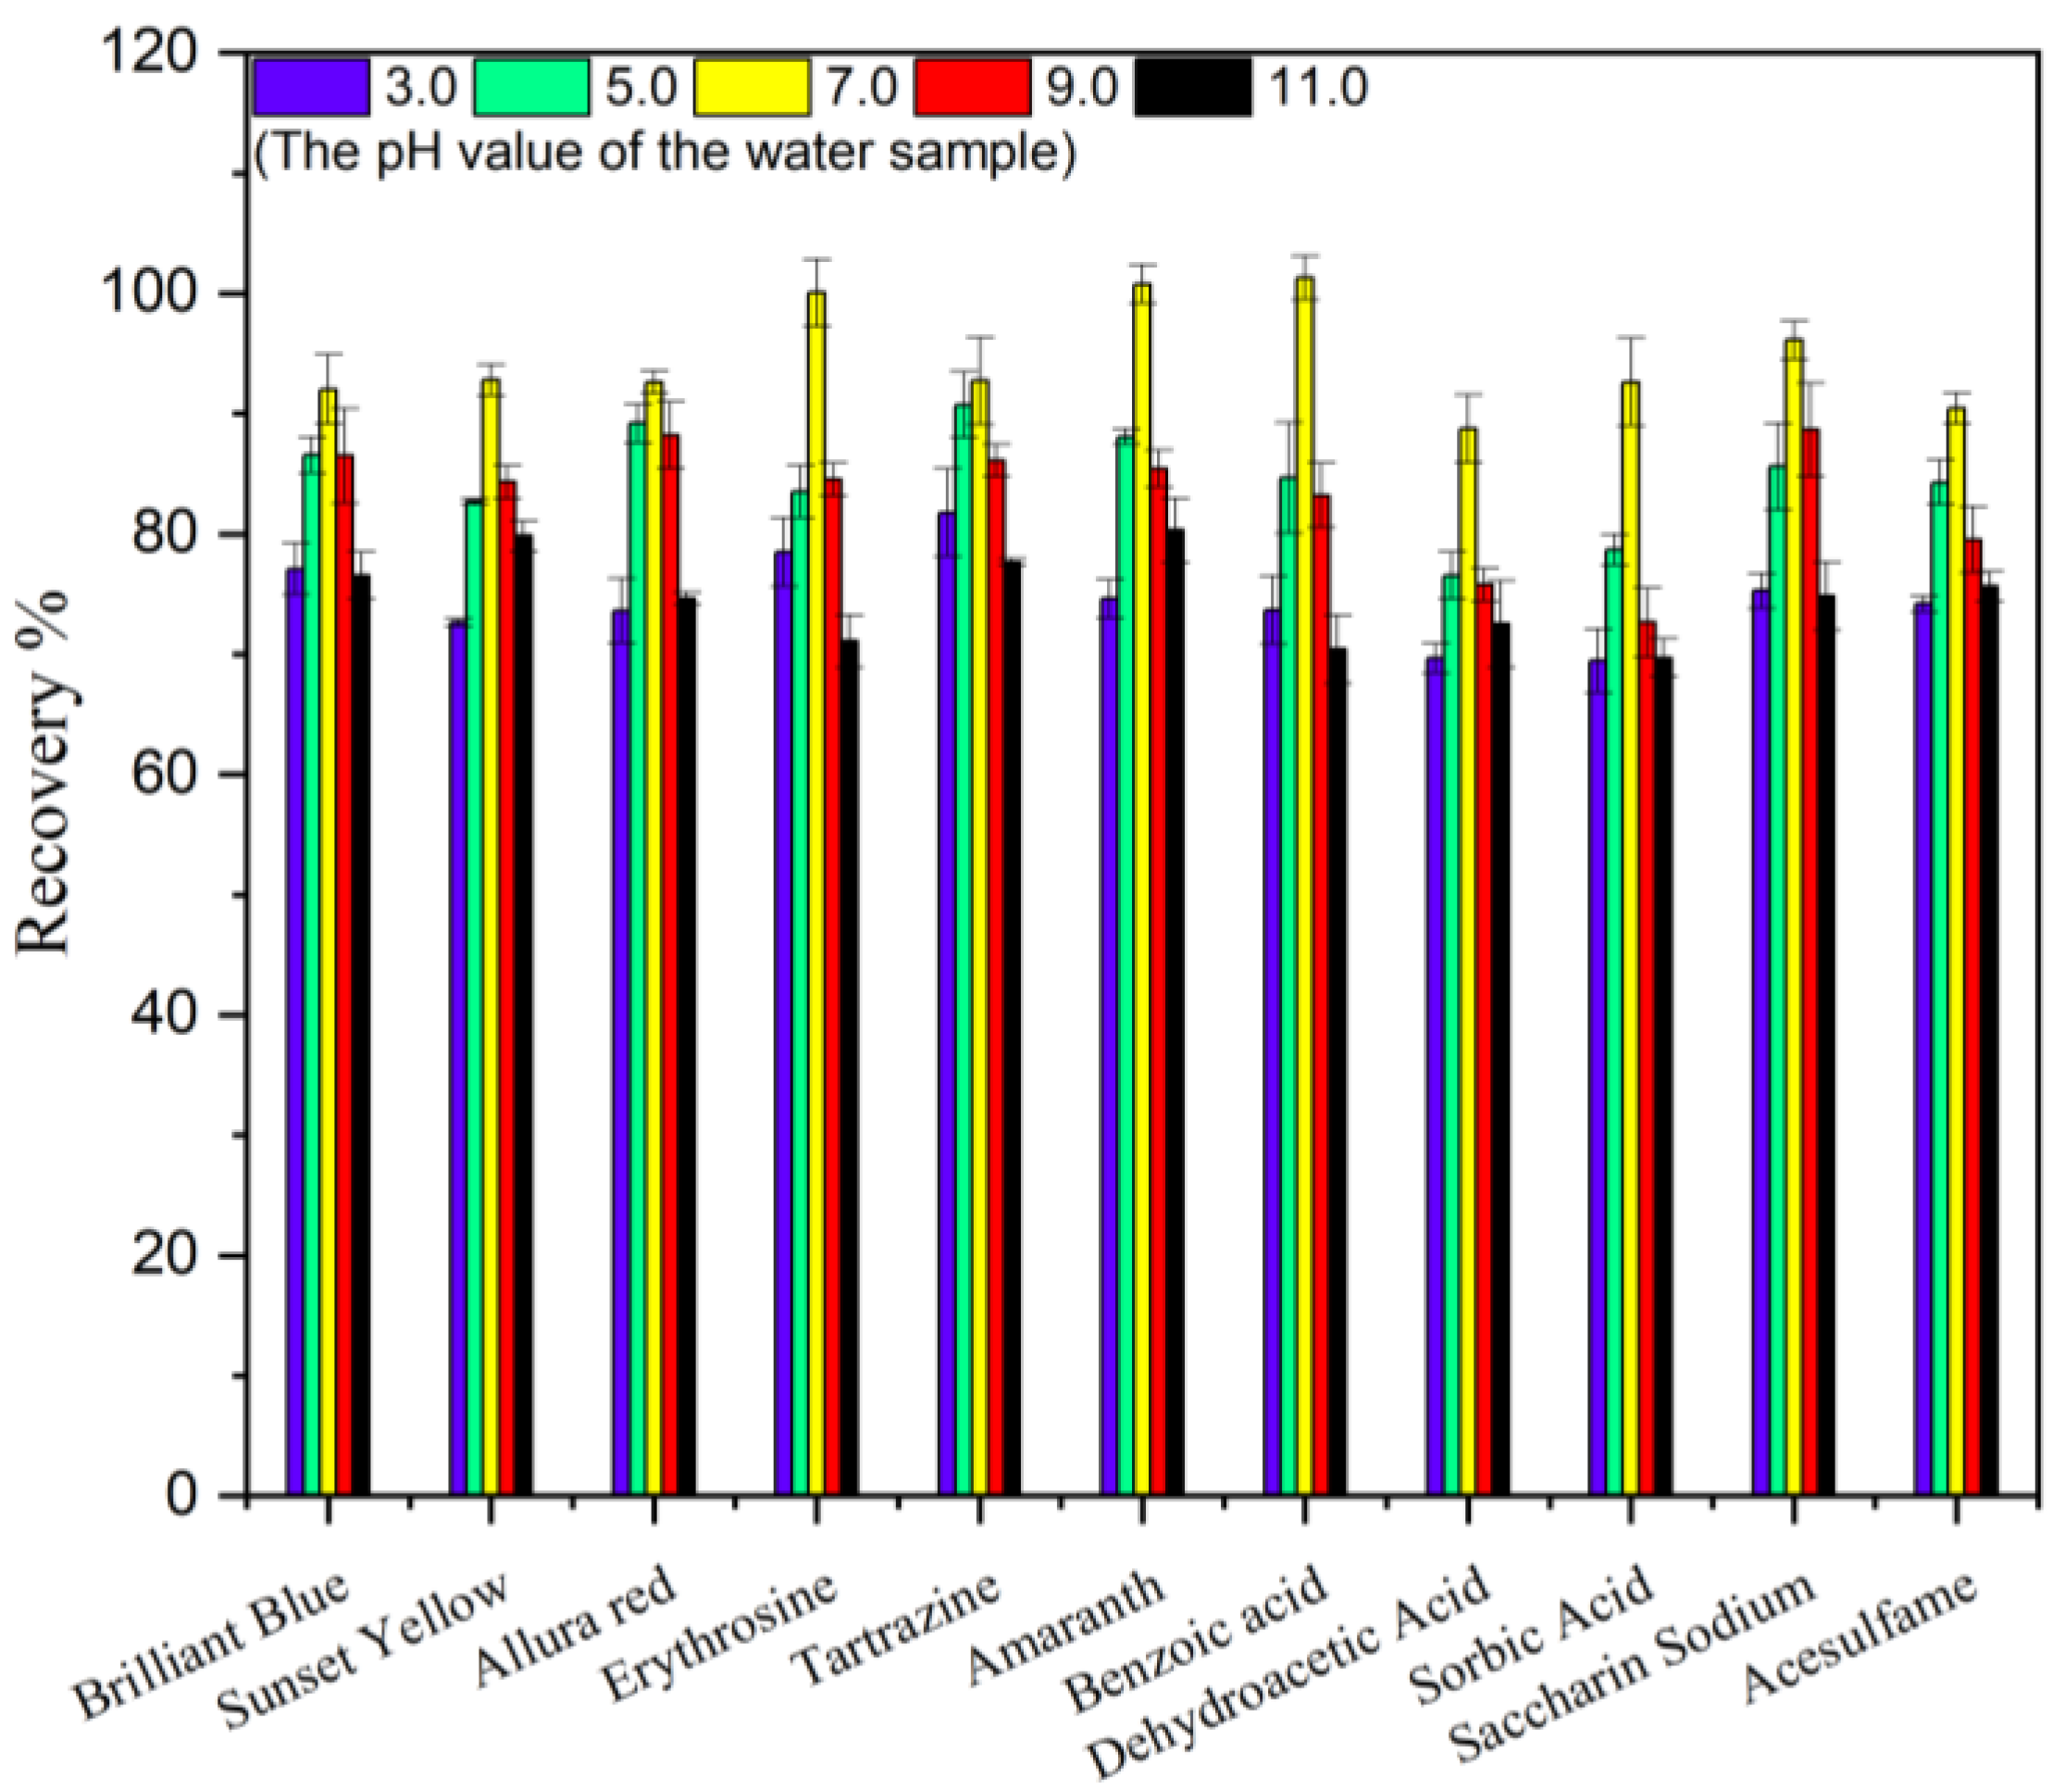
2.2.3. Optimization pH of Water Sample
2.2.4. Optimization of Volume of Water Sample
2.3. Analytical Performance of the Method
2.4. Regeneration and Reproducibility of C18−PS−DVB−Fe3O4
2.5. Method Validation and Real Sample Analysis
2.6. Compared with Other Methods
3. Experimental
3.1. Reagents and Materials
3.2. Equipment
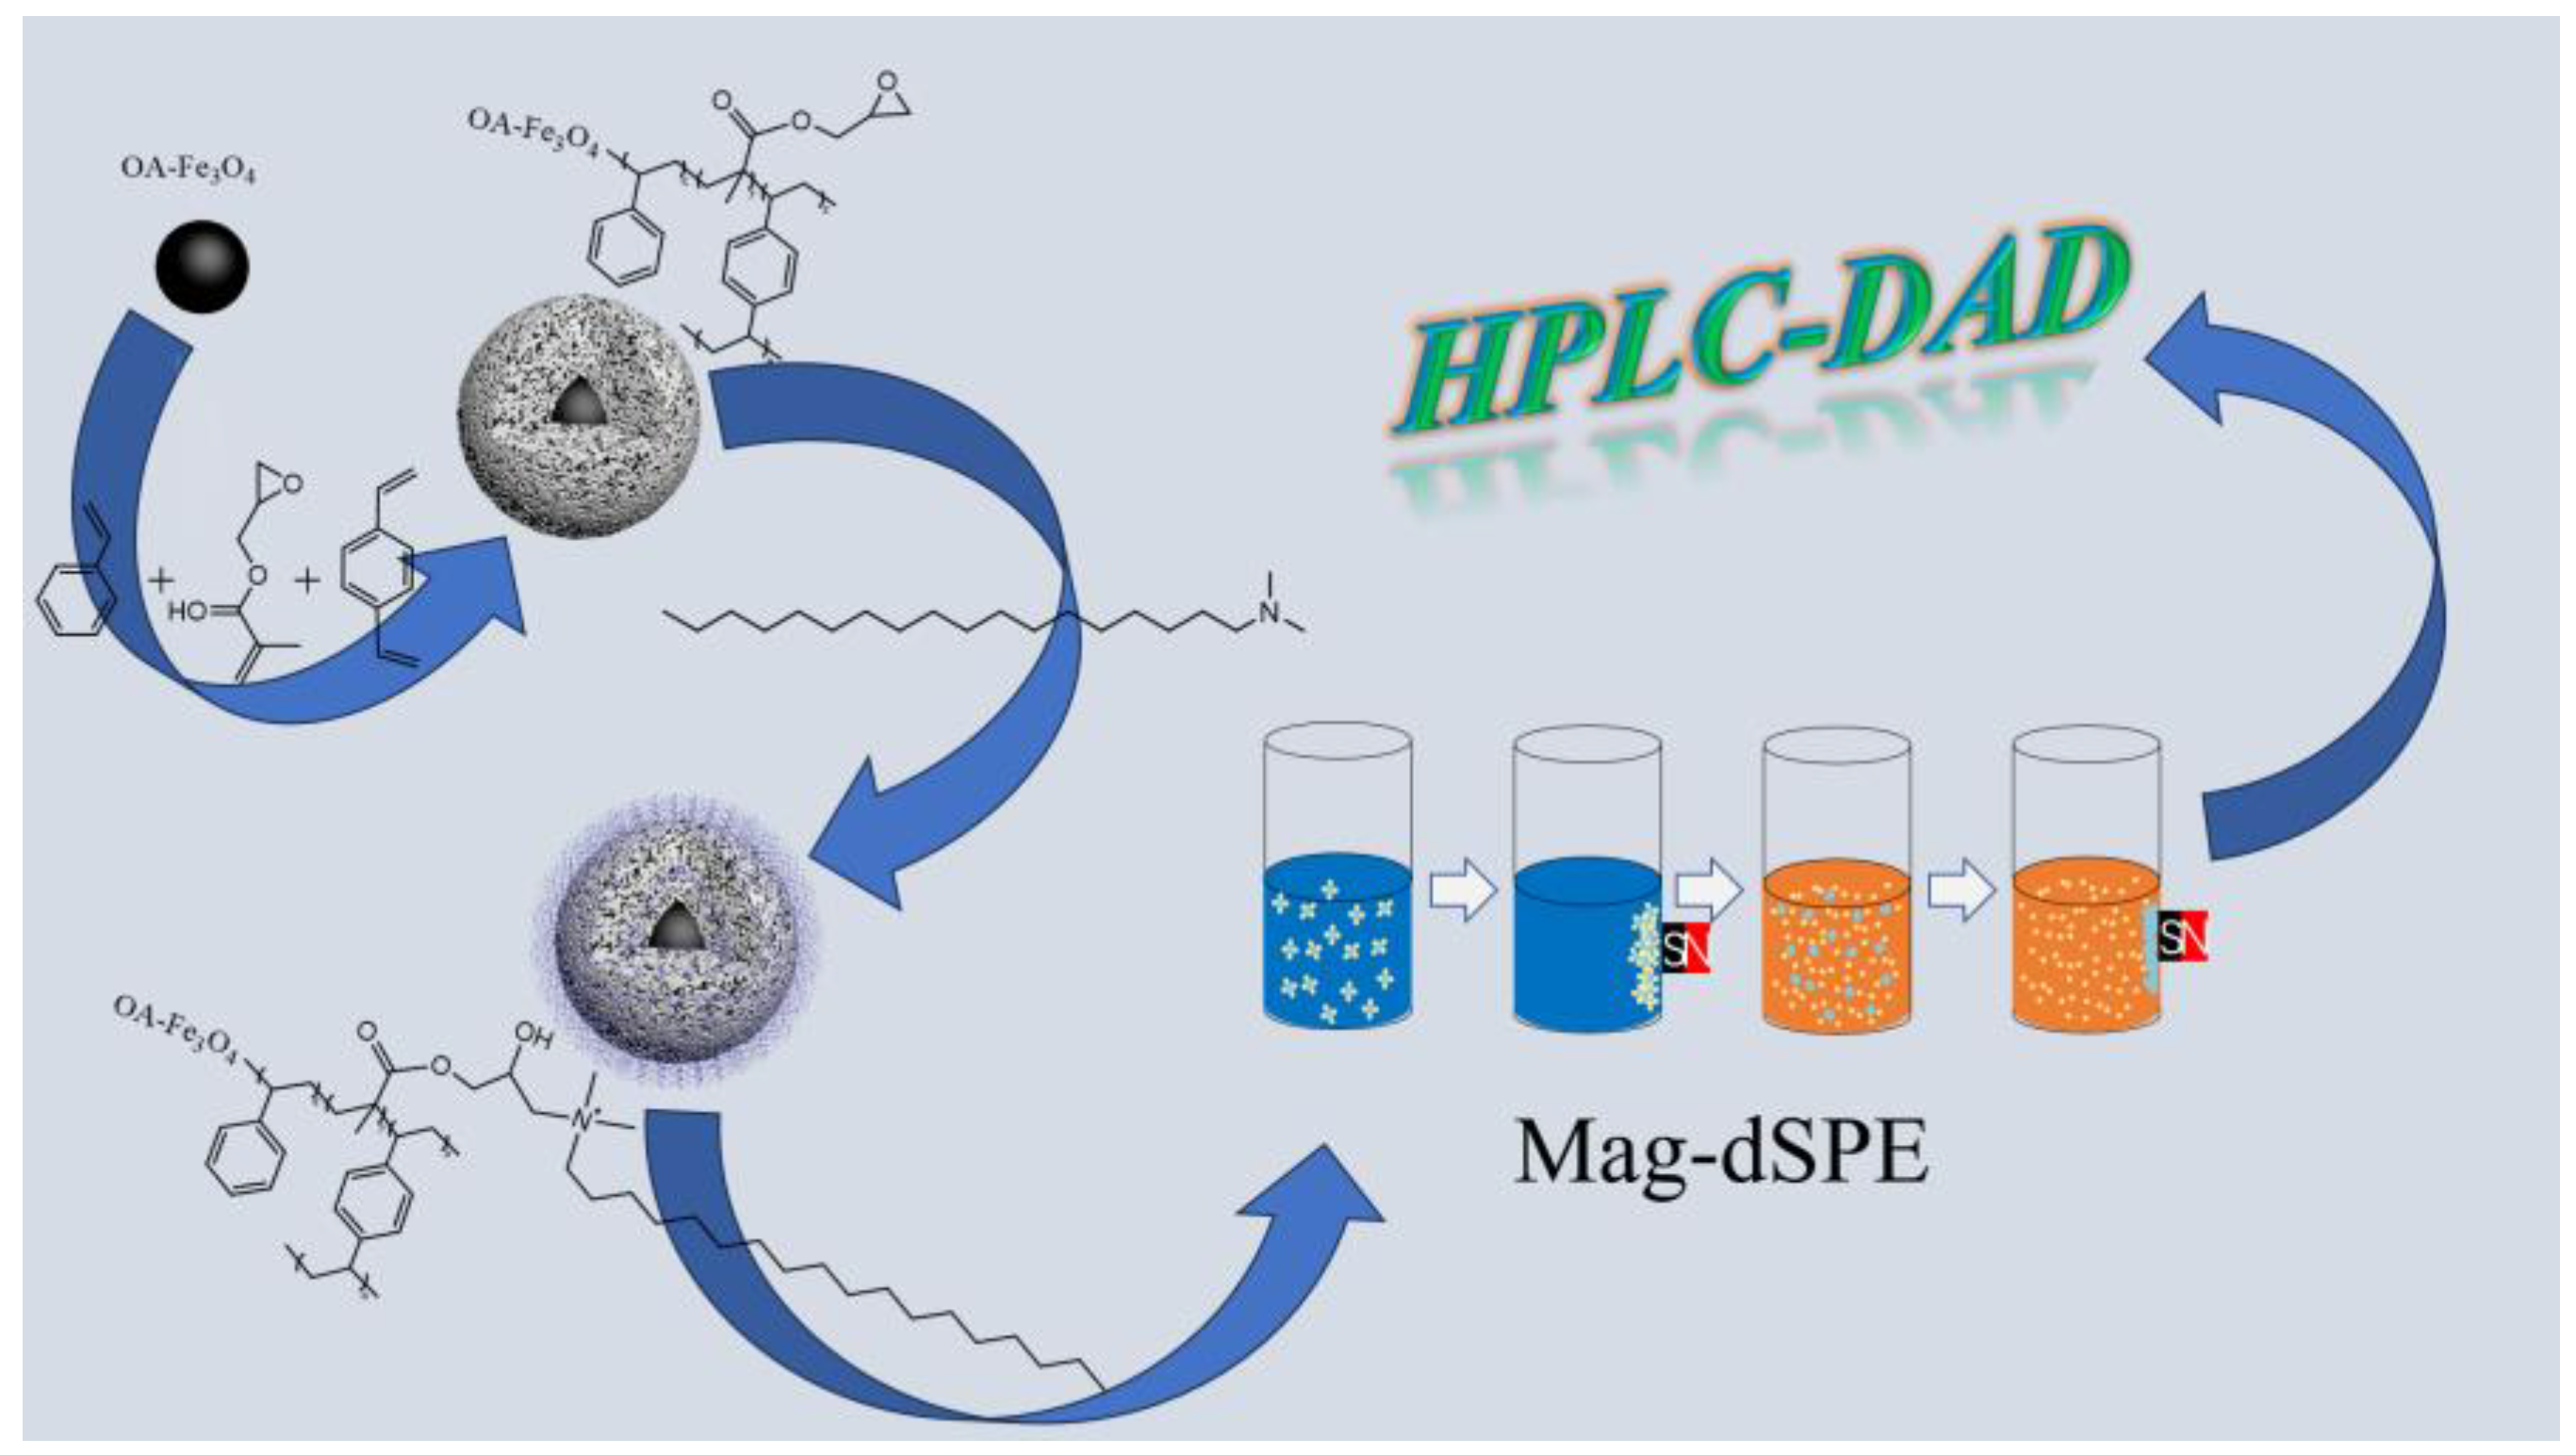
3.3. Synthesis of PS−DVB−Fe3O4
3.3.1. Synthesis of Fe3O4
3.3.2. OA Coated Fe3O4 Nanoparticles
3.3.3. Synthesis of PS−DVB−Fe3O4
3.3.4. Synthesis of C18−PS−DVB−Fe3O4
3.4. HPLC-DAD Analysis
3.5. Method Validation
3.5.1. Standard Preparation
3.5.2. Mag-dSPE Procedure
3.5.3. Validation Parameters
4. Conclusions
Supplementary Materials
Author Contributions
Funding
Institutional Review Board Statement
Informed Consent Statement
Data Availability Statement
Conflicts of Interest
References
- Sharafati Chaleshtori, R.; Golsorkhi, F. Determination of synthetic colors in some locally available foods of kashan city, Iran. Int. Arch. Health Sci. 2016, 3, 61–66. [Google Scholar] [CrossRef]
- Minioti, K.S.; Sakellariou, C.F.; Thomaidis, N.S. Determination of 13 synthetic food colorants in water-soluble foods by reversed-phase high-performance liquid chromatography coupled with diode-array detector. Anal. Chim. Acta 2007, 583, 103–110. [Google Scholar] [CrossRef]
- Palianskikh, A.I.; Sychik, S.I.; Leschev, S.M.; Pliashak, Y.M.; Fiodarava, T.A.; Belyshava, L.L. Development and validation of the HPLC-DAD method for the quantification of 16 synthetic dyes in various foods and the use of liquid anion exchange extraction for qualitative expression determination. Food Chem. 2022, 369, 130947. [Google Scholar] [CrossRef] [PubMed]
- Nowak, P.M. Simultaneous quantification of food colorants and preservatives in sports drinks by the high performance liquid chromatography and capillary electrophoresis methods evaluated using the red-green-blue model. J. Chromatogr. A 2020, 1620, 460976. [Google Scholar] [CrossRef] [PubMed]
- Jung, H.J.; Song, Y.S.; Kim, K.; Lim, C.J.; Park, E.H. Assessment of the anti-angiogenic, anti-inflammatory and antinociceptive properties of ethyl vanillin. Arch. Pharm. Res. 2010, 33, 309–316. [Google Scholar] [CrossRef]
- Floriano, J.M.; da Rosa, E.; do Amaral, Q.D.F.; Zuravski, L.; Chaves, P.E.E.; Machado, M.M.; de Oliveira, L.F.S. Is tartrazine really safe? In silico and ex vivo toxicological studies in human leukocytes: A question of dose. Toxicol Res. 2018, 7, 1128–1134. [Google Scholar] [CrossRef] [PubMed]
- Esimbekova, E.N.; Asanova, A.A.; Deeva, A.A.; Kratasyuk, V.A. Inhibition effect of food preservatives on endoproteinases. Food Chem. 2017, 235, 294–297. [Google Scholar] [CrossRef]
- Lakshmi, U.R.; Srivastava, V.C.; Mall, I.D.; Lataye, D.H. Rice husk ash as an effective adsorbent: Evaluation of adsorptive characteristics for indigo carmine dye. J. Environ. Manag. 2009, 90, 710–720. [Google Scholar] [CrossRef]
- Ma, Y.; Zhang, G.; Pan, J. Spectroscopic studies of DNA interactions with food colorant indigo carmine with the use of ethidium bromide as a fluorescence probe. J. Agric. Food Chem. 2012, 60, 10867–10875. [Google Scholar] [CrossRef]
- Chauhan, S.S.; Sachan, D.K.; Parthasarathi, R. FOCUS-DB: An online comprehensive database on food additive safety. J. Chem. Inf. Model. 2021, 61, 202–210. [Google Scholar] [CrossRef]
- Alreda Akkar, S.A.; Muslim Mohammed, S.A. The feasibility of emulsion liquid membrane for the extraction of organic acids from wastewater. IOP Conf. Ser. Mater. Sci. Eng. 2021, 1076, 012021. [Google Scholar]
- Brauch, H.-J.; Remmler, F.; Skark, C.; Storck, F.R. Environmental fate and behavior of acesulfame in laboratory experiments. Water Sci. Technol. 2016, 74, 2832–2842. [Google Scholar]
- Soylak, M.; Unsal, Y.E.; Tuzen, M. Spectrophotometric determination of trace levels of allura red in water samples after separation and preconcentration. Food Chem. Toxicol. 2011, 49, 1183–1187. [Google Scholar] [CrossRef] [PubMed]
- Zhang, H.; Cheng, M.; Jiang, X. Determination of benzoic acid in water samples by ionic liquid cold-induced aggregation dispersive LLME coupling with LC. Chromatographia 2010, 72, 1195–1199. [Google Scholar] [CrossRef]
- Arbelaez, P.; Borrull, F.; Pocurull, E.; Marce, R.M. Determination of high-intensity sweeteners in river water and wastewater by solid-phase extraction and liquid chromatography-tandem mass spectrometry. J. Chromatogr. A 2015, 1393, 106–114. [Google Scholar] [CrossRef] [PubMed]
- Wu, M.; Qian, Y.; Boyd, J.M.; Hrudey, S.E.; Le, X.C.; Li, X.F. Direct large volume injection ultra-high performance liquid chromatography-tandem mass spectrometry determination of artificial sweeteners sucralose and acesulfame in well water. J. Chromatogr. A 2014, 1359, 156–161. [Google Scholar] [CrossRef] [PubMed]
- Boyaci, E.; Gorynski, K.; Viteri, C.R.; Pawliszyn, J. A study of thin film solid phase microextraction methods for analysis of fluorinated benzoic acids in seawater. J. Chromatogr. A 2016, 1436, 51–58. [Google Scholar] [CrossRef] [PubMed]
- Imanulkhan Setyaningsih, W.; Rohman, A.; Palma, M. Development and validation of HPLC-DAD method for simultaneous determination of seven food additives and caffeine in powdered drinks. Foods 2020, 9, 1119. [Google Scholar] [CrossRef] [PubMed]
- Jang, G.W.; Choi, S.I.; Choi, S.H.; Han, X.; Men, X.; Kwon, H.Y.; Choi, Y.E.; Lee, O.H. Method validation of 12 kinds of food dye in chewing gums and soft drinks, and evaluation of measurement uncertainty for soft drinks. Food Chem. 2021, 356, 129705. [Google Scholar] [CrossRef]
- Aksu Donmez, O.; Dinc-Zor, S.; Asci, B.; Bozdogan, A.E. Quantitative analysis of food additives in a beverage using high performance liquid chromatography and diode array detection coupled with chemometrics. J. AOAC Int. 2020, 103, 779–783. [Google Scholar] [CrossRef]
- Timofeeva, I.; Kanashina, D.; Stepanova, K.; Bulatov, A. A simple and highly-available microextraction of benzoic and sorbic acids in beverages and soy sauce samples for high performance liquid chromatography with ultraviolet detection. J. Chromatogr. A 2019, 1588, 1–7. [Google Scholar] [CrossRef] [PubMed]
- So, J.S.; Lee, S.B.; Lee, J.H.; Nam, H.S.; Lee, J.K. Simultaneous determination of dehydroacetic acid, benzoic acid, sorbic acid, methylparaben and ethylparaben in foods by high-performance liquid chromatography. Food Sci. Biotechnol. 2023, 32, 1173–1183. [Google Scholar] [CrossRef] [PubMed]
- Tungkijanansin, N.; Alahmad, W.; Nhujak, T.; Varanusupakul, P. Simultaneous determination of benzoic acid, sorbic acid, and propionic acid in fermented food by headspace solid-phase microextraction followed by GC-FID. Food Chem. 2020, 329, 127161. [Google Scholar] [CrossRef] [PubMed]
- Dudkina, A.A.; Volgina, T.N.; Saranchina, N.V.; Gavrilenko, N.A.; Gavrilenko, M.A. Colorimetric determination of food colourants using solid phase extraction into polymethacrylate matrix. Talanta 2019, 202, 186–189. [Google Scholar] [CrossRef] [PubMed]
- Qin, P.; Yang, Y.; Li, W.; Zhang, J.; Zhou, Q.; Lu, M. Amino-functionalized mesoporous silica nanospheres (MSN-NH2) as sorbent for extraction and concentration of synthetic dyes from foodstuffs prior to HPLC analysis. Anal. Methods 2019, 11, 105–112. [Google Scholar] [CrossRef]
- Hatamluyi, B.; Sadeghian, R.; Malek, F.; Boroushaki, M.T. Improved solid phase extraction for selective and efficient quantification of sunset yellow in different food samples using a novel molecularly imprinted polymer reinforced by Fe3O4@UiO-66-NH2. Food Chem. 2021, 357, 129782. [Google Scholar] [CrossRef] [PubMed]
- Luna Quinto, M.; Khan, S.; Picasso, G.; Taboada Sotomayor, M.D.P. Synthesis, characterization, and evaluation of a selective molecularly imprinted polymer for quantification of the textile dye acid violet 19 in real water samples. J. Hazard. Mater. 2020, 384, 121374. [Google Scholar] [CrossRef] [PubMed]
- Zhang, Y.; Zhou, H.; Wang, Y.; Wu, X.; Zhao, Y. Simultaneous determination of seven synthetic colorants in wine by dispersive micro-solid-phase extraction coupled with reversed-phase high-performance liquid chromatography. J. Chromatogr. Sci. 2015, 53, 210–218. [Google Scholar] [CrossRef] [PubMed]
- Zygler, A.; Wasik, A.; Namieśnik, J. Analytical methodologies for determination of artificial sweeteners in foodstuffs. TrAC Trend. Anal. Chem. 2009, 28, 1082–1102. [Google Scholar] [CrossRef]
- Dourado, C.S.; Domingues, I.F.F.; de Oliveira Magalhaes, L.; Casarin, F.; Ribeiro, M.L.; Braga, J.W.B.; Dias, A.C.B. Optimization of a saccharin molecularly imprinted solid-phase extraction procedure and evaluation by MIR hyperspectral imaging for analysis of diet tea by HPLC. Food Chem. 2022, 367, 130732. [Google Scholar] [CrossRef]
- Mejia, E.; Ding, Y.; Mora, M.F.; Garcia, C.D. Determination of banned sudan dyes in chili powder by capillary electrophoresis. Food Chem. 2007, 102, 1027–1033. [Google Scholar] [CrossRef]
- Hu, K.; Qiao, J.; Zhu, W.; Chen, X.; Dong, C. Magnetic naphthalene-based polyimide polymer for extraction of sudan dyes in chili sauce. Microchem. J. 2019, 149, 104073. [Google Scholar] [CrossRef]
- Khoshmaram, L.; Saadati, M.; Sadeghi, F. Magnetic solid-phase extraction and a portable photocolourimeter using a multi-colour light emitting diode for on-site determination of nitrite. Microchem. J. 2020, 152, 104344. [Google Scholar] [CrossRef]
- Liu, W.X.; Song, S.; Ye, M.L.; Zhu, Y.; Zhao, Y.G.; Lu, Y. Nanomaterials with excellent adsorption characteristics for sample pretreatment: A review. Nanomaterials 2022, 12, 1845. [Google Scholar] [CrossRef] [PubMed]
- Khani, R.; Irani, M. Mixed magnetic dispersive micro-solid phase–cloud point extraction of sunset yellow in food and pharmaceutical samples. Chem. Sel. 2021, 6, 273–278. [Google Scholar] [CrossRef]
- Chen, H.; Deng, X.; Ding, G.; Qiao, Y. The synthesis, adsorption mechanism and application of polyethyleneimine functionalized magnetic nanoparticles for the analysis of synthetic colorants in candies and beverages. Food Chem. 2019, 293, 340–347. [Google Scholar] [CrossRef] [PubMed]
- Pang, Y.H.; Yue, Q.; Huang, Y.Y.; Yang, C.; Shen, X.F. Facile magnetization of covalent organic framework for solid-phase extraction of 15 phthalate esters in beverage samples. Talanta 2020, 206, 120194. [Google Scholar] [CrossRef] [PubMed]
- Jiang, H.; Li, N.; Cui, L.; Wang, X.; Zhao, R. Recent application of magnetic solid phase extraction for food safety analysis. TrAC Trend. Anal. Chem. 2019, 120, 115632. [Google Scholar] [CrossRef]
- Fu, X.; Zhu, D.; Huang, L.; Yan, X.; Liu, S.; Wang, C. Superparamagnetic core-shell dummy template molecularly imprinted polymer for magnetic solid-phase extraction of food additives prior to the determination by HPLC. Microchem. J. 2019, 150, 104169. [Google Scholar] [CrossRef]
- Li, P.; Huang, D.; Huang, J.; Tang, J.; Zhang, P.; Meng, F. Development of magnetic porous carbon nano-fibers for application as adsorbents in the enrichment of trace Sudan dyes in foodstuffs. J. Chromatogr. A 2020, 1625, 461305. [Google Scholar] [CrossRef]
- Dopico-Garcia, M.S.; Lopez-Vilarino, J.M.; Gonzalez-Rodriguez, M.V. Determination of antioxidants by solid-phase extraction method in aqueous food simulants. Talanta 2005, 66, 1103–1107. [Google Scholar] [CrossRef] [PubMed]
- Gao, Y.; Gu, Y.; Wei, Y. Determination of polymer additives-antioxidants and ultraviolet (UV) absorbers by high-performance liquid chromatography coupled with UV photodiode array detection in food simulants. J. Agric. Food Chem. 2011, 59, 12982–12989. [Google Scholar] [CrossRef] [PubMed]
- Zhang, D.; Liu, C.; Yang, Y.L. Determination of UV absorbers and light stabilizers in food packing bags by magnetic solid phase extraction followed by high performance liquid chromatography. Chromatographia 2016, 79, 45–52. [Google Scholar] [CrossRef]
- Li, W.J.; Zhou, X.; Tong, S.S.; Jia, Q. Poly(N-isopropylacrylamide-co-N,N′-methylene bisacrylamide) monolithic column embedded with gamma-alumina nanoparticles microextraction coupled with high-performance liquid chromatography for the determination of synthetic food dyes in soft drink samples. Talanta 2013, 105, 386–392. [Google Scholar] [CrossRef] [PubMed]
- Wang, X.; Chen, N.; Han, Q.; Yang, Z.; Wu, J.; Xue, C.; Hong, J.; Zhou, X.; Jiang, H. Selective separation and determination of the synthetic colorants in beverages by magnetic solid-phase dispersion extraction based on a Fe3O4/reduced graphene oxide nanocomposite followed by high-performance liquid chromatography with diode array detection. J. Sep. Sci. 2015, 38, 2167–2173. [Google Scholar]
- Wang, J.; Zhang, L.; Xin, D.; Yang, Y. Dispersive micro-solid-phase extraction based on decanoic acid coated-Fe3O4 nanoparticles for HPLC analysis of phthalate esters in liquor samples. J. Food Sci. 2015, 80, 2452–2458. [Google Scholar] [CrossRef]
- Liu, W.X.; Zhou, W.N.; Song, S.; Zhao, Y.G.; Lu, Y. Preparation and Characterization of Nano-Fe3O4 and Its Application for C18-Functionalized Magnetic Nanomaterials Used as Chromatographic Packing Materials. Nanomaterials 2023, 13, 1111. [Google Scholar] [CrossRef]


| Material | Gross Mass (g) | N% | O% | Epoxy Group Content (mmol) | N, N-Dimethyloctadecylamine |
|---|---|---|---|---|---|
| PS−DVB−Fe3O4 | 1.0 | / | 12.23 | 2.546 | / |
| C18−PS−DVB−Fe3O4 | 1.0 | 1.45 | 8.46 | 1.766 | 1.035 |
| Target | Linear Range (μg/mL) | Linear Equation | R2 | LOD (μg/L) | LOQ (μg/L) |
|---|---|---|---|---|---|
| Acesulfame | 0.1–10 | Y = 22.86X + 7.068 | 0.9991 | 2.3 | 7.6 |
| Benzoic Acid | 0.1–10 | Y = 15.31X + 3.012 | 0.9994 | 2.0 | 6.6 |
| Sorbic Acid | 0.1–10 | Y = 20.27X + 5.462 | 0.9998 | 1.8 | 5.9 |
| Dehydroacetic Acid | 0.1–10 | Y = 6.585X + 8.065 | 0.9992 | 2.7 | 8.9 |
| Saccharin Sodium | 0.1–10 | Y = 7.042X + 1.530 | 0.9992 | 2.9 | 9.6 |
| Tartrazine | 0.1–10 | Y = 2.327X + 0.5170 | 0.9997 | 3.0 | 9.9 |
| Amaranth | 0.1–10 | Y = 15.720X + 1.708 | 0.9995 | 2.3 | 7.6 |
| Sunset Yellow | 0.1–10 | Y = 19.166X + 3.887 | 0.9995 | 1.2 | 4.0 |
| Allura Red | 0.1–10 | Y = 24.529X + 5.627 | 0.9993 | 0.6 | 2.0 |
| Brilliant Blue | 0.1–10 | Y = 18.27X + 1.075 | 0.9991 | 3.1 | 10.0 |
| Erythrosine | 0.1–10 | Y = 13.25X − 0.2473 | 0.9996 | 2.4 | 7.9 |
| Analytes | Sample Concentration (μg/L) | Added (μg/L) | Recovery % | RSD % | |
|---|---|---|---|---|---|
| Inter-Day | Intra-Day | ||||
| Acesulfame | — | 1.6 | 97.60 | 1.5 | 2.3 |
| 16.0 | 96.45 | 3.8 | 5.8 | ||
| 80.0 | 99.21 | 2.9 | 0.4 | ||
| Benzoic acid | 4.1 | 1.6 | 98.02 | 5.8 | 3.8 |
| 16.0 | 101.53 | 0.8 | 4.2 | ||
| 80.0 | 99.63 | 6.5 | 5.5 | ||
| Sorbic acid | — | 1.6 | 98.25 | 2.9 | 1.9 |
| 16.0 | 95.65 | 3.2 | 3.6 | ||
| 80.0 | 96.02 | 1.8 | 1.1 | ||
| Dehydroacetic acid | — | 1.6 | 102.31 | 2.9 | 1.6 |
| 1.6.0 | 106.32 | 3.7 | 4.2 | ||
| 80.0 | 105.27 | 4.1 | 5.9 | ||
| Saccharin Sodium | — | 1.6 | 98.24 | 5.8 | 1.3 |
| 16.0 | 97.35 | 1.9 | 5.1 | ||
| 80.0 | 100.62 | 4.1 | 4.8 | ||
| Tartrazine | — | 1.6 | 99.32 | 3.2 | 3.7 |
| 16.0 | 101.52 | 6.2 | 1.2 | ||
| 80.0 | 99.61 | 4.7 | 1.4 | ||
| Amaranth | — | 1.6 | 99.45 | 2.3 | 3.7 |
| 16.0 | 102.90 | 1.5 | 2.2 | ||
| 80.0 | 104.80 | 6.9 | 4.1 | ||
| Sunset Yellow | — | 1.6 | 91.40 | 8.8 | 2.7 |
| 16.0 | 90.55 | 4.7 | 5.6 | ||
| 80.0 | 93.93 | 3.6 | 0.5 | ||
| Allura Red | 1.2 | 1.6 | 93.90 | 1.1 | 5.5 |
| 16.0 | 94.77 | 3.9 | 3.8 | ||
| 80.0 | 95.63 | 2.3 | 1.2 | ||
| Brilliant Blue | — | 1.6 | 95.10 | 3.8 | 0.8 |
| 16.0 | 88.23 | 4.1 | 0.7 | ||
| 80.0 | 90.52 | 2.6 | 4.2 | ||
| Erythrosine | 7.0 | 1.6 | 89.71 | 1.3 | 4.8 |
| 16.0 | 86.53 | 1.7 | 0.9 | ||
| 80.0 | 87.84 | 7.5 | 3.4 | ||
| Sample | Sorbent | Detection Method | Recovery (%) | RSD (%) | LOD (μg/L) | Ref. |
|---|---|---|---|---|---|---|
| The aqueous food | Silica C18 cartridge | LC-DAD | 78–104% | 2.0–7.7 | 34,000–71,000 | [41] |
| Food packages | Silica C18 cartridge | HPLC-UV | 67.48–108.5% | 2.7–9.8 | 900–1720 | [42] |
| Plastic packaging | Fe3O4@CTAB | HPLC-UV | 84.5–98.9% | 0.4–2.4 | 90–170 | [43] |
| Soft drink samples | Al2O3 | HPLC-DAD | 90.4–109.2 | 0.7–5.1 | 9.5–9.9 | [44] |
| Drink samples | Fe3O4@rGO | HPLC | 88.9–95.9 | <2.7 | 10.0–15.9 | [45] |
| Liquor samples | Decanoic acid coated-Fe3O4 NPs | HPLC | 88.9–105.4 | 2.9–3.8 | 0.9–2.4 | [46] |
| River water | PS−DVB−Fe3O4 | HPLC-DAD | 43.6–67.3 | 2.5–9.8 | 15.1–26.7 | In this work |
| River water | C18−PS−DVB−Fe3O4 | HPLC-DAD | 86.5–106.3 | 0.4–8.8 | 0.6–3.1 | In this work |
Disclaimer/Publisher’s Note: The statements, opinions and data contained in all publications are solely those of the individual author(s) and contributor(s) and not of MDPI and/or the editor(s). MDPI and/or the editor(s) disclaim responsibility for any injury to people or property resulting from any ideas, methods, instructions or products referred to in the content. |
© 2024 by the authors. Licensee MDPI, Basel, Switzerland. This article is an open access article distributed under the terms and conditions of the Creative Commons Attribution (CC BY) license (https://creativecommons.org/licenses/by/4.0/).
Share and Cite
Lei, C.; Zhang, S.; Liu, W.-X.; Ye, M.-L.; Zhao, Y.-G. Fast Determination of Eleven Food Additives in River Water Using C18 Functionalized Magnetic Organic Polymer Nanocomposite Followed by High-Performance Liquid Chromatography. Molecules 2024, 29, 3675. https://doi.org/10.3390/molecules29153675
Lei C, Zhang S, Liu W-X, Ye M-L, Zhao Y-G. Fast Determination of Eleven Food Additives in River Water Using C18 Functionalized Magnetic Organic Polymer Nanocomposite Followed by High-Performance Liquid Chromatography. Molecules. 2024; 29(15):3675. https://doi.org/10.3390/molecules29153675
Chicago/Turabian StyleLei, Chao, Shun Zhang, Wen-Xin Liu, Ming-Li Ye, and Yong-Gang Zhao. 2024. "Fast Determination of Eleven Food Additives in River Water Using C18 Functionalized Magnetic Organic Polymer Nanocomposite Followed by High-Performance Liquid Chromatography" Molecules 29, no. 15: 3675. https://doi.org/10.3390/molecules29153675