Article

Competitive Adsorptive Mechanism of H2/N2 in LTA/FAU Zeolites by Molecular Simulations and Experiments

School of Chemistry and Chemical Engineering, Shandong University of Technology, Zibo 255049, China
*
Authors to whom correspondence should be addressed.
Molecules 2024, 29(15), 3686; https://doi.org/10.3390/molecules29153686
Submission received: 23 May 2024 / Revised: 6 July 2024 / Accepted: 1 August 2024 / Published: 3 August 2024

Abstract

:
For industrial tail gas to be converted into high-purity hydrogen, the H2-N2 mixture needs to be separated efficiently. This work examined the adsorption characteristics and competitive mechanisms of H2 and N2 on LTA- and FAU-type zeolites, at 77 K, 298 K, and 0.1–10 bar by thoroughly analyzing results of adsorption capacity experiments and molecular simulations. In the Grand Canonical Monte Carlo (GCMC) simulations, the force field causing a molecular dipole of H2 and the polarization force field of N2 are first applied. The accuracy of the force field was experimentally verified. The findings indicate that N2 and H2 loading on Ca-FAU (Ca-LTA) are higher than Na-FAU (Na-LTA). On NaX at 77 K, the highest adsorption selectivity (N2/H2) is observed; on NaA at 298 K, it is the opposite. The GCMC data findings demonstrate that H2 and N2 have remarkably similar adsorption sites, with framework oxygen atoms and non-framework cations serving as the main adsorption sites for adsorbate molecules. Furthermore, the rate at which H2 diffuses is higher than that of N2. The study of redistribution charge before and after adsorption demonstrated that N2 has a greater affinity for the framework oxygen atoms than H2. This study provides a molecular theoretical foundation for the adsorption behavior of H2-N2 mixture in zeolites.

Graphical Abstract

1. Introduction

H2 is a green and clean energy source with advantages of cleanliness, no pollution, zero emissions, and wide applications. The heat of the combustion of hydrogen is higher than that of most fuels based on the same mass, making it an ideal substitute for fossil fuels. According to sources, hydrogen can be divided into gray hydrogen [1,2,3], blue hydrogen [4,5], green hydrogen [6], and hydrogen-rich tail gas [7,8]. Currently, over 95% of hydrogen generation occurs through steam methane reforming (SMR), resulting in what is commonly referred to as “gray hydrogen”, or via coal gasification, which produces “brown hydrogen”. A promising approach toward decarbonized hydrogen involves combining SMR or gasification with carbon capture and sequestration (CCS), resulting in “blue hydrogen”. If renewable or nuclear power is used to supply the electricity for this process, the resulting hydrogen would be decarbonized and recognized as “green hydrogen” [9]. While gray hydrogen production currently accounts for a high proportion, it does result in significant pollution due to the discharge of harmful gasses. Furthermore, although environmentally friendly, green hydrogen can be costly, and its application rate is currently limited. However, the recovery of hydrogen-rich tail gas offers significant benefits for the comprehensive utilization of hydrogen and carbon neutrality. Currently, there is significant interest in the industrial exhaust effect caused by processes such as steam methane reforming (H2/N2/CO2) [10,11], ammonia production (H2/N2/NH3) [12], and coke oven gas (H2/N2/CH4) [13]. These processes result in the production of a substantial amount of H2-N2 mixture. As a result, many researchers have focused on binary or ternary mixtures containing richer impurities such as CO2/CH4 [14]. According to Carbajo’s study on the adsorption and separation behavior of gas mixtures such as H2/N2/CO2/CH4/CO in zeolites, H2 or N2 had a lesser interaction with zeolite framework atoms [15]. This made it harder to separate them from other gasses compared to those gasses with higher polarizability. The associated physical properties of N2 and H2 gasses are shown in Table 1.
Yaremov et al. investigated the effects of microporous zeolites’ pore parameters and surface characteristics (at 77, 197, and 253 K; 760 torr) on the adsorption of H2, N2, CO, and CH4. According to this study, the adsorption inertia of H2 helped in gas separation from other gasses [16]. There is research on the separation of H2-N2 mixture predominantly using MOFs [17], activated carbons [18,19,20], membranes [21,22], and zeolites [23]. A zeolite is a kind of porous material widely used in industry. It can selectively adsorb molecules based on their size, shape, and polarity. Li et al. studied N2 adsorption in Linde Type A (LTA) and truncated octahedron (FAU)-type zeolites at 1 bar and 300 K [24,25]. The results indicated that N2 had superior adsorption performance in FAU-type zeolites, with an adsorption capacity of up to 16.26 mol/kg. Then, the N2 adsorption capacity of the LiX zeolite was twice that of the Type A zeolite with extra-framework cations of Ca (CaA) zeolite [26]. The results highlighted the benefits of FAU- and LTA-type zeolites for adsorptive H2 or N2. However, the study of the competitive adsorption mechanism of H2-N2 mixture in FAU- and LTA-type zeolites is not clear. Most researchers have utilized molecular simulation techniques employing classical force fields to investigate the adsorption of H2 or N2 in zeolites. In general, simulations employing classical force fields fail to replicate experimental findings. To address the inaccuracy of classical force fields, we examined the accuracy of hydrogen force field parameters, specifically dipole moments, and incorporated polarization correction in the nitrogen force field parameters. The simulation results for single-component adsorption isotherms exhibit strong agreement with experimental test results, confirming the credibility of the force field parameters and the models. This paper analyzes the effects of cation type (Na+ and Ca2+), adsorption temperature (77 K and 298 K), and pressure (0–10 bar) on the adsorption capacity of H2 and N2 in LTA- and FAU-type zeolites using the force field parameters. In addition, it examines the competitive diffusion behavior of adsorbate molecules and investigates the law of competitive diffusion. Furthermore, the competitive adsorption mechanism of H2 and N2 in zeolites is examined in terms of the adsorption sites and the charge density.

2. Results and Discussion

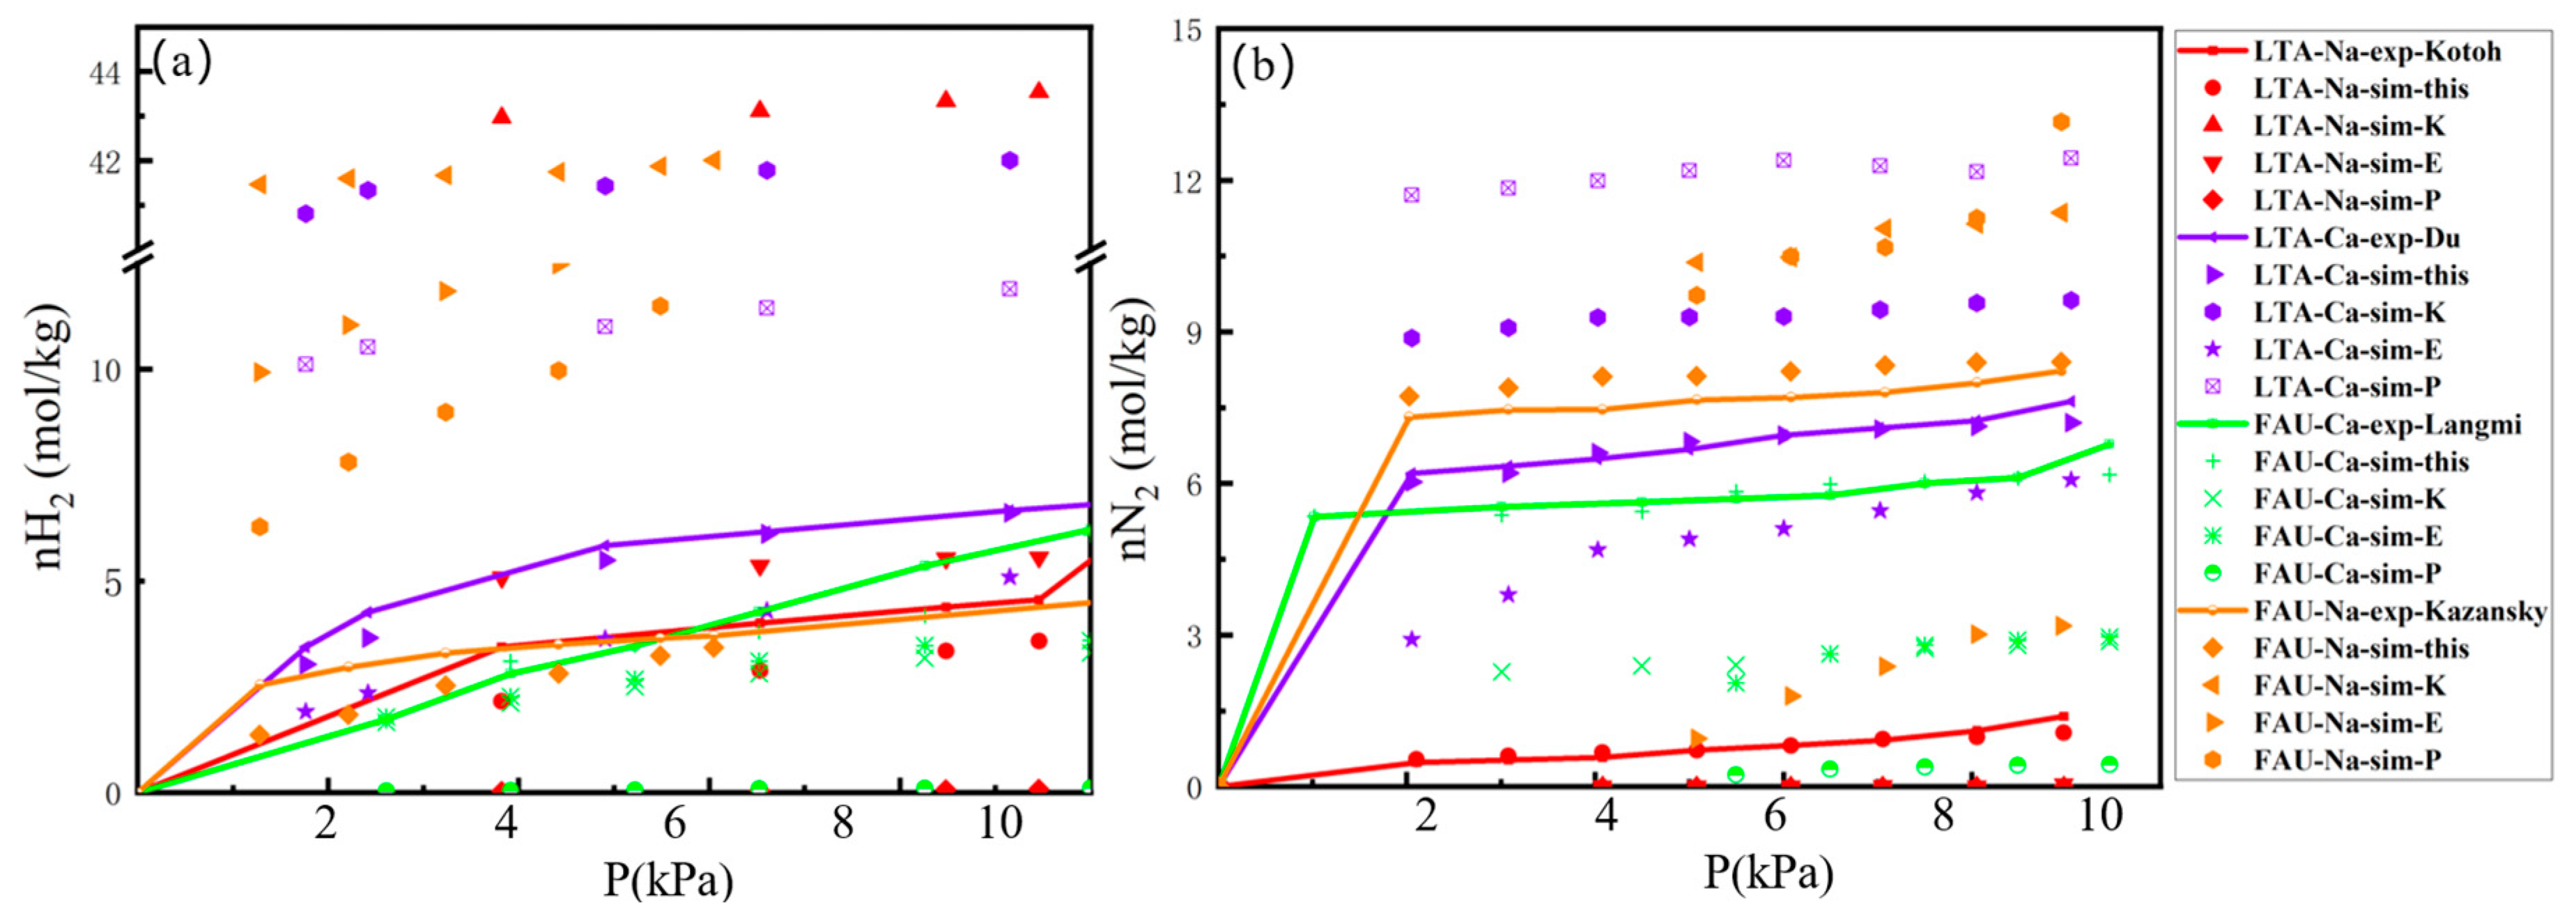
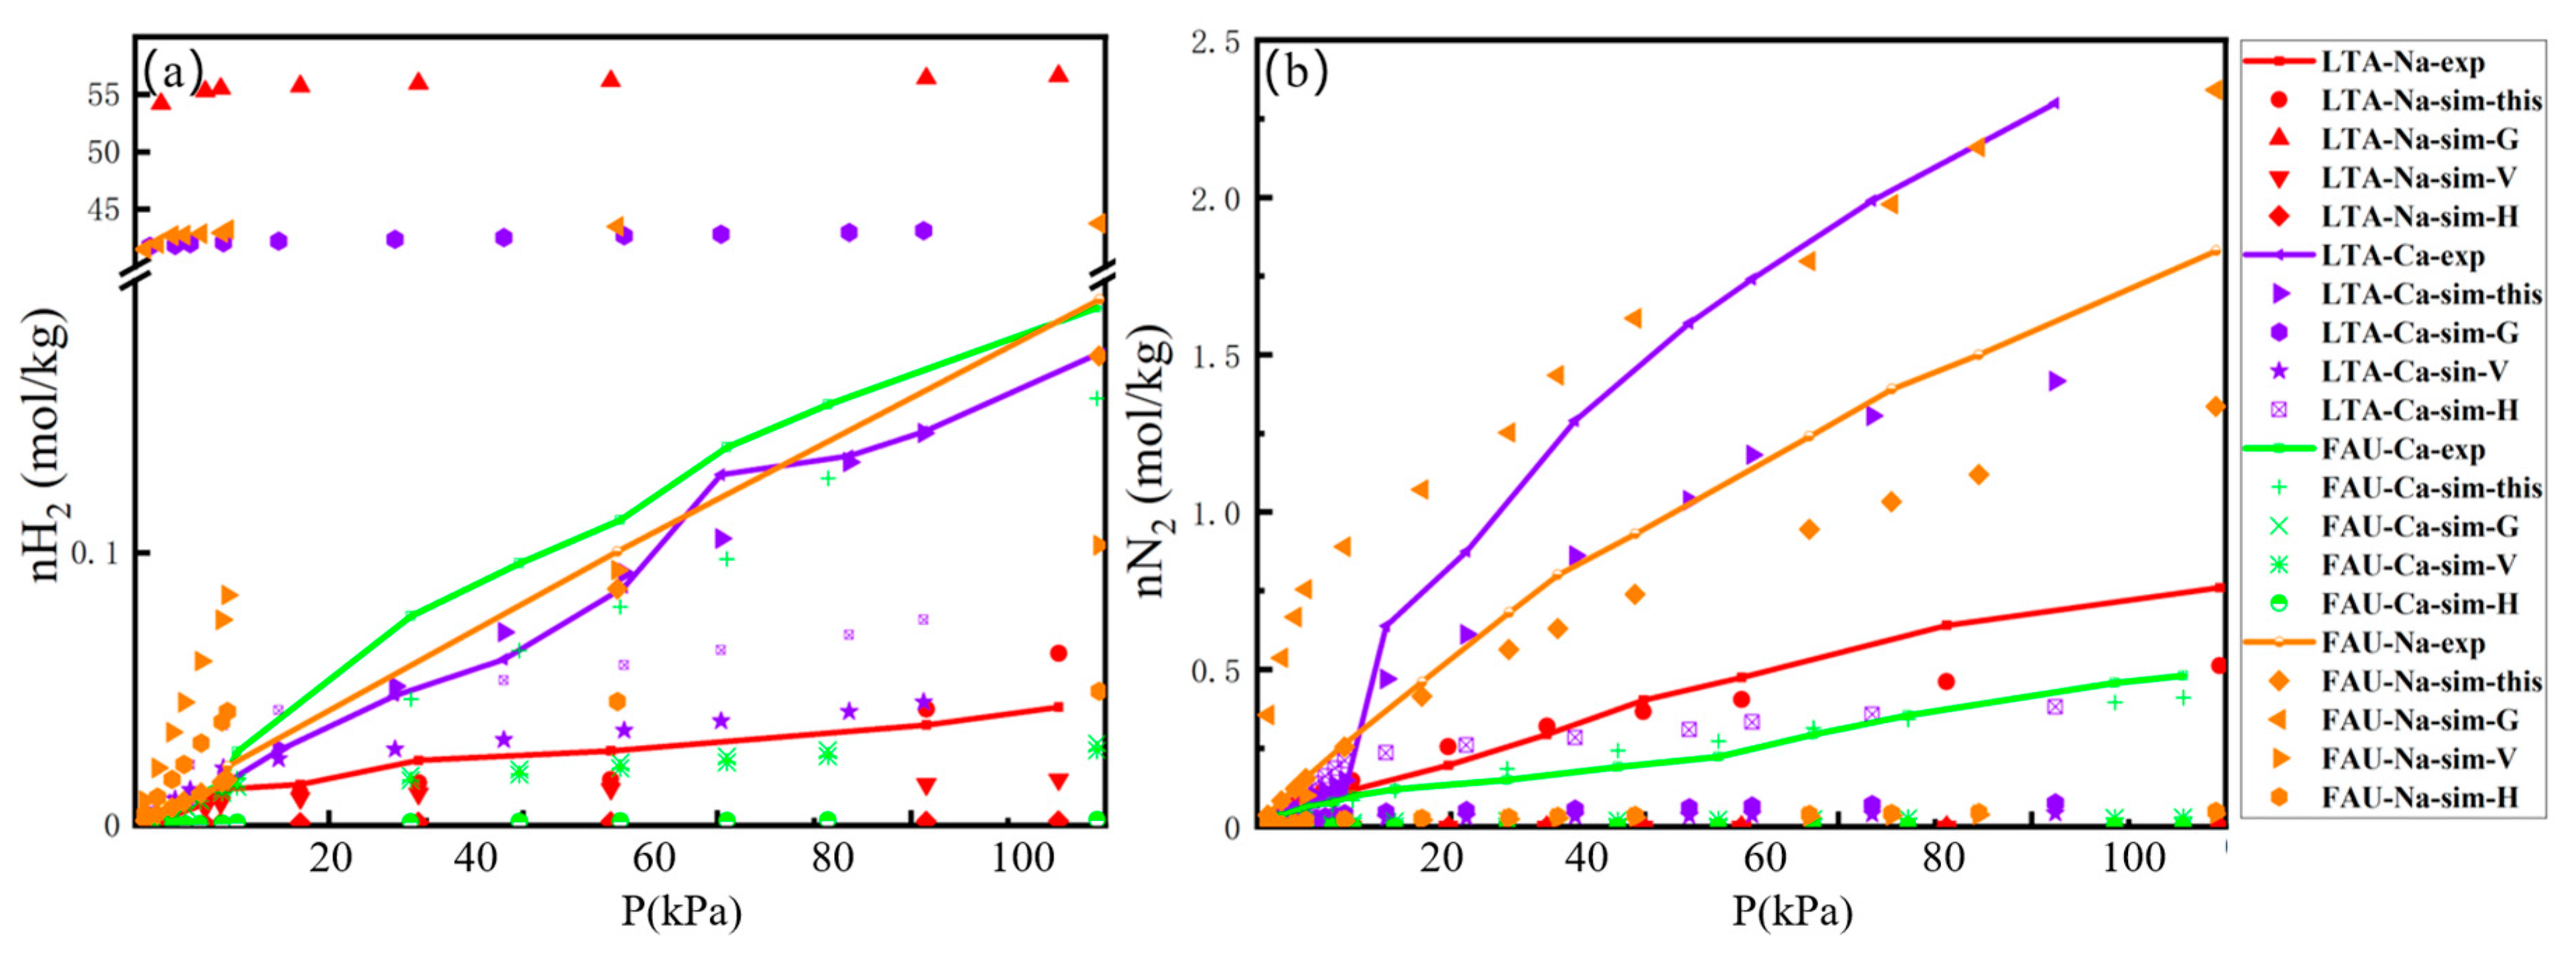
2.1. Adsorption Isotherm

The adsorption isotherms of H2 and N2 on LTA- and FAU-type zeolites were measured at 77 K (0.1–1 bar) and 298 K (0.1–10 bar). We conducted experimental H2 and N2 adsorption isotherms in the zeolite at 298 K, and the H2 isotherms at 77 K were obtained from the works of Kotoh [27], Du [28], Langmi [29], and Kazansky [30], while the N2 isotherm at 77 K was obtained from Sircar [31]. First, the one-component computed isotherms of H2 and N2 were compared with the available experimental data. It was observed that the simulated isotherms using the previously developed force field do not fit the experimental data shown in Figure 1 and Figure 2, and Evagelia used Feynman–Hibbs to explain the H2 quantum effect involving dispersion-type interactions in their force field [32]. However, all the adsorption isotherms from this study’s force field, as shown in Figure 1 and Figure 2, exhibit reasonable agreement between experiments and simulations, and using experience, the values of relative average deviation (RAD) lower than 30% are acceptable, as shown in Table S1. The simulated isotherms of H2 and N2 at 77 K slightly over-predict the adsorption isotherms for NaX. Nevertheless, the simulated isotherms of H2 and N2 at 298 K slightly under-predict the adsorption isotherms below 60 kPa for NaA. By fitting the adsorption isotherms results with Langmuir model, the Langmuir model parameters for H2 and N2 were estimated, and they are presented in Table S2. The adsorption isotherms depicted in Figure 1 and Figure 2 conform to the Langmuir isotherm, indicating that the adsorption of H2 and N2 on the LTA- and FAU-type zeolites follows a microporous adsorption behavior. In the 0–1 bar range at 77 K, the N2 loading on the LTA- and FAU-type zeolites is approximately twice the value of H2 loading, as shown in Figure 1a,b. However, in the 0–10 bar range at 298 K, the N2 loading on the LTA- and FAU-type zeolites exceeds ten times the H2 loading values shown in Figure 2a,b. It is observed that the adsorption value of H2 is greater in the FAU zeolite than in the LTA-type zeolite at 298 K. Furthermore, for FAU- and LTA-type zeolites at 77 K, the H2 and N2 adsorption capacities of Ca-FAU (Ca-LTA) are greater than those in Na-FAU (Na-LTA). In most cases, the adsorption affinity of H2 in Ca-FAU (Ca-LTA) is stronger than that of Na-FAU (Na-LTA), which can be attributed to the smaller radius of Na+ and the shorter interaction distance with adsorbent molecules. When Na+ is exchanged with Ca2+ in the zeolite, the non-framework cation decreases, therefore expanding the pore volume of the zeolite framework and allowing for an increase in the space available for H2 adsorption.

2.2. Adsorption Selectivity and Heat

Adsorption selectivity is a vital indicator used to evaluate the adsorption performance of adsorbent materials. In order to explore the H2 and N2 adsorption properties in LTA- and FAU-type zeolites, we apply the ideal adsorption solution theory (IAST) to predict the selectivity of H2-N2 mixture. The selectivity is calculated using Equation (1):
S = q 1 / q 2 p 1 / p 2
where q1 and q2 are the adsorption capacities, and p1 and p2 are the partial pressures.
In this study, the selectivity of N2/H2 was predicted at 77 K within the range of 0–1 bar, and at 298 K within the range of 0–10 bar. Using the same molar fractions of H2 and N2, we can easily investigate the competitive adsorption behavior of the H2-N2 mixture. All calculations were performed using the PyIAST package (3.12.4) [33]. As shown in Figure 3, the selectivity of N2/H2 in the FAU-type zeolite is higher than that in the LTA-type zeolite at 77 K. Additionally, the selectivity of N2/H2 in Ca-FAU (Ca-LTA) is lower than that in Na-FAU (Na-LTA) at 298 K. The greatest selectivity of N2/H2 is observed in NaX at 77 K, while the greatest selectivity of N2/H2 is observed in NaA at 298 K. The adsorption selectivity from the binary N2-H2 mixture via GCMC simulations is shown in Figure S1. The results indicate that the selectivity values obtained from binary mixture GCMC simulation are consistent with those predicted using the IAST.
In Figure 4, we present contributions from different interactions to the energy of adsorption of H2 and N2 in FAU- and LTA-type zeolites at high loadings though MC calculations. It is evident that the primary contribution to the energy of adsorption for H2 and N2 is the significant host–guest interaction, which consists of a dispersive and an electrostatic component. The main difference is that N2 exhibits higher electrostatic interaction energies compared to H2, while they have similar dispersive contributions. In the simulations of the FAU- and LTA-type zeolites, the calculated energy of adsorption is primarily influenced by the adsorption site binding energy, with only a minor contribution from the guest–guest interaction. However, the guest–guest interaction is approximately zero since we used a one-site guest model. To investigate the effect of temperature on adsorption, we conducted the calculation using single-component gas equilibrium adsorption isotherms at 77 K and 298 K, according to the Virial Method [34]. The heat of adsorption at infinite dilution is provided in Table 2.

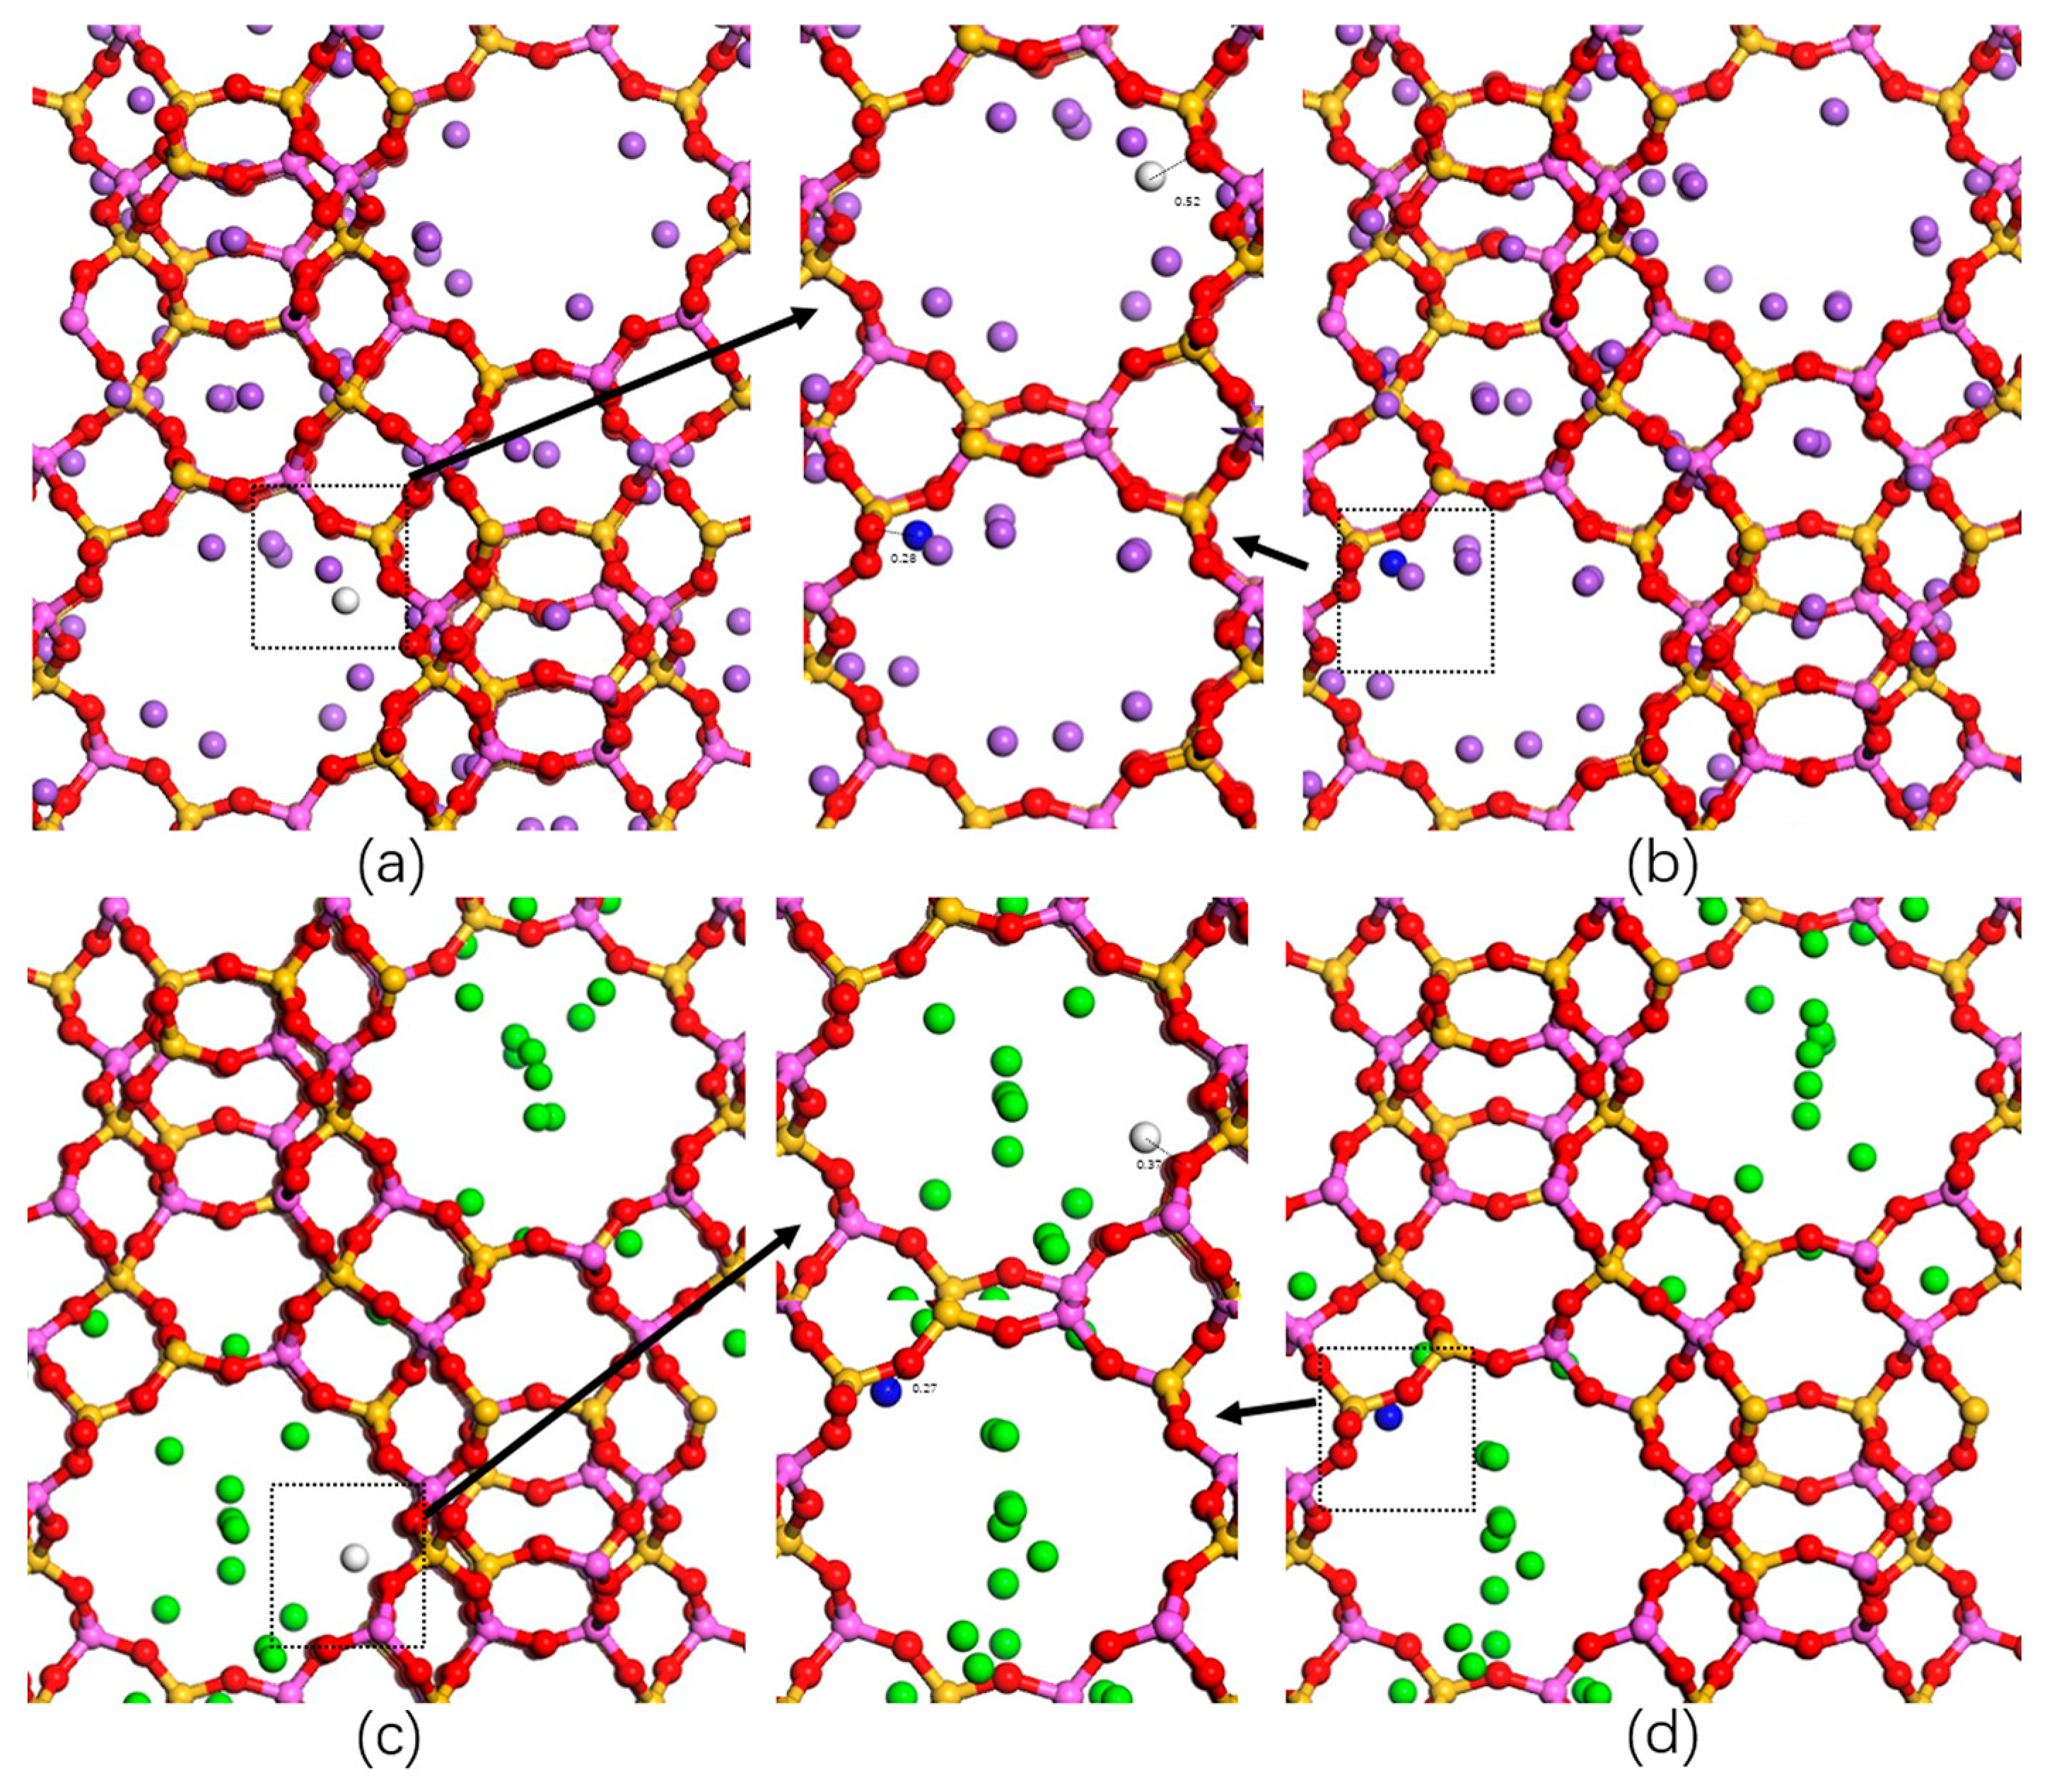
2.3. Adsorption Sites

To investigate the H2 and N2 adsorption mechanism on the zeolites employed, we performed MC simulations in an NVT ensemble (with one H2 or N2 molecule per unit cell) under 1 bar at 77 K and 298 K. Figure 5 shows the interaction between H2 (N2) and the LTA-type zeolite at 77 K, and Figure 6 shows the interaction between H2 (N2) and the FAU-type zeolite at 77 K. The optimized geometry reveals a minimal ONaA-H distance of 0.97 Å and the minimal ONaA-N distance of 0.6736 Å. In Figure 6, we can observe the interaction of H2 (N2) with the FAU-type zeolite. The optimized geometry reveals a minimal OCaX-N distance of 0.37 Å and a minimal ONaX-N distance of 0.21 Å. In the preferred sites, the behavior of H2 is similar to that of N2. With similar adsorption sites, N2 and zeolites are closer to each other, resulting in better adsorption. The binding interaction between H2 and N2 is observed to be stronger in the FAU-type zeolite compared to the LTA-type zeolite. This observation holds true at 298 K as well, as shown in Figures S2 and S3. The adsorption site is consistent with the adsorption density pattern (Figures S4–S7). From the adsorption density figures, it is evident that H2 exhibits stronger adsorption density at 77 K in the vicinity of oxygen atoms in the zeolite. The adsorbate molecules interact more strongly with zeolites, and as the temperature increases, the H2 molecules disperse to binding sites with lower binding energies, resulting in weaker interactions with the zeolite. On the other hand, N2 adsorption behaves in the opposite manner, exhibiting stronger adsorption densities with the zeolite at 298 K. Significant density changes were observed in the CaA and NaX zeolites.
To investigate the interaction of H2 and N2 with zeolite atoms, we employed AIMD to examine the behavior of the H2-N2 mixture (H2/N2, 50/50, v/v) within the zeolite under the NVT ensemble. The radial distribution function (RDF) was obtained by calculating the molecular trajectories of H2 and N2. Figure 7 and Figure 8 present the zonal and average densities of H2 and N2 based on O, Si, Al, and non-framework cations in LTA- and FAU-type zeolites at 1 bar and 77 K. The shape and intensity of the peaks provide evidence of the interaction sites and adsorption capacities of H2 and N2 on the zeolites. It is evident that the zeolite exhibits a stronger interaction preference for N2, as indicated by the local of the primary peak. In Figure 7, the initial peak occurs at 0.75 Å, indicating the highest likelihood of H2 being present at 0.75 Å. Similarly, in Figure 8, the radial distribution function of N2 displays the highest peak at 0.5 Å, indicating the highest probability of N2 being present at 0.5 Å. These findings clearly show that the main peaks representing the interactions between N2 and zeolites are higher than those of H2. The intensity of the main peak for H2 is 6, while that for N2 is 8, which aligns with the observation in Figure 4 regarding the larger adsorption energy for the interaction of N2 and zeolites. The initial peaks observed in Figure 7 and Figure 8, respectively, correspond to the oxygen atoms of framework. This suggests that the oxygen atoms of the framework assume the closest positions to the unrestricted movement of H2 and N2. Consequently, this finding supports the notion that the interaction energy between the H2 (N2) and the oxygen atoms of the framework accounts for a significant portion of the adsorption energy between the host and guest. The same principle applies at 298 K; please refer to Figures S8 and S9 for supporting evidence.
Because the dynamic diameters of H2 and N2 are similar to the effective pore diameter of the LTA- and FAU-type zeolites, diffusion plays a key role in the absorption and separation processes of H2 or N2. The diffusion of the adsorbate molecules in the zeolite is influenced not only by their dynamic diameter but also by their interaction with the oxygen atoms of the framework.
We analyzed the dynamic behavior of a H2-N2 mixture (H2/N2, 50/50, v/v) in FAU- and LTA-type zeolites at different temperatures by calculating the mean square displacements (MSDs) and the self-diffusion coefficients. Figure 9 and Figure 10 depict the relationship between the adsorbate molecular motion and equilibrium time. It is observed that the diffusion of H2 is greater in FAU-type zeolite than in LTA-type zeolite at 298 K. Additionally, for both FAU- and LTA-type zeolites at 298 K, the H2 and N2 diffusion capacities of Ca-FAU (Ca-LTA) are greater than those of Na-FAU (Na-LTA). During the free movement of adsorbate molecules, H2 diffuses more easily than N2 in the pores of LTA- and FAU-type zeolites. Karger conducted a diffusion study on H2 in NaX and NaA zeolites and found that the type of zeolite influences the diffusion process of H2, with the diffusion rate decreasing as the size of the zeolite pores decreases [35,36]. The linear nature of the MSD indicates the reliability of the simulation process. The self-diffusion coefficients of H2 and N2 are calculated using the Einstein relation, as shown in Equation (2):
D = 1 6 lim n d d t 1 N i i = 1 N i r i t r i 0 2
where the average is taken over time t for the mean square displacement of the center of mass position vectors r of all the molecules N in the system; and ‹› indicates the overall average.
The calculated results are shown in Table 3 and Table 4. Among the four types of zeolites, NaX zeolites exhibit the highest self-diffusion coefficients for H2 and N2 at 77 K, with a ratio of 7.6 (H2/N2). Similarly, CaX zeolites show the largest self-diffusion coefficients for H2 and N2 at 298 K, with a ratio of 6.54 (H2/N2). The self-diffusion coefficients of H2 and N2 in Na-FAU (Na-LTA) are lower than those in Ca-FAU (Ca-LTA).

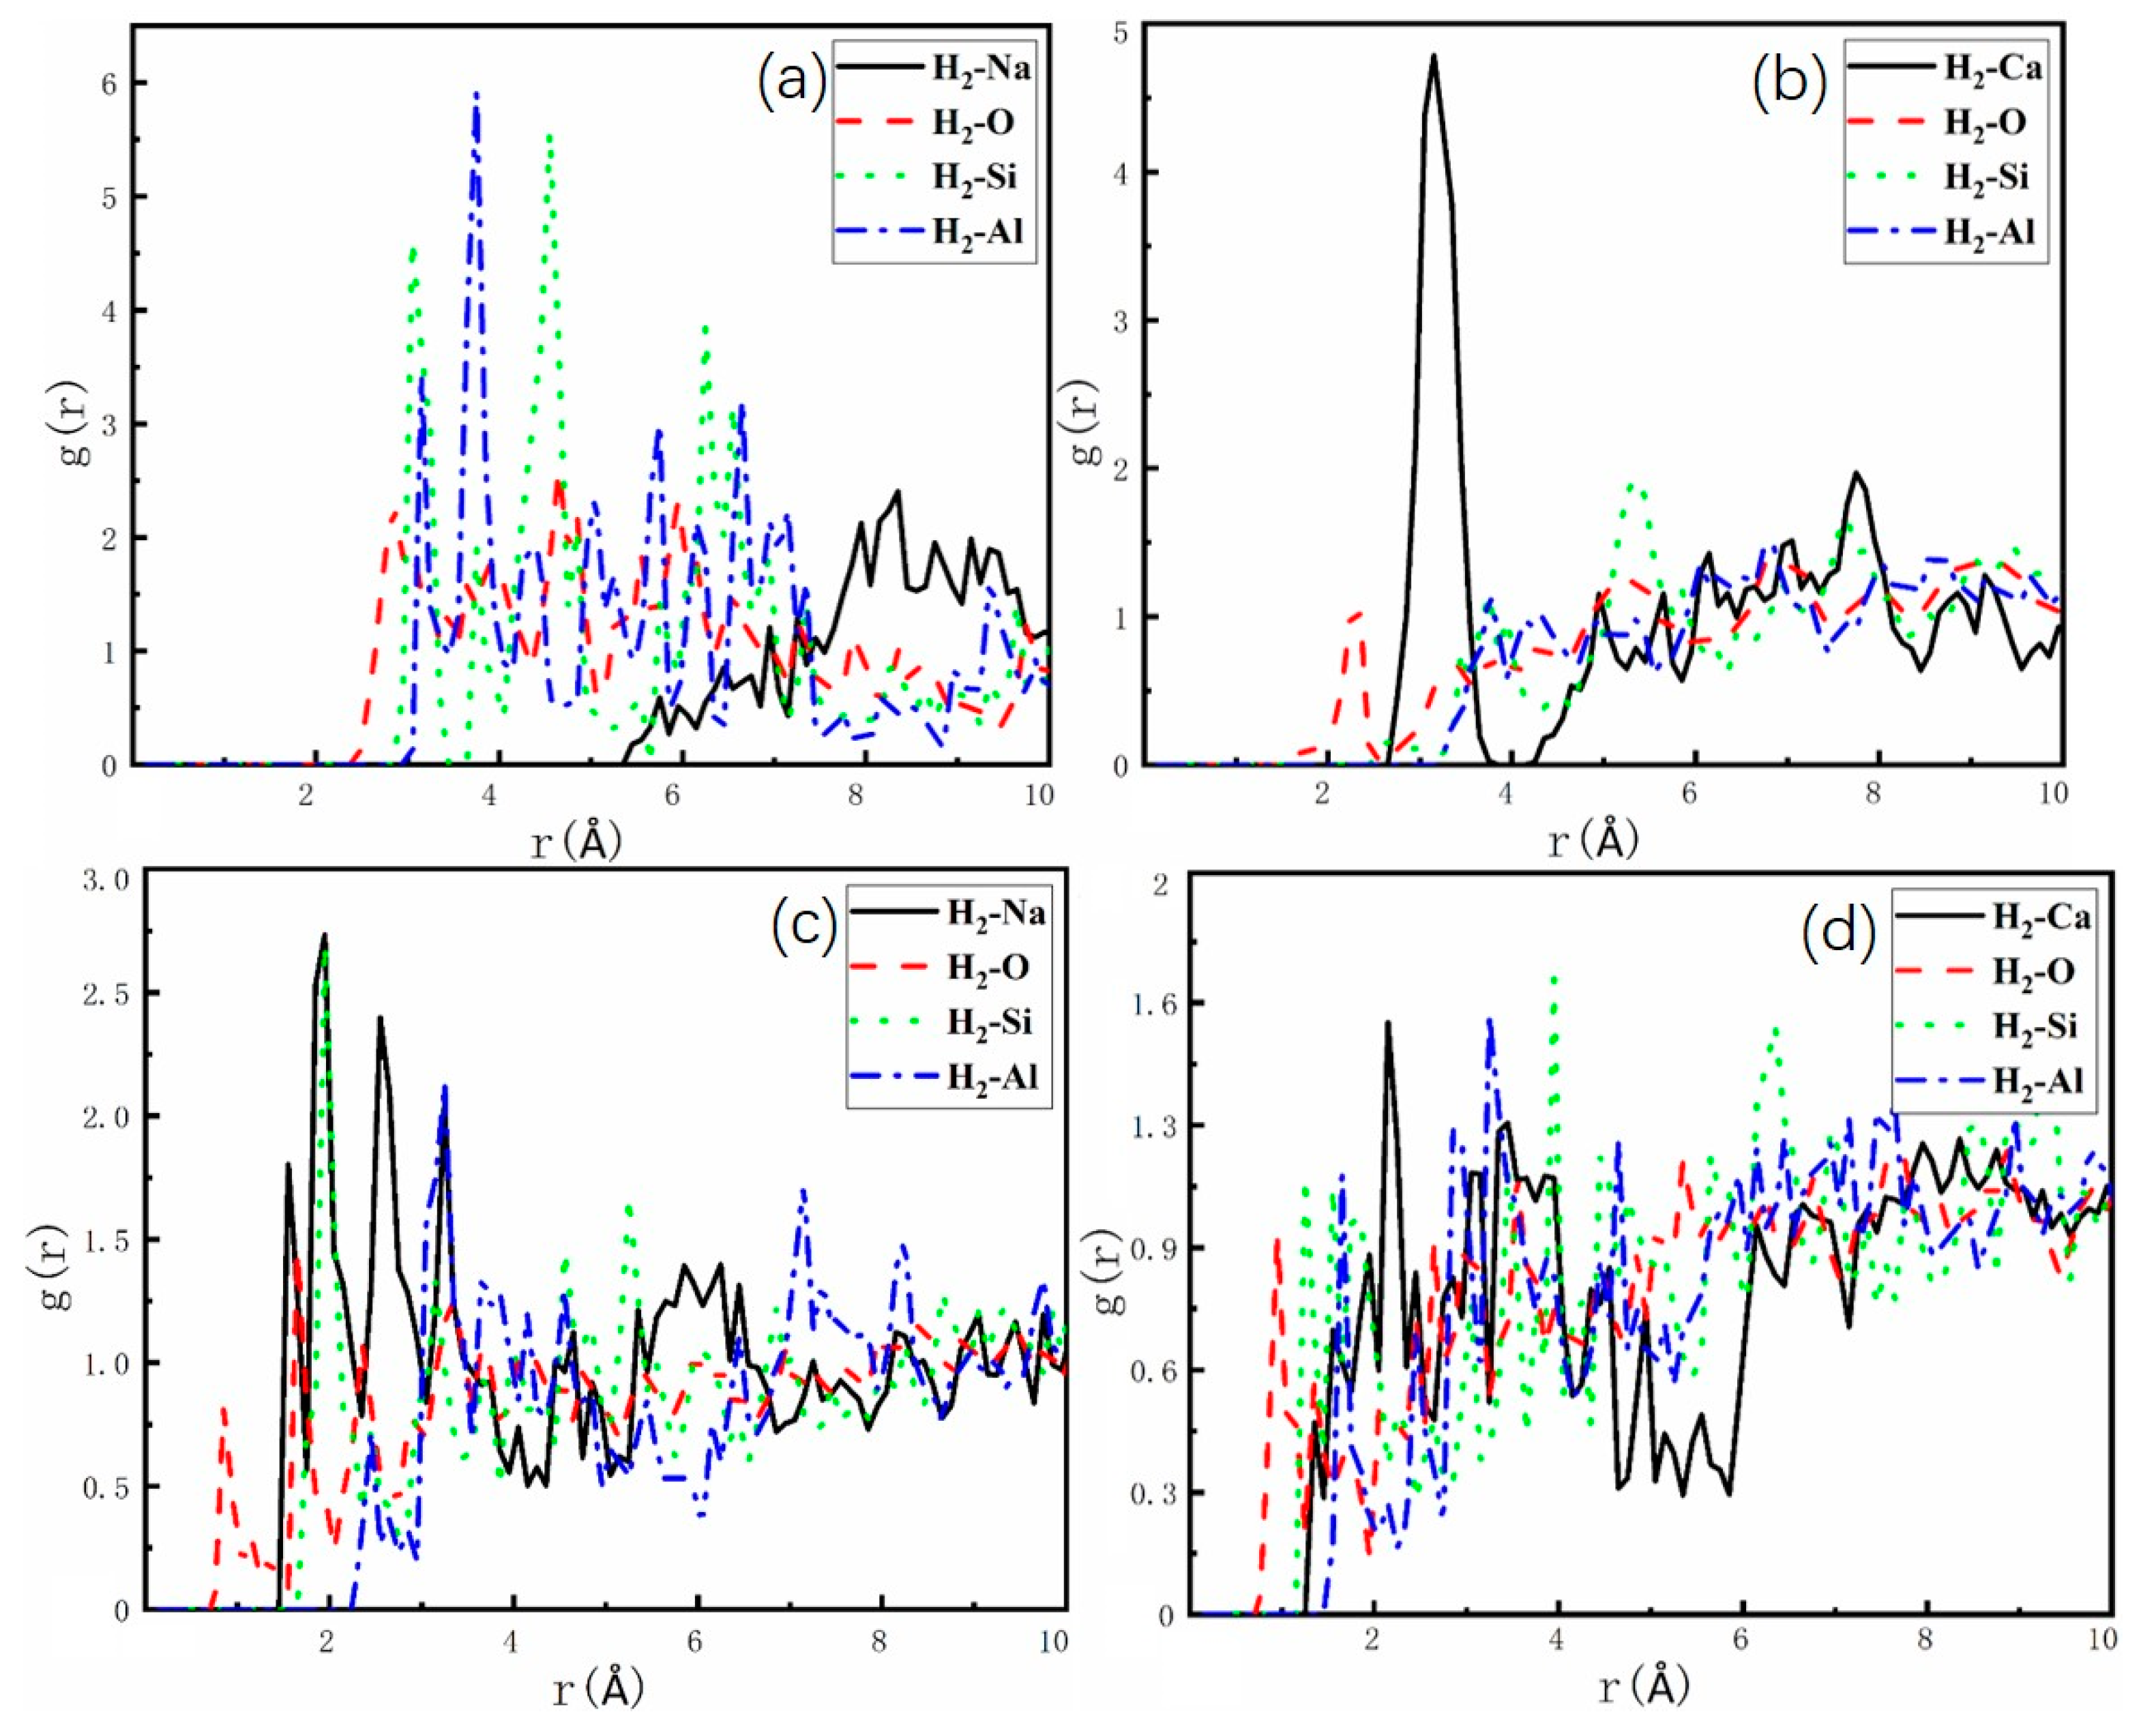
2.4. Investigation of Charge Density

To investigate the effect of H2 and N2 on the chemical environment within the zeolite pores during adsorption at the atomic level, DFT calculations were performed to explore the redistribution of charge density in this system after adsorbing H2 or N2 molecules. The charge density analysis of LTA- and FAU-type zeolites is shown in Figures S10 and S11. It is clear from the figures that before the adsorption of gases, the electron cloud is concentrated around the zeolite pores. After the adsorbate molecules are adsorbed onto the zeolites, the electron density is transferred to the adsorbate molecules. The adsorption properties of the adsorbate molecules within the framework are determined using the oxygen atoms of the framework and the non-framework cations. As shown in Figure S10, due to the strong electron withdrawing ability of the zeolite atoms, the electrons of the H atoms in H2 molecules migrate to the framework atoms, especially the oxygen atoms. Similarly, in Figure S11, the N atoms in N2 donate some charges, leading to the interactions with the zeolite atoms. In comparing Figure 11 and Figure 12, it can be observed that the charge density transfers between oxygen atoms, and N2 is more pronounced, which is likely due to the denser electron cloud distribution of N2 molecules. The adsorbate molecules show an increased charge density on one side of the oxygen atoms of the zeolite framework and a decreased charge density on the other side in Figure 11 and Figure 12. H2 and N2 exhibit a blue area near the side of the oxygen atoms of the framework, indicating a decrease in charge density, while the framework atoms show a red area, indicating an increase in charge density. The electrostatic potentials of N2 and H2 in Ca-FAU (Ca-LTA) demonstrate larger values than those in Na-FAU (Na-LTA). A comparison of the analyses in Figure 11 and Figure 12 reveals that the charge transfer in the pores of LTA- and FAU-type zeolites after the adsorption of N2 is more pronounced than that of H2 and that N2 is more affected by the chemical environment in the zeolite pores.

3. Methods

3.1. Framework and Adsorbate: Models and Force Fields

The zeolite flexible framework has little impact on the simulation of small-molecule adsorption. In this study, the rigid structure model was employed for simulation [26]. The atoms were considered “frozen”, neglecting interatomic interactions between framework atoms to significantly shorten the simulation time [37]. The zeolite structures used in this study were taken from crystallographic files (CIFs) of the IZA database, with additional framework cations inserted for structural optimization [38]. The geometric structure was optimized using Density Functional Theory (DFT). The overall unit cell maintains a rigid structure. We analyzed the geometric structure with the Perdew–Burke–Ernzerhof (PBE) generalized gradient approximation functional, associated with the third-generation dispersion correction (DFT-D3) to avoid weak interaction, implemented in the CP2K package (8.2.0) [39,40,41]. The density cut-off was set to 500 Ry, and the overall energy converged to within 10−6 eV. The physicochemistry characteristics of the investigated LTA and FAU samples in this study are shown in Table 5.
The accuracy of the force field is essential for GCMC simulations. In order to validate the accuracy of our GCMC simulations, we compared the specific force field parameters of Vujić [42], General [43], Evagelia [32], Kowsari [44,45], Pantatosaki [46], and Huang [47]. The force field previously described by J. Marcos takes into consideration the influence of the dipole moment of the H2 molecule and the polarization of the electric field generated by the local structure of the zeolite. For hydrogen, we used a one-site point charge model, while for N2, we used the parameters reported by Xuan [48]. There are strong Coulomb interactions between adsorbates and non-framework cations as well as mobility of these cations. So, the location and density of the non-framework cations influence the adsorption behavior of H2 and N2 in zeolite structures [49]. The cation Ca2+ parameters reported by Du and the cation Na+ parameters reported by Farida were employed to describe interactions in this work [45,50]. The force field parameters and partial charges are presented in Table 6.
The simulation accuracy of classical force fields is not sufficient when the polarization effect of N2 is neglected. To enhance the simulation accuracy, the polarization force field is introduced by scaling the Lennard-Jones (L-J) interaction between N2 and zeolite atoms with a parameter λ ∈ [0, 1] [51,52]. The atomic polarizabilities used in this study were obtained from the literature using Equation (3). For this study, λ was set to 0.4 by fitting the experimental data to the simulation results.
ε i s c a l e d = ε i · 1 + λ α i α m a x 1 + λ α i α m a x · λ
where λ is a scaling factor between 0 and 1 used for rescaling the Lennard-Jones energy parameters; αi means the polarizability of atomi; αmax means the max polarizability; and εi means the initial force field parameter. λ = 1 means that N2 has the same interaction potential energy function with other molecules, and λ = 0 means that N2 does not interact with other molecules.

3.2. Simulation Details

The separation of H2 and N2 adsorption in LTA- and FAU-type zeolites was performed using the RASPA code [53,54]. The cut-off radius was set to half the length of the cell edge in the simulation box, without considering tail corrections, and by applying periodic boundary conditions to maintain a three-dimensional spatial structure. Only cations and adsorbate molecules were allowed to move, while the zeolite structure remained rigid. In these simulations, the following trial moves were used for the cations: translation (50%) and random (50%). For the H2 and N2 molecules, the trial moves were carried out: translation (20%), rotation (20%), insertion (20%), and random (40%). The total number of cations remained constant during the simulations, and only translation movements and regrow were considered for this type of particle. Based on the reported crystallographic locations of Na+, Na+ molecules were expected to enter the sodality cages in FAU-type zeolites, but not in LTA-type zeolites [55]. Therefore, blocking spheres were exclusively used for LTA-type zeolites in our investigation, with the ionic radius of Na+ (rNa+ = 1.16) serving as the probe size. The simulations were performed for 5 × 10⁵ cycles, with 25,000 initialization cycles and 20,000 equilibration cycles. The final simulation result was obtained by averaging the results of the two simulation processes. The excess adsorption data were used for investigation [56]. The excess adsorption capacity (nexc) was obtained by relating the absolute adsorption capacity (nabs) to the pore volume of the adsorbent (Vg) and the molar density of the native gas phase (ρg), using Equation (4):
n e x c = n a b s V g ρ g
In the He-void (ϕHe) calculations, the particle method with the Rosenbluth algorithm was used [57]. The largest cavity diameter (LCD), pore volume, and accessible surface area (ASA) were determined using Zeo++ software packages (0.3) [58]. The interaction between the adsorbates and the zeolite atoms was calculated based on electrostatic and van der Waals force interactions. The electrostatic interactions were computed using the Coulomb force, while the interatomic interaction parameters were determined using Lorentz–Berthelot mixing rules [59]; Equation (5) was used for this calculation:
ε i j = ε i ε j ,   σ i j = σ i + σ j 2
where σij and εij are the L-J potential parameters.
Van der Waals interactions were described using the 12-6 Lennard-Jones (L-J), and the Ewald method was employed to calculate long-range electrostatic interactions with a relative accuracy of 10−6 [60]; Equation (6) was used for this calculation:
E L J r i j = 4 ε i j σ i j r i j 12 + σ i j r i j 6
where rij is the interatomic distance between the i and j atoms.
An MD simulation was performed using the RASPA code. Molecular dynamic runs of H2-N2 (H2/N2, 50/50, v/v) molecules were conducted in a 25 × 25 × 25 Å box at 77 and 298 K, with periodic boundary conditions imposed in all directions. The MD simulation was run for 1 ns with a time step of 0.5 fs in the NVT ensemble. The simulations included 2 × 10⁶ cycles, with 2000 initialization cycles and 20,000 equilibration cycles.
To explore the distribution of H2 and N2 molecules in zeolites, the ab initio molecular dynamic (AIMD) simulation was employed using the CP2K program (8.2.0). The simulations employed the Gaussian plane wave method, implemented in the Quickstep module [61], with the input file using the Multiwfn code [62]. The simulation was performed in the NVT ensemble using the BASIS_MOLOPT basis set [63] and GTH_POTENTIALS pseudopotential [64]. The employed density functional was the PBE with the DFT-D3 dispersion corrections. The CSVR thermostat with a temperature relaxation time of 0.5 ps was used to keep the temperature at 298 K during the simulations [65]. All reported properties were averaged over at least 500 ps, and the time step was set to 0.5 fs.

4. Conclusions

This study investigated the adsorption of H2 and N2 single components in Na+/Ca2+ ion-exchanged LTA- and FAU-type zeolites using GCMC and MD simulations. The adsorption isotherms obtained by the simulations correspond well with the experimental results. It is observed that the Ca2+ zeolites display a higher H2 and N2 adsorption capacity. The IAST predicts the adsorption selectivity of H2-N2 mixture in LTA- and FAU-type zeolites. The findings indicate that the selectivity of N2/H2 is greater for NaX at 77 K and NaA at 298 K. Additionally, the kinetic simulation of H2-N2 mixture diffusion demonstrated that H2 exhibits the fastest diffusion rate in NaX.
This study on adsorption sites for H2 and N2 on LTA- and FAU-type zeolites shows that major adsorption sites are located near framework oxygen atoms and non-framework cations. For the non-framework cations, Na+/Ca2+, the findings regarding adsorption energy and radial distribution function suggest that the Ca2+ zeolites exhibit a stronger interaction energy with H2 and N2. Moreover, there is an apparent interaction between the zeolite and N2 from the redistribution of charge density. This results in a relatively large charge transfer, leading to a stronger adsorption capacity.

Supplementary Materials

The following supporting information can be downloaded at https://www.mdpi.com/article/10.3390/molecules29153686/s1: Table S1: The deviation between the molecular simulations and the experiments for H2 and N2 on LTA- and FAU-type zeolites; Table S2: Experimental consistency of adsorption isotherm from Langmuir isotherm for H2 and N2 on LTA- and FAU-type zeolites; Figure S1: Comparison between N2/H2 selectivity and IAST; Figure S2: Typical binding geometry of H2 and N2 adsorbed in super cage of zeolite employed according to our computer simulations at 298 K; Figure S3: Typical binding geometry of H2 and N2 adsorbed in super cage of zeolite employed according to our computer simulations at 298 K; Figures S4 and S5: Adsorption density of H2; Figures S6 and S7: Adsorption density of H2; Figure S8: Representative interatomic guest-pore radial distribution functions (RDFs) corresponding to H2 at 298 K; Figure S9: Representative interatomic guest–pore radial distribution functions (RDFs) corresponding to N2 at 298 K; Figures S10 and S11: Redistribution of charge density.

Author Contributions

Conceptualization, Q.F. and Z.D.; methodology, Z.D. and Z.W.; validation, Z.D. and L.Z.; formal analysis, Z.W.; investigation, Z.D.; resources, L.Z.; data curation, Z.D., Z.W. and L.Z.; writing—original draft preparation, Z.D.; writing—review and editing, Z.D. and Q.F.; visualization, Z.D.; supervision, Q.F. and M.W.; project administration, Z.D.; funding acquisition, Q.F. All authors have read and agreed to the published version of the manuscript.

Funding

This research was financially supported by the Natural Science Foundation of Shandong Province in China (ZR2020MB121).

Institutional Review Board Statement

Not applicable.

Informed Consent Statement

Not applicable.

Data Availability Statement

The data presented in this study are available upon request from the corresponding author.

Acknowledgments

The authors would like to thank all reviewers for their constructive advice.

Conflicts of Interest

The authors declare no conflicts of interest.

References

  1. Yusaf, T.; Fernandes, L.; Abu Talib, A.R.; Altarazi, Y.S.; Alrefae, W.; Kadirgama, K.; Ramasamy, D.; Jayasuriya, A.; Brown, G.; Mamat, R.; et al. Sustainable aviation—Hydrogen is the future. Sustainability 2022, 14, 548. [Google Scholar] [CrossRef]
  2. Ranjekar, A.M.; Yadav, G.D. Steam reforming of methanol for hydrogen production: A critical analysis of catalysis, processes, and scope. Ind. Eng. Chem. Res. 2021, 60, 89–113. [Google Scholar] [CrossRef]
  3. Amin, A.M.; Croiset, E.; Epling, W. Review of methane catalytic cracking for hydrogen production. Int. J. Hydrogen Energy 2011, 36, 2904–2935. [Google Scholar] [CrossRef]
  4. Noussan, M.; Raimondi, P.P.; Scita, R.; Hafner, M. The role of green and blue hydrogen in the energy transition—A technological and geopolitical perspective. Sustainability 2021, 13, 298. [Google Scholar] [CrossRef]
  5. Howarth, R.W.; Jacobson, M.Z. How green is blue hydrogen? Energy Sci. Eng. 2021, 9, 1676–1687. [Google Scholar] [CrossRef]
  6. Oliveira, A.M.; Beswick, R.R.; Yan, Y. A green hydrogen economy for a renewable energy society. Curr. Opin. Chem. Eng. 2021, 33, 100701–100707. [Google Scholar] [CrossRef]
  7. Fu, Q.; Wang, D.; Li, X.; Yang, Q.; Xu, Q.; Ni, B.J.; Wang, Q.; Liu, X. Towards hydrogen production from waste activated sludge: Principles, challenges and perspectives. Renew. Sustain. Energy Rev. 2021, 135, 110283–110295. [Google Scholar] [CrossRef]
  8. Aziz, M.; Darmawan, A.; Juangsa, F.B. Hydrogen production from biomasses and wastes: A technological review. Int. J. Hydrog. Energy 2021, 46, 33756–33781. [Google Scholar] [CrossRef]
  9. Bartlett, J.; Krupnick, A. Investment Tax Credits for Hydrogen Storage. 2020. Available online: https://www.rff.org/publications/issue-briefs/investment-tax-credits-hydrogen-storage (accessed on 1 August 2023).
  10. Lopes, F.V.S.; Grande, C.A.; Ribeiro, A.M.; Loureiro, J.M.; Evaggelos, O.; Nikolakis, V.; Rodrigues, A.E. Adsorption of H2, CO2, CH4, CO, N2 and H2O in activated carbon and zeolite for hydrogen production. Sep. Sci. Technol. 2009, 44, 1045–1073. [Google Scholar] [CrossRef]
  11. Schmitt, N.; Apfelbacher, A.; Jäger, N.; Daschner, R.; Stenzel, F.; Hornung, A. Thermo-chemical conversion of biomass and upgrading to biofuel: The thermo-catalytic reforming process—A review. Biofuels Bioprod. Bioref. 2019, 13, 822–837. [Google Scholar] [CrossRef]
  12. Rouwenhorst KH, R.; Krzywda, P.M.; Benes, N.E.; Mul, G.; Lefferts, L. Ammonia production technologies. Techno-Econ. Chall. Green Ammon. Energy Vector 2021, 4, 41–83. [Google Scholar]
  13. Delgado, J.A.; Agueda, V.I.; Uguina, M.A.; Sotelo, J.L.; Brea, P. Hydrogen recovery from off-gases with nitrogen-rich impurity by pressure swing adsorption using CaX and 5A zeolites. Adsorption 2015, 21, 107–123. [Google Scholar] [CrossRef]
  14. Zhang, L.; Hu, Z.; Jiang, J. Sorption-induced structural transition of zeolitic imidazolate framework-8: A hybrid molecular simulation study. J. Am. Chem. Soc. 2013, 135, 3722–3728. [Google Scholar] [CrossRef] [PubMed]
  15. Perez-Carbajo, J.; Gómez-Álvarez, P.; Bueno-Perez, R.; Merkling, P.J.; Calero, S. Optimisation of the Fischer–Tropsch process using zeolites for tail gas separation. Phys. Chem. Chem. Phys. 2014, 16, 5678–5688. [Google Scholar] [CrossRef] [PubMed]
  16. Yaremov, P.S.; Scherban, N.D.; Ilyin, V.G. Adsorption of nitrogen, hydrogen, methane, and carbon oxides on micro- and mesoporous molecular sieves of different nature. Theor. Exp. Chem. 2013, 48, 394–400. [Google Scholar] [CrossRef]
  17. Wang, Z.M.; Zhang, Y.J.; Liu, T.; Kurmoo, M.; Gao, S. [Fe3(HCOO)6]: A permanent porous diamond framework displaying H2/N2 adsorption, guest inclusion, and guest-dependent magnetism. Adv. Funct. Mater. 2007, 17, 1523–1536. [Google Scholar] [CrossRef]
  18. Zhou, L.; Liu, X.; Li, J.; Wang, N.; Wang, Z.; Zhou, Y. Synthesis of ordered mesoporous carbon molecular sieve and its adsorption capacity for H2, N2, O2, CH4 and CO2. Chem. Phys. Lett. 2005, 413, 6–9. [Google Scholar] [CrossRef]
  19. Peng, X.; Jain, S.K.; Singh, J.K. Adsorption and separation of N2/CH4/CO2/SO2 gases in disordered carbons obtained using hybrid reverse Monte Carlo simulations. J. Phys. Chem. C 2017, 121, 13457–13473. [Google Scholar] [CrossRef]
  20. Ötvös, Z.; Onyestyák, G.; Valyon, J.; Kiricsi, I.; Kónya, Z.; Rees LV, C. The dynamics of H2 and N2 sorption in carbon nanotubes. Appl. Surf. Sci. 2004, 238, 73–76. [Google Scholar] [CrossRef]
  21. Chisholm, N.O.; Anderson, G.C.; McNally, J.F.; Funke, H.H.; Noble, R.D.; Falconer, J.L. Increasing H2/N2 separation selectivity in CHA zeolite membranes by adding a third gas. J. Membr. Sci. 2015, 496, 118–124. [Google Scholar] [CrossRef]
  22. Jung, K.Y.; So, J.H.; Park, S.B.; Yang, S.M. Hydrogen separation from the H2/N2 mixture by using a single and multi-stage inorganic membrane. Korean J. Chem. Eng. 1999, 16, 193–201. [Google Scholar] [CrossRef]
  23. Barrer, R.M. Transient flow of gases in sorbents providing uniform capillary networks of molecular dimensions. Trans. Faraday Soc. 1949, 45, 358–373. [Google Scholar] [CrossRef]
  24. John, K. Selectivity of Clinoptilolite Towards Heavy Metals from Industrial Wastewater: Equilibrium, Kinetic, Thermodynamic and Elution Studies. Eng. Lett. 2021, 29, 158–167. [Google Scholar]
  25. Li, G.; Wang, Q.; Jiang, T.; Luo, J.; Rao, M.; Peng, Z. Roll-up effect of sulfur dioxide adsorption on zeolites FAU 13X and LTA 5A. Adsorption 2017, 23, 699–710. [Google Scholar] [CrossRef]
  26. Bussi, G.; Donadio, D.; Parrinello, M. Canonical sampling through velocity rescaling. J. Chem. Phys. 2007, 126, 014101–014108. [Google Scholar] [CrossRef] [PubMed]
  27. Kotoh, K.; Takashima, S.; Sakamoto, T.; Tsuge, T. Multi-component behaviors of hydrogen isotopes adsorbed on synthetic zeolites 4A and 5A at 77.4K and 87.3K. Fusion Eng. Des. 2010, 85, 1928–1934. [Google Scholar] [CrossRef]
  28. Du, X.; Wu, E. Application of the adsorption potential theory to hydrogen adsorption on zeolites above critical temperature. Acta Phys.-Chim. Sin. 2007, 23, 813–819. [Google Scholar] [CrossRef]
  29. Langmi, H.W.; Book, D.; Walton, A.; Johnson, S.R.; Al-Mamouri, M.M.; Speight, J.D.; Edwards, P.P.; Harris, I.R.; Anderson, P.A. Hydrogen storage in ion-exchanged zeolites. J. Alloys Compd. 2005, 404–406, 637–642. [Google Scholar] [CrossRef]
  30. Kazansky, V.B.; Borovkov, V.Y.; Serich, A.; Karge, H.G. Low temperature hydrogen adsorption on sodium forms of faujasites: Barometric measurements and drift spectra. Microporous Mesoporous Mater. 1998, 22, 251–259. [Google Scholar] [CrossRef]
  31. Sircar, A.; Devi, V.G.; Yadav, D.; Mishra, J.; Ranjana, G.; Gayathry, J.M.; Tomar, R.; Pragnesh, D.; Dave, P. Study and characterization of potential adsorbent materials for the design of the hydrogen isotopes extraction and analysis system. Fusion Eng. Des. 2021, 166, 112308. [Google Scholar] [CrossRef]
  32. Wang, J.; Wolf, R.M.; Caldwell, J.W.; Kollman, A.; Case, D.A. Development and testing of a general amber force field. J. Comput. Chem. 2004, 25, 1157–1174. [Google Scholar] [CrossRef] [PubMed]
  33. Fu, Y.; Liu, Y.; Yang, X.; Li, Z.; Jiang, L.; Zhang, C.; Wang, H.; Yang, R.T. Thermodynamic analysis of molecular simulations of N2 and O2 adsorption on zeolites under plateau special conditions. Appl. Surf. Sci. 2019, 480, 868–875. [Google Scholar] [CrossRef]
  34. Simon, C.M.; Smit, B.; Maciej, H. pyIAST: Ideal adsorbed solution theory (IAST) Python package. Comput. Phys. Commun. 2016, 200, 364–380. [Google Scholar] [CrossRef]
  35. Muhtaseb, S.A.; Ritter, J.A. New virial-type model for predicting single-and multicomponent isosteric heats of adsorption. Ind. Eng. Chem. Res. 1998, 37, 684–696. [Google Scholar] [CrossRef]
  36. Bär, N.K.; Ernst, H.; Jobic, H.; Kärger, J. Combined quasi-elastic neutron scattering and NMR study of hydrogen diffusion in zeolites. Magn. Reson. Chem. 1999, 37, 79–83. [Google Scholar] [CrossRef]
  37. García-Pérez, E.; Parra, J.B.; Ania, C.O.; Dubbeldam, D.; Vlugt, T.J.H.; Castillo, J.M.; Merkling, P.J.; Calero, S. Unraveling the argon adsorption processes in MFI-Type zeolite. J. Phys. Chem. C 2008, 112, 9976–9979. [Google Scholar] [CrossRef]
  38. Vlugt, T.J.H.; Schenk, M. Influence of framework flexibility on the adsorption properties of hydrocarbons in the zeolite silicalite. J. Phys. Chem. B 2002, 106, 12757–12763. [Google Scholar] [CrossRef]
  39. Baerlocher, C.; McCusker, L.B. Database of Zeolite Structures. Available online: www.iza-structure.org (accessed on 1 August 2023).
  40. Hutter, J.; Iannuzzi, M.; Schiffmann, F.; VandeVondele, J. cp2k: Atomistic simulations of condensed matter systems. WIREs Comput. Mol. Sci. 2014, 4, 15–25. [Google Scholar] [CrossRef]
  41. Perdew, J.P.; Burke, K.; Ernzerhof, M. Generalized gradient approximation made simple. Phys. Rev. Lett. 1996, 77, 3865–3868. [Google Scholar] [CrossRef]
  42. Grimme, S.; Antony, J.; Ehrlich, S.; Krieg, H. A consistent and accurate ab initio parametrization of density functional dispersion correction (DFT-D) for the 94 elements H-Pu. J. Chem. Phys. 2010, 132, 154104–154123. [Google Scholar] [CrossRef]
  43. Vujić, B.; Lyubartsev, A.P. Transferable force-field for modelling of CO2, N2, O2 and Ar in all silica and Na+ exchanged zeolites. Model. Simul. Mater. Sci. Eng. 2016, 24, 045002–045028. [Google Scholar] [CrossRef]
  44. Pantatosaki, E.; Papadopoulos, G.K. On the computation of long-range interactions in fluids under confinement: Application to pore systems with various types of spatial periodicity. J. Chem. Phys. 2007, 127, 164723–164733. [Google Scholar] [CrossRef] [PubMed]
  45. Kowsari, M.H.; Naderlou, S. Understanding the dynamics, self-diffusion, and microscopic structure of hydrogen inside the nanoporous Li-LSX zeolite. Microporous Mesoporous Mater. 2017, 240, 39–49. [Google Scholar] [CrossRef]
  46. Du, X. Molecular dynamics study of hydrogen on Alkali-Earth metal cations exchanged X zeolites. Int. J. Chem. Eng. 2014, 2014, 701057. [Google Scholar]
  47. Pantatosaki, E.; Papadopoulos, G.K.; Jobic, H.; Theodorou, D.N. Combined atomistic simulation and quasielastic neutron scattering study of the low-temperature dynamics of hydrogen and deuterium confined in NaX zeolite. J. Phys. Chem. B 2008, 112, 11708–11715. [Google Scholar] [CrossRef]
  48. Huang, X.; Martín-Calvo, A.; Mulder MJ, J.; van Acht SC, J.; Gutiérrez-Sevillano, J.J.; García-Navarro, J.C.; Calero, S. Effect of zeolitic imidazolate framework topology on the purification of hydrogen from coke oven gas. ACS Sustain. Chem. Eng. 2023, 11, 8020–8034. [Google Scholar] [CrossRef]
  49. da Silva, G.C.Q.; Simon, J.M.; Salazar, J.M. Role of electrical charges on the adsorption of hydrogen: Something old, something new. J. Chem. Phys. 2022, in press; hal-03822161f. [Google Scholar]
  50. Peng, X.; Cao, D.; Wang, W. Computational characterization of hexagonally ordered carbon nanopipes CMK-5 and structural optimization for H2 storage. Langmuir 2009, 25, 10863–10872. [Google Scholar] [CrossRef]
  51. Darkrim, F.; Aoufi, A.; Malbrunot, P.; Levesque, D. Hydrogen adsorption in the NaA zeolite: A comparison between numerical simulations and experiments. J. Chem. Phys. 2000, 112, 5991–5999. [Google Scholar] [CrossRef]
  52. van Duijnen, P.T.; Swart, M. Molecular and atomic polarizabilities: Thole’s Model revisited. J. Phys. Chem. A 1998, 102, 2399–2407. [Google Scholar] [CrossRef]
  53. Shannon, R.D. Dielectric polarizabilities of ions in oxides and fluorides. J. Appl. Phys. 1993, 73, 348–366. [Google Scholar] [CrossRef]
  54. Dubbeldam, D.; Calero, S.; Ellis, D.E.; Snurr, R.Q. RASPA: Molecular simulation software for adsorption and diffusion in flexible nanoporous materials. Mol. Simul. 2016, 42, 81–101. [Google Scholar] [CrossRef]
  55. Dubbeldam, D.; Torres-Knoop, A.; Walton, K.S. On the inner workings of Monte Carlo codes. Mol. Simul. 2013, 39, 1253–1292. [Google Scholar] [CrossRef]
  56. Erdős, M.; Geerdink, D.F.; Martin-Calvo, A.; Pidko, E.A.; Broeke, L.J.P.v.D.; Calero, S.; Vlugt, T.J.H.; Moultos, O.A. In silico screening of zeolites for high-pressure hydrogen drying. Appl. Mater. Interfaces 2021, 13, 8383–8394. [Google Scholar] [CrossRef]
  57. Düren, T.; Sarkisov, L.; Yaghi, O.M.; Snurr, R.Q. Design of new materials for methane storage. Langmuir 2004, 20, 2683–2689. [Google Scholar] [CrossRef]
  58. Lee, Y.; Poloni, R.; Kim, J. Probing Gas Adsorption in MOFs Using an Efficient Ab Initio Widom Insertion Monte Carlo Method. J. Comput. Chem. 2016, 37, 2808–2815. [Google Scholar] [CrossRef] [PubMed]
  59. Frenkel, D.; Smit, B.; Tobochnik, J.; McKay, S.R.; Christian, W. Understanding molecular simulation. Comput. Phys. 1997, 11, 351–354. [Google Scholar] [CrossRef]
  60. Schnabel, T.; Vrabec, J.; Hasse, H. Unlike Lennard–Jones parameters for vapor–liquid equilibria. J. Mol. Liq. 2007, 135, 170–178. [Google Scholar] [CrossRef]
  61. Toukmaji, A.Y.; Board, J.A. Ewald summation techniques in perspective: A survey. Comput. Phys. Commun. 1996, 95, 73–92. [Google Scholar] [CrossRef]
  62. VandeVondele, J.; Krack, M.; Mohamed, F.; Parrinello, M.; Chassaing, T.; Hutter, J. Quickstep: Fast and accurate density functional calculations using a mixed Gaussian and plane waves approach. Comput. Phys. Commun. 2005, 167, 103–128. [Google Scholar] [CrossRef]
  63. Lu, T.; Chen, F. Multiwfn: A multifunctional wavefunction analyzer. J. Comput. Chem. 2011, 33, 580–592. [Google Scholar] [CrossRef] [PubMed]
  64. VandeVondele, J.; Hutter, J. Gaussian basis sets for accurate calculations on molecular systems in gas and condensed phases. J. Chem. Phys. 2007, 127, 114105–114114. [Google Scholar] [CrossRef] [PubMed]
  65. Goedecker, S.; Teter, M.; Hutter, J. Separable dual-space Gaussian pseudopotentials. Phys. Rev. B 1996, 54, 1703–1710. [Google Scholar] [CrossRef] [PubMed]
Figure 1. Adsorption isotherms of H2 (a) and N2 (b) in NaA, CaA, NaX, and CaX zeolites at 77 K, 0–1 bar, and the reported force fields by K44, E43, P46, G342, V41, and H47.
Molecules 29 03686 g001
Figure 2. Adsorption isotherms of H2 (a) and N2 (b) in NaA, CaA, NaX, and CaX zeolites at 298 K, 0–10 bar, and the reported force fields by K44, E43, P46, G342, V41, and H47.
Molecules 29 03686 g002
Figure 3. The adsorption selectivity for N2 over H2 in NaA, CaA, NaX, and CaX, which corresponds to the binary H2-N2 mixture (H2/N2, 50/50, v/v): (a) 77 K, (b) 298 K.
Molecules 29 03686 g003
Figure 4. Adsorption energy of H2 and N2 in NaA, CaA, NaX, and CaX at 1 bar: (a) 77 K, (b) 298 K.
Molecules 29 03686 g004
Figure 5. Typical binding geometry of H2 and N2 adsorbed in the super cage of the zeolite employed according to our computer simulations at 77 K. (a,b) NaA, (c,d) CaA, H2 molecule (white), N2 molecule (blue), Si-zeolite (pink), Al-zeolite (yellow), O-zeolite (red), Na+ cation (purple), and Ca2+ cation (green).
Molecules 29 03686 g005
Figure 6. Typical binding geometry of H2 and N2 adsorbed in the super cage of the zeolite employed according to our computer simulations at 77 K. (a,b) NaX, (c,d) CaX, H2 molecule (white), N2 molecule (blue), Si-zeolite (pink), Al-zeolite (yellow), O-zeolite (red), Na+ cation (purple), and Ca2+ cation (green).
Molecules 29 03686 g006
Figure 7. Representative interatomic guest–pore radial distribution functions (RDFs) corresponding to H2 at 77 K in (a) NaA, (b) CaA, (c) NaX, and (d) CaX. H2 molecules with Al-zeolite (blue), with Si-zeolite (green), with O-zeolite (red), and with Na+/Ca2+ cations (black).
Molecules 29 03686 g007
Figure 8. Representative interatomic guest–pore radial distribution functions (RDFs) corresponding to N2 at 77 K in (a) NaA, (b) CaA, (c) NaX, and (d) CaX. N2 molecules with Al-zeolite (blue), with Si-zeolite (green), with O-zeolite (red), and with Na+/Ca2+ cations (black).
Molecules 29 03686 g008
Figure 9. Mean square displacements for H2-N2 mixture (H2/N2, 50/50, v/v) in (a) NaA, (b) CaA, (c) NaX, and (d) CaX at 77 K. The solid line is a fitted line.
Molecules 29 03686 g009
Figure 10. Mean square displacements for H2-N2 mixture (H2/N2, 50/50, v/v) in (a) NaA, (b) CaA, (c) NaX, and (d) CaX at 298 K. The solid line is a fitted line.
Molecules 29 03686 g010
Figure 11. A slice of the redistribution of charge density in (a) NaA, (b) NaX, (c) CaA, and (d) CaX after adsorbing H2 molecules.
Molecules 29 03686 g011
Figure 12. A slice of the redistribution of charge density in (a) NaA, (b) NaX, (c) CaA, and (d) CaX after adsorbing N2 molecules.
Molecules 29 03686 g012
Table 1. The physical parameters of H2 and N2.
MolecularKinetic Diameter
(Å)
Polarizability
(Å)
Dipole Moment
(D)
Quadruple Moment
(D Å)
H22.890.800
N23.61.7401.18
Table 2. Heats of adsorption at infinite dilution of H2 and N2 on zeolites.
MolecularZeoliteExperiment Adsorption Heat (kJ/mol)Simulation Adsorption Heat (kJ/mol)
77 K298 K77 K298 K
H2NaA−10.59−4.47−9.23−4.50
CaA−7.40−4.32−8.12−5.51
NaX−10.54−4.30−9.47−4.94
CaX−6.39−4.51−5.25−5.99
N2NaA−17.07−16.71−17.16−18.65
CaA−18.06−15.01−21.87−17.23
NaX−18.98−14.19−17.29−15.07
CaX−11.73−11.05−15.51−11.69
Table 3. Computed self-diffusion coefficients of H2-N2 mixture (H2/N2, 50/50, v/v) in LTA- and FAU-type zeolites at 77 K.
ZeolitesNaACaANaXCaX
H22/ps)10.119.620.319.3
N22/ps)3.82.82.73.0
H2/N22.67.07.6 6.4
Table 4. Computed self-diffusion coefficients of H2-N2 mixture (H2/N2, 50/50, v/v) in LTA- and FAU-type zeolites at 298 K.
ZeolitesNaACaANaXCaX
H22/ps)52.846.032.257.9
N22/ps)10.47.012.210.1
H2/N25.16.52.75.7
Table 5. Physicochemistry characteristics of LTA and FAU Systems.
NaACaANaXCaX
Accessible pore volume (cm3/g)0.280.30.2610.31
Supercage pore size (Å)457.48
CationNaCaNaCa
Number of cations (N)96488844
Si/Al1111
Table 6. Lennard-Jones interactions and partial charges.
Atom Typesε (K)σ (Å)Q (e)CITE
H2382.92-[48]
N295.23.75-[49]
H2-Si392.82.234[48]
H2-Al42.52.952.089[48]
H2-O473.08−1.307[48]
Na83.50.8[50]
Ca782.982[45]
Disclaimer/Publisher’s Note: The statements, opinions and data contained in all publications are solely those of the individual author(s) and contributor(s) and not of MDPI and/or the editor(s). MDPI and/or the editor(s) disclaim responsibility for any injury to people or property resulting from any ideas, methods, instructions or products referred to in the content.

