Experimental Study on Combined Microwave–Magnetic Separation–Flotation Coal Desulfurization


Abstract
1. Introduction
2. Results
2.1. Wet Strong Magnetic Experiment
2.1.1. Grinding Ore Fineness Experiment
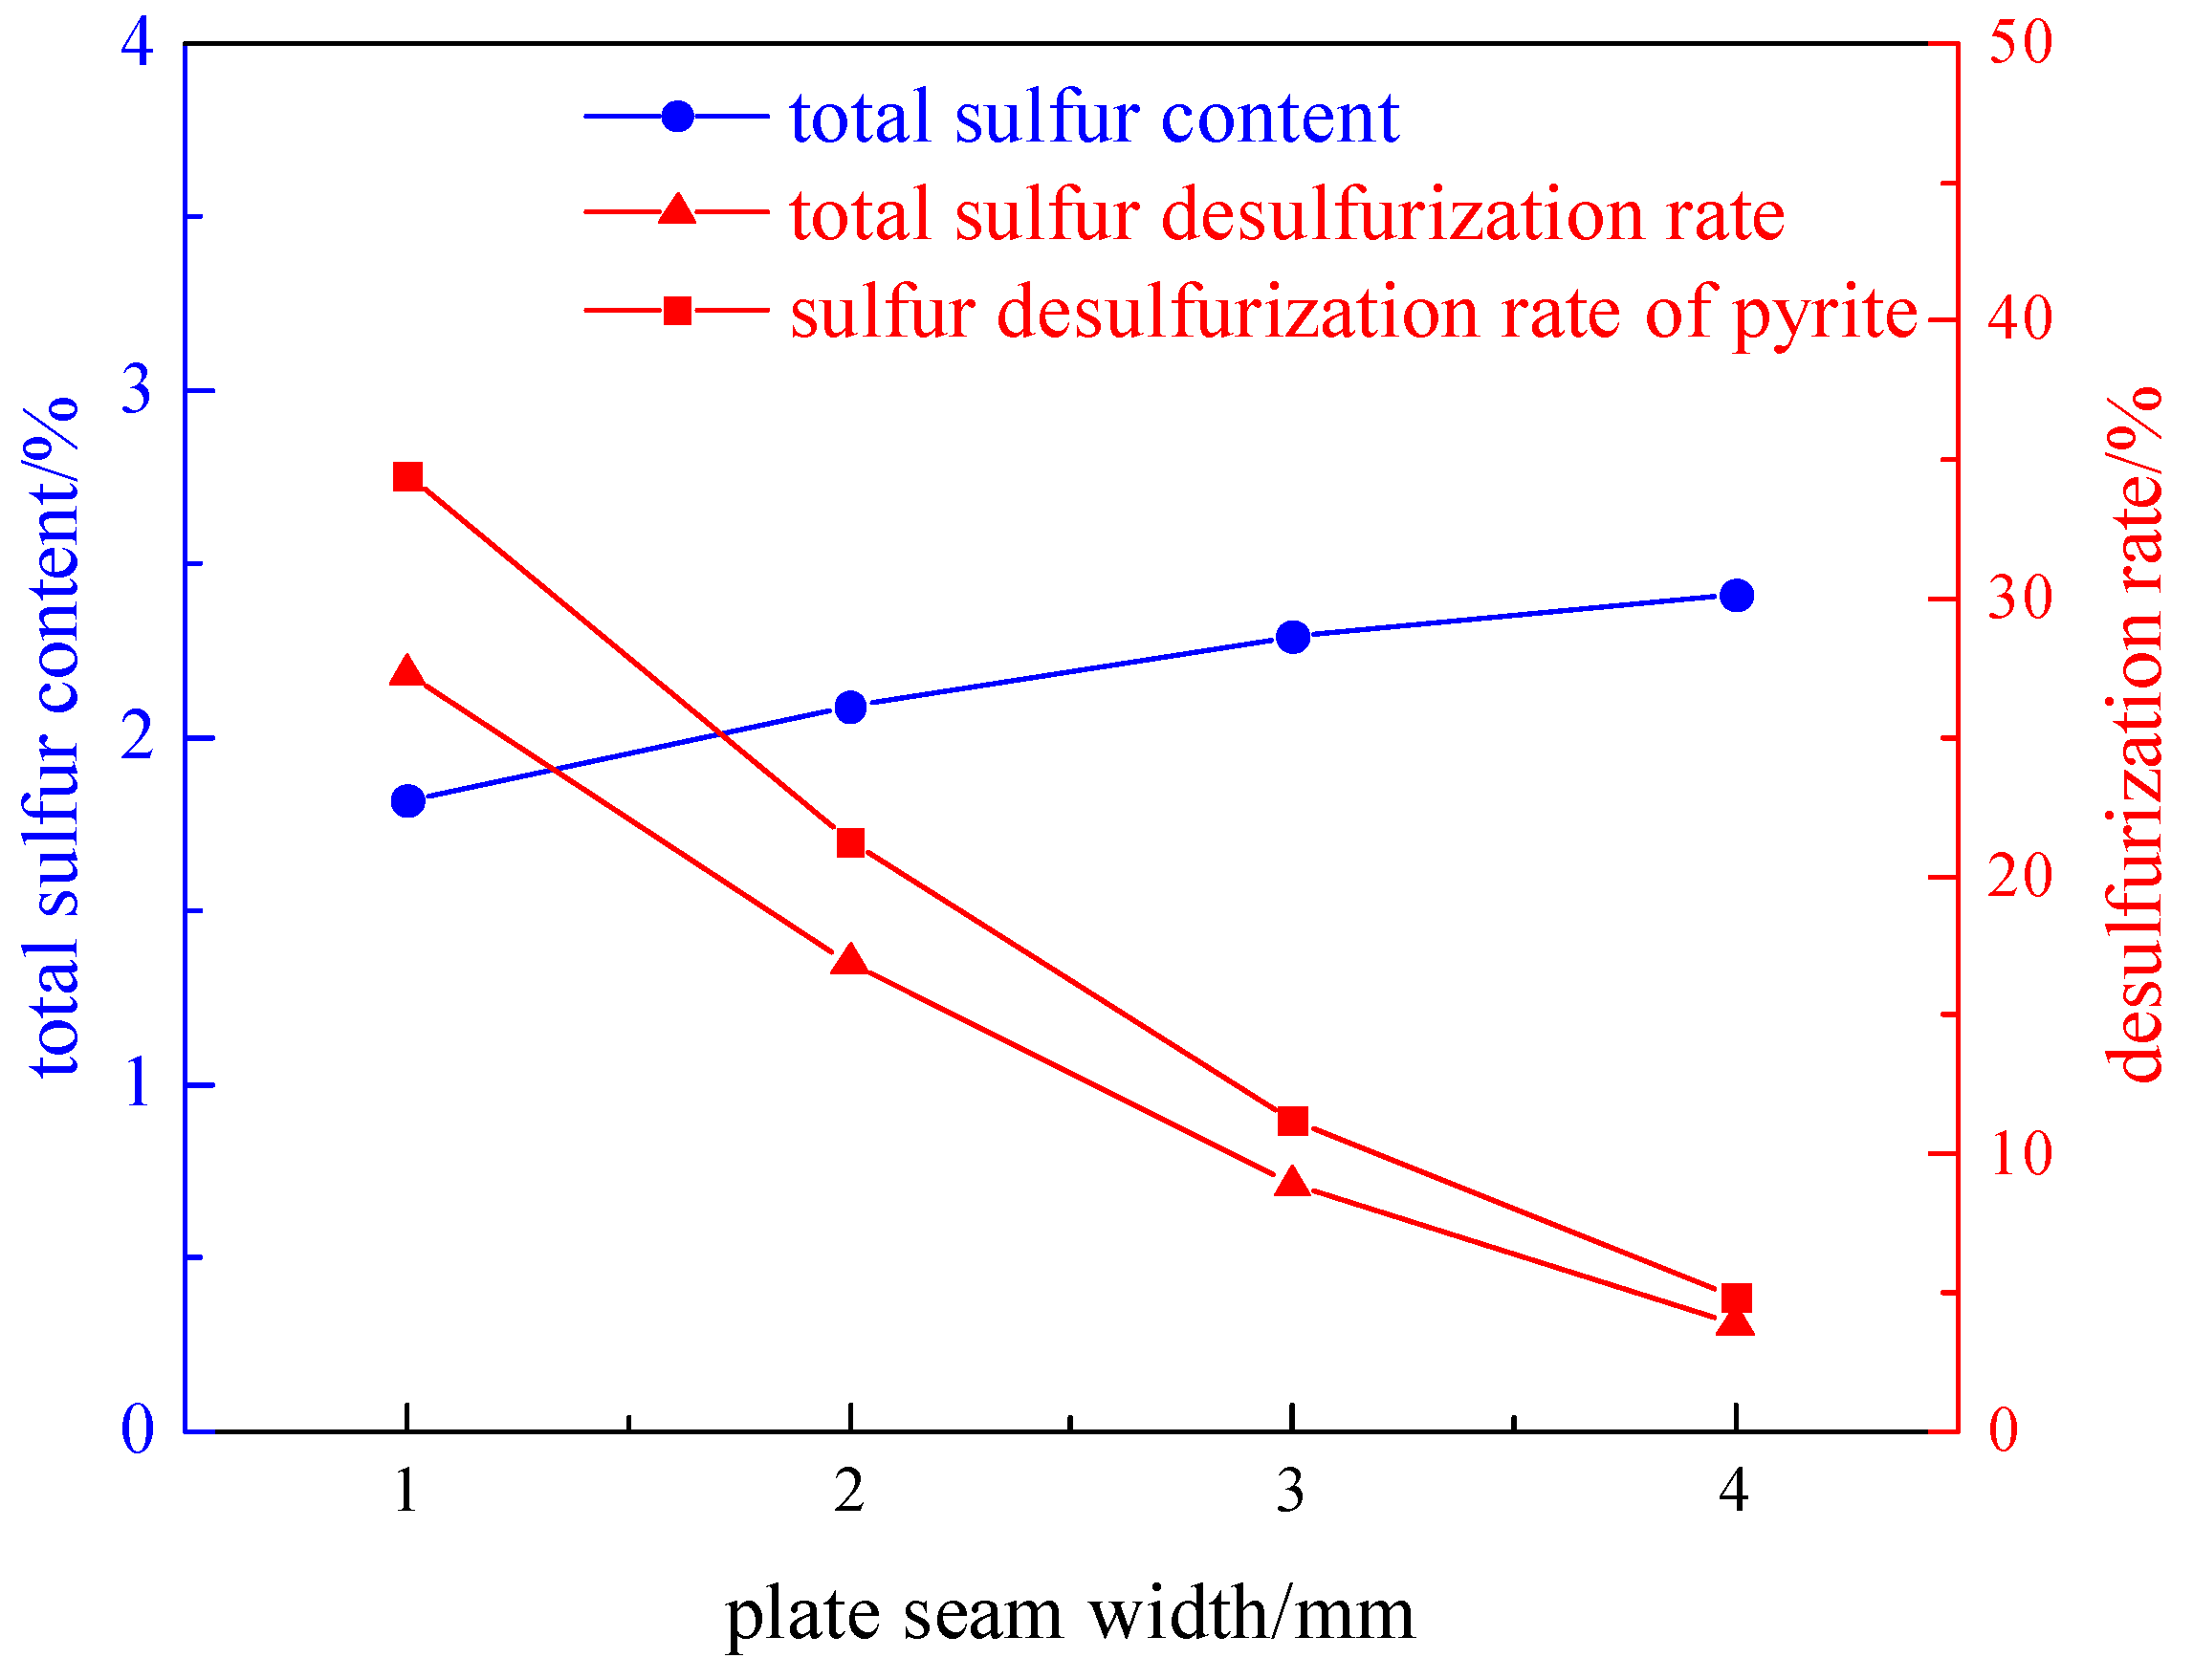
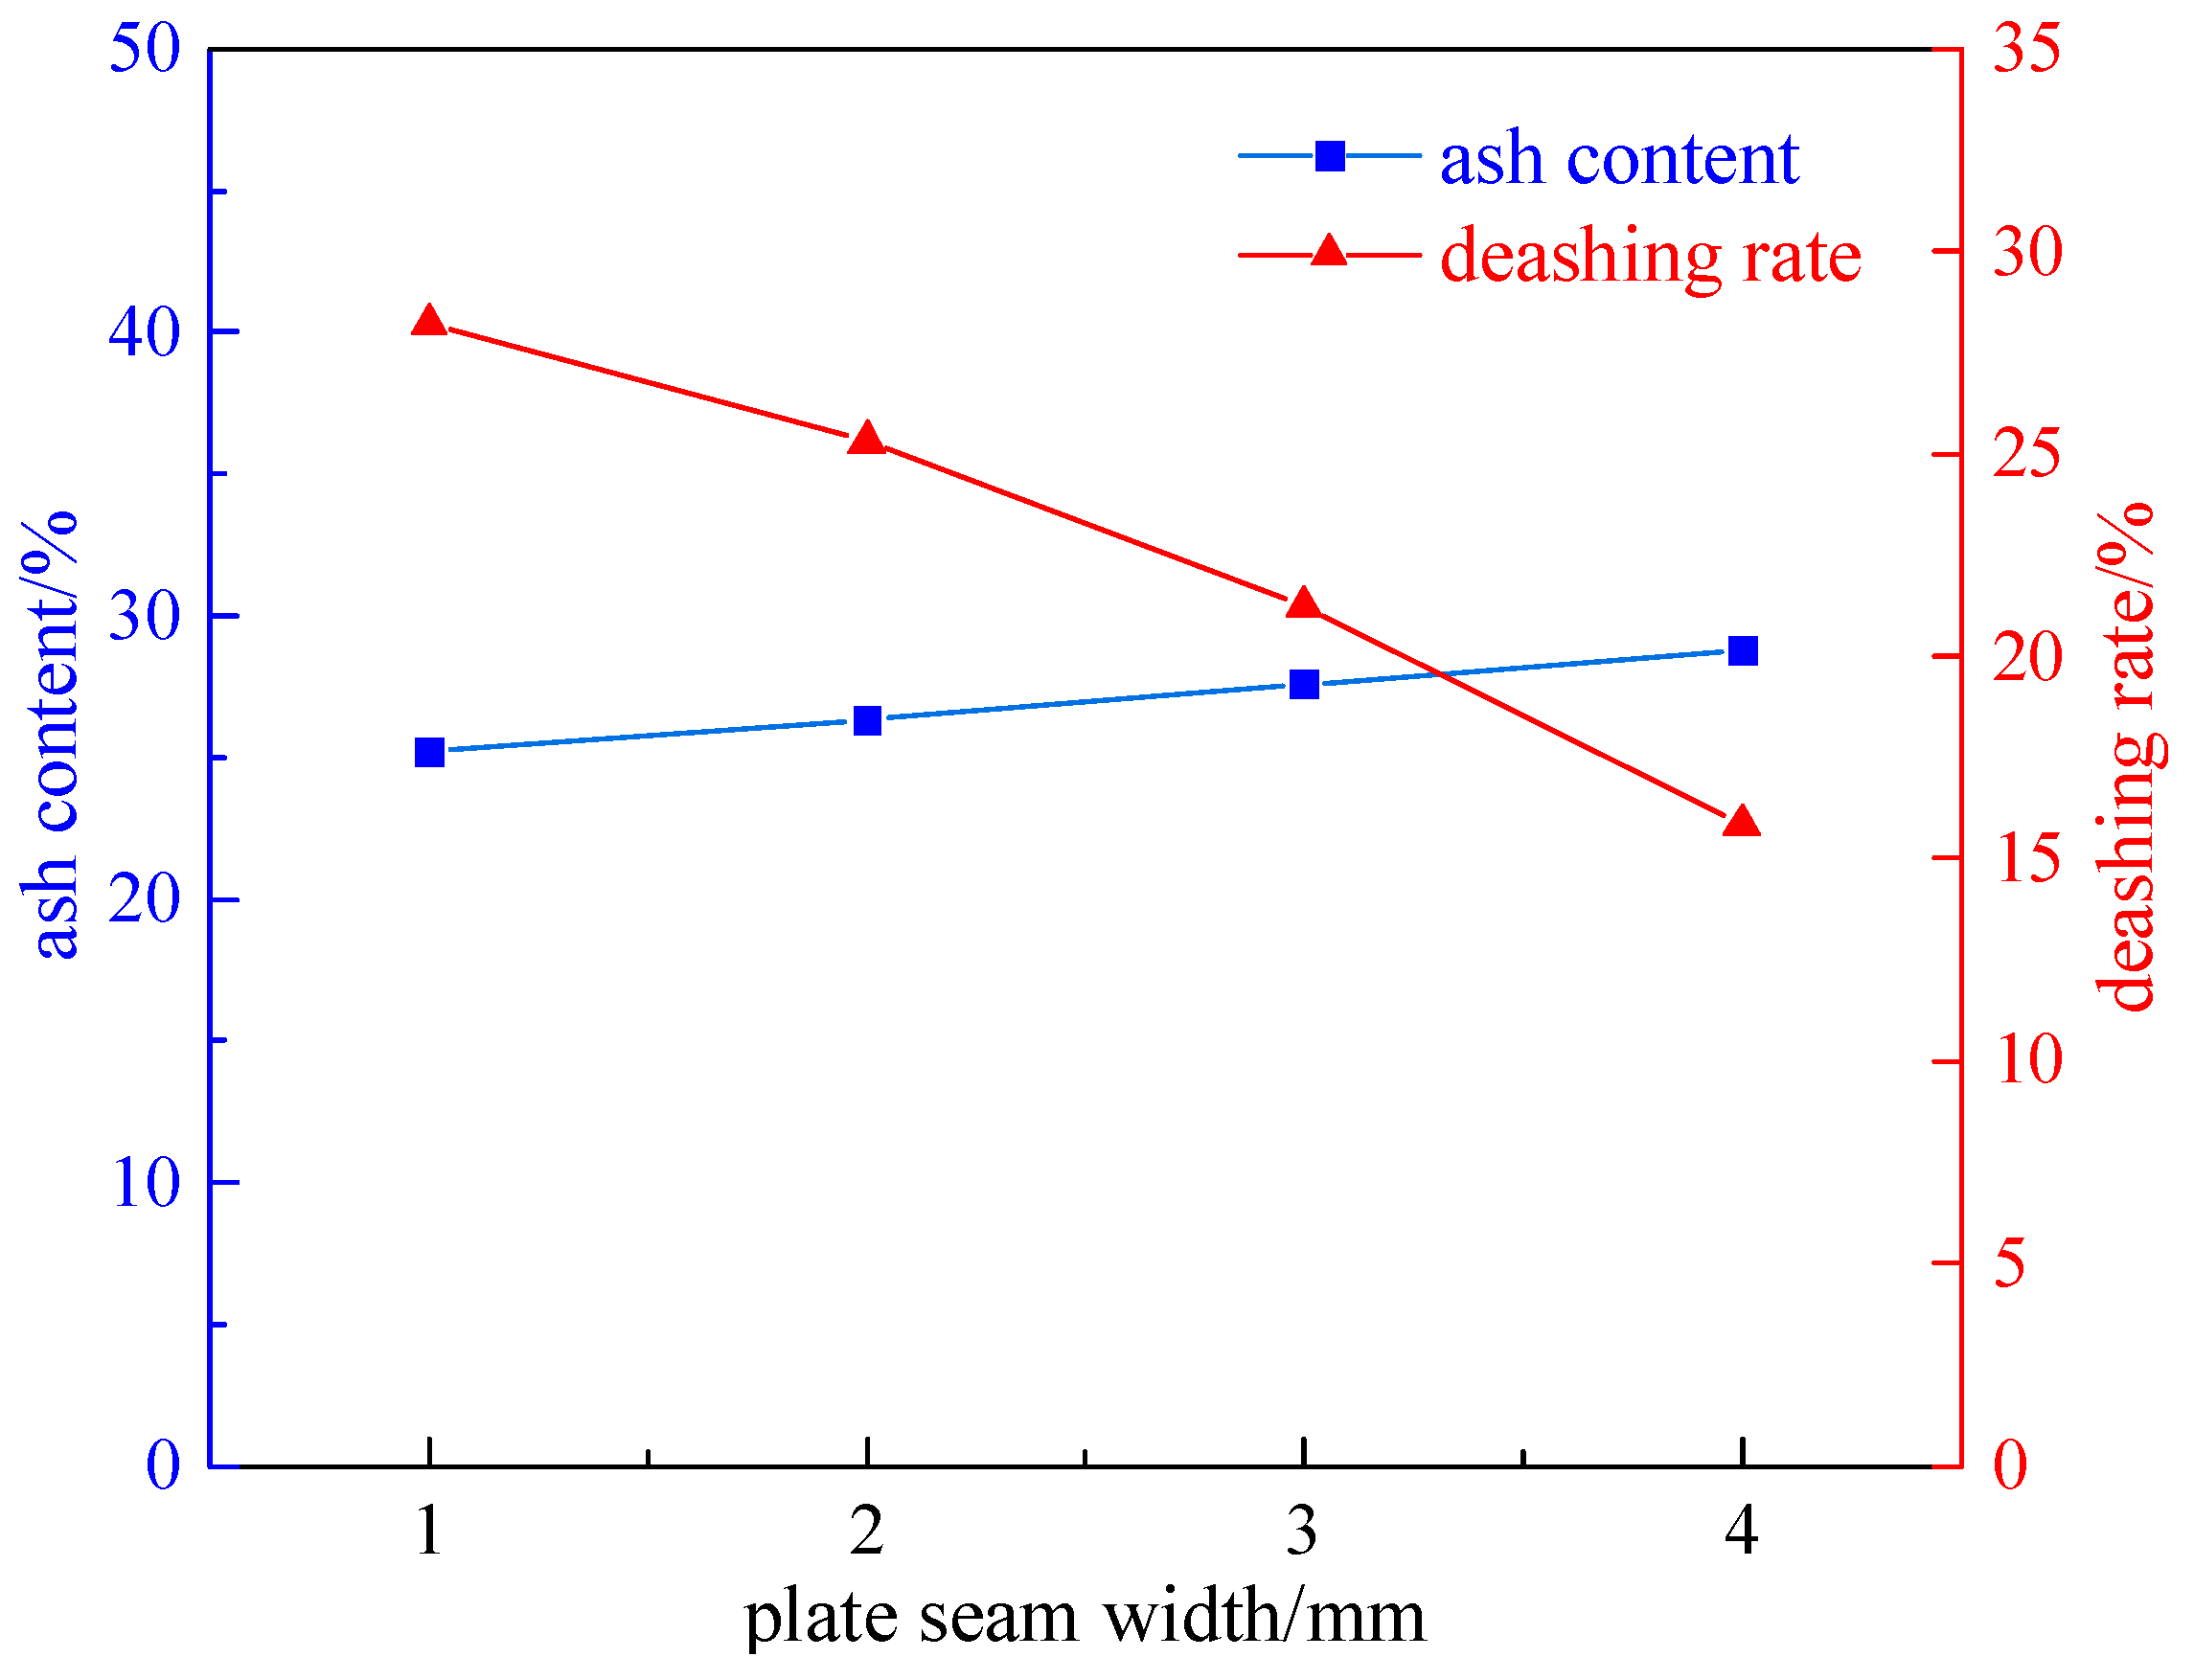
2.1.2. Magnetic Separator Plate Seam Width Experiment
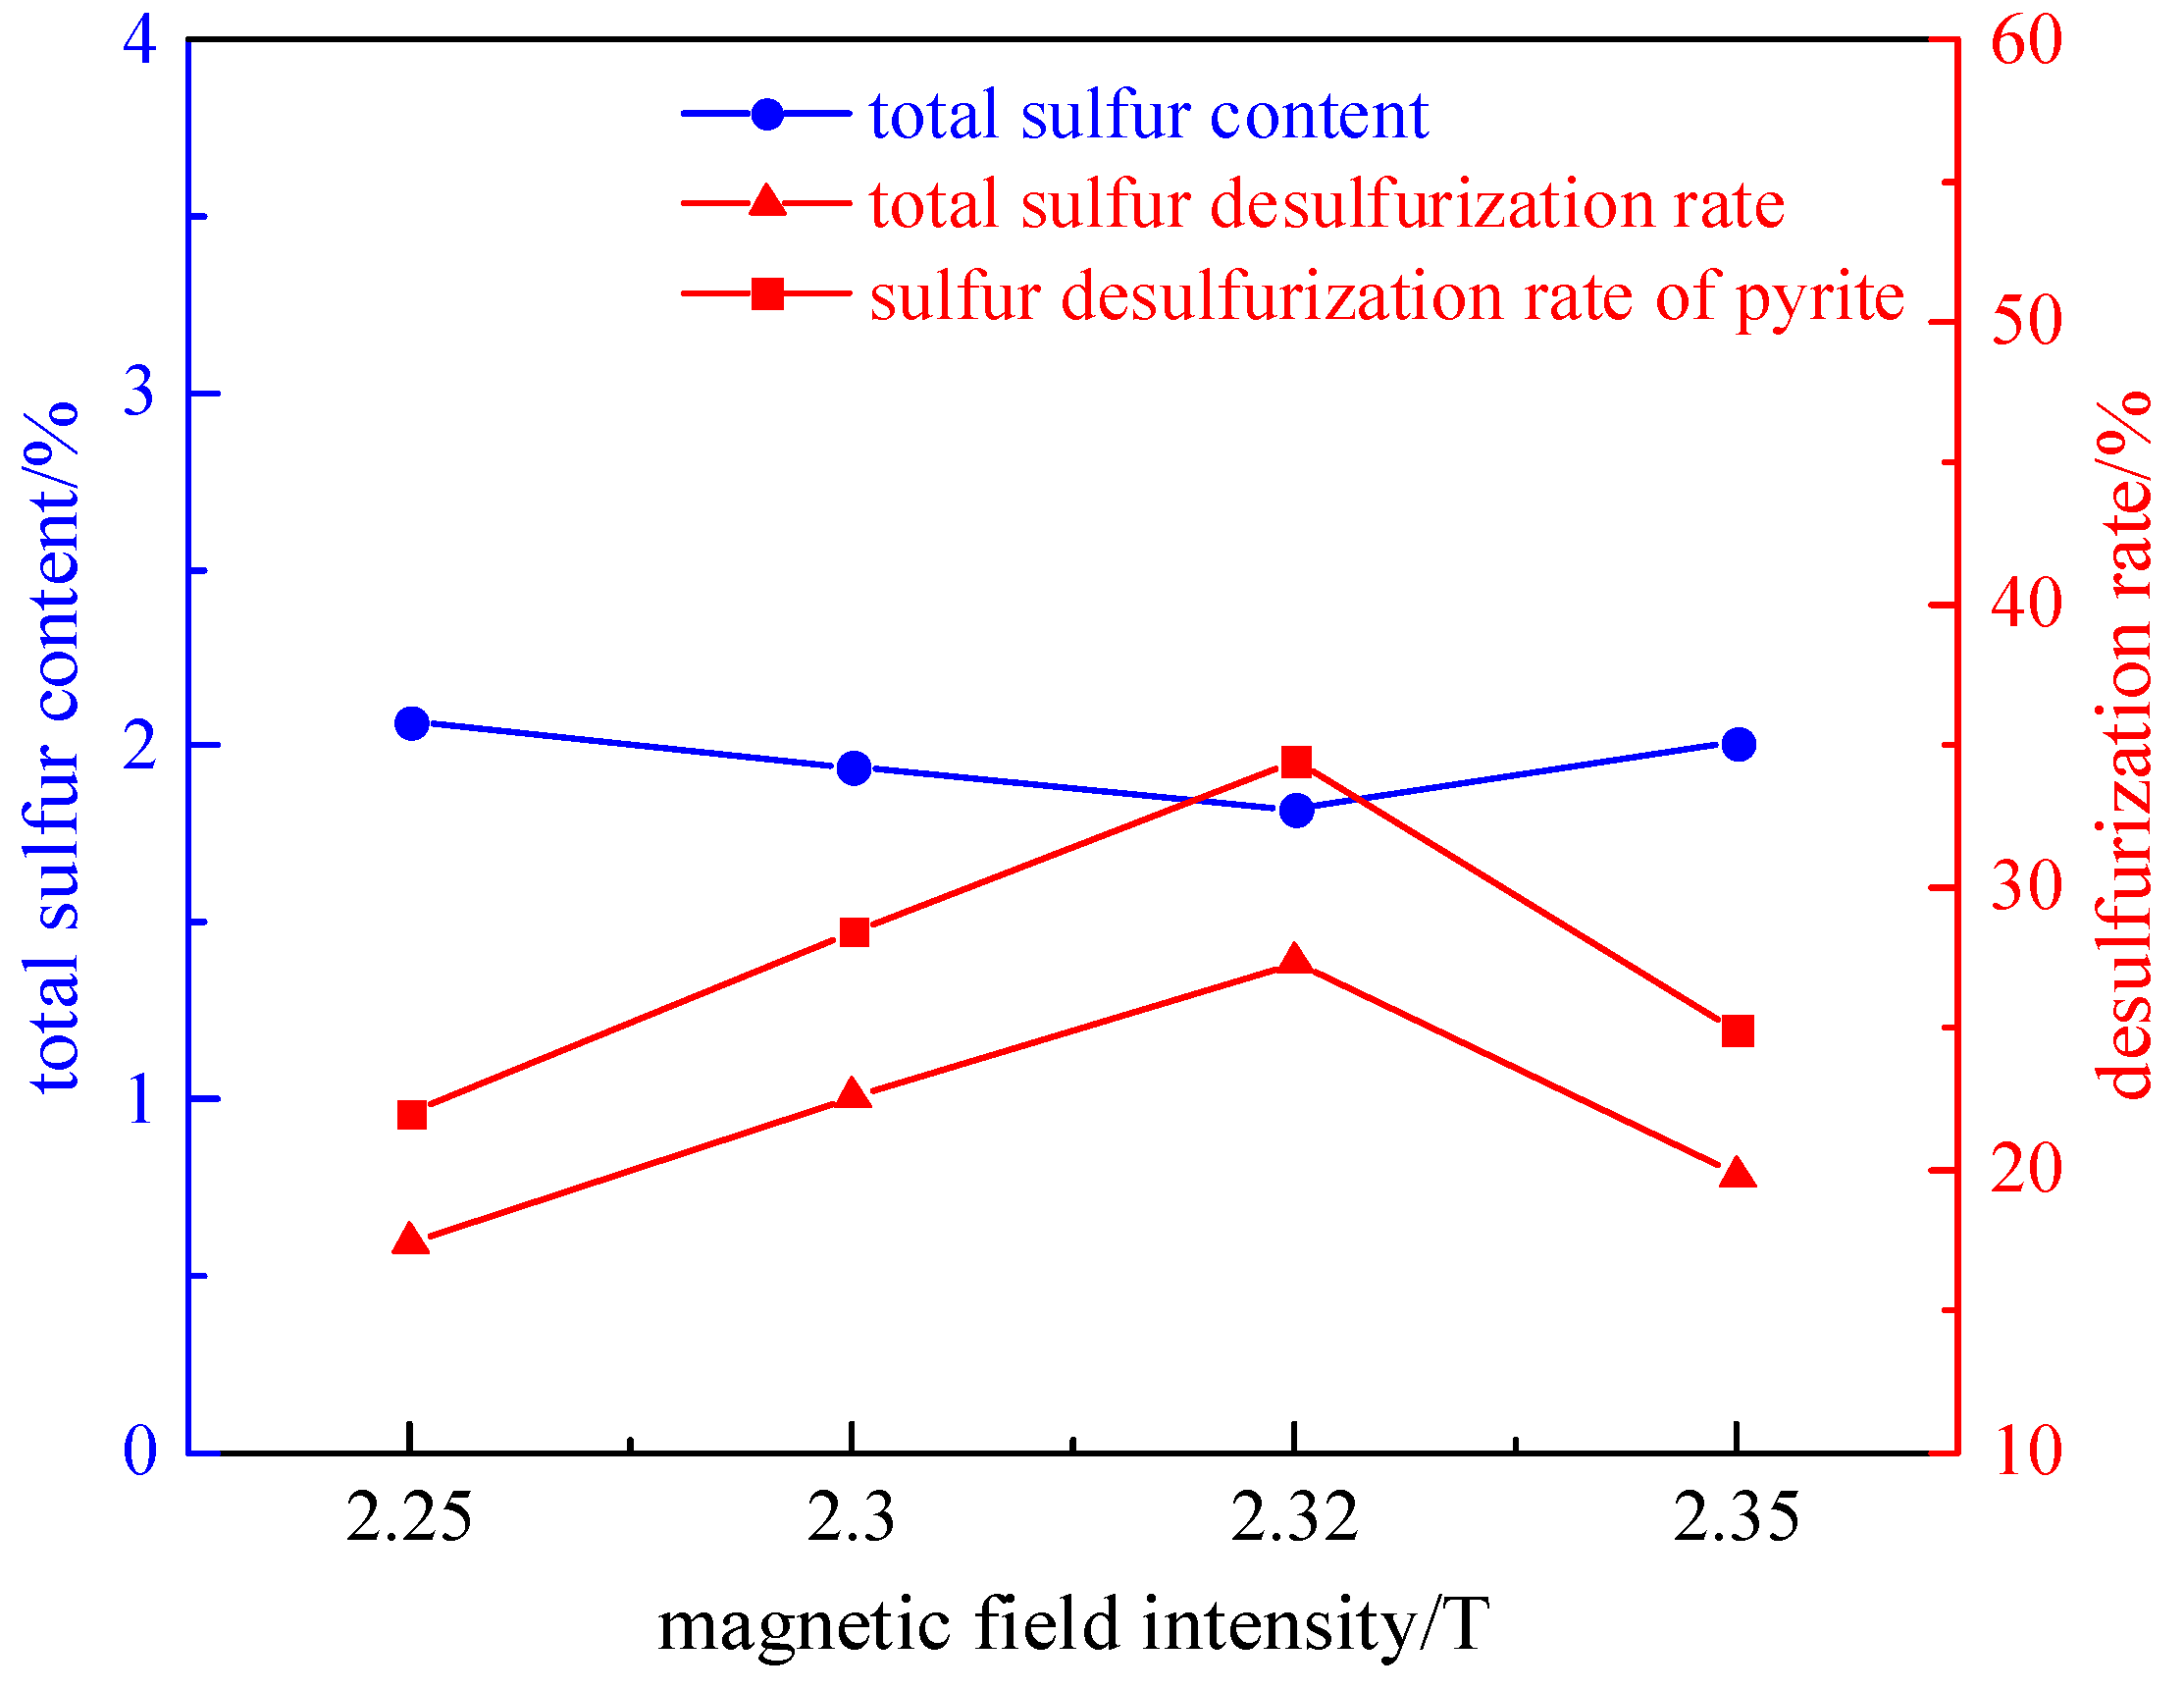
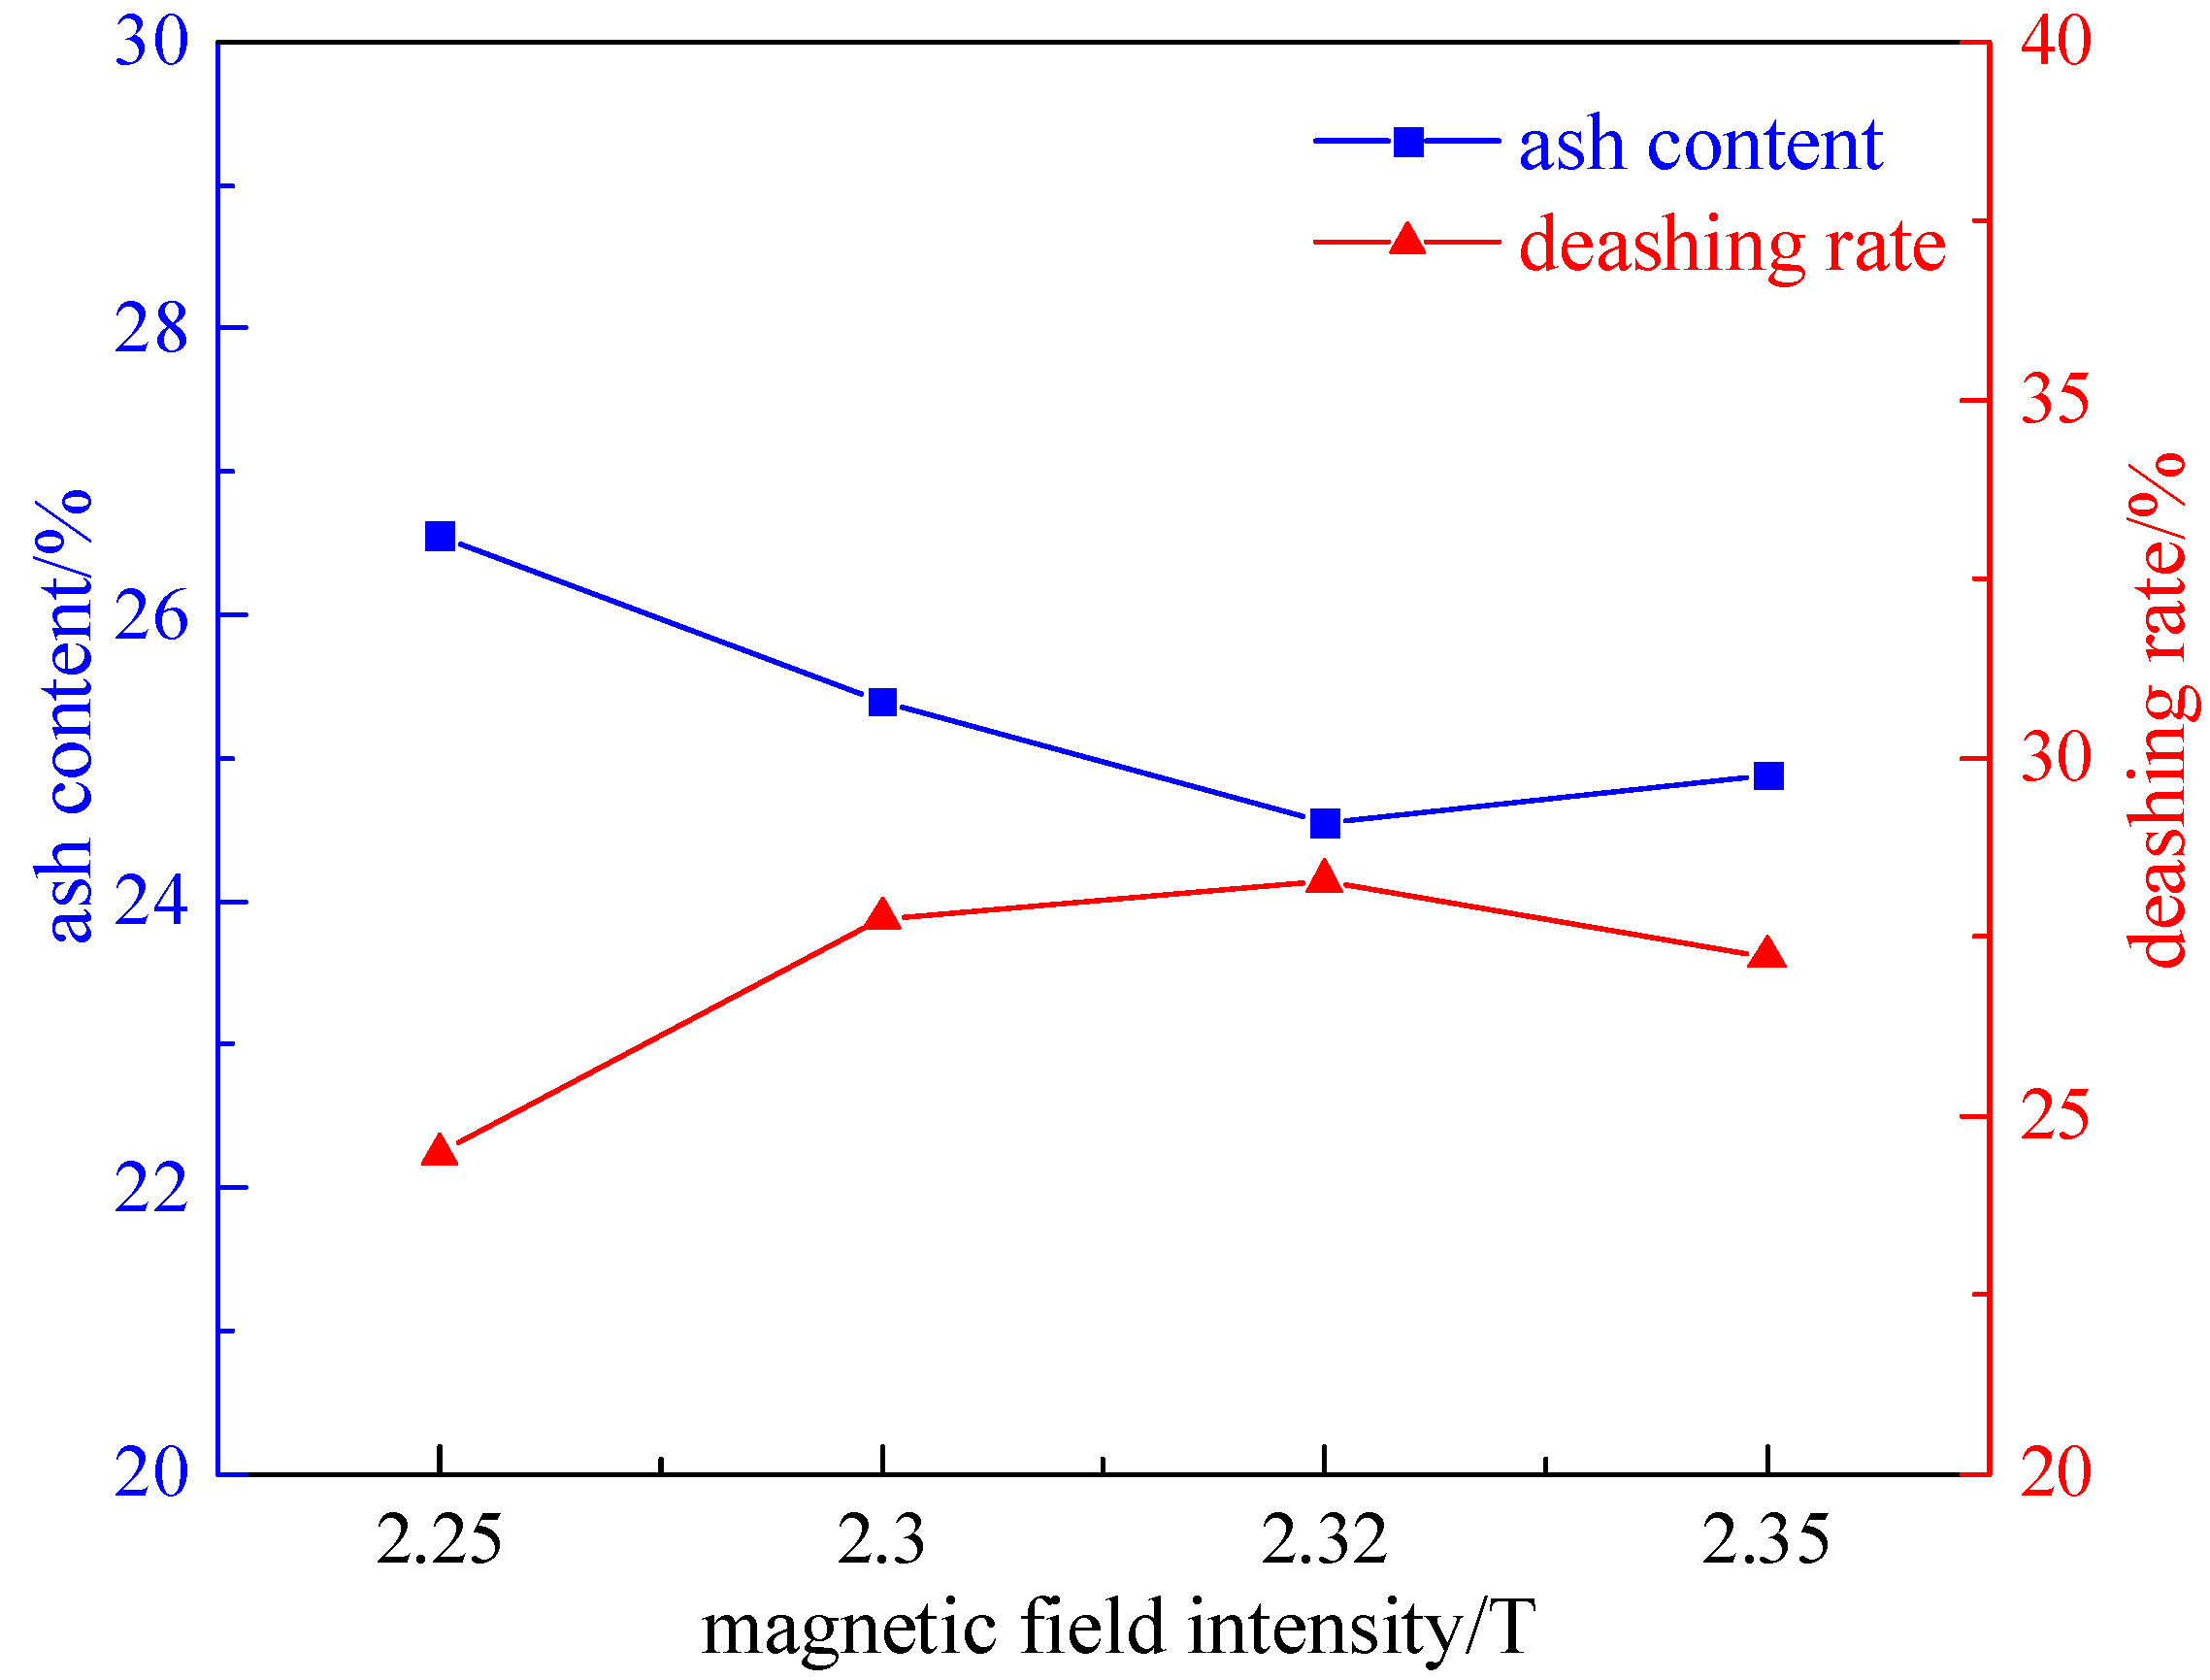
2.1.3. Magnetic Field Strength Experiment
2.2. Microwave Magnetic Separation Experiment
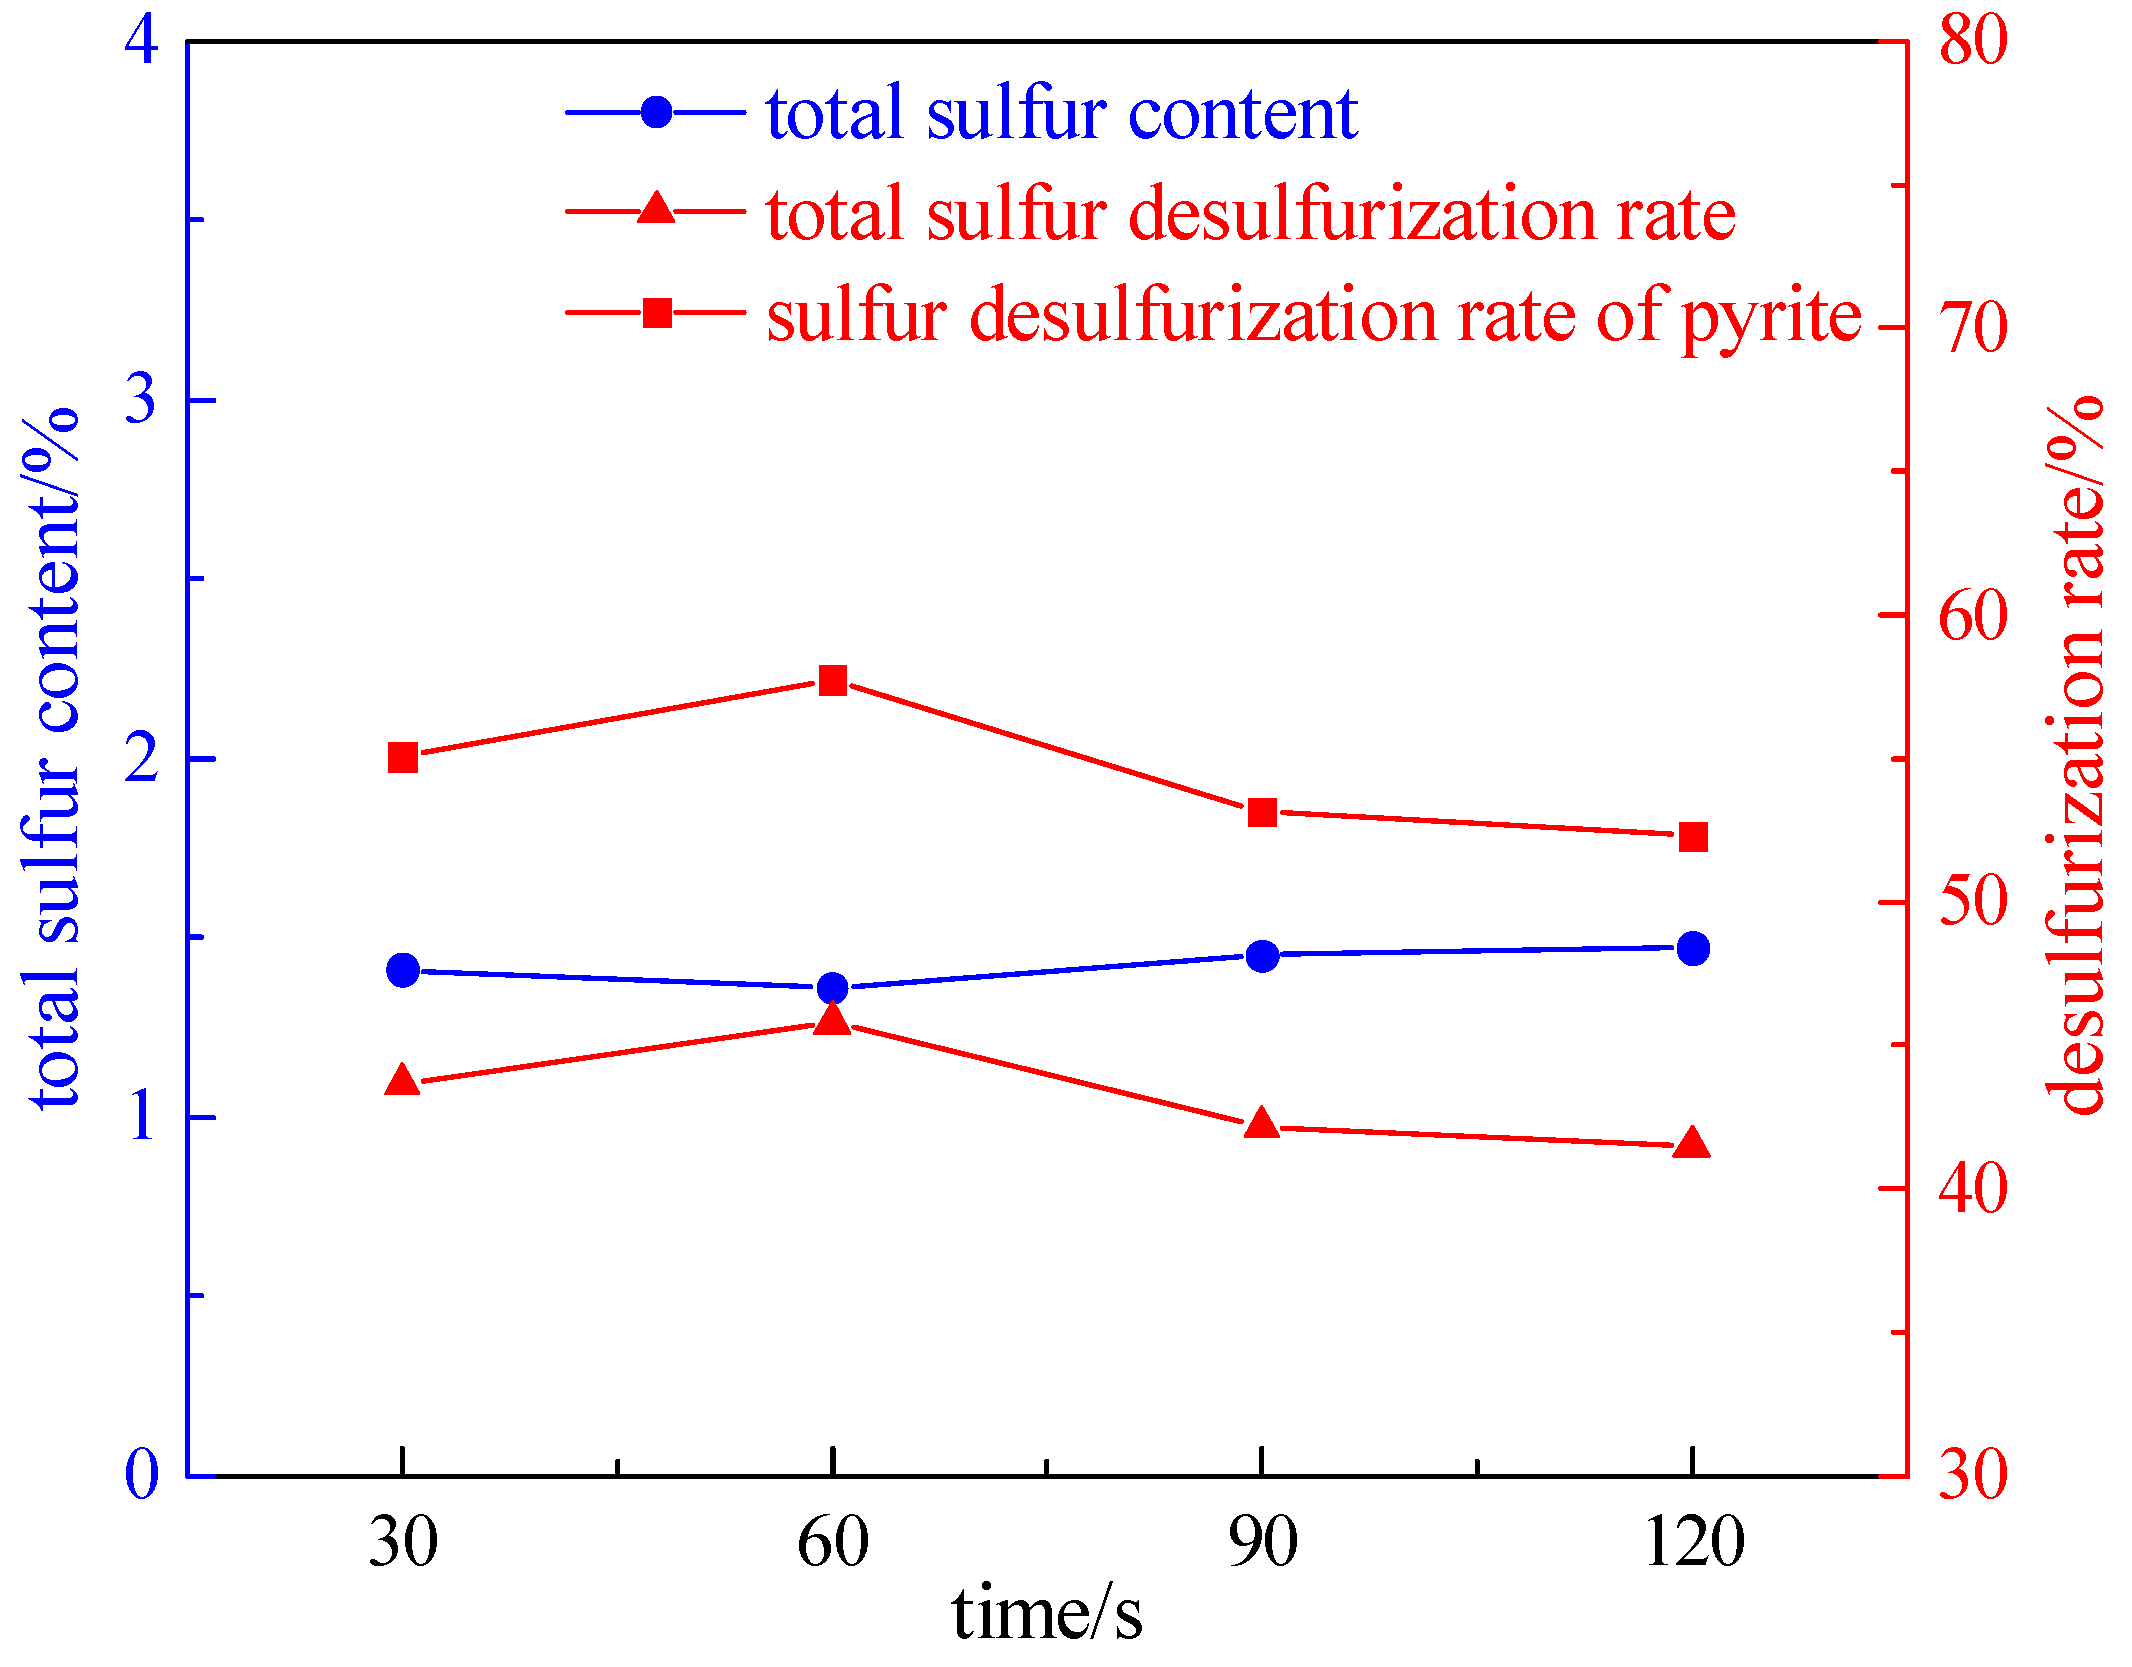
2.2.1. Irradiation Time Experiment
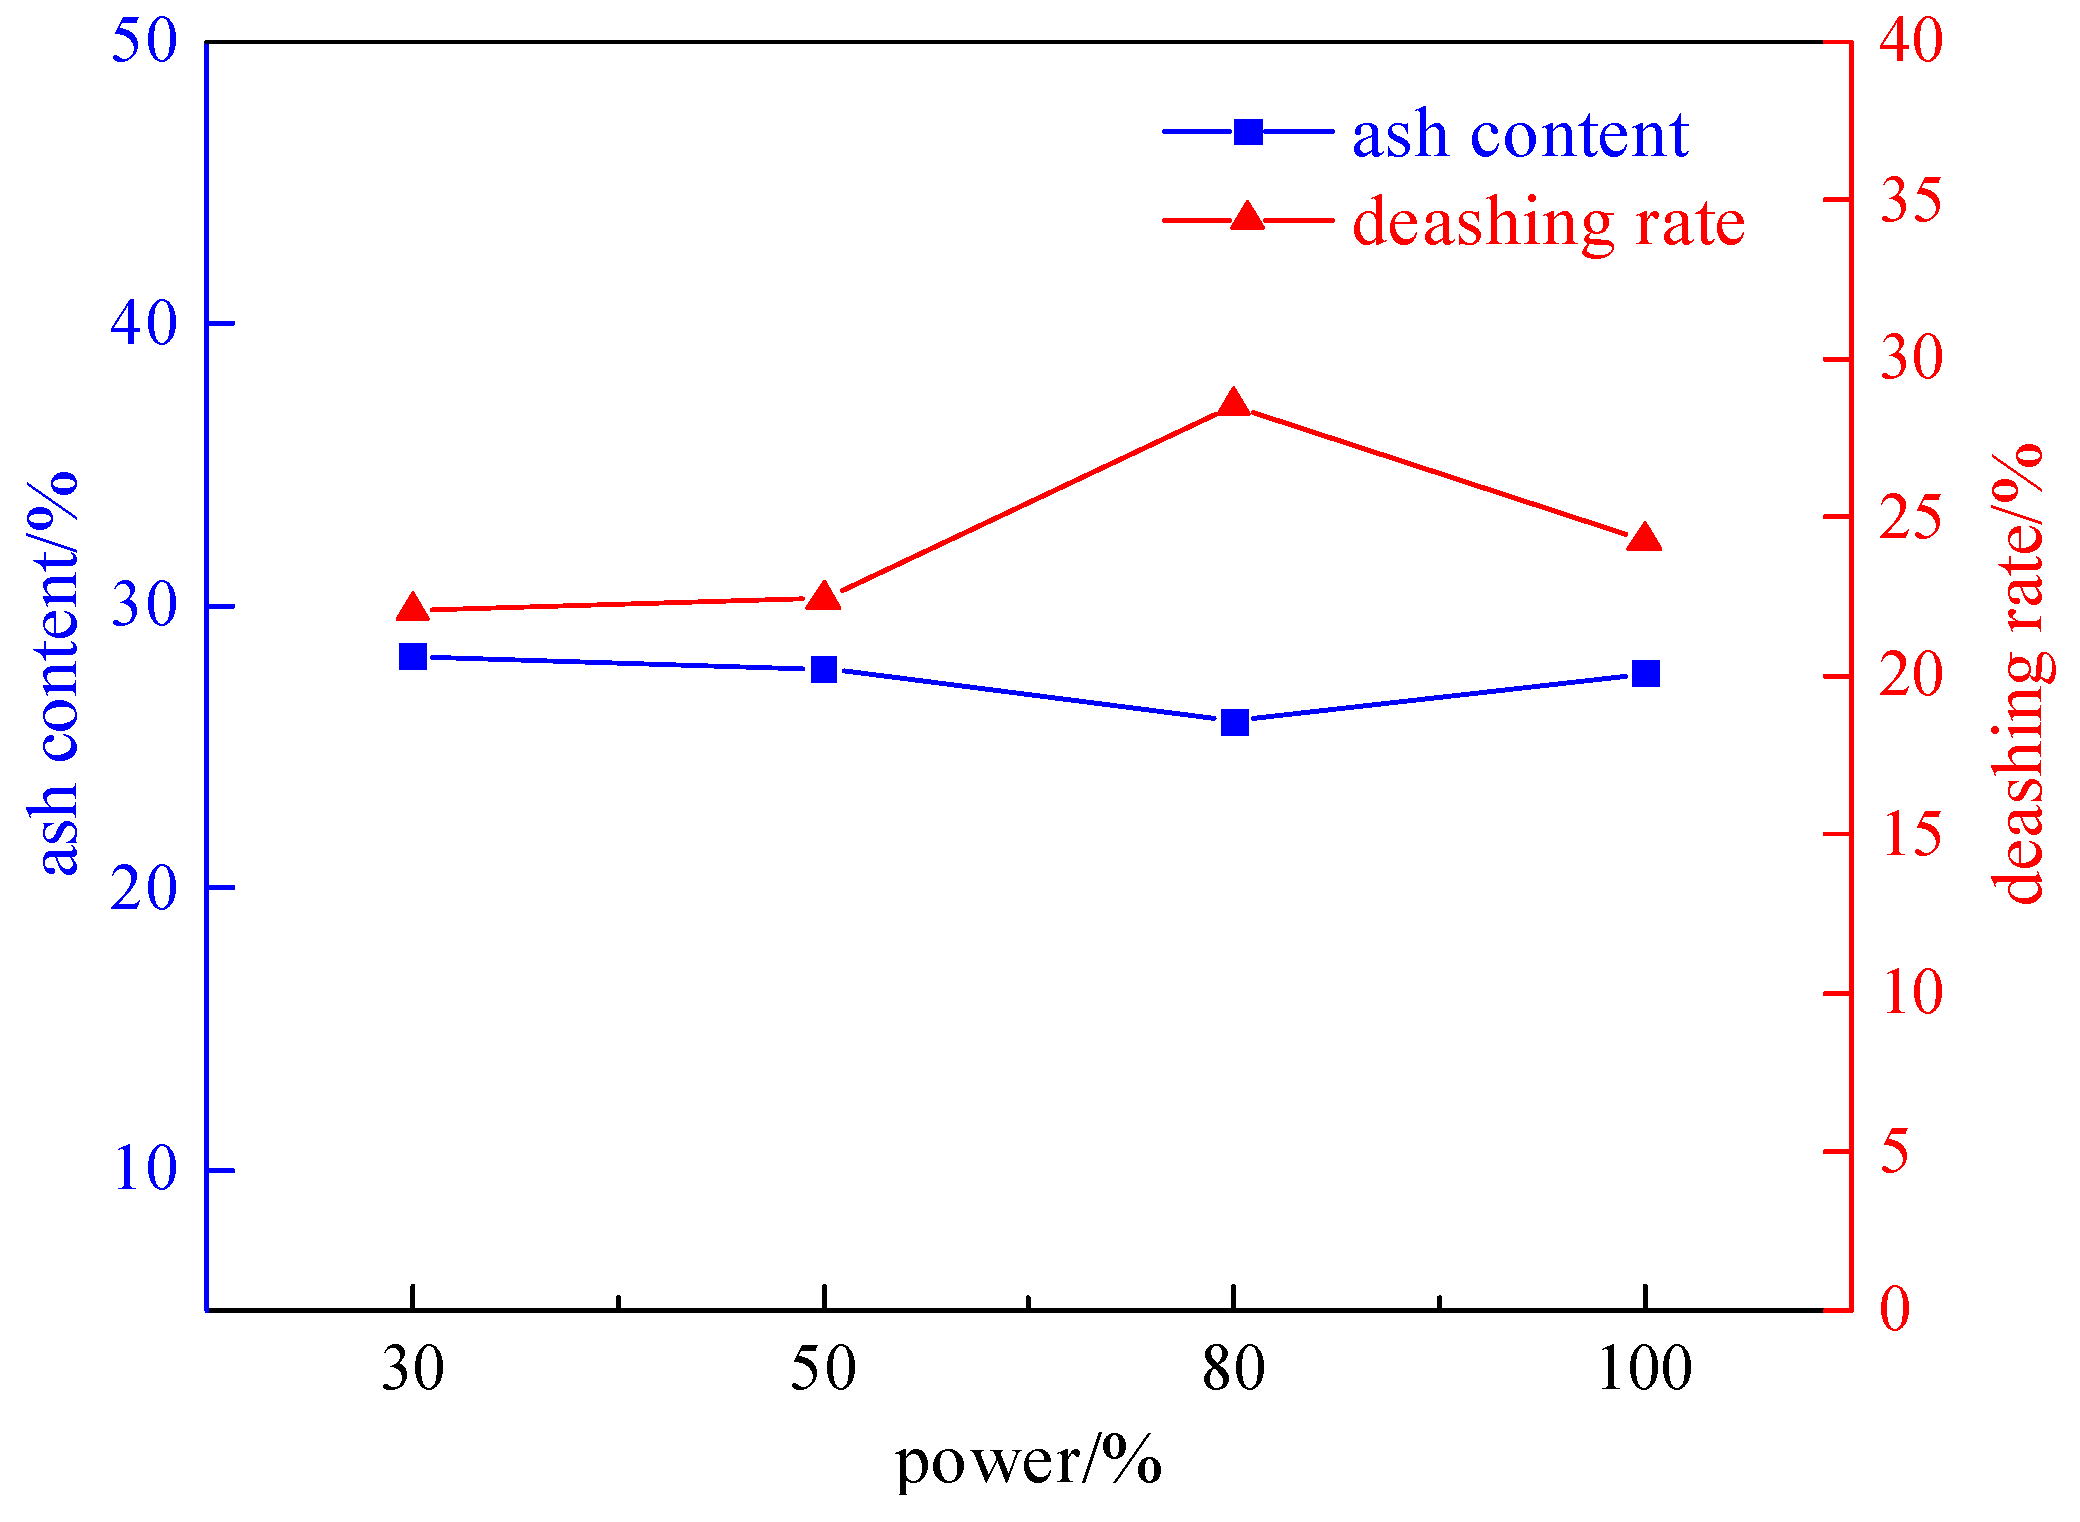
2.2.2. Irradiation Power Experiment
2.3. Microwave Magnetic Separation–Flotation Experiment
2.3.1. Foaming Agent Dosage Experiment
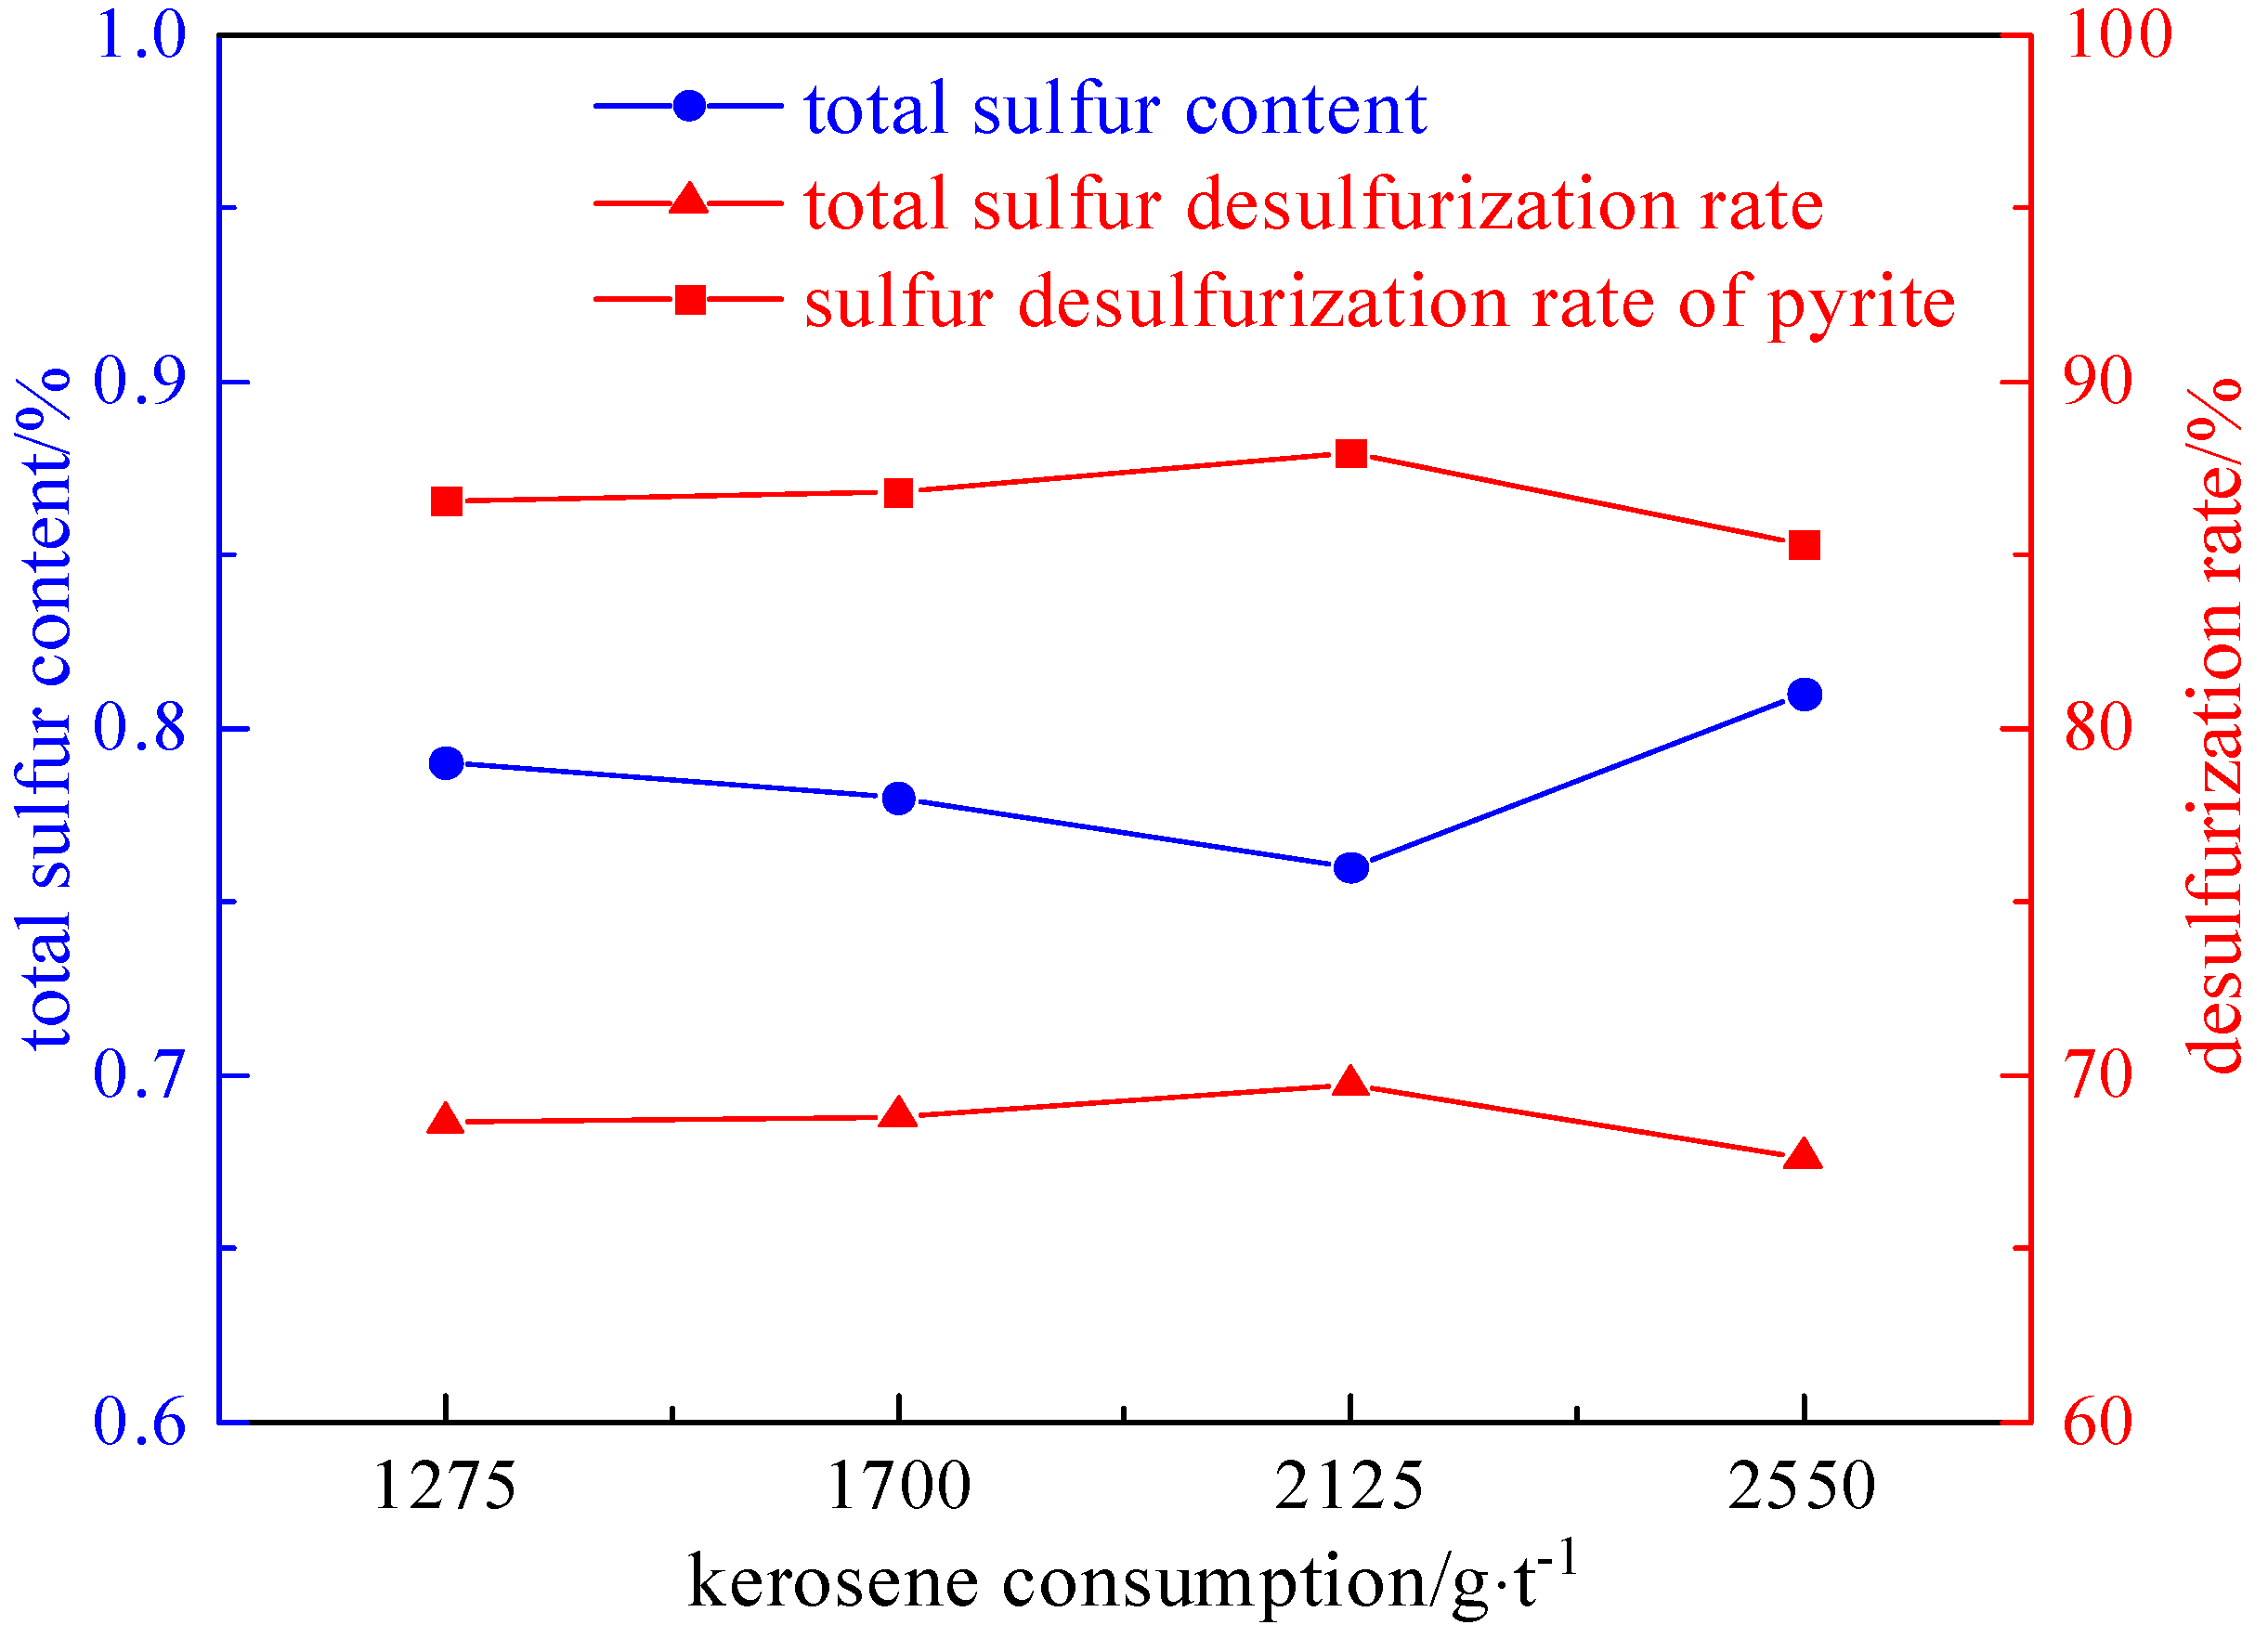
2.3.2. Collector Agent Dosage Experiment
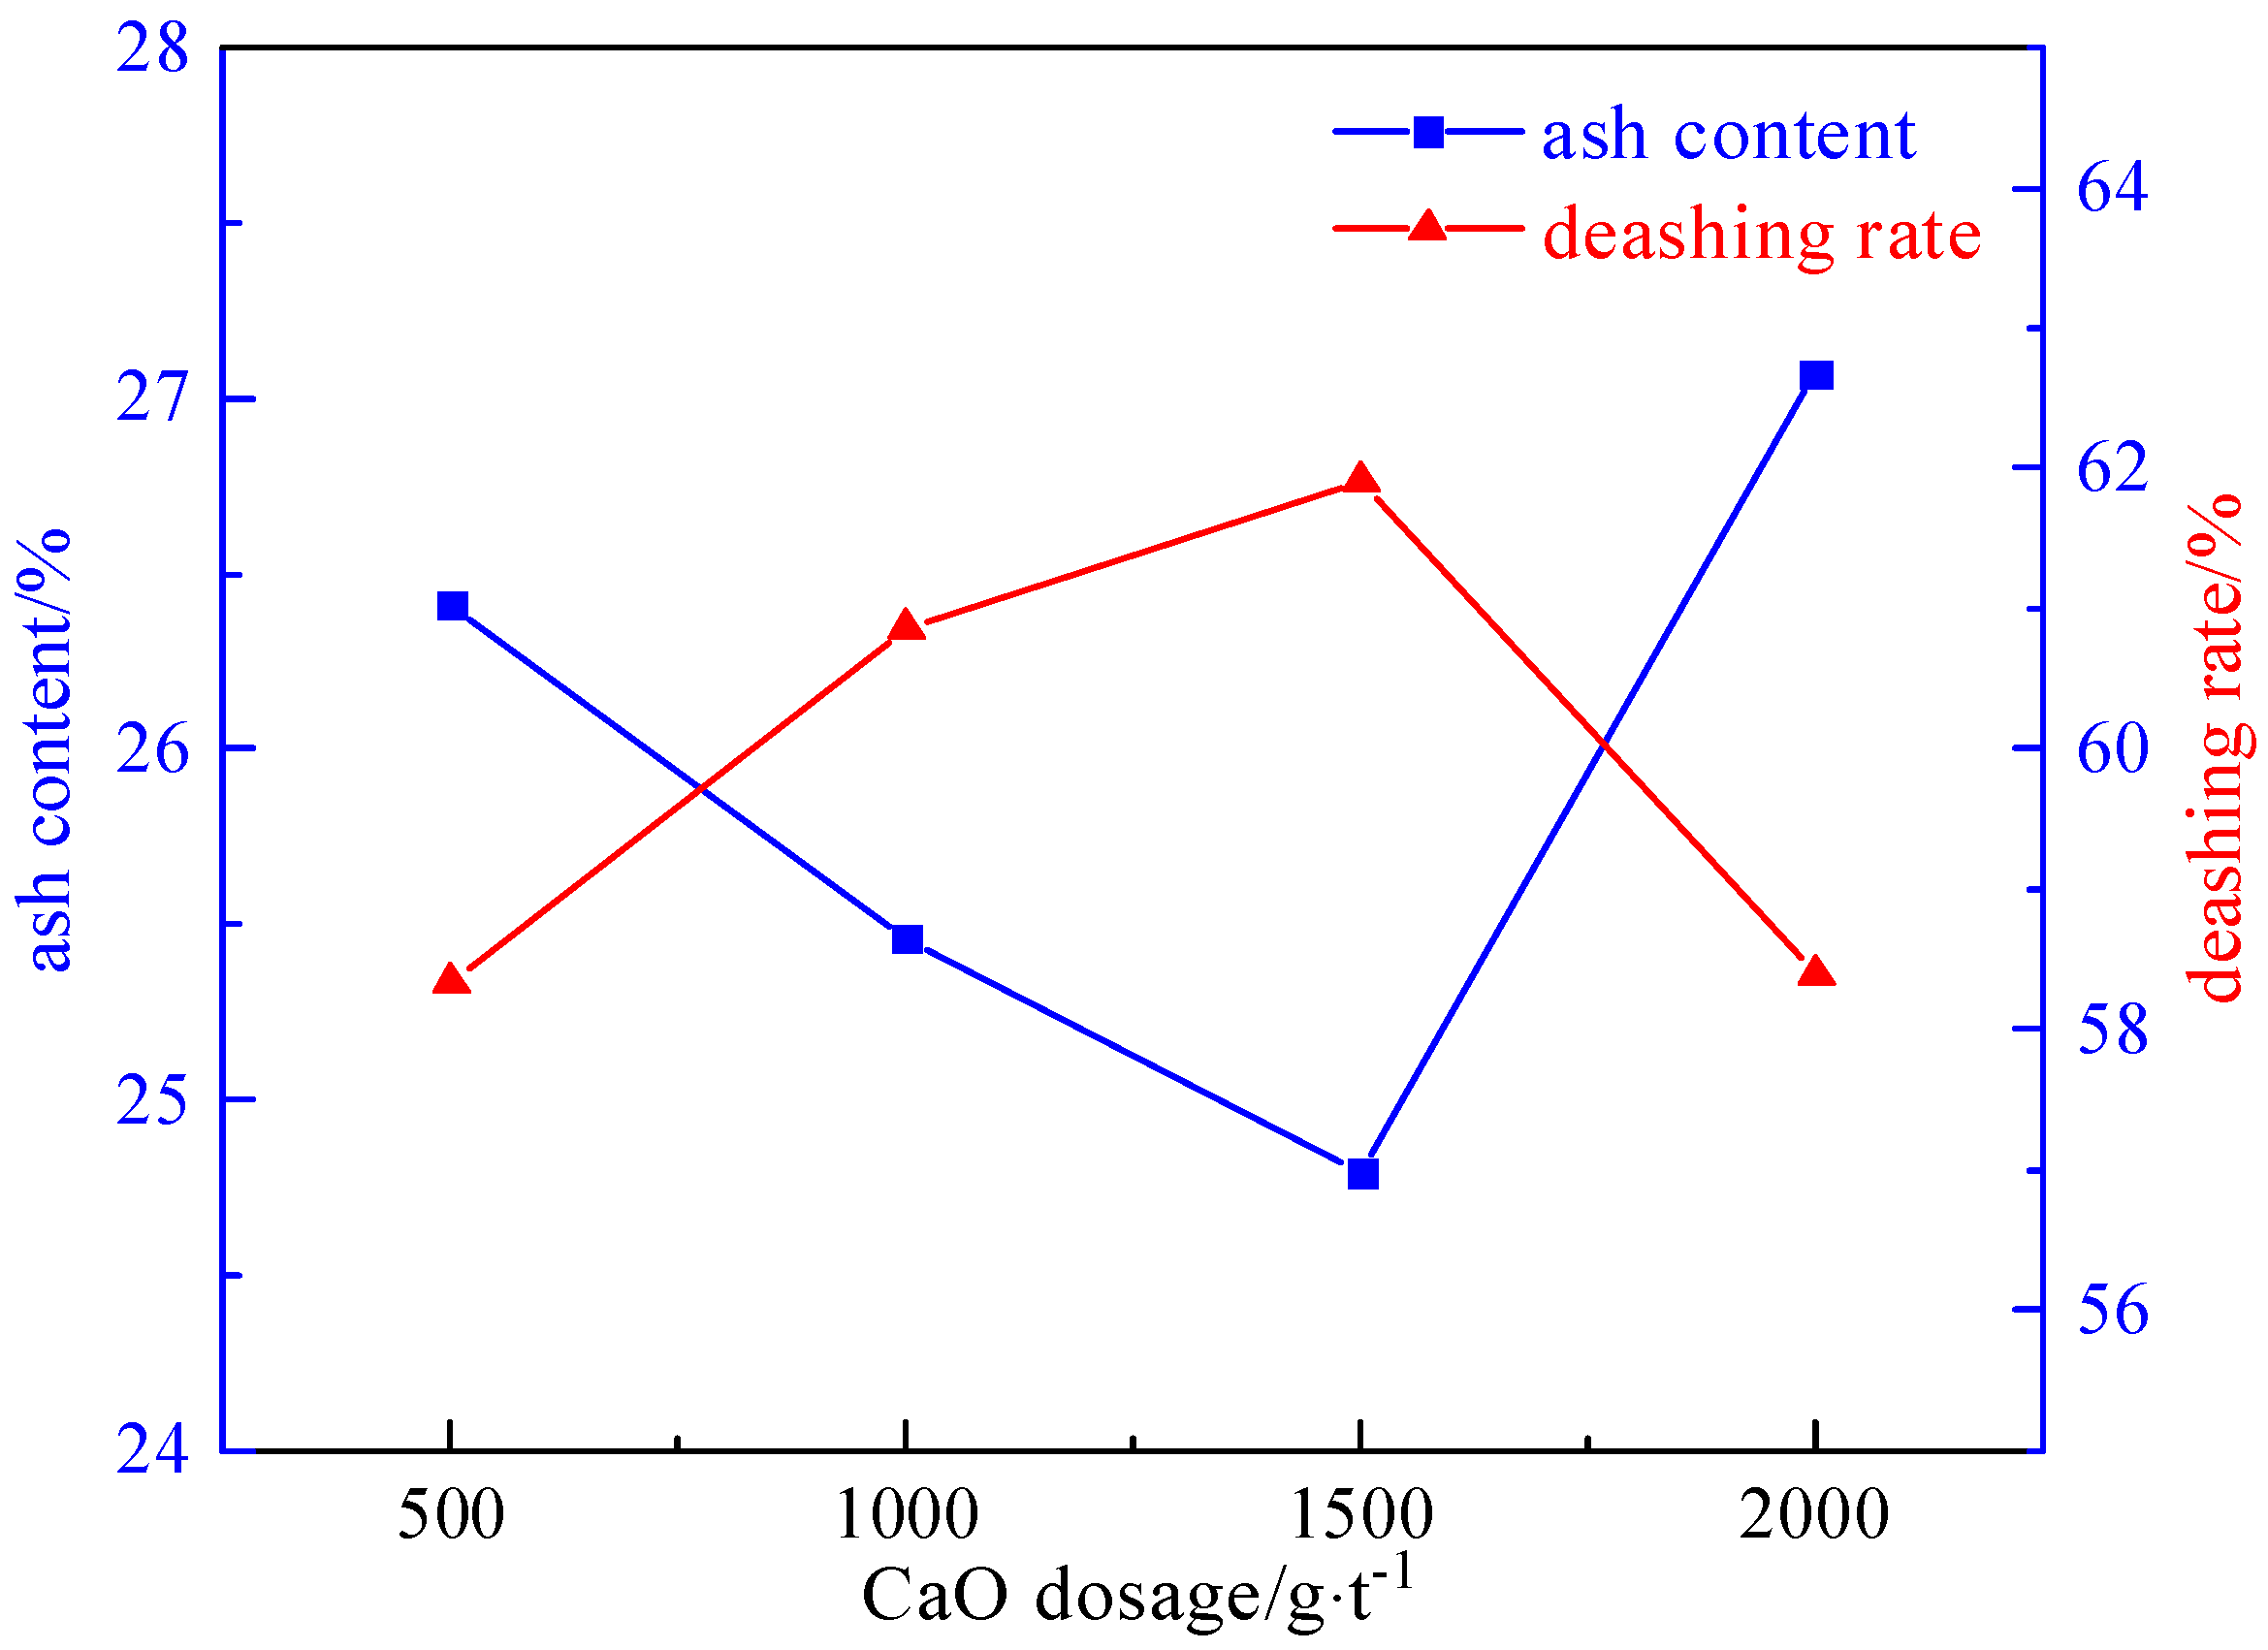
2.3.3. Inhibitor Dosage Experiment
3. Discussion
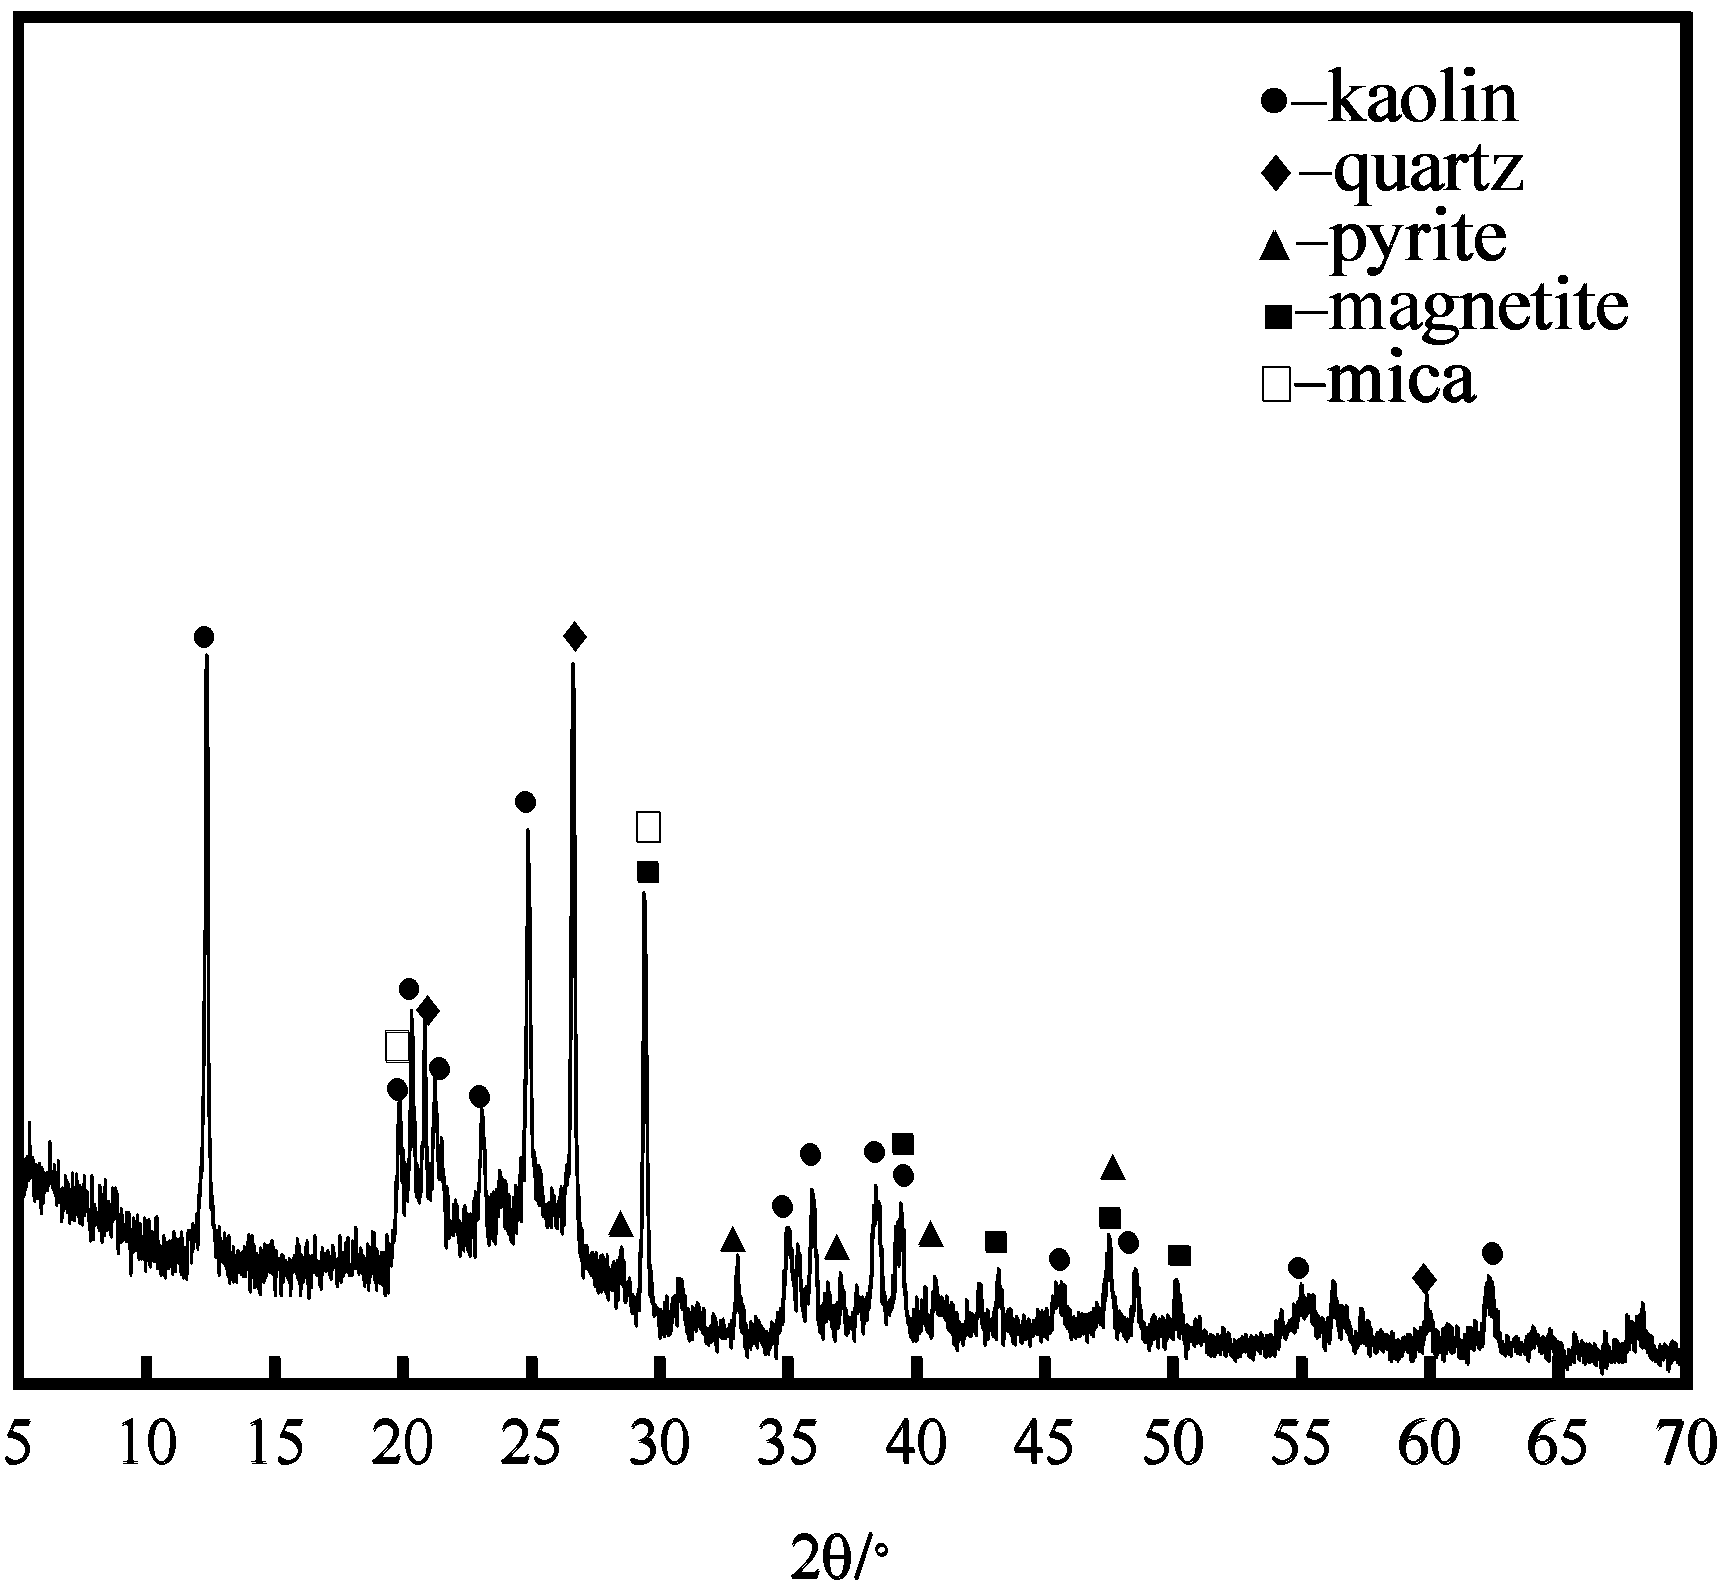
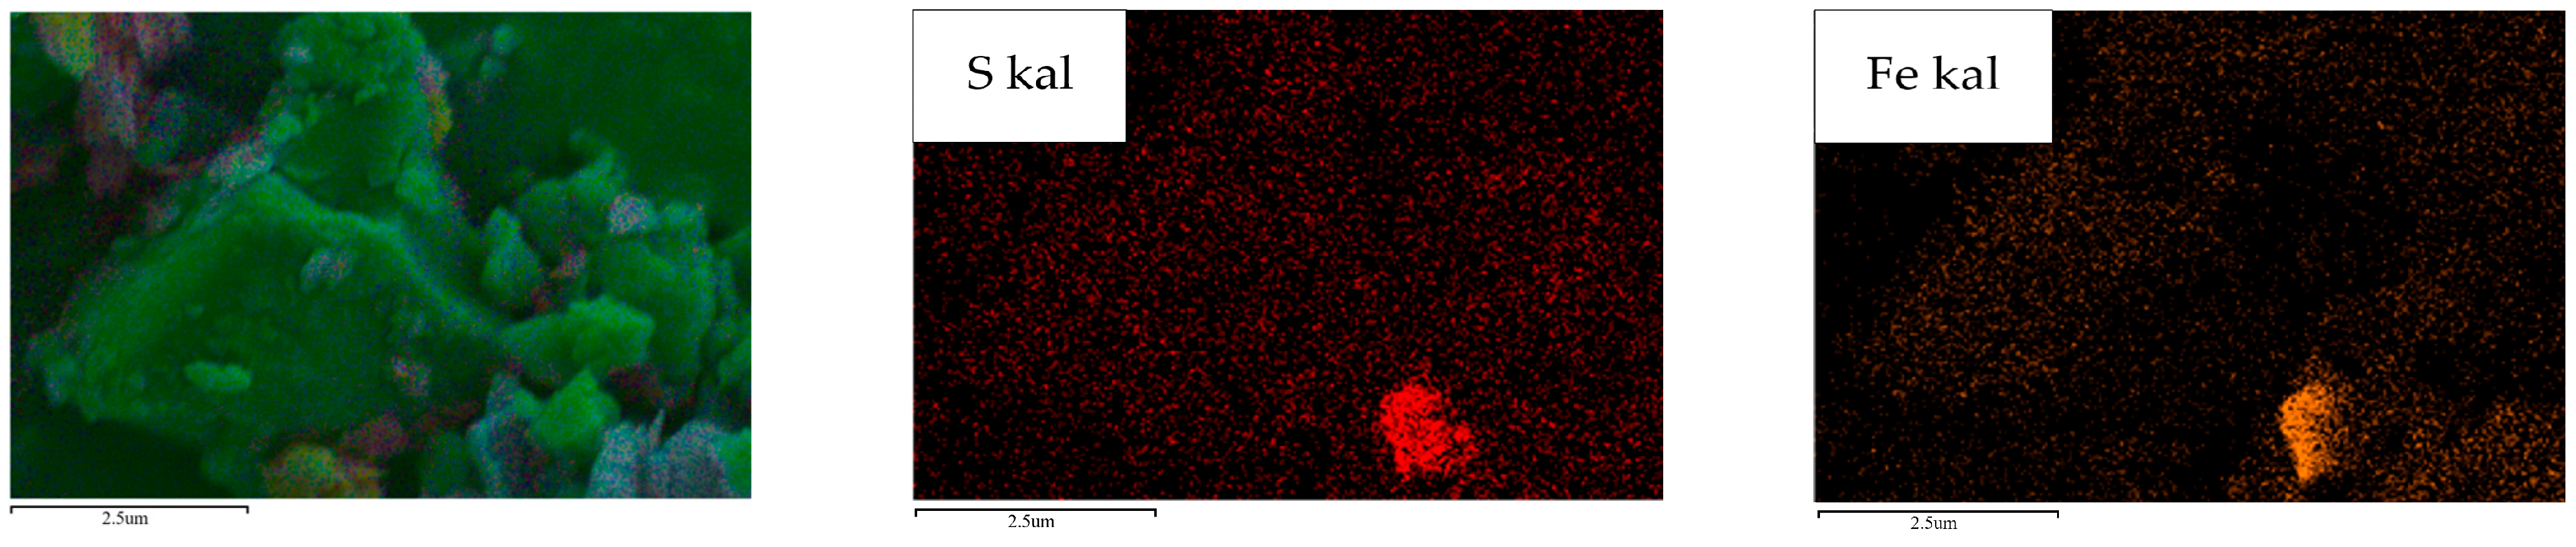
3.1. Phase Analysis
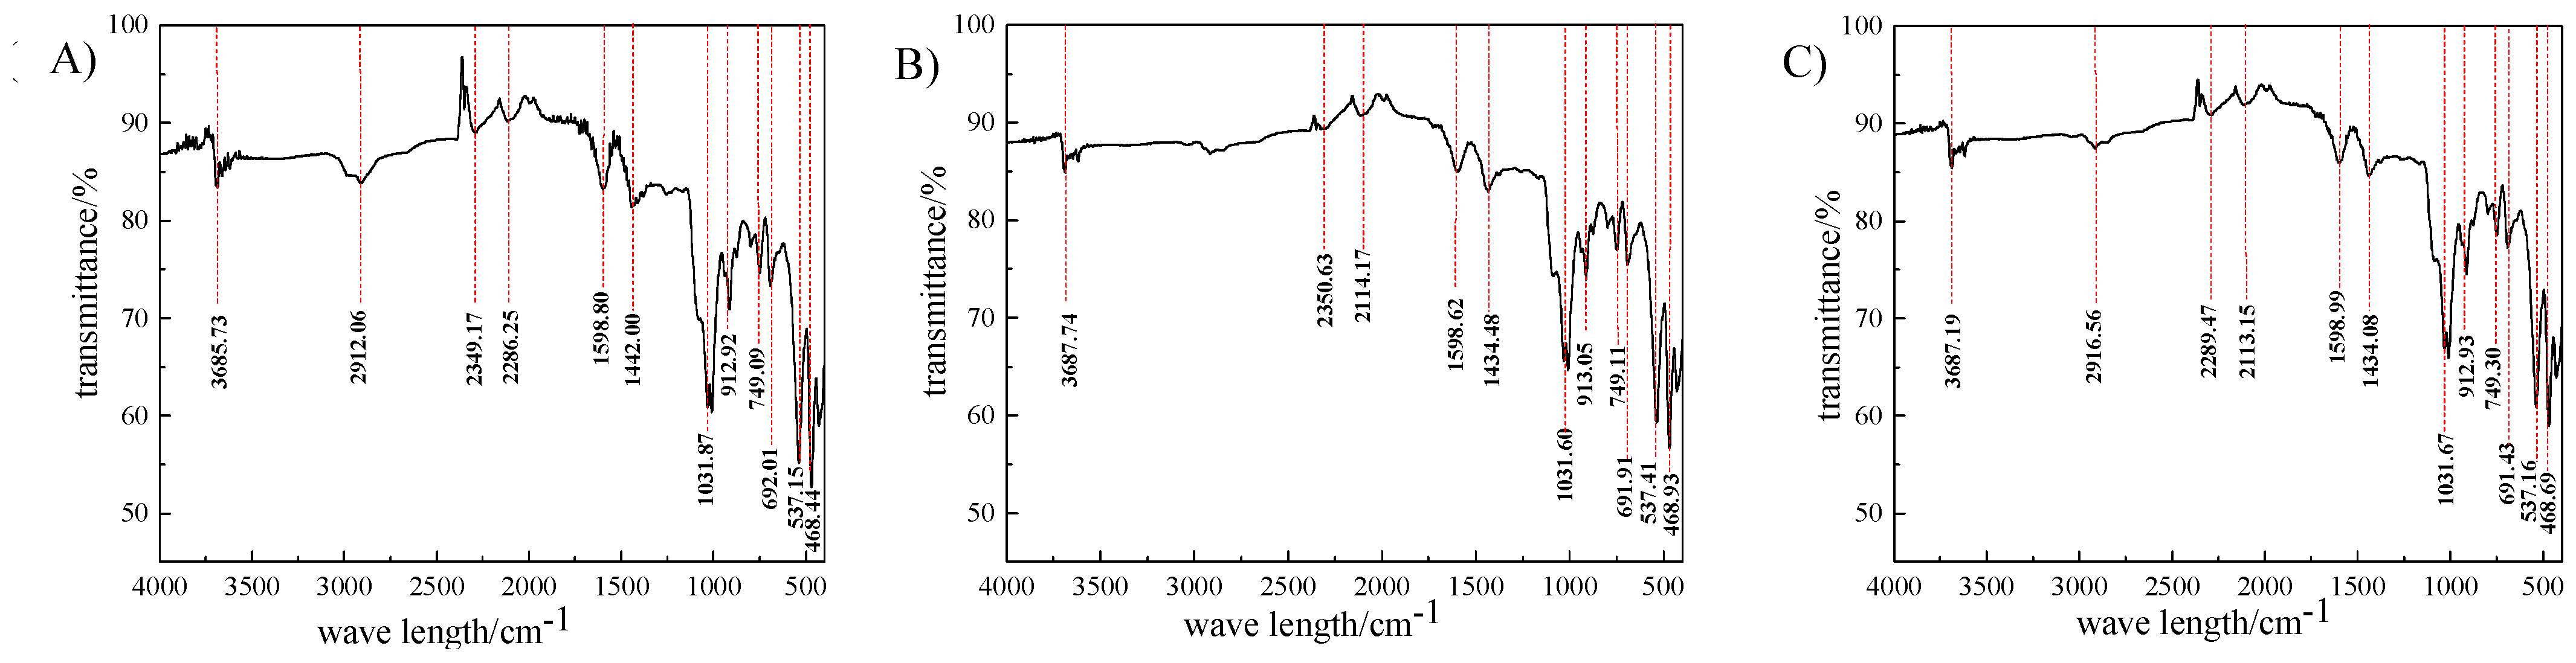
3.2. Infrared Spectroscopic Analysis
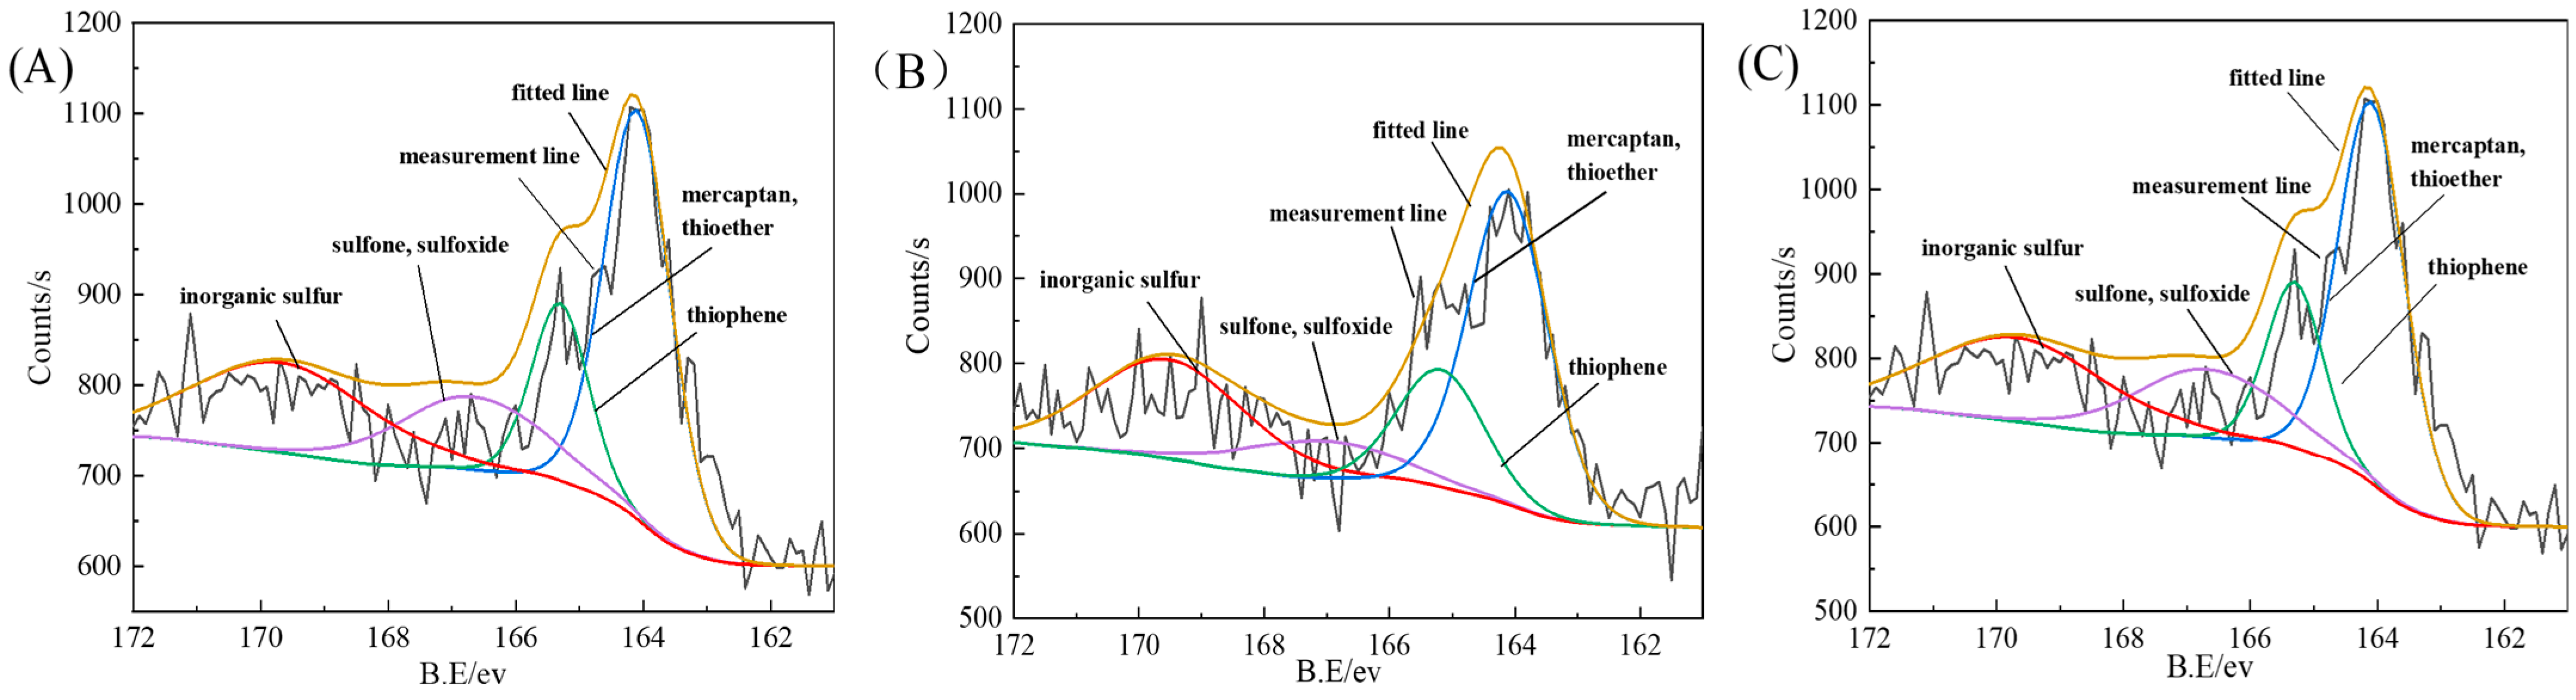
3.3. Photoelectron Spectroscopy Analysis
4. Materials and Methods
4.1. Materials
- (1)
- Reagent: Calcium oxide (CaO), analytical pure, Shenyang Quanrui Reagent Co., Ltd., Shenyang, China; kerosene (N/A), industrial grade, Shenyang Quanrui Reagent Co., Ltd., Shenyang, China; and pine alcohol oil (C10H18O), industrial grade, Shenyang Quanrui Reagent Co., Ltd., Shenyang, China. The experimental coal used is Shanxi coal.
- (2)
- Instrument: Infrared sulfur analyzer, DNS-550 type, Beijing Dinai Instrument Co. Ltd., Beijing China; X-ray diffractometer, D8 ADVACE type, Brooke Instruments GmbH, Karlsruhe, Germany; scanning electron microscope, JSM-7610F type, JEOL Corporation, Tokyo, Japan; X-ray photoelectron spectrometer, Thermo Fisher ESCALAB XI+ type, Thermo Fisher Technology Co. Ltd., Waltham, MA, USA; wet intensity magnetic separator, XCSQ-50 × 70 type, Jiangxi Longzhong Machinery Equipment Co., Jiangxi, China; and microwave reactor, WBFY-201 type, Gongyi Yuhua Instrument Co. Ltd., Henan, China.
4.2. Analysis of Raw Coal Quality
4.3. Experiment Methods
- (1)
- The coal sample is dried under natural conditions for 1 day, and the dried coal sample is broken to 3~0.5 mm. The sample was divided by the heap-cone quartering method. A total of 100 g per serving was bagged and sealed.
- (2)
- The microwave magnetic separation experiments were carried out under the conditions of a grinding time of 0.5~12 min, microwave irradiation time of 30~120 s, microwave power of 30~100% of the rated power 800 W, magnetic field intensity of 2.25~2.35 T, and plate seam width of 1~4 mm.
- (3)
- The refined coal obtained after microwave magnetic separation was poured into the flotation tank, the pulp concentration was adjusted to 50 g/L, and the stirring interval was 2 min. A foaming agent of 60–150 g/t, a collector of 1275–2550 g/t, and an inhibitor of 500–2000 g/t were added in sequence. After stirring for 1 min, the scraper of the flotation machine was opened, and the end time was when the clean coal was scraped completely.
5. Conclusions
- (1)
- Under the conditions of a microwave irradiation time of 60 s, a microwave power of 80% of the rated power (800 W), a grinding time of 8 min, a magnetic field strength of 2.32 T, a plate gap width of 1 mm, a slurry concentration of 50 g/L, a foaming agent dosage of 90 g/t, a collector dosage of 2125 g/t, and an inhibitor dosage of 1500 g/t, the desulfurization rate reached 76.51%, the pyrite sulfur removal rate was 96.50%, and the deashing rate was 61.91%.
- (2)
- Microwave irradiation can enhance the magnetism of sulfur iron minerals in raw coal, improve magnetic separation efficiency, and to some extent improve the number of oxygen-containing functional groups and the hydrophobicity of minerals in coal. By combining microwave and magnetic separation and flotation, the comprehensive characteristics of clean coal are improved.
- (3)
- A new process route for coal desulfurization has been provided through the experimental study of combined microwave magnetic separation–flotation coal desulfurization. And this method is effective and capable of removing the vast majority of inorganic sulfur. The limitation is that it cannot effectively remove organic sulfur. The follow-up direction can be to study chemical desulfurization methods and find a suitable method for the industrial large-scale removal of organic sulfur. This would allow for truly contributing to the green mountains and clear waters.
Author Contributions
Funding
Institutional Review Board Statement
Informed Consent Statement
Data Availability Statement
Conflicts of Interest
References
- Zhang, L.; Xu, J.; Sun, R.; Wang, Z.; Wang, X.; Yuan, M.; Wu, J. Experimental and DFT research on the effects of O2/CO2 and O2/H2O pretreatments on the combustion characteristics of char. Molecules 2023, 28, 1638. [Google Scholar] [CrossRef] [PubMed]
- Ren, S.-H.; Jiao, X.-M.; Zheng, D.-Z.; Zhang, Y.-N.; Xie, H.-P.; Guo, Z.-Q. Demand and fluctuation range of China’s coal production under the dual carbon target. Energy Rep. 2024, 11, 3267–3282. [Google Scholar]
- Xu, C.Y.; Li, L. The dynamic relationship among green logistics, technological innovation and green economy: Evidence from China. Heliyon 2024, 10, e26534. [Google Scholar] [CrossRef]
- Liu, B.; Chang, H.; Li, Y.; Zhao, Y. Analysis of influencing factors of industrial green and low-carbon transformation under the background of “double carbon”: Evidence from Sichuan province, China. Front. Environ. Sci. 2023, 11, 1257855. [Google Scholar] [CrossRef]
- Meshram, P.; Purohit, B.K.; Sinha, M.K.; Sahu, S.K.; Pandey, B.D. Demineralization of low grade coal—A review. Renew. Sustain. Energy Rev. 2015, 41, 41745–41761. [Google Scholar] [CrossRef]
- Yassin, K.E.; El-Rehem, F.H.; Amin, R.; Sobhy, A. Separation of pyritic sulfur from ultrafine coal by pyrolysis wet high magnetic separation. Int. J. Coal Prep. Util. 2023, 43, 1759–1771. [Google Scholar] [CrossRef]
- Chen, Y.; Cao, M.; Ma, C. Review of coal-fired electrification and magnetic Separation Desulfurization Technology. Appl. Sci. 2019, 9, 1158. [Google Scholar] [CrossRef]
- Liu, J.; Zhao, J.; Gu, S.; Fu, X. The effect of wet-grinding on coal mechanochemical pre-desulfurization. Energy Sources Part A Recovery Util. Environ. Eff. 2023, 45, 4432–4445. [Google Scholar] [CrossRef]
- Ma, Y.; Li, A.; Wang, Z.; Wang, C. Preparation of UiO-66-type adsorbents for the separation of SO2 from flue gas. Adsorption 2024, 30, 377–387. [Google Scholar] [CrossRef]
- Zhang, H.X.; Ma, X.Y.; Dong, X.S.; Wang, Z.Z.; Bai, H.J. Enhanced desulfurizing flotation of high sulfur coal by sonoelectrochemical method. Fuel Process. Technol. 2012, 93, 13–17. [Google Scholar] [CrossRef]
- Ai, C.M.; Sun, P.P.; Zhao, D.; Mu, X.Z. Optimization of experimental conditions of microbial desulfurization in coal mine using response surface methodology. Front. Bioeng. Biotechnol. 2022, 10, 1076814. [Google Scholar] [CrossRef] [PubMed]
- Liu, F.; Lei, Y.; Shi, J.; Zhou, L.; Wu, Z.; Dong, Y.; Bi, W. Effect of microbial nutrients supply on coal bio-desulfurization. J. Hazard. Mater. 2020, 384, 121324. [Google Scholar] [CrossRef] [PubMed]
- Tang, Y.; Xue, L.; Gou, M.; Wang, L.; Ma, P.; Yu, X. Study on influencing factors of Coal Microbial Flotation Desulfurization. Fuel 2024, 358, 130115. [Google Scholar] [CrossRef]
- Wang, Q.F.; Zhu, S.H.; Zhi, X.J.; Ma, X.J.; Wang, Y.Y. Experimental study on desulfurization and ash reduction of high sulfur coal by magnetic separation and flotation combined process. Coal Prep. Technol. 2014, 1–7. [Google Scholar] [CrossRef]
- Zhang, Z.; Yan, G.; Zhu, G.; Zhao, P.; Ma, Z.; Zhang, B. Using microwave pretreatment to improve the high-gradient magnetic-separation desulfurization of pulverized coal before combustion. Fuel 2020, 274, 117826. [Google Scholar] [CrossRef]
- Yang, L.S. Experimental study of desulfurization and ash reduction of high-sulfur coal through flotation process. Coal Prep. Technol. 2018, 46, 28–33. [Google Scholar]
- Bana, P.; Greiner, I. Comparison of conventional and microwave heating for evaluation of microwave effects. Aust. J. Chem. 2016, 69, 865–871. [Google Scholar] [CrossRef]
- Salomatoy, V.V.; Karelin, A.V.; Salomatoy, V.V. Mathematical models of microwave heating of a coal mass with release of absorbed energy by the heat radiation law. J. Eng. Thermophys. 2016, 25, 485–494. [Google Scholar] [CrossRef]
- Kostishyn, V.G.; Isaev, I.M.; Shakirzyanov, R.I.; Salogub, D.V.; Kayumova, A.R.; Olitsky, V.K. Radar absorbing properties of polyvinyl alcohol/Ni–Zn ferrite-spinel composite. Tech. Phys. 2024, 68 (Suppl. 2), S178–S184. [Google Scholar] [CrossRef]
- Samyal, R.; Bagha, A.K.; Bedi, R. Evaluation of modal characteristics of SS202-SS202 lap joint produced using selective microwave hybrid heating. J. Manuf. Process. 2021, 68, 1–13. [Google Scholar] [CrossRef]
- Tang, L.F.; Chen, X.L.; Tao, X.X. Non-thermal effect of microwave on organic sulfur removal from coal by microwave with peroxyacetic acid. Fuel 2023, 338, 127262. [Google Scholar] [CrossRef]
- Cheng, S.; Li, M.; Xu, S.; Ding, N.; Yue, J.; Li, H. Mechanism of sulfur removal from coal by microwave assisted acetic acid-hydrogen peroxide system. J. Sulfur Chem. 2023, 44, 168–185. [Google Scholar] [CrossRef]
- Zhang, B.; Zhou, C.; Zhao, Y.; Cai, L.; Fan, X. Fine coal desulphurization and microwave energy absorption behaviour by microwave magnetic separation. Can. J. Chem. Eng. 2017, 95, 1156–1163. [Google Scholar] [CrossRef]
- Lun, Z.; Zhou, X.; Fu, X.; Cai, X.; Xu, Y.; Zhang, D. Responses of pore structure parameters and functional group compositions of coals to irradiation power: Implication to coalbed methane production via microwave irradiation. Energy Sources Part A Recovery Util. Environ. Eff. 2022, 44, 7709–7725. [Google Scholar] [CrossRef]
- Ma, L.-L.; Qin, Z.-H.; Zhang, L.; Liu, X.; Chen, H. Peak fitting methods and parameter settings in XPS analysis for organic sulfur in coal. J. Fuel Chem. Technol. 2014, 42, 277–283. [Google Scholar]


| Experimental Method | Total Sulfur Desulfurization Rate | Sulfur Desulfurization Rate of Pyrite | Deashing Rate |
|---|---|---|---|
| magnetic separation | 27.33% | 34.47% | 28.28% |
| microwave magnetic separation | 63.02% | 79.49% | 28.51% |
| Experimental Method | Total Sulfur Desulfurization Rate | Sulfur Desulfurization Rate of Pyrite | Deashing Rate |
|---|---|---|---|
| magnetic separation | 27.33% | 34.47% | 28.28% |
| microwave magnetic separation | 63.02% | 79.49% | 28.51% |
| microwave magnetic separation–flotation | 76.51% | 96.5% | 61.91% |
| Experimental Method | Type | Binding Energy/ev | Peak Area Ratio/% |
|---|---|---|---|
| magnetic separation | mercaptan, thioether | 164.10 | 46.14 |
| thiophene | 165.38 | 17.87 | |
| sulfone, sulfoxide | 167.01 | 8.51 | |
| inorganic sulfur | 169.67 | 27.48 | |
| microwave magnetic separation | mercaptan, thioether | 164.11 | 45.13 |
| thiophene | 165.18 | 18.00 | |
| sulfone, sulfoxide | 167.10 | 9.82 | |
| inorganic sulfur | 169.54 | 27.05 | |
| microwave magnetic separation–flotation | mercaptan, thioether | 164.09 | 42.51 |
| thiophene | 165.30 | 15.83 | |
| sulfone, sulfoxide | 166.67 | 16.54 | |
| inorganic sulfur | 169.69 | 25.13 |
| Industrial Analysis/% | Elemental Analysis/% | |||||||
|---|---|---|---|---|---|---|---|---|
| Mad/% | Aad/% | Vdaf/% | FCad/% | Cad/% | Had/% | Oad/% | Nad/% | St,ad/% |
| 1.69 | 34.87 | 38.76 | 38.85 | 58.74 | 17.79 | 20.12 | 0.64 | 2.51 |
| St,ad/% | Ss,ad/% | Sp,ad/% | So,ad/% |
|---|---|---|---|
| 2.51 | 0.08 | 1.99 | 0.44 |
Disclaimer/Publisher’s Note: The statements, opinions and data contained in all publications are solely those of the individual author(s) and contributor(s) and not of MDPI and/or the editor(s). MDPI and/or the editor(s) disclaim responsibility for any injury to people or property resulting from any ideas, methods, instructions or products referred to in the content. |
© 2024 by the authors. Licensee MDPI, Basel, Switzerland. This article is an open access article distributed under the terms and conditions of the Creative Commons Attribution (CC BY) license (https://creativecommons.org/licenses/by/4.0/).
Share and Cite
Wang, G.; Ma, Z.; Zhou, Z.; Zheng, Y.; Cheng, L. Experimental Study on Combined Microwave–Magnetic Separation–Flotation Coal Desulfurization. Molecules 2024, 29, 3729. https://doi.org/10.3390/molecules29163729
Wang G, Ma Z, Zhou Z, Zheng Y, Cheng L. Experimental Study on Combined Microwave–Magnetic Separation–Flotation Coal Desulfurization. Molecules. 2024; 29(16):3729. https://doi.org/10.3390/molecules29163729
Chicago/Turabian StyleWang, Guangming, Zhijun Ma, Zhijing Zhou, Yunsheng Zheng, and Liang Cheng. 2024. "Experimental Study on Combined Microwave–Magnetic Separation–Flotation Coal Desulfurization" Molecules 29, no. 16: 3729. https://doi.org/10.3390/molecules29163729
APA StyleWang, G., Ma, Z., Zhou, Z., Zheng, Y., & Cheng, L. (2024). Experimental Study on Combined Microwave–Magnetic Separation–Flotation Coal Desulfurization. Molecules, 29(16), 3729. https://doi.org/10.3390/molecules29163729