
Identification of Fatty Acids, Amides and Cinnamic Acid Derivatives in Supercritical-CO2 Extracts of Cinnamomum tamala Leaves Using UPLC-Q-TOF-MSE Combined with Chemometrics

 ,
,
Abstract
1. Introduction
2. Results and Discussion
2.1. Extraction Yield
2.2. UPLC-Q-TOF-MSE Analysis and Metabiltes Identification
2.2.1. Identification of Fatty Acids
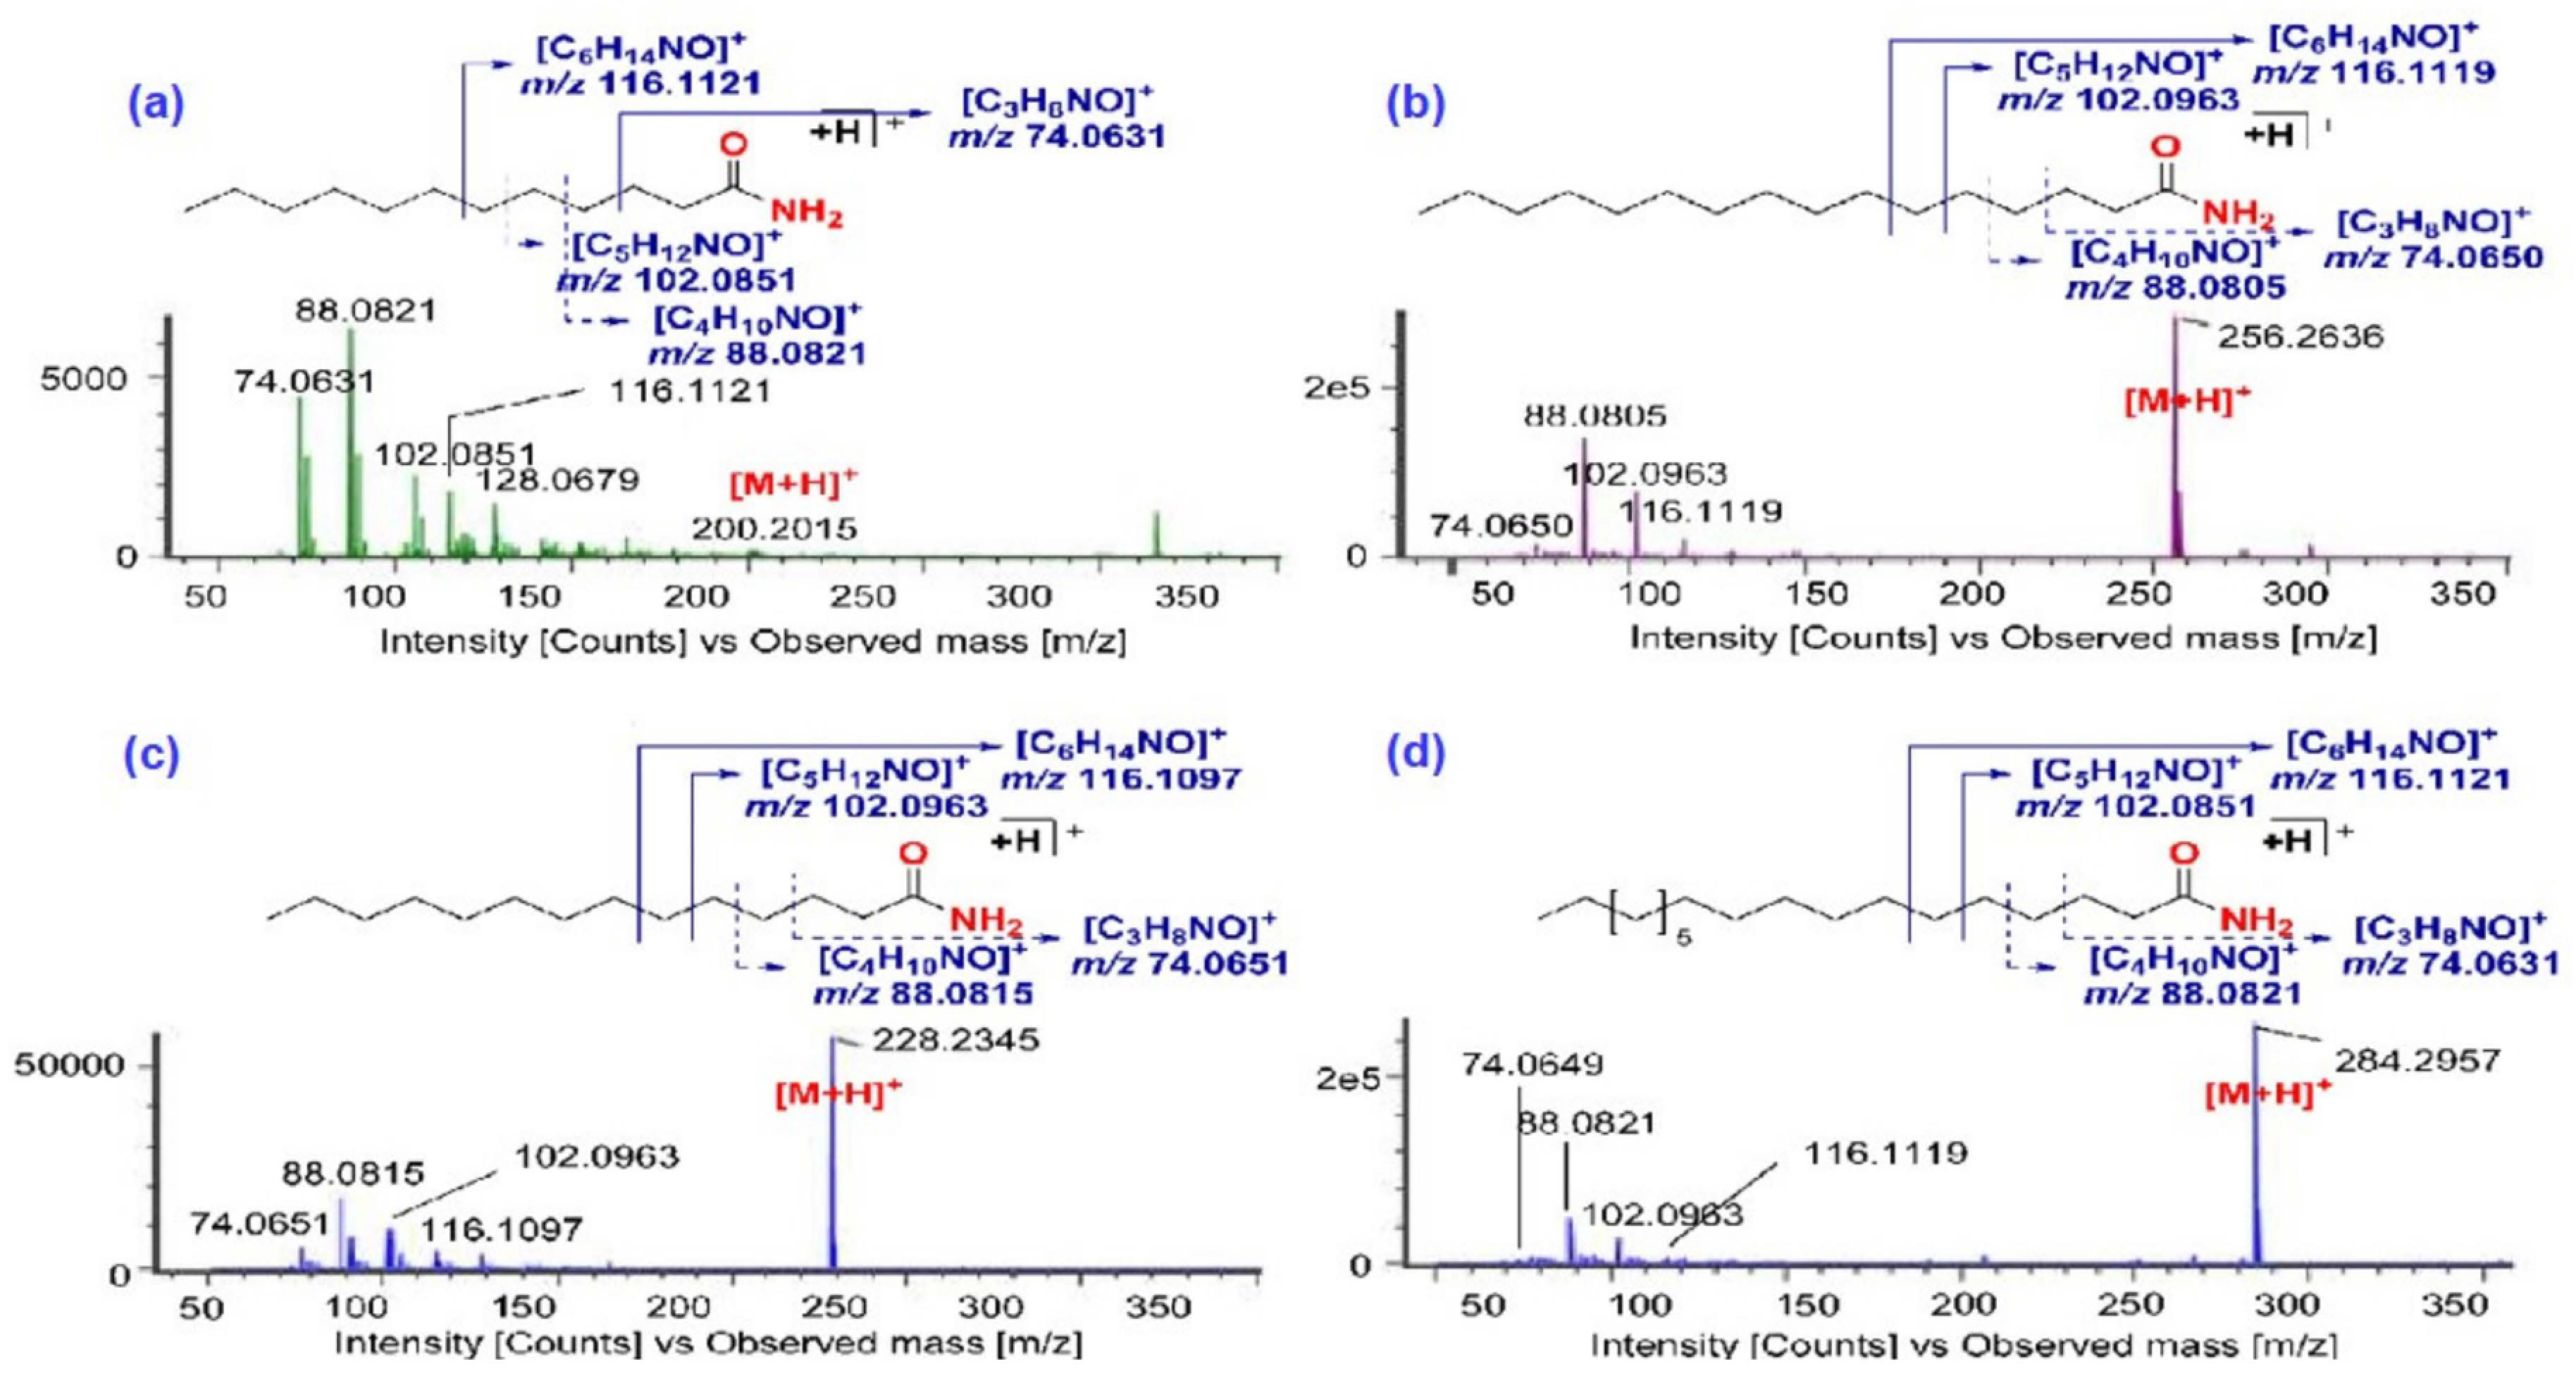
2.2.2. Identification of Fatty Acid Amides
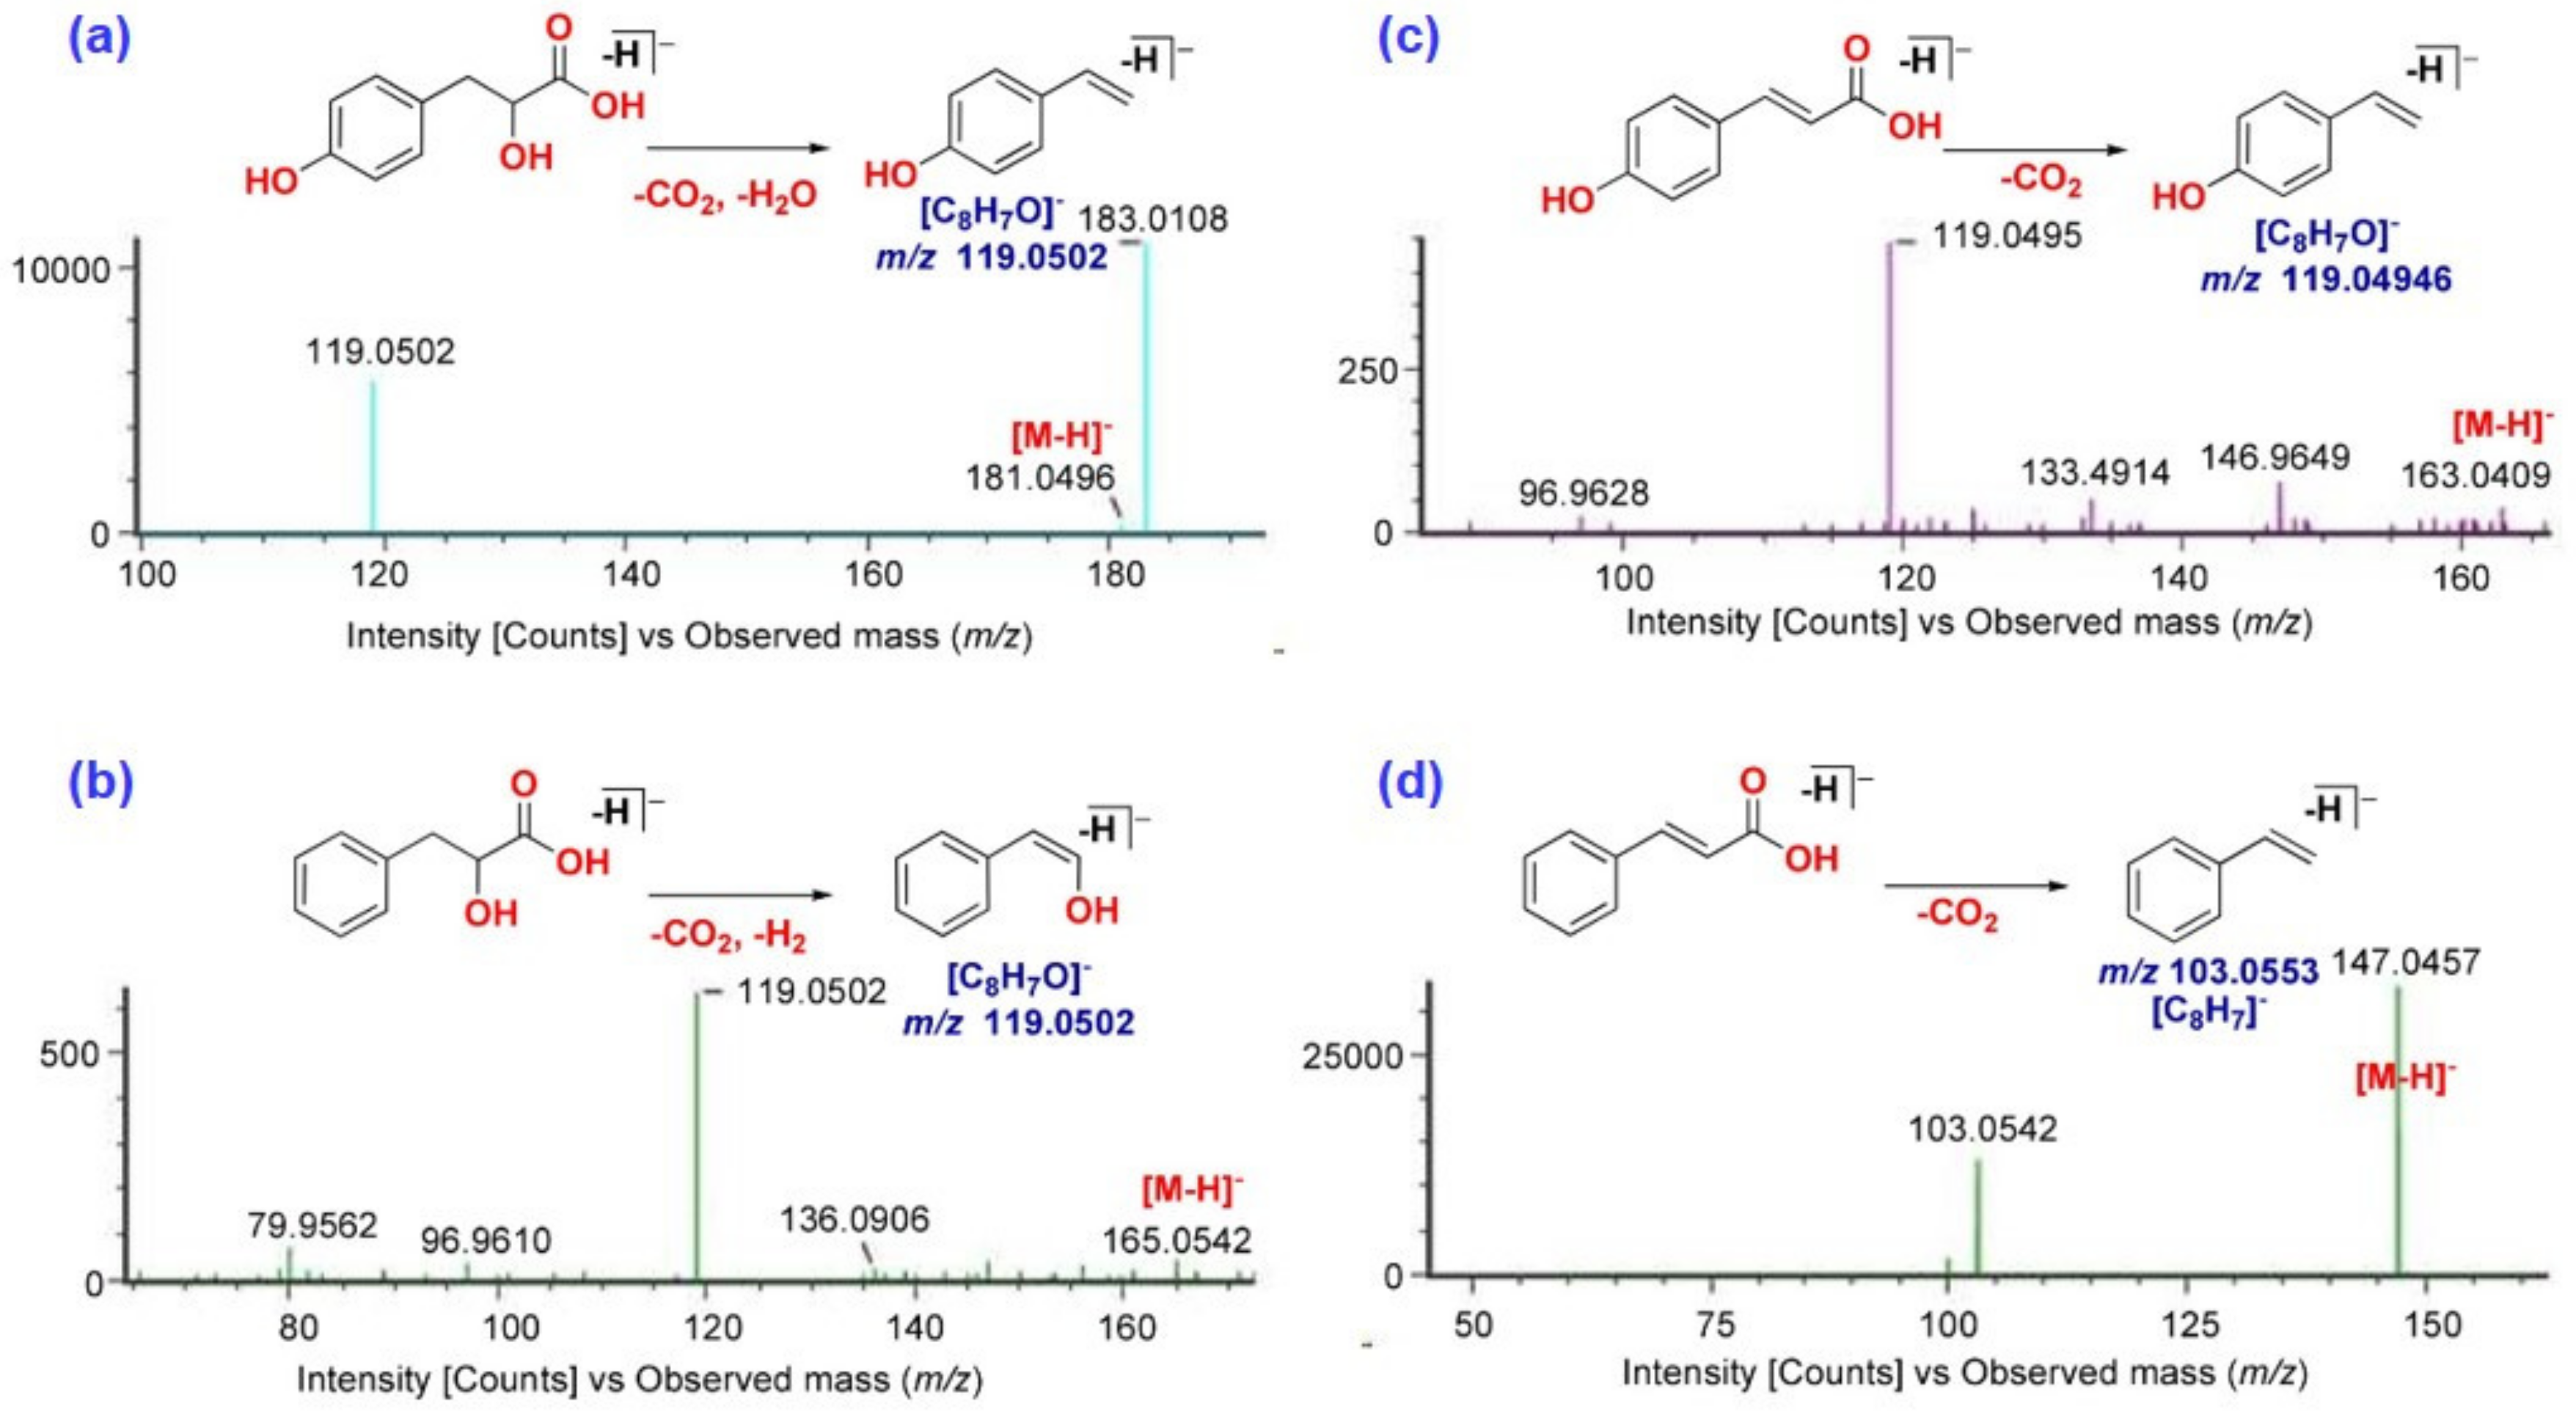
2.2.3. Identification of Cinnamic Acid Derivatives
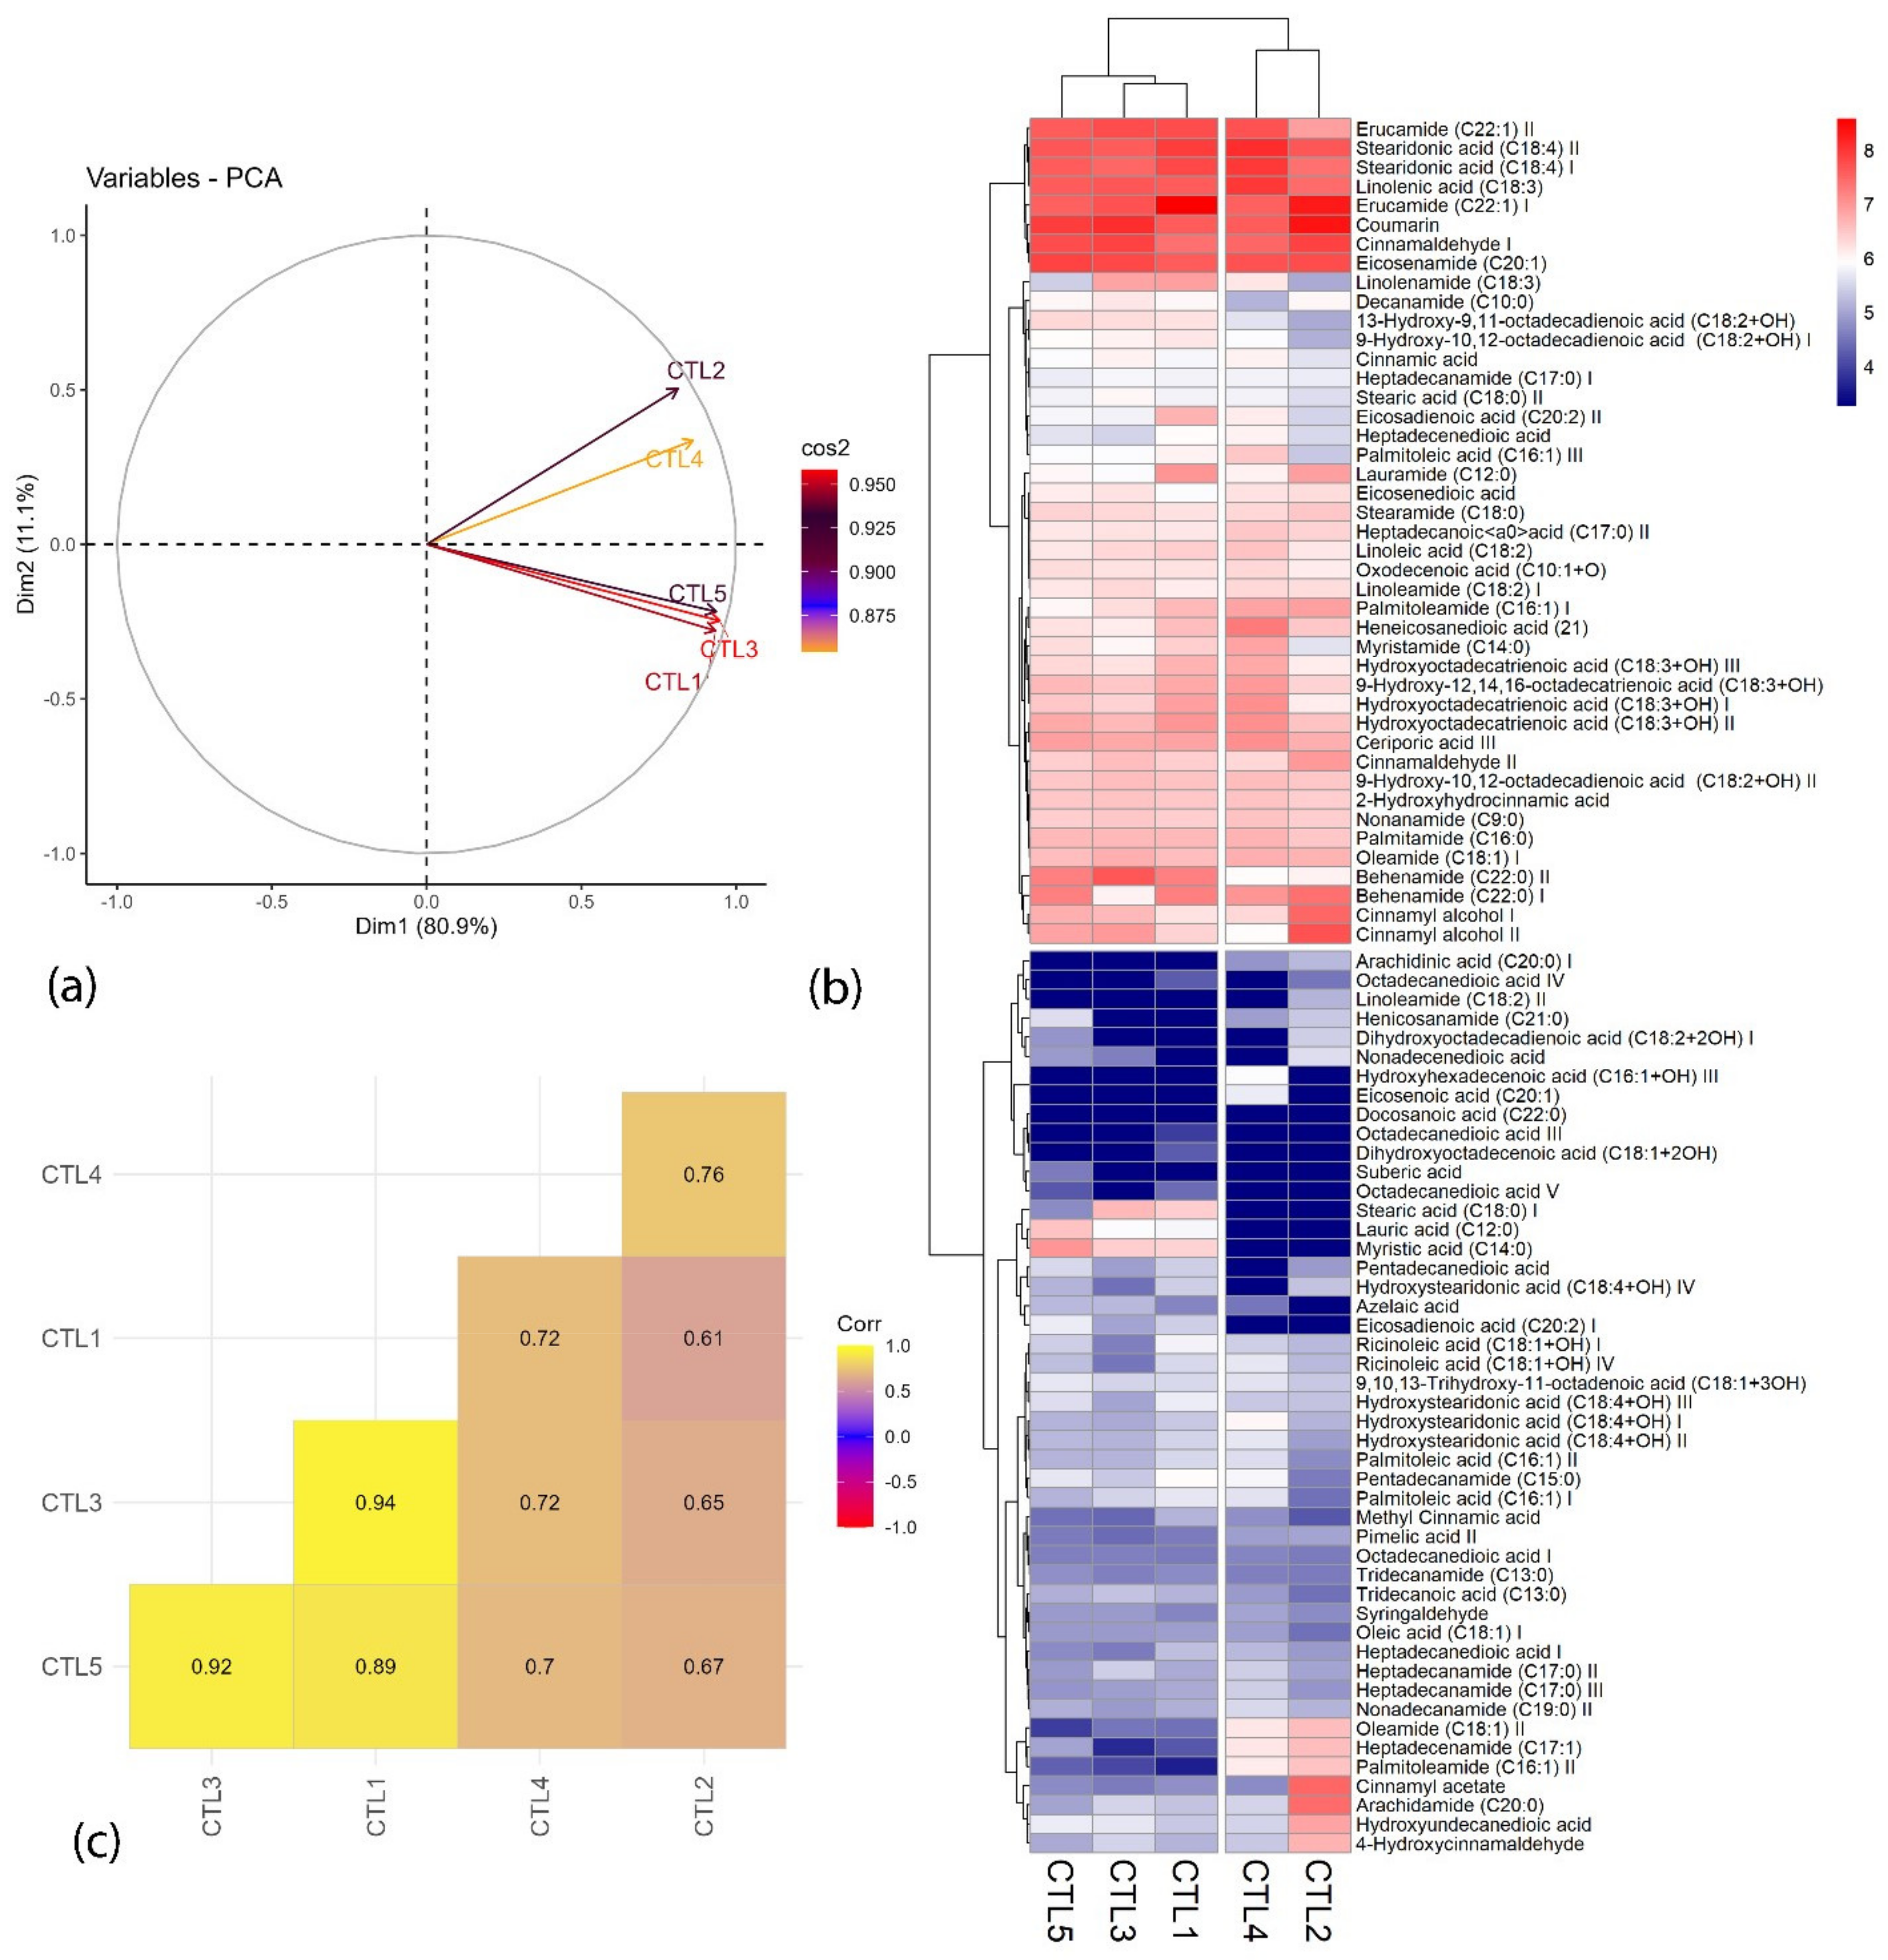
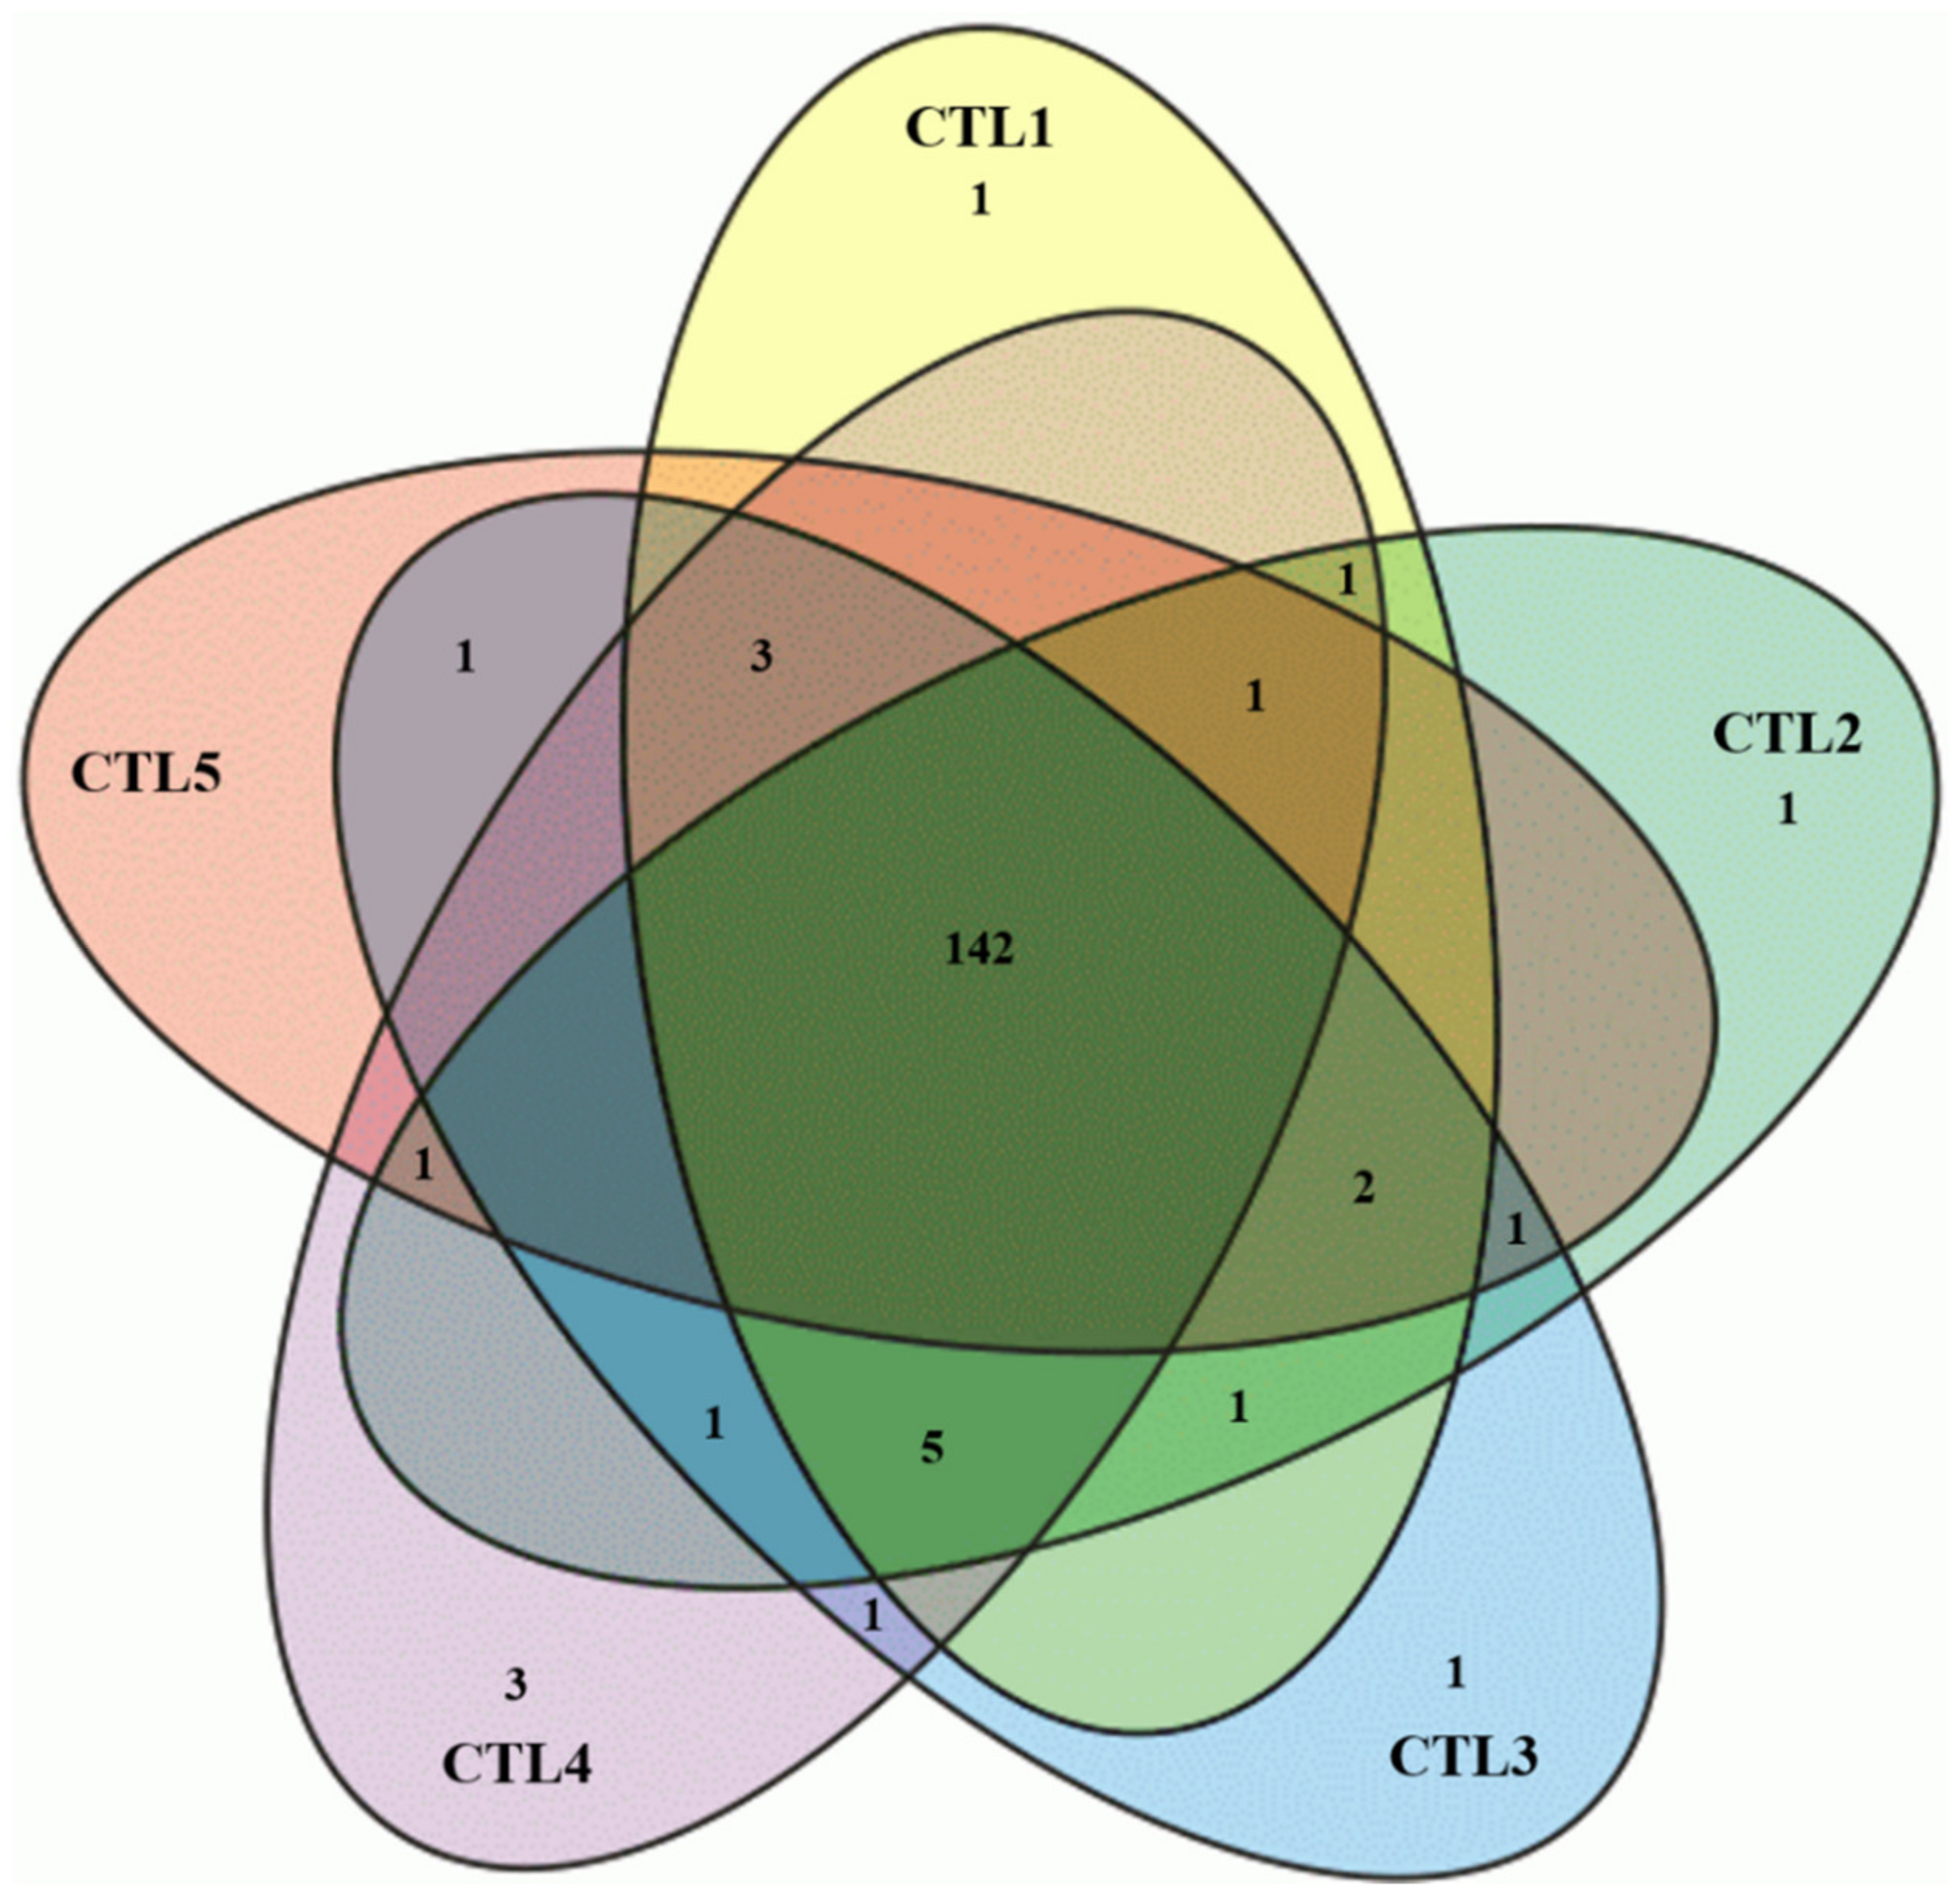
2.3. Chemometric Analysis
3. Experimental
3.1. Chemicals and Materials
3.2. Plant Materials
3.3. Supercritical Fluid (CO2) Extraction and Sample Preparation
3.4. UPLC-Q-TOF-MSE Analysis
3.5. Chemometric Analysis
4. Conclusions
Author Contributions
Funding
Institutional Review Board Statement
Informed Consent Statement
Data Availability Statement
Acknowledgments
Conflicts of Interest
References
- Jayaprakasha, G.; Rao, L.J.M. Chemistry, biogenesis, and biological activities of Cinnamomum zeylanicum. Crit. Rev. Food Sci. Nutr. 2011, 51, 547–562. [Google Scholar] [CrossRef] [PubMed]
- Bisht, V.K. Cinnamomum tamala (Buch.-Ham.) T. Nees & Eberm.: An alternative source of natural linalool. Natl. Acad. Sci. Lett. 2021, 44, 59–61. [Google Scholar]
- Sharma, V.; Lingamallu, J.M.R. An overview on chemical composition, bioactivity and processing of leaves of Cinnamomum tamala. Crit. Rev. Food Sci. Nutr. 2014, 54, 433–448. [Google Scholar] [CrossRef]
- Ahmed, A.; Choudhary, M.I.; Farooq, A.; Demirci, B.; Demirci, F.; Başer, K.H.C. Essential oil constituents of the spice Cinnamomum tamala (Ham.) Nees & Eberm. Flavour Fragr. J. 2000, 15, 388–390. [Google Scholar]
- Haider, S.Z.; Lohani, H.; Bhandari, U.; Naik, G.; Chauhan, N. Nutritional value and volatile composition of leaf and bark of Cinnamomum tamala from Uttarakhand (India). J. Essent. Oil-Bear. Plants 2018, 21, 732–740. [Google Scholar] [CrossRef]
- Kumar, S.; Sharma, S.; Vasudeva, N. Chemical compositions of Cinnamomum tamala oil from two different regions of India. Asian Pac. J. Trop. Dis. 2012, 2, S761–S764. [Google Scholar] [CrossRef]
- Jain, A.; Dubey, M.; Gupta, A.; Mahajan, S. Antimicrobial activity of Cinnamomum tamala (Tejpat) against some bacterial and fungal pathogens. J. Pharm. Res. 2011, 4, 3975–3977. [Google Scholar]
- Sudan, R.; Bhagat, M.; Gupta, S.; Chitrarakha, D.T. Comparative analysis of cytotoxic and antioxidant potential of edible Cinnamomum verum (bark) and Cinnamomum tamala (Indian bay leaf). Free. Radic. Antioxid. 2013, 3, S71–S734. [Google Scholar] [CrossRef]
- Tiwari, S.; Talreja, S. Importance of Cinnamomum tamala in the treatment of various diseases. Pharmacogn. J. 2020, 12, 1792–1796. [Google Scholar] [CrossRef]
- Hassan, W.; Kazmi, S.N.Z.; Noreen, H.; Riaz, A.; Zaman, B. Antimicrobial activity of Cinnamomum tamala leaves. J. Nutr. Disord. Ther. 2016, 6, 190–195. [Google Scholar] [CrossRef]
- Narath, S.; Koroth, S.K.; Shankar, S.S.; George, B.; Mutta, V.; Wacławek, S.; Cerník, M.; Padil, V.V.T.; Varma, R.S. Cinnamomum tamala leaf extract stabilized zinc oxide nanoparticles: A promising photocatalyst for methylene blue degradation. Nanomaterials 2021, 11, 1558–1575. [Google Scholar] [CrossRef] [PubMed]
- Farag, M.A.; Kabbash, E.M.; Mediani, A.; Doll, S.; Esatbeyoglu, T.; Afifi, S.M. Comparative metabolite fingerprinting of four different Cinnamon species analyzed via UPLC-MS and GC-MS and chemometric tools. Molecules 2022, 27, 2935. [Google Scholar] [CrossRef] [PubMed]
- Khan, A.D.; Singh, M.K.; Lavhale, P.M.; Kaushik, R. Phytochemical screening and HPTLC analysis of bio-active markers of ethanol extract of Indian Bay leaves. J. Herbs Spices Med. Plants 2023, 29, 156–167. [Google Scholar] [CrossRef]
- Champati, B.B.; Das, P.K.; Sahoo, C.; Ray, A.; Jena, S.; Sahoo, A.; Nayak, S.; Lata, S.; Panda, P.C. Chemical fingerprinting and multicomponent quantitative analysis for quality control of Cinnamomum tamala collected from Western Himalaya by HPLC-DAD. Heliyon 2024, 10, e30361. [Google Scholar] [CrossRef] [PubMed]
- Boutros, C.; Somasundar, P.; Razzak, A.; Helton, S.; Espat, N.J. Omega-3 fatty acids: Investigations from cytokine regulation to pancreatic cancer gene suppression. Arch. Surg. 2010, 145, 515–520. [Google Scholar] [CrossRef] [PubMed]
- Guil-Guerrero, J.L.; Delgado, A.D.; Gonzalez, M.C.M.; Isasa, M.E.T. Fatty acids and carotenes in some ber (Ziziphus jujuba Mill) varieties. Plant Foods Hum. Nutr. 2004, 59, 23–27. [Google Scholar] [CrossRef] [PubMed]
- Sears, B.; Perry, M. The role of fatty acids in insulin resistance. Lipids Health Dis. 2015, 14, 121. [Google Scholar] [CrossRef]
- Mizunoya, W.; Haramizu, S.; Shibakusa, T.; Okabe, Y.; Fushiki, T. Dietary conjugated linoleic acid increases endurance capacity and fat oxidation in mice during exercise. Lipids 2005, 40, 265–271. [Google Scholar] [CrossRef] [PubMed]
- Savych, A.; Basaraba, R.; Muzyka, N.; Ilashchuk, P. Analysis of fatty acid composition content in the plant components of antidiabetic herbal mixture by GC-MS. Pharmacia 2021, 68, 433–439. [Google Scholar] [CrossRef]
- Murkar, A.; Koninck, J.D.; Merali, Z. Cannabinoids: Revealing their complexity and role in central networks of fear and anxi-ety. Neurosci. Biobehav. Rev. 2021, 131, 30–46. [Google Scholar] [CrossRef] [PubMed]
- Hermes, D.J.; Xu, C.; Poklis, J.L.; Niphakis, M.J.; Cravatt, B.F.; Mackie, K.; Lichtman, A.H.; Ignatowska-Jankowska, B.M.; Fit-ting, S. Neuroprotective effects of fatty acid amide hydrolase catabolic enzyme inhibition in a HIV-1 Tat model of neuroAIDS. Neuropharmacology 2018, 141, 55–65. [Google Scholar] [CrossRef] [PubMed]
- Cvitkovic, D.; Skarica, I.; Dragovic-Uzelac, V.; Balbino, S. Supercritical CO2 extraction of fatty acids, phytosterols, and volatiles from Myrtle (Myrtus communis L.) fruit. Molecules 2024, 29, 1755. [Google Scholar] [CrossRef] [PubMed]
- Idris, S.A.; Rosli, N.R.; Aris, R.M.A.R. Supercritical carbon dioxide extraction of fatty acids compounds from tamarind seeds. Mater. Today Proc. 2022, 63, S462–S466. [Google Scholar] [CrossRef]
- Mok, H.J.; Lee, J.W.; Bandu, R.; Kang, H.S.; Kimb, K.-H.; Kim, K.P. A rapid and sensitive profiling of free fatty acids using liquid chromatography electrospray ionization tandem mass spectrometry (LC/ESI-MS/MS) after chemical derivatization. RSC Adv. 2016, 6, 32130–32139. [Google Scholar] [CrossRef]
- Li, Z.; Dong, F.; Sun, Y.; Sun, Z.; Song, X.; Dong, Y.; Huang, X.; Zhong, J.; Zhang, R.; Wang, M.; et al. Qualitative and quantitative analysis of six fatty acid amides in 11 edible vegetable oils using Liquid Chromatography-Mass Spectrometry. Front. Nutr. 2022, 9, 857858. [Google Scholar] [CrossRef] [PubMed]
- Kumar, S.; Singh, A.; Kumar, B. Identification and characterization of phenolics and terpenoids from ethanolic extracts of Phyllanthus species by HPLC-ESI-QTOF-MS/MS. J. Pharm. Anal. 2017, 7, 214–222. [Google Scholar] [CrossRef] [PubMed]
- Ma, F.; Cui, Q.; Bai, G. Combining UPLC/Q-TOF-MS/MS with biological evaluation for NF-κB inhibitors in Uyghur medicine Althaea rosea flowers. Front. Plant Sci. 2019, 9, 19751984. [Google Scholar] [CrossRef] [PubMed]
- Mantzourani, C.; Kokotou, M.G. Liquid Chromatography-Mass Spectrometry (LC-MS) derivatization-based methods for the determination of fatty acids in biological samples. Molecules 2022, 27, 5717. [Google Scholar] [CrossRef] [PubMed]
- Hu, T.; An, Z.; Shi, C.; Lie, P.; Liu, L. A sensitive and efficient method for simultaneous profiling of bile acids and fatty acids by UPLC-MS/MS. J. Pharmaceut. Biomed. 2020, 178, 112815. [Google Scholar] [CrossRef]
- Koch, E.; Wiebel, M.; Hopmann, C.; Kampschulte, N.; Schebb, N.H. Rapid quantification of fatty acids in plant oils and biological samples by LC-MS. Anal. Bioanal. Chem. 2021, 413, 5439–5451. [Google Scholar] [CrossRef] [PubMed]
- Serag, A.; Baky, M.H.; Dolland, S.; Farag, M.A. UHPLC-MS metabolome based classification of umbelliferous fruit taxa: A prospect for phytoequivalency of its different accessions and in response to roasting. RSC Adv. 2020, 10, 76–85. [Google Scholar] [CrossRef] [PubMed]
- Divito, E.B.; Davic, A.P.; Johnson, M.E.; Cascio, M. Electrospray ionization and collision induced dissociation mass spectrometry of primary fatty acid amides. Anal. Chem. 2012, 84, 2388–2394. [Google Scholar] [CrossRef] [PubMed]
- Nichols, K.K.; Ham, B.M.; Nichols, J.J.; Ziegler, C.; Green-Church, K.B. Identification of fatty acids and fatty acid amides in human meibomian gland secretions. Investig. Ophthalmol. Vis. Sci. 2007, 48, 34–39. [Google Scholar] [CrossRef] [PubMed]
- Yerlikaya, S.; Baloglu, M.C.; Diuzheva, A.; Jekő, J.; Cziáky, Z.; Zengin, G. Investigation of chemical profile, biological properties of Lotus corniculatus L. extracts and their apoptotic-autophagic effects on breast cancer cells. J. Pharm. Biomed. Anal. 2019, 174, 286–299. [Google Scholar] [CrossRef] [PubMed]
- Hernandez-Diaz, C.; Juarez-Oropeza, M.A.; Mascher, D.; Pavón, N.; Regla, I.; Paredes-Carbajal, M.C. Effects of oleamide on the vasomotor responses in the rat. Cannabis Cannabinoid Res. 2020, 5, 42–50. [Google Scholar] [CrossRef] [PubMed]
- Wang, Y.; Zhang, Y.; Shi, Y.-Q.; Pan, X.-H.; Lu, Y.-H.; Cao, P. Antibacterial effects of cinnamon (Cinnamomum zeylanicum) bark essential oil on Porphyromonas gingivalis. Microb. Pathog. 2018, 116, 26–32. [Google Scholar] [CrossRef] [PubMed]
- Kim, M.S.; Kim, J.Y. Cinnamon subcritical water extract attenuates intestinal inflammation and enhances intestinal tight junc-tion in a Caco-2 and RAW264. 7 co-culture model. Food Funct. 2019, 10, 4350–4360. [Google Scholar] [CrossRef] [PubMed]
- Wang, P.; Chi, J.; Guo, H.; Wang, S.-X.; Wang, J.; Xu, E.-P.; Dai, L.-P.; Wang, Z.-M. Identification of differential compositions of aqueous extracts of Cinnamomi ramulus and Cinnamomi cortex. Molecules 2023, 28, 2015–2036. [Google Scholar] [CrossRef] [PubMed]
- Song, J.; He, Y.; Luo, C.; Feng, B.; Ran, F.; Xu, H.; Ci, Z.; Xu, R.; Han, L.; Zhang, D. New progress in the pharmacology of pro-tocatechuic acid: A compound ingested in daily foods and herbs frequently and heavily. Pharmacol. Res. 2020, 161, 105109. [Google Scholar] [CrossRef] [PubMed]
- Huang, J.K.; Jan, C.R. Linoleamide, a brain lipid that induces sleep, increases cytosolic Ca2+ levels in MDCK renal tubular cells. Life Sci. 2001, 68, 997–1004. [Google Scholar] [CrossRef] [PubMed]
- Sova, M.; Saso, L. Natural sources, pharmacokinetics, biological activities and health benefits of hydroxycinnamic acids and their metabolites. Nutrients 2020, 12, 2190–2219. [Google Scholar] [CrossRef] [PubMed]
- Sojic, B.; Putnik, P.; Danilovic, B.; Teslic, N.; Kovacevic, D.B.; Pavlic, B. Lipid extracts obtained by supercritical fluid extraction and their application in meat products. Antioxidants 2022, 11, 716–734. [Google Scholar] [CrossRef] [PubMed]


| No. | RT | Compound | Chemical Class | Molecular Ion | Observed Mass | Error | MS/MS Fragments | SC-CO2 Extracts | ||||
|---|---|---|---|---|---|---|---|---|---|---|---|---|
| CTL1 | CTL2 | CTL3 | CTL4 | CTL5 | ||||||||
| 1 | 1.62 | Protocatechuic acid | CAD | [M − H]− | 153.0204 | −0.7 | 109.0297 | + | − | − | − | − |
| 2 | 1.67 | 3-(4-Hydroxyphenyl)- lactic acid | CAD | [M − H]− | 181.0496 | 2.4 | 119.0502 | + | + | + | + | + |
| 3 | 1.86 | Oxodecanedioic acid | DFA | [M − H]− | 215.0928 | −1.4 | 197.0786 171.1076 155.0751 | − | + | + | − | + |
| 4 | 1.88 | Heptanedioic acid (Pimelic acid I) | DFA | [M − H]− | 159.0667 | −2.5 | 141.0542 115.0772 97.0673 | + | + | + | + | − |
| 5 | 1.90 | Salicylic acid | CAD | [M − H]− | 137.0244 | 0.0 | 93.0348 | + | + | + | + | + |
| 6 | 2.16 | Heptanedioic acid (Pimelic acid II) | DFA | [M − H]− | 159.0665 | −1.3 | 141.0542 115.0772 97.0673 | + | + | + | + | − |
| 7 | 2.18 | Octanedioic acid (Suberic acid) | DFA | [M − H]− | 173.082 | −0.8 | 155.0687 129.0986 111.0816 | + | + | + | + | + |
| 8 | 2.21 | 2-Hydroxyhydro-cinnamic acid | CAD | [M − H]− | 165.0542 | −1.3 | 119.0502 79.9562 | + | + | + | + | + |
| 9 | 2.22 | Hydroxysebacic acid | DFA | [M − H]− | 217.1095 | −6.5 | 199.0984 171.1049 155.1108 | + | + | + | + | + |
| 10 | 2.32 | 3-Hydroxy-4-methoxy-cinnamic acid | CAD | [M − H]− | 193.0517 | −5.7 | 193.0517 | + | + | − | + | + |
| 11 | 2.33 | Hydroxyundecanedioic acid | DFA | [M − H]− | 231.1241 | −1.3 | 213.1229 169.1233 | + | + | + | + | + |
| 12 | 2.40 | Syringaldehyde | CAD | [M + H]+ | 183.0653 | −0.1 | 155.0731 123.0470 | + | + | + | + | + |
| 13 | 2.41 | Oxododecanedioic acid I | DFA | [M − H]− | 243.1215 | 5.4 | 225.1170 207.1074 181.1243 | + | + | + | + | + |
| 14 | 2.45 | Decenedioic acid I | DFA | [M − H]− | 199.0983 | −3.5 | 181.0865 155.1055 137.0939 | + | + | + | + | + |
| 15 | 2.47 | Nonanedioic acid (Azelaic acid) | DFA | [M − H] | 187.0982 | −3.2 | 169.0861 143.1065 125.0966 | + | + | + | + | + |
| 16 | 2.50 | Oxododecanedioic acid II | DFA | [M − H]− | 243.1215 | 5.4 | 225.1170 207.1074 181.1243 | + | + | + | + | + |
| 17 | 2.60 | Oxododecanedioic acid III | DFA | [M − H]− | 243.1214 | 5.8 | 225.1170 207.1074 181.1243 | + | + | + | + | + |
| 18 | 2.65 | Dodecenedioic acid I | DFA | [M − H]− | 227.1301 | −5.3 | 209.1197 183.1368 165.1287 | + | + | + | + | + |
| 19 | 2.65 | Decenedioic acid II | DFA | [M − H]− | 199.0983 | −3.5 | 181.0865 155.1055 137.0939 | + | + | + | + | + |
| 20 | 2.65 | Hydroxydodecanedioic acid | DFA | [M − H]− | 245.1406 | −4.9 | 227.1334 201.1317 | + | + | + | + | + |
| 21 | 2.75 | Sebacic acid | DFA | [M − H]− | 201.113 | 1.2 | 183.1021 157.1214 139.1119 | + | + | + | + | + |
| 22 | 2.77 | 4-Hydroxycinnamic acid | CAD | [M − H]− | 163.0409 | −5.0 | 119.0495 | − | − | + | − | − |
| 23 | 2.78 | 4-Methoxycinnamic acid | CAD | [M − H]− | 177.0556 | 0.6 | 133.0653 103.0577 92.0285 | + | + | + | + | + |
| 24 | 2.79 | Nonendioic acid | DFA | [M − H]− | 185.0815 | 2.2 | 167.0762, 141.0953, 123.0865 | − | − | − | + | − |
| 25 | 2.79 | Salicylic acid | CAD | [M − H]− | 137.0243 | 0.7 | 119.0515 93.0348 | + | + | + | + | + |
| 26 | 2.82 | Abscisic acid | CAD | [M − H]− | 263.1296 | −2.7 | 219.1398 203.1083 153.0899 | + | + | + | + | + |
| 27 | 2.82 | p-Hydroxybenzoic acid | CAD | [M − H]− | 137.0249 | −3.1 | 93.0348 | + | + | + | + | + |
| 28 | 2.86 | 4-Hydroxy cinnamaldehyde | CAD | [M − H]− | 147.0457 | −3.9 | 119.0481 117.0331 | + | + | + | + | + |
| 29 | 2.92 | Undecanedioic acid | DFA | [M − H]− | 213.1128 | 1.9 | 195.1116 169.1233 151.1254 | + | + | + | + | + |
| 30 | 2.93 | Decenoic acid | MFA | [M − H]− | 169.1233 | 0.6 | 169.1234 151.1153 125.1298 | + | + | + | + | + |
| 31 | 2.94 | Coumarin | CAD | [M + H]+ | 147.0446 | 0.9 | 103.0540 91.0597 | + | + | + | + | + |
| 32 | 2.95 | Oxodecenoic acid | MFA | [M − H]− | 183.1028 | −1.5 | 183.1027 147.0874 139.1129 | + | + | + | + | + |
| 33 | 3.04 | Decenedioic acid | DFA | [M − H]− | 215.1292 | −1.4 | 197.1188 171.1410 153.1279 | + | + | + | + | + |
| 34 | 3.06 | Cinnamic acid | CAD | [M − H]− | 147.0457 | 0.5 | 103.0542 | + | + | + | + | + |
| 35 | 3.07 | Dodecanedioic acid II | DFA | [M − H]− | 227.1301 | −5.3 | 209.1197 183.1368 165.1287 | + | + | + | + | + |
| 36 | 3.15 | 9,10,13-Trihydroxy-11-octadecenoic acid | MFA | [M − H]− | 329.2325 | 2.4 | 311.2269 293.2155 171.1046 | + | + | + | + | + |
| 37 | 3.20 | 2-Methoxycinnamic acid | CAD | [M − H]− | 177.056 | −1.5 | 133.0653 103.0577 92.0285 | + | + | + | + | + |
| 38 | 3.21 | Cinnamyl alcohol | CAD | [M + H]+ | 135.0851 | 0.5 | 117.0695 91.0559 | − | − | + | + | − |
| 39 | 3.33 | Dihydroxyhexadecanoic acid | MFA | [M − H]− | 287.2232 | −1.4 | 269.2183 241.2277 | + | + | + | + | + |
| 40 | 3.39 | Dodecanedioic acid | DFA | [M − H]− | 229.1439 | 2.9 | 211.1342 167.1434 | + | + | + | + | + |
| 41 | 3.48 | Cinnamaldehyde I | CAD | [M + H]+ | 133.0648 | 0.9 | 103.0603 79.0593 | + | + | + | + | + |
| 42 | 3.60 | 9,10,11-Trihydroxy-12-octadecenoic acid | MFA | [M − H]− | 329.2325 | 2.4 | 311.2269 293.2155 171.1046 | + | + | + | + | + |
| 43 | 3.72 | Octadecanedioic acid I | DFA | [M − H]− | 313.2375 | 3.2 | 295.2280 269.2425 251.2289 | + | + | + | + | + |
| 44 | 3.87 | Tridecanedioic acid | DFA | [M − H]− | 243.1601 | 0.4 | 225.1506 199.1763 181.1609 | + | + | + | + | + |
| 45 | 4.00 | Nonanamide | FAA | [M + H]+ | 158.1559 | 1.3 | 116.1119 69.0753 | + | + | + | + | + |
| 46 | 4.00 | Methylcinnamic acid | CAD | [M + H]+ | 163.0757 | −1.1 | 105.0356 103.0569 91.0519 | + | + | + | + | + |
| 47 | 4.23 | Cinnamyl acetate | CAD | [M + H]+ | 177.0913 | −1.2 | 105.0356 103.0569 91.0519 | + | + | + | + | + |
| 48 | 4.41 | Decanamide | FAA | [M + H]+ | 172.1706 | −5.8 | 128.0678 105.0731 69.0751 | + | + | + | + | + |
| 49 | 4.49 | Tetradecanedioic acid I | DFA | [M − H]− | 257.1758 | 0.1 | 239.1580 213.1841 195.1700 | + | + | + | + | + |
| 50 | 4.75 | Cinnamyl alcohol II | CAD | [M + H]+ | 135.0851 | 0.5 | 117.0695 91.0559 | + | + | + | + | + |
| 51 | 4.84 | Hexadecanedioic acid | DFA | [M − H]− | 283.1912 | 1.1 | 265.1766 221.1924 | + | + | + | + | + |
| 52 | 4.94 | Octadecanedioic acid II | DFA | [M − H]− | 313.2375 | 3.2 | 295.2280 269.2425 251.2289 | + | + | + | + | + |
| 53 | 5.08 | Cinnamaldehyde II | CAD | [M + H]+ | 133.0649 | 0.7 | 103.0582 77.0431 | + | + | + | + | + |
| 54 | 5.26 | Pentadecanedioic acid | DFA | [M − H]− | 271.1915 | 0.0 | 253.1779 227.2038 209.1932 | + | + | + | + | + |
| 55 | 5.40 | Octadecanedioic acid I | DFA | [M − H]− | 311.2224 | 1.3 | 293.2123 267.2316 249.2220 | + | + | + | + | + |
| 56 | 5.46 | Octadecanedioic acid III | DFA | [M − H]− | 313.2375 | 3.2 | 295.2280 269.2425 251.2289 | + | + | + | + | + |
| 57 | 5.50 | Octadecanedioic acid II | DFA | [M − H]− | 311.2224 | 1.3 | 293.2123 267.2316 249.2220 | + | + | + | + | + |
| 58 | 5.53 | Heptadecanedioic acid | DFA | [M − H]− | 297.2067 | 1.4 | 279.1973 253.2210 235.2145 | + | + | + | + | + |
| 59 | 5.70 | Octadecanedioic acid III | DFA | [M − H]− | 311.2224 | 1.3 | 293.2123 267.2316 249.2220 | + | + | + | + | + |
| 60 | 5.98 | Dihydroxystearic acid | MFA | [M − H]− | 315.2544 | −1.0 | 315.2544 297.2490 | + | + | + | + | + |
| 61 | 6.03 | Hydroxystearidonic acid I | MFA | [M − H]− | 291.1964 | 0.7 | 273.1883 255.2316 245.1916 | + | + | + | + | + |
| 62 | 6.18 | Hexadecanedioic acid | DFA | [M − H]− | 285.2072 | −0.35 | 267.1978 241.2069 | + | + | + | + | + |
| 63 | 6.32 | Decanoic acid (Capric acid) | MFA | [M − H]− | 171.1392 | −1.1 | 171.1396 | + | + | + | + | + |
| 64 | 6.40 | Stearidonic acid I | MFA | [M − H]− | 275.2027 | −3.6 | 257.1952 231.2127 229.1872 | + | + | + | + | + |
| 65 | 6.40 | Lauramide | FAA | [M + H]+ | 200.2015 | −3.0 | 116.1121 102.0851 74.0631 | + | + | + | + | + |
| 66 | 6.42 | 9-Hydroxy-12,14,16-octadecatrienoic acid | MFA | [M − H]− | 293.2125 | −1.0 | 275.2022 183.1399 171.1017 | + | + | + | + | + |
| 67 | 6.57 | Hydroxyoctadecatrienoic acid I | MFA | [M − H]− | 293.2125 | −1.0 | 275.2076 185.1206 171.1047 | + | + | + | + | + |
| 68 | 6.57 | Stearidonic acid II | MFA | [M − H]− | 275.2027 | −3.6 | 257.1952 229.1872 | + | + | + | + | + |
| 69 | 6.80 | Hydroxystearidonic acid II | MFA | [M − H]− | 291.1964 | 0.7 | 273.1883 255.2316 245.1916 | + | + | + | + | + |
| 70 | 6.98 | Hydroxystearidonic acid III | MFA | [M − H]− | 291.1964 | 0.7 | 273.1883 255.2316 245.1916 | + | + | + | + | + |
| 71 | 7.16 | Hydroxystearidonic acid IV | MFA | [M − H]− | 291.1964 | 0.7 | 273.1883 255.2316 245.1916 | + | + | + | + | + |
| 72 | 7.17 | Tridecanamide | FAA | [M + H]+ | 214.2194 | 0.5 | 105.0761 91.0597 69.0781 | + | + | + | + | + |
| 73 | 7.22 | Heptadecanedioic acid I | DFA | [M − H]− | 299.2242 | −4.7 | 281.2143 255.2352 237.2166 | + | + | + | + | − |
| 74 | 7.49 | 13-Hydroxy-9,11-octadecadienoic acid | MFA | [M − H]− | 295.2278 | 0.3 | 277.2161 195.1418 113.0973 | + | + | + | + | + |
| 75 | 7.85 | Ricinoleic acid I | MFA | [M − H]− | 297.2438 | −1.0 | 279.2322 183.1396 93.0349 | + | + | + | + | + |
| 76 | 8.30 | Hydroxy- octadecatrienoic acid II | MFA | [M − H]− | 293.2125 | −1.0 | 257.1911 171.1047 | + | + | + | + | + |
| 77 | 8.33 | Octadecanedioic acid IV | DFA | [M − H]− | 313.2375 | 3.2 | 295.2280 269.2425 251.2289 | + | + | + | + | + |
| 78 | 8.50 | Hydroxy- octadecatrienoic acid III | MFA | [M − H]− | 293.2125 | −1.0 | 275.2076 171.1047 | + | + | + | + | + |
| 79 | 8.52 | Ricinoleic acid II | MFA | [M − H]− | 297.2438 | −1.0 | 279.2322 183.1396 93.0349 | + | + | + | + | + |
| 80 | 8.62 | Ricinoleic acid III | MFA | [M − H]− | 297.2438 | −1.0 | 279.2322 183.1396 93.0349 | + | + | + | + | + |
| 81 | 8.84 | Dodecanoic acid (Lauric acid) | MFA | [M − H]− | 199.1704 | −0.3 | 199.1704 181.1572 | + | + | + | + | + |
| 82 | 9.01 | Hydroxyhexadecenoic acid I | MFA | [M − H]− | 269.213 | −3.0 | 251.2080 223.2160 | + | + | + | + | + |
| 83 | 9.11 | Palmitoleamide I | FAA | [M + H]+ | 254.2483 | −1.8 | 105.0752 91.0577 69.0753 | + | + | + | + | + |
| 84 | 9.14 | Linoleamide | FAA | [M + H]+ | 278.2471 | 2.7 | 189.1640 175.1480 91.0578 | + | + | + | + | + |
| 85 | 9.17 | Tetradecanedioic acid II | DFA | [M − H]− | 257.1758 | 0.1 | 239.1580 213.1841 195.1700 | − | − | + | − | + |
| 86 | 9.26 | 9-Hydroxy-10,12-octadecadienoic acid | MFA | [M − H]− | 295.2278 | 0.3 | 277.2229 183.0112 119.0509 | + | + | + | + | + |
| 87 | 9.29 | Myristamide | FAA | [M + H]+ | 228.2345 | −1.3 | 116.1097 102.0963 88.0815 | + | + | + | + | + |
| 88 | 9.36 | 9-Hydroxy-10,12-octadecadienoic acid | MFA | [M − H]− | 295.2278 | 0.3 | 277.2229 183.0112 119.0509 | + | + | + | + | + |
| 89 | 9.51 | Nonadecanedioic acid | DFA | [M − H]− | 327.2549 | −2.4 | 309.2492 283.2639 265.2502 | + | + | + | + | + |
| 90 | 9.81 | Hydroxyhexadecenoic acid II | MFA | [M − H]− | 269.213 | −3.0 | 251.2080 223.2160 | + | + | + | + | + |
| 91 | 9.96 | Heptadecanedioic acid II | DFA | [M − H]− | 299.2242 | −4.7 | 281.2143 255.2352 237.2166 | + | + | + | + | + |
| 92 | 10.14 | Dihydroxy- octadecenoic acid | MFA | [M − H]− | 313.2378 | 1.9 | 183.1315 129.0899 | + | + | + | + | + |
| 93 | 10.16 | Octadecanedioic acid V | DFA | [M − H]− | 313.2375 | 3.2 | 295.2280 129.0899 | + | + | + | + | + |
| 94 | 10.22 | Tridecanoic acid | MFA | [M − H]− | 213.1856 | 1.9 | 213.1856 195.1645 | + | + | + | + | + |
| 95 | 10.27 | Hydroxyhexadecenoic acid III | MFA | [M − H]− | 269.213 | −3.0 | 251.2080 225.2243 223.2160 | + | + | + | + | + |
| 96 | 10.29 | Hydroxyhexadecanoic acid I | MFA | [M − H]− | 271.2293 | −5.2 | 271.2293 225.2244 | + | + | + | + | + |
| 97 | 10.35 | Pentadecanamide | FAA | [M + H]+ | 242.2466 | 116.0578 102. 0954 91.0591 | + | + | + | + | + | |
| 98 | 10.50 | Dihydroxy- octadecadienoic acid I | MFA | [M − H]− | 311.2222 | 1.9 | 183.1315 129.0899 | + | + | + | + | + |
| 99 | 10.60 | Palmitadienoic acid | MFA | [M − H]− | 251.2016 | 0.4 | 251.2016 | + | + | + | + | + |
| 100 | 10.66 | Linoleamide I | FAA | [M + H]+ | 280.2631 | 1.4 | 88.0805 75.0431 57.0752 | + | + | + | + | + |
| 101 | 10.70 | Dihydroxy- octadecadienoic acid II | MFA | [M − H]− | 311.2222 | 1.9 | 293.2160 275.1958 257.2183 | + | + | + | + | + |
| 102 | 10.74 | Eicosanedioic acid | DFA | [M − H]− | 341.2695 | 0.6 | 323.2603 297.2877 279.2632 | + | + | + | + | + |
| 103 | 10.77 | Nonadecanedioic acid | DFA | [M − H]− | 325.2368 | 4.9 | 307.2291 281.2480 263.2364 | + | + | + | − | + |
| 104 | 11.01 | Dihydroxy- octadecadienoic acid III | MFA | [M − H]− | 311.2222 | 1.9 | 293.2160 275.1958 257.2183 | + | + | + | + | + |
| 105 | 11.10 | Ceriporic acid I | DFA | [M − H]− | 351.2534 | 1.9 | 333.2467 307.2613 289.2500 | + | + | + | + | + |
| 106 | 11.14 | Oleic acid I | MFA | [M − H]− | 281.248 | 2.1 | 281.2481 263.2364 237.2231 | − | + | + | + | + |
| 107 | 11.17 | Pentacosanedioic acid I | DFA | [M − H]− | 411.3474 | 1.5 | 393.3307 367.3678 349.3567 | + | + | + | + | + |
| 108 | 11.24 | Stearic acid I | MFA | [M − H]− | 283.2642 | 0.2 | 283.2642 265.2568 | + | + | + | + | + |
| 109 | 11.35 | Eicosenedioic acid | DFA | [M − H]− | 339.2542 | −0.3 | 321.2497 295.2707 277.2547 | + | + | + | + | + |
| 110 | 11.37 | Hydroxyhexadecanoic acid II | MFA | [M − H]− | 271.2293 | 1.5 | 271.2293 225.2244 | + | + | + | + | + |
| 111 | 11.38 | Pentadecenoic acid | MFA | [M − H]− | 239.2015 | 0.8 | 239.2115 221.1918 | + | + | + | + | + |
| 112 | 11.48 | Linolenic acid | MFA | [M − H]− | 277.2173 | 0.0 | 259.2143 233.2348 211.1382 | + | + | + | + | + |
| 113 | 11.61 | Myristic acid | MFA | [M − H]− | 227.2015 | 0.7 | 227.2015 209.1939 | + | + | + | + | + |
| 114 | 11.80 | Oxotetra- cosanedioic acid | DFA | [M − H]− | 411.3118 | −0.5 | 393.3081 375.2944 349.3106 | + | + | + | + | + |
| 115 | 11.80 | Palmitamide | FAA | [M + H]+ | 256.2636 | −0.4 | 116.1119 102.0963 88.0805 | + | + | + | + | + |
| 116 | 11.83 | Heptadecadienoic acid | MFA | [M − H]− | 265.2167 | 2.3 | 265.2167 247.2089 | + | + | + | + | + |
| 117 | 11.88 | Ceriporic acid II | DFA | [M − H]− | 351.2534 | 1.9 | 333.2467 307.2613 289.2500 | − | + | + | + | − |
| 118 | 11.88 | Eicosadienoic acid I | MFA | [M − H]− | 307.2649 | −2.0 | 289.2500 263.2529 261.2602 | − | − | − | + | − |
| 119 | 11.97 | Heneicosanedioic acid | DFA | [M − H]− | 355.285 | 1.1 | 337.2845 311.2908 293.2897 | + | + | + | + | + |
| 120 | 12.10 | Ceriporic acid III | DFA | [M − H]− | 351.2534 | 1.9 | 333.2467 307.2613 289.2500 | − | − | − | + | − |
| 121 | 12.25 | Palmitoleic acid I | MFA | [M − H]− | 253.2177 | −1.6 | 253.2177 235.2183 | + | + | + | + | + |
| 122 | 12.49 | Ricinoleic acid IV | MFA | [M − H]− | 297.2438 | −1.0 | 279.2322 183.1396 93.0349 | + | + | + | + | + |
| 123 | 12.51 | Oleamide I | FAA | [M + H]+ | 282.2787 | 1.4 | 135.1205 83.0896 69.0753 | + | + | + | + | + |
| 124 | 12.52 | Arachidamide | FAA | [M + H]+ | 312.3257 | 1.3 | 116.0678 102.0963 88.0597 | + | + | + | + | + |
| 125 | 12.70 | Pentadecanoic acid | MFA | [M − H]− | 241.2173 | 0.0 | 241.2173 223.2073 | + | + | + | + | + |
| 126 | 12.70 | Palmitic acid I | MFA | [M − H]− | 255.2328 | 0.6 | 255.2351 237.2227 | + | + | + | + | + |
| 127 | 12.70 | Eicosenoic acid | MFA | [M − H]− | 309.2783 | 5.2 | 309.2799 291.2735 | + | − | + | + | + |
| 128 | 12.85 | Heptadecanamide I | FAA | [M + H]+ | 270.2778 | 4.8 | 116.0579 88.0597 57.0753 | + | + | + | + | + |
| 129 | 13.04 | Linoleic acid | MFA | [M − H]− | 279.2329 | 0.4 | 279.2329 261.2203 243.2081 | + | + | + | + | + |
| 130 | 13.19 | Docosanedioic acid | DFA | [M − H]− | 369.301 | 0.0 | 335.3020 325.3030 307.2972 | + | + | + | + | + |
| 131 | 13.22 | Heptadecanamide II | FAA | [M + H]+ | 270.2778 | 4.8 | 116.0579 88.0597 57.0753 | + | + | + | + | + |
| 132 | 13.33 | Palmitoleic acid II | MFA | [M − H]− | 253.2177 | −1.6 | 253.2177 235.2183 | + | + | + | + | + |
| 133 | 13.40 | Arachidinic acid I | MFA | [M − H]− | 311.295 | 1.9 | 311.2950 293.2899 267.2970 | + | + | + | + | − |
| 134 | 13.41 | Heptadecenamide | FAA | [M + H]+ | 268.2641 | −2.3 | 116.0579 88.0597 57.0753 | + | + | + | + | + |
| 135 | 13.41 | Behenamide I | FAA | [M + H]+ | 340.3575 | −0.3 | 102.0963 88.0431 57.0752 | + | + | + | + | + |
| 136 | 13.48 | Palmitoleamide II | FAA | [M + H]+ | 254.2481 | −1.0 | 105.0752 91.0577 69.0753 | + | + | + | + | + |
| 137 | 13.51 | Erucamide I | FAA | [M + H]+ | 338.3438 | −6.1 | 321.2128 97.1100 83.0933 | + | + | + | + | + |
| 138 | 13.57 | Heptadecenoic acid I | MFA | [M − H]− | 267.2331 | −0.4 | 267.2331 249.2276 | + | + | + | + | + |
| 139 | 13.66 | Palmitoleic acid III | MFA | [M − H]− | 253.2177 | −1.6 | 253.2177 235.2183 | + | + | + | + | + |
| 140 | 13.70 | Palmitic acid II | MFA | [M − H]− | 255.2328 | 0.6 | 255.2351 237.2227 | + | + | + | + | + |
| 141 | 13.77 | Heneicosanoic acid | MFA | [M − H]− | 325.3113 | −0.3 | 325.3113 307.3052 281.3201 | + | + | + | + | + |
| 142 | 13.77 | Heptadecanamide III | FAA | [M + H]+ | 270.2778 | 4.8 | 115.0579 91.0597 69.0753 | + | + | + | + | + |
| 143 | 13.79 | Oleamide II | FAA | [M + H]+ | 282.2789 | 0.7 | 69.0753 55.0591 | + | + | + | + | + |
| 144 | 13.82 | Heptadecenoic acid II | MFA | [M − H]− | 267.2331 | −0.4 | 267.2331 249.2276 | + | − | + | + | + |
| 145 | 14.12 | Arachidinic acid II | MFA | [M − H]− | 311.295 | 1.9 | 311.2950 293.2899 267.2970 | + | + | + | + | + |
| 146 | 14.30 | Palmitic acid III | MFA | [M − H]− | 255.2328 | 0.6 | 255.2351 237.2227 | + | + | + | + | + |
| 147 | 14.37 | Heptadecanoic acid I | MFA | [M − H]− | 269.2482 | 1.5 | 269.2482 251.2439 225.2305 | + | + | + | + | + |
| 148 | 14.39 | Tricosanedioic acid | DFA | [M − H]− | 383.3176 | −2.4 | 365.3100 339.3257 321.3157 | + | + | + | + | + |
| 149 | 14.41 | Octadecanedioic acid VI | DFA | [M − H]− | 313.2375 | 3.19 | 295.2280 269.2425 251.2289 | + | + | + | + | + |
| 150 | 14.65 | Stearamide | FAA | [M + H]+ | 284.2957 | −3.2 | 116.1121 102.0851 88.0821 | + | + | + | + | + |
| 151 | 14.67 | Erucamide II | FAA | [M + H]+ | 338.3401 | 4.9 | 321.2128 97.1100 83.0933 | + | + | + | + | + |
| 152 | 14.87 | Stearic acid II | MFA | [M − H]− | 283.2642 | 0.2 | 283.2642 265.2568 | + | + | + | + | + |
| 153 | 14.87 | Ocatdecanoic acid II | MFA | [M − H]− | 281.2478 | 2.8 | 281.2478 263.2364 | + | + | + | + | + |
| 154 | 14.95 | Tetracosanoic acid | MFA | [M − H]− | 367.3573 | 2.4 | 367.3573 | + | + | + | − | − |
| 155 | 14.95 | Behenamide II | FAA | [M + H]+ | 340.3575 | −3.0 | 102.0963 88.0431 57.0752 | + | + | + | + | + |
| 156 | 15.04 | Nonadecanoic acid | MFA | [M − H]− | 297.2798 | 0.3 | 297.2798 279.2667 | + | + | + | + | − |
| 157 | 15.16 | Eicosenamide | FAA | [M + H]+ | 310.3092 | 3.8 | 256.2669 97.1100 69.0753 | + | + | + | + | + |
| 158 | 15.50 | Tricosanoic acid | MFA | [M − H]− | 353.3405 | 5.7 | 353.3405 | + | + | − | + | − |
| 159 | 15.56 | Eicosadienoic acid II | MFA | [M − H]− | 307.2649 | −2.0 | 289.2500 263.2529 261.2602 | + | + | + | + | + |
| 160 | 15.70 | Docosanoic acid (Behenic acid) | MFA | [M − H]− | 339.3272 | −0.9 | 295.3106 139.0407 119.0496 | + | + | + | − | + |
| 161 | 15.70 | Nonadecanamide II | FAA | [M + H]+ | 298.3085 | 6.4 | 91.0597 69.0745 | + | + | + | + | + |
| 162 | 15.70 | Linoleamide II | FAA | [M + H]+ | 280.2628 | 2.4 | 81.0513 69.0745 57.0752 | − | + | − | − | − |
| 163 | 15.81 | Tetracosanedioic acid | DFA | [M − H]− | 397.3307 | 4.03 | 379.3195 353.3482 335.3321 | + | + | + | + | + |
| 164 | 15.87 | Heptadecanoic acid II (Margaric acid) | MFA | [M − H]− | 269.2482 | 1.5 | 269.2482 251.2439 225.2305 | + | + | + | + | + |
| 165 | 16.07 | Henicosanamide | FAA | [M + H]+ | 326.3426 | −2.6 | 91.0597 69.0753 | − | + | − | + | + |
| 166 | 16.23 | Pentacosanedioic acid II | DFA | [M − H]− | 411.3474 | 1.16 | 393.3307 367.3678 349.3567 | + | − | + | + | + |
Disclaimer/Publisher’s Note: The statements, opinions and data contained in all publications are solely those of the individual author(s) and contributor(s) and not of MDPI and/or the editor(s). MDPI and/or the editor(s) disclaim responsibility for any injury to people or property resulting from any ideas, methods, instructions or products referred to in the content. |
© 2024 by the authors. Licensee MDPI, Basel, Switzerland. This article is an open access article distributed under the terms and conditions of the Creative Commons Attribution (CC BY) license (https://creativecommons.org/licenses/by/4.0/).
Share and Cite
Lohani, H.; Kumar, A.; Bidarakundi, V.; Agrawal, L.; Haider, S.Z.; Chauhan, N.K. Identification of Fatty Acids, Amides and Cinnamic Acid Derivatives in Supercritical-CO2 Extracts of Cinnamomum tamala Leaves Using UPLC-Q-TOF-MSE Combined with Chemometrics. Molecules 2024, 29, 3760. https://doi.org/10.3390/molecules29163760
Lohani H, Kumar A, Bidarakundi V, Agrawal L, Haider SZ, Chauhan NK. Identification of Fatty Acids, Amides and Cinnamic Acid Derivatives in Supercritical-CO2 Extracts of Cinnamomum tamala Leaves Using UPLC-Q-TOF-MSE Combined with Chemometrics. Molecules. 2024; 29(16):3760. https://doi.org/10.3390/molecules29163760
Chicago/Turabian StyleLohani, Hema, Arvind Kumar, Vinod Bidarakundi, Lalit Agrawal, Syed Zafar Haider, and Nirpendra Kumar Chauhan. 2024. "Identification of Fatty Acids, Amides and Cinnamic Acid Derivatives in Supercritical-CO2 Extracts of Cinnamomum tamala Leaves Using UPLC-Q-TOF-MSE Combined with Chemometrics" Molecules 29, no. 16: 3760. https://doi.org/10.3390/molecules29163760
APA StyleLohani, H., Kumar, A., Bidarakundi, V., Agrawal, L., Haider, S. Z., & Chauhan, N. K. (2024). Identification of Fatty Acids, Amides and Cinnamic Acid Derivatives in Supercritical-CO2 Extracts of Cinnamomum tamala Leaves Using UPLC-Q-TOF-MSE Combined with Chemometrics. Molecules, 29(16), 3760. https://doi.org/10.3390/molecules29163760