
Comparative Analysis of Commercially Available Flavor Oil Sausages and Smoked Sausages
 , , ,
, , ,
Abstract
:1. Introduction
2. Results and Analysis
2.1. Texture Analysis
2.2. Physical and Chemical Index Analysis
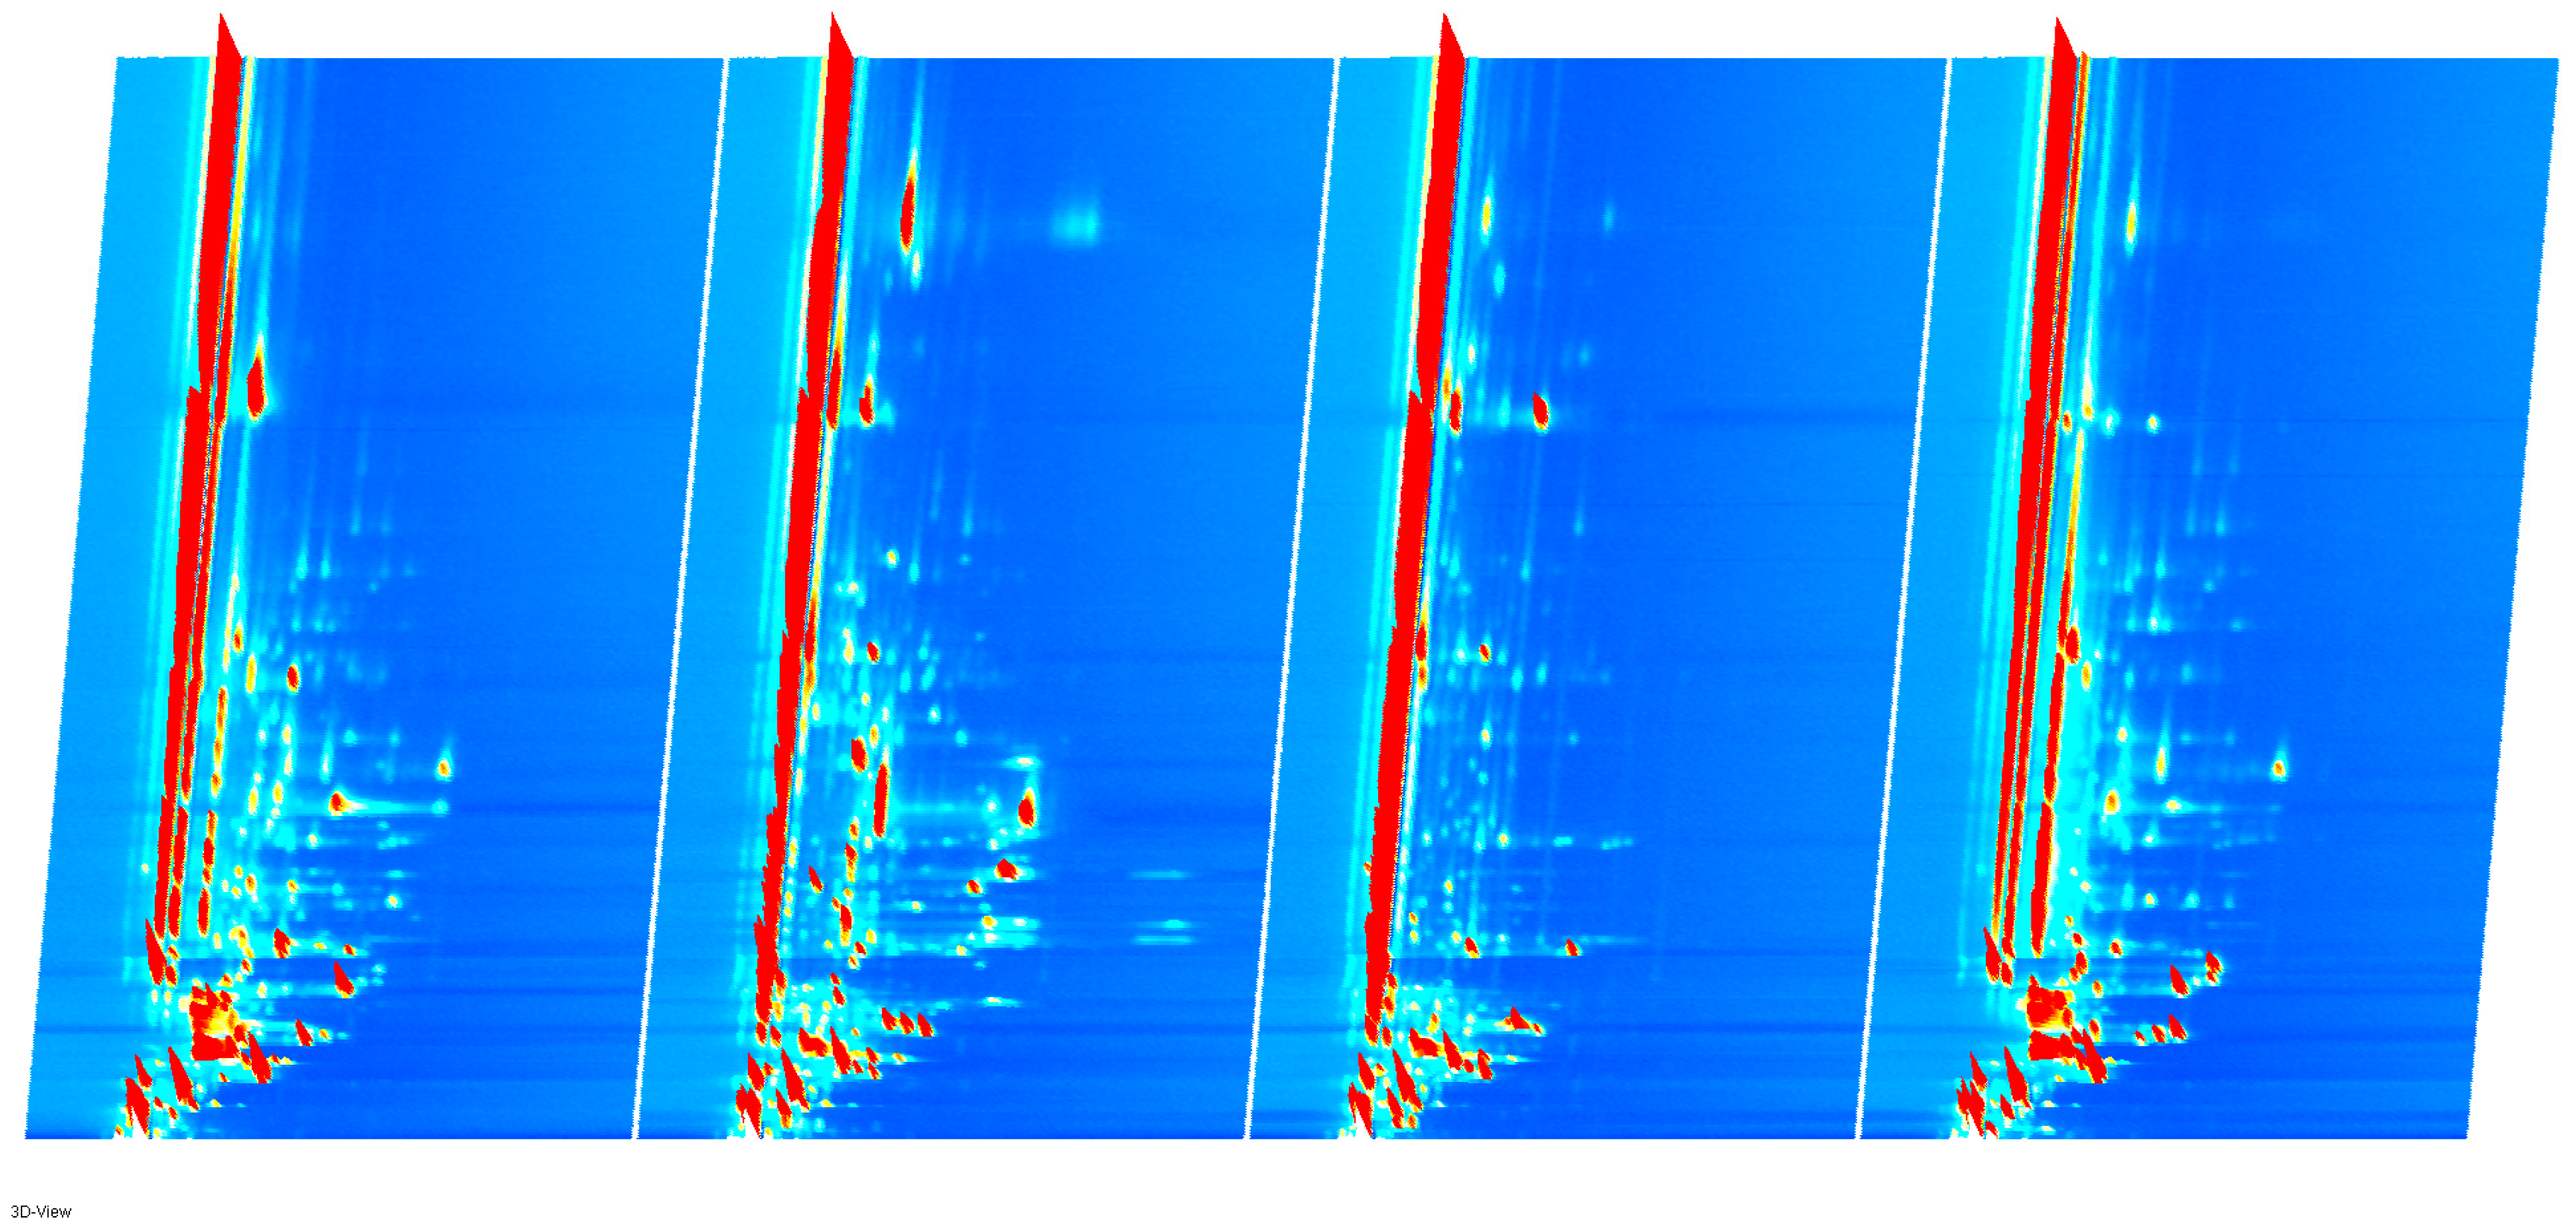
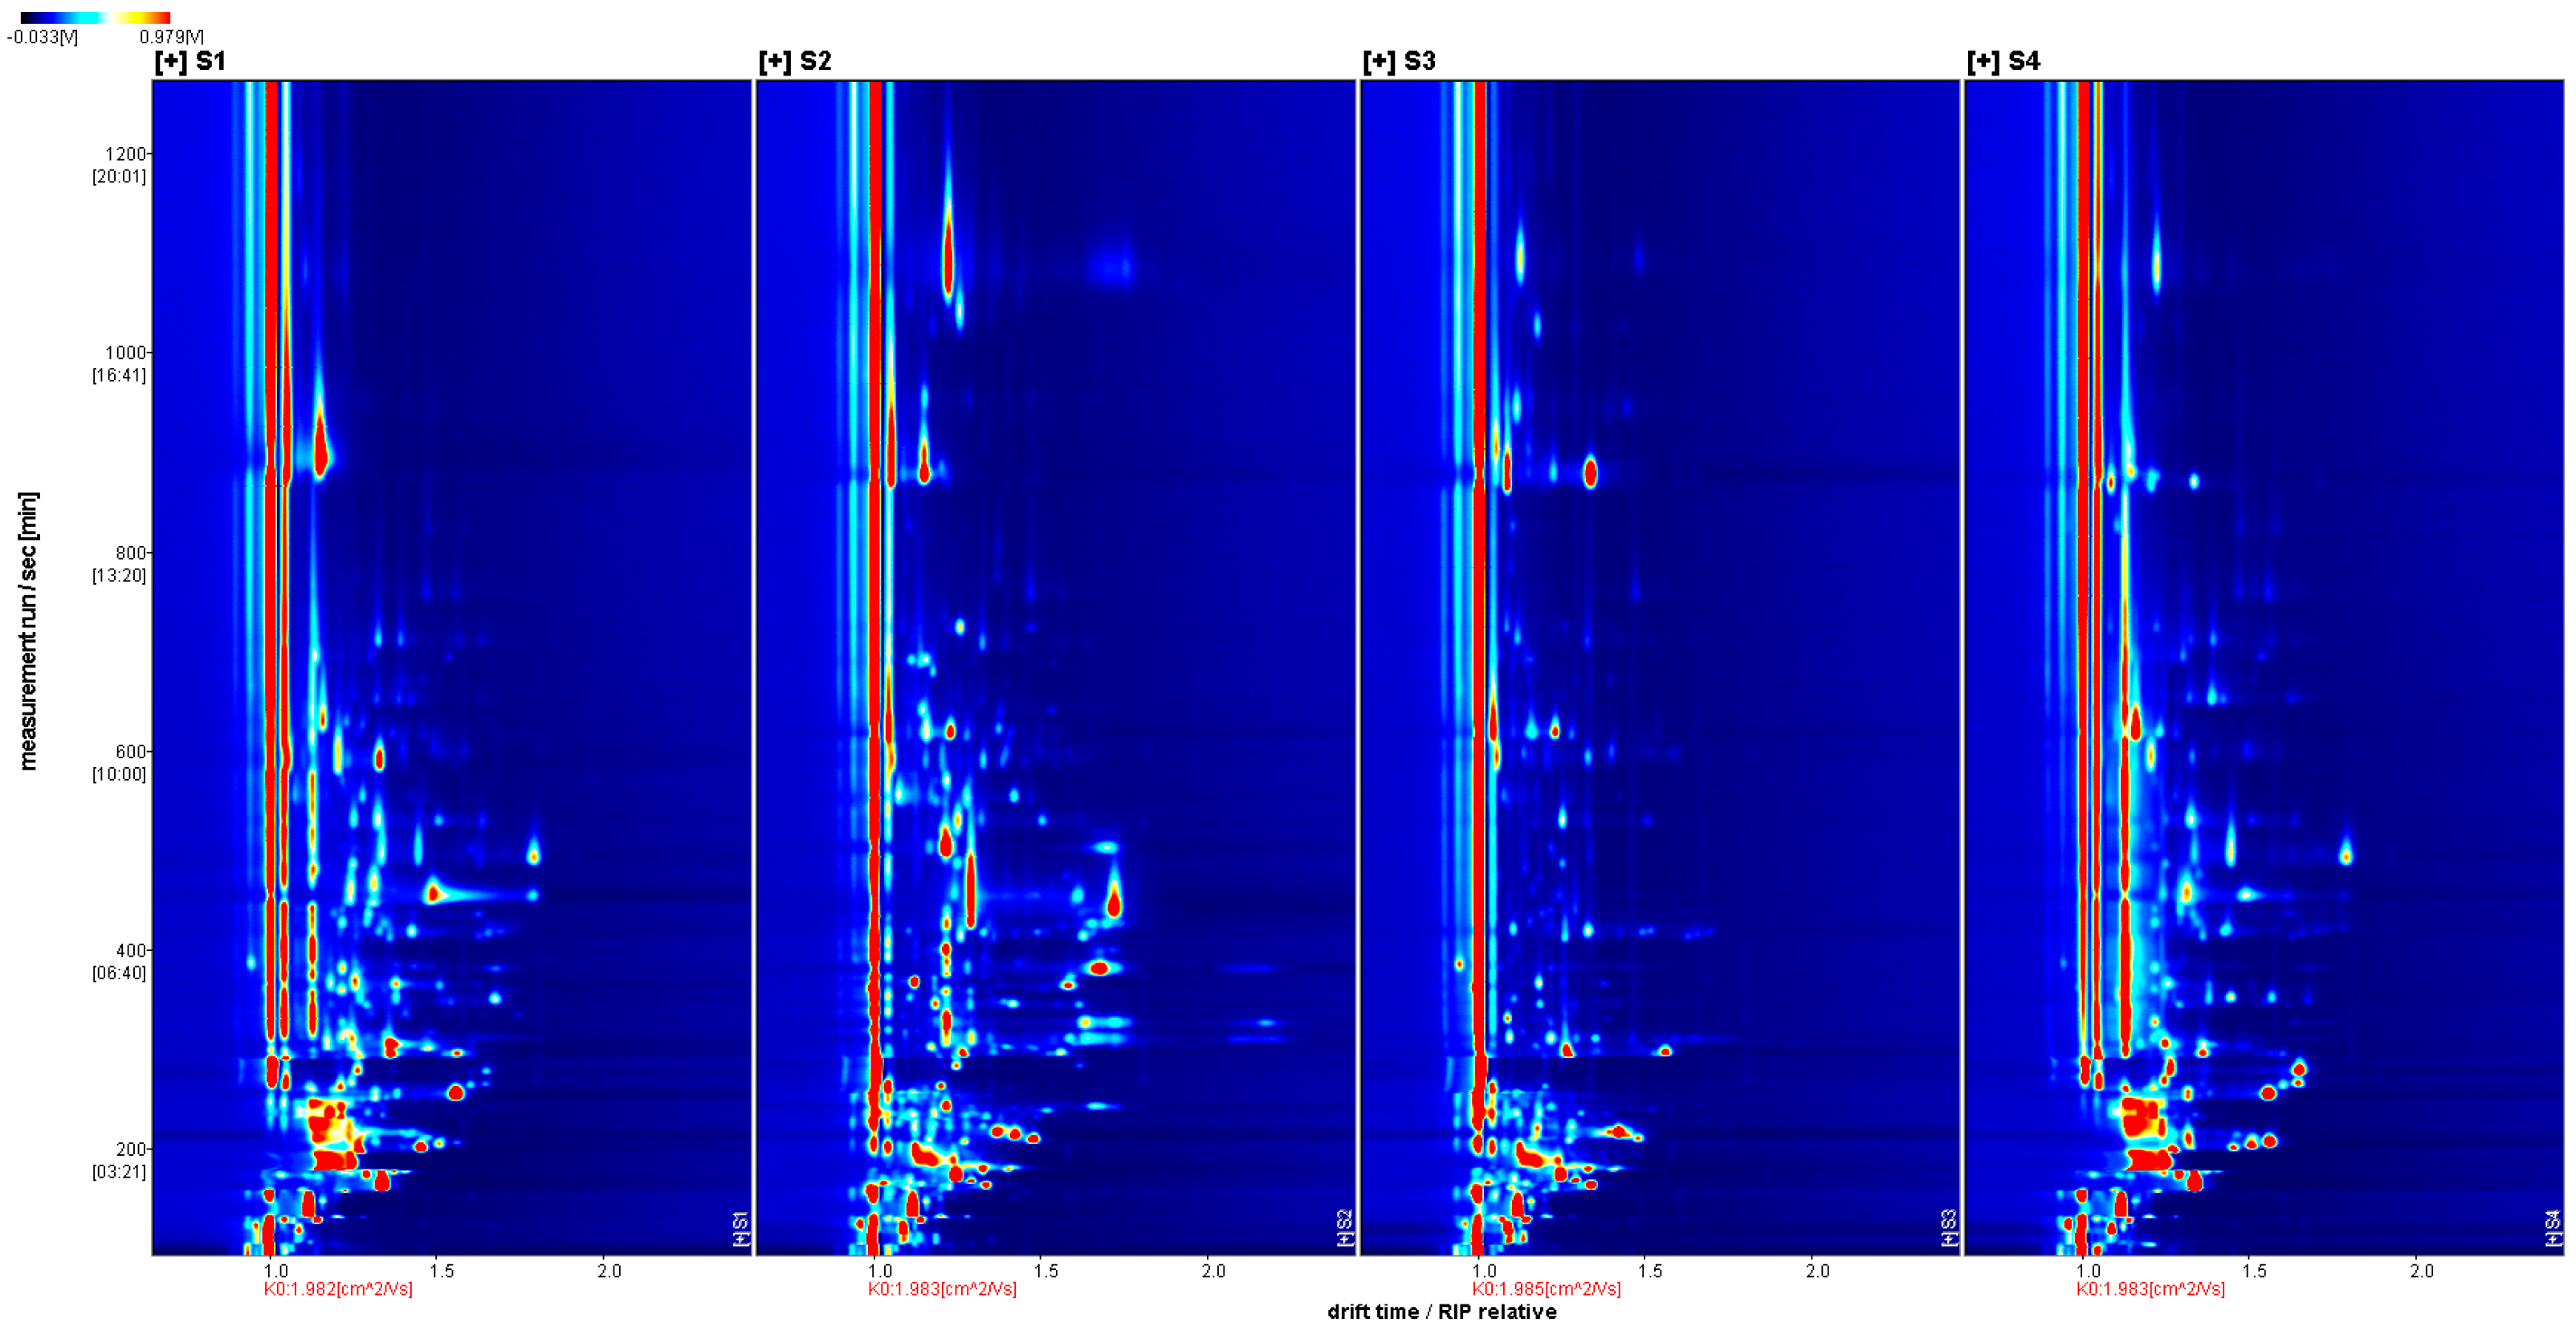
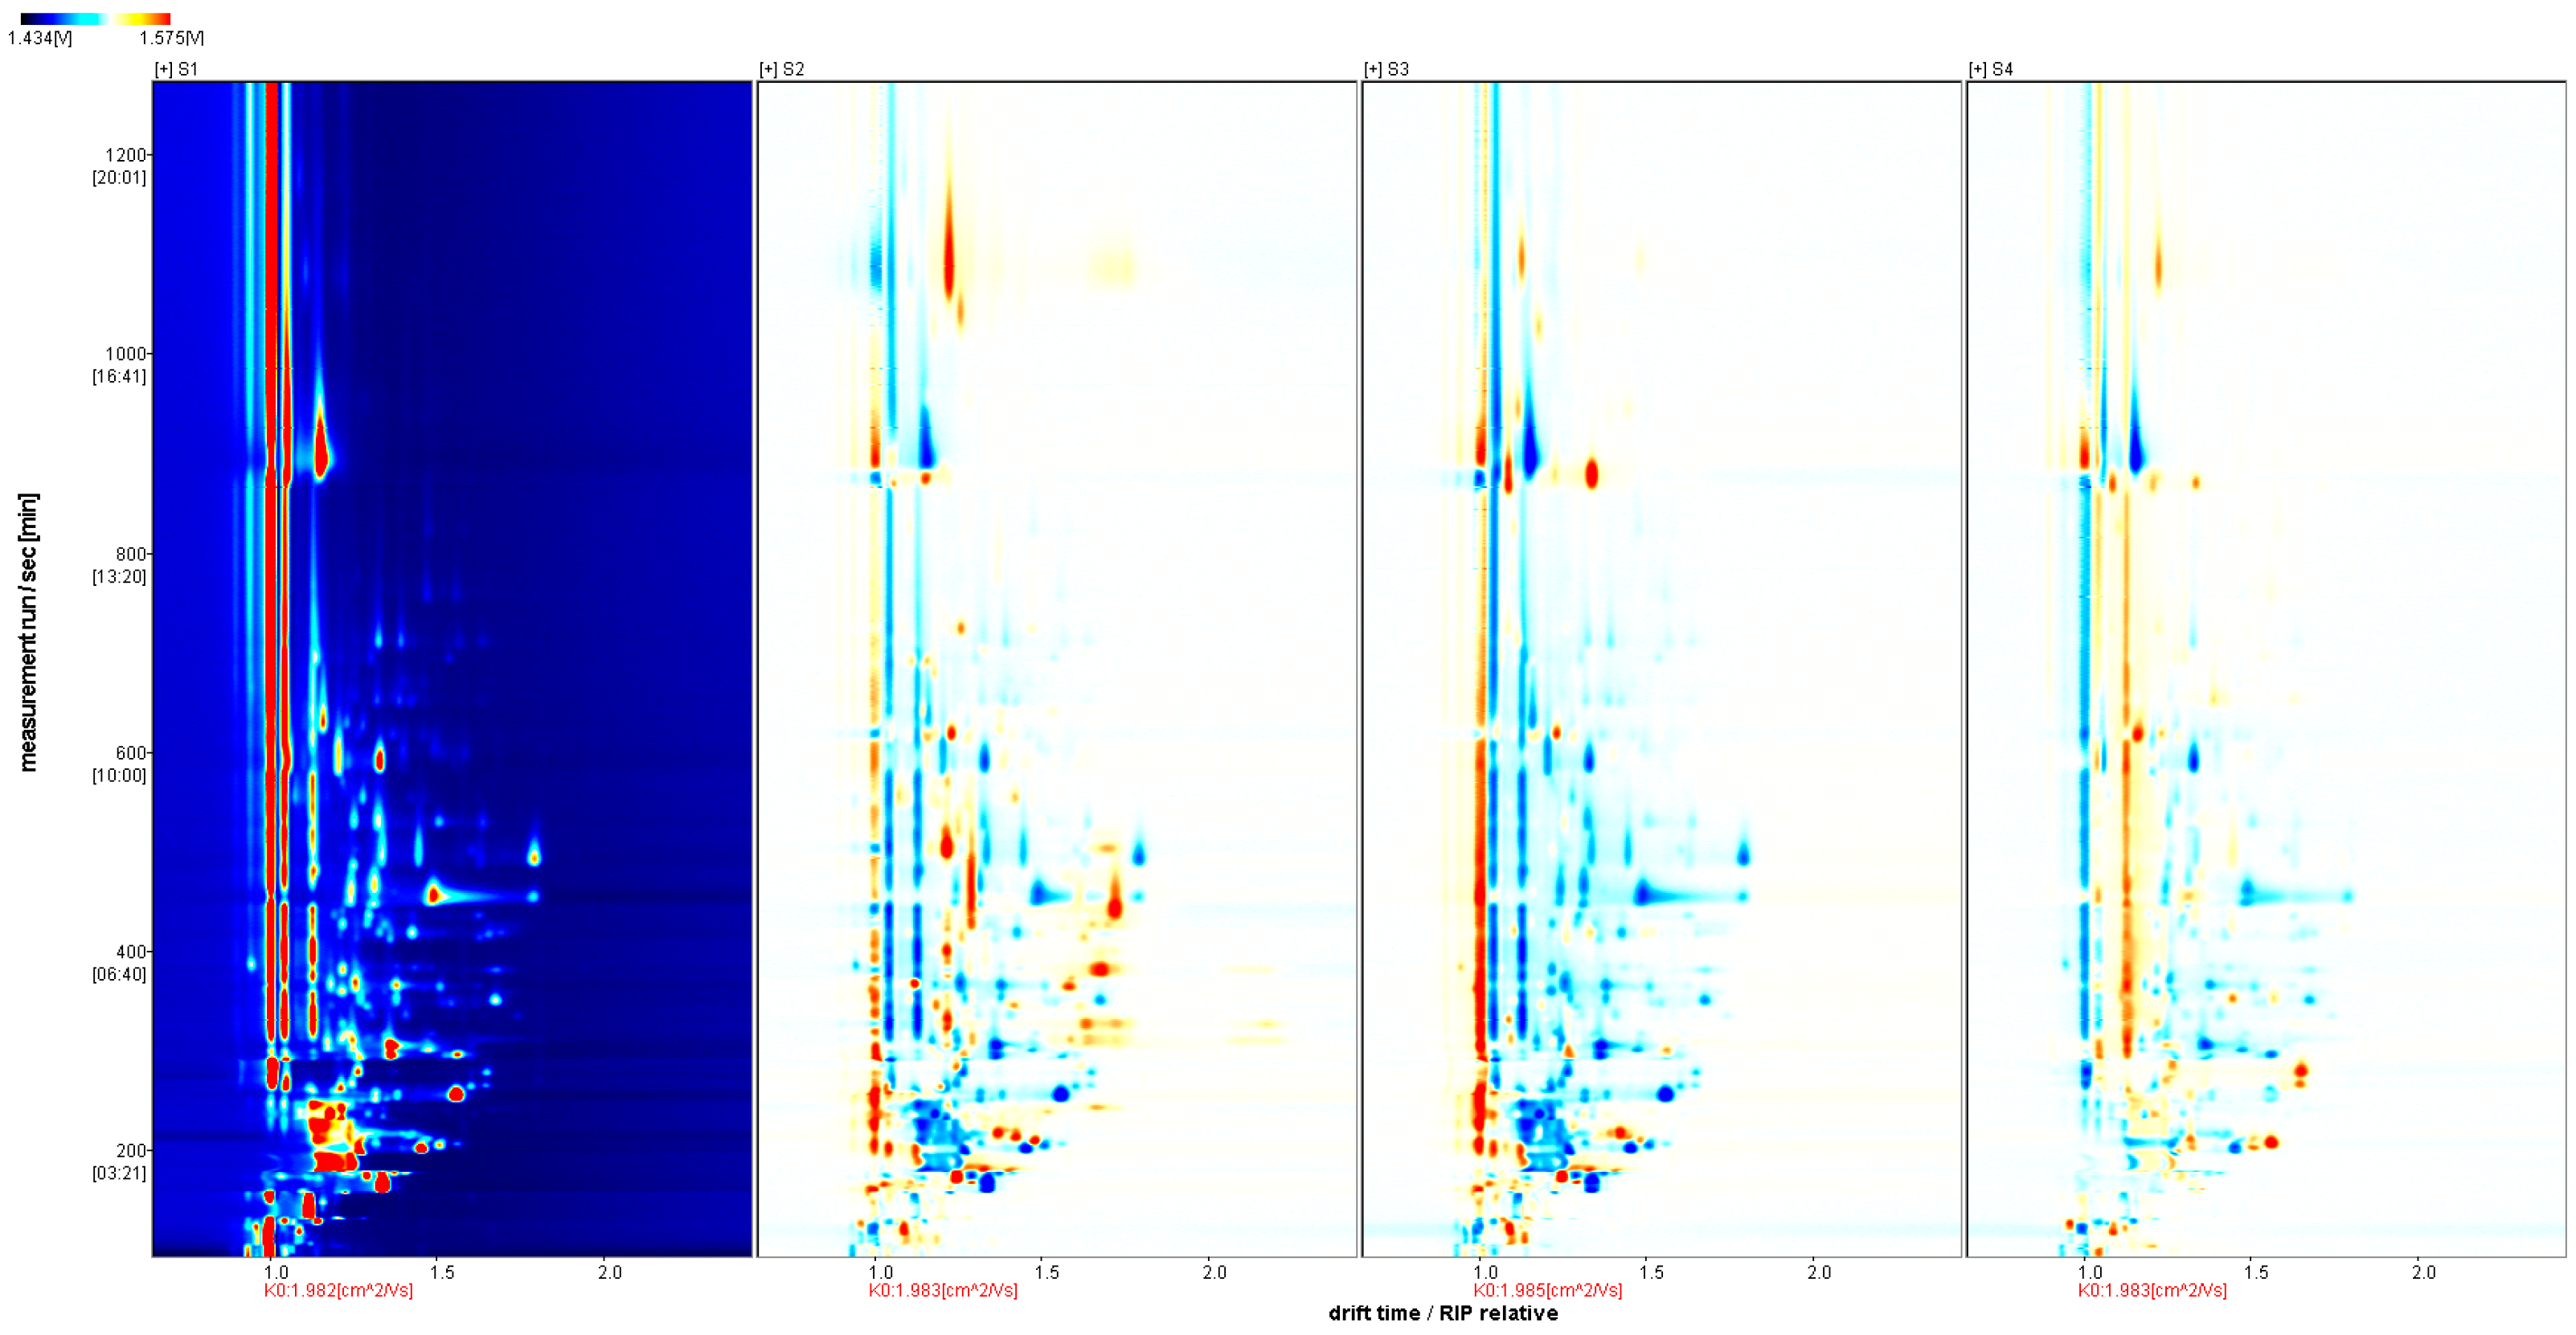
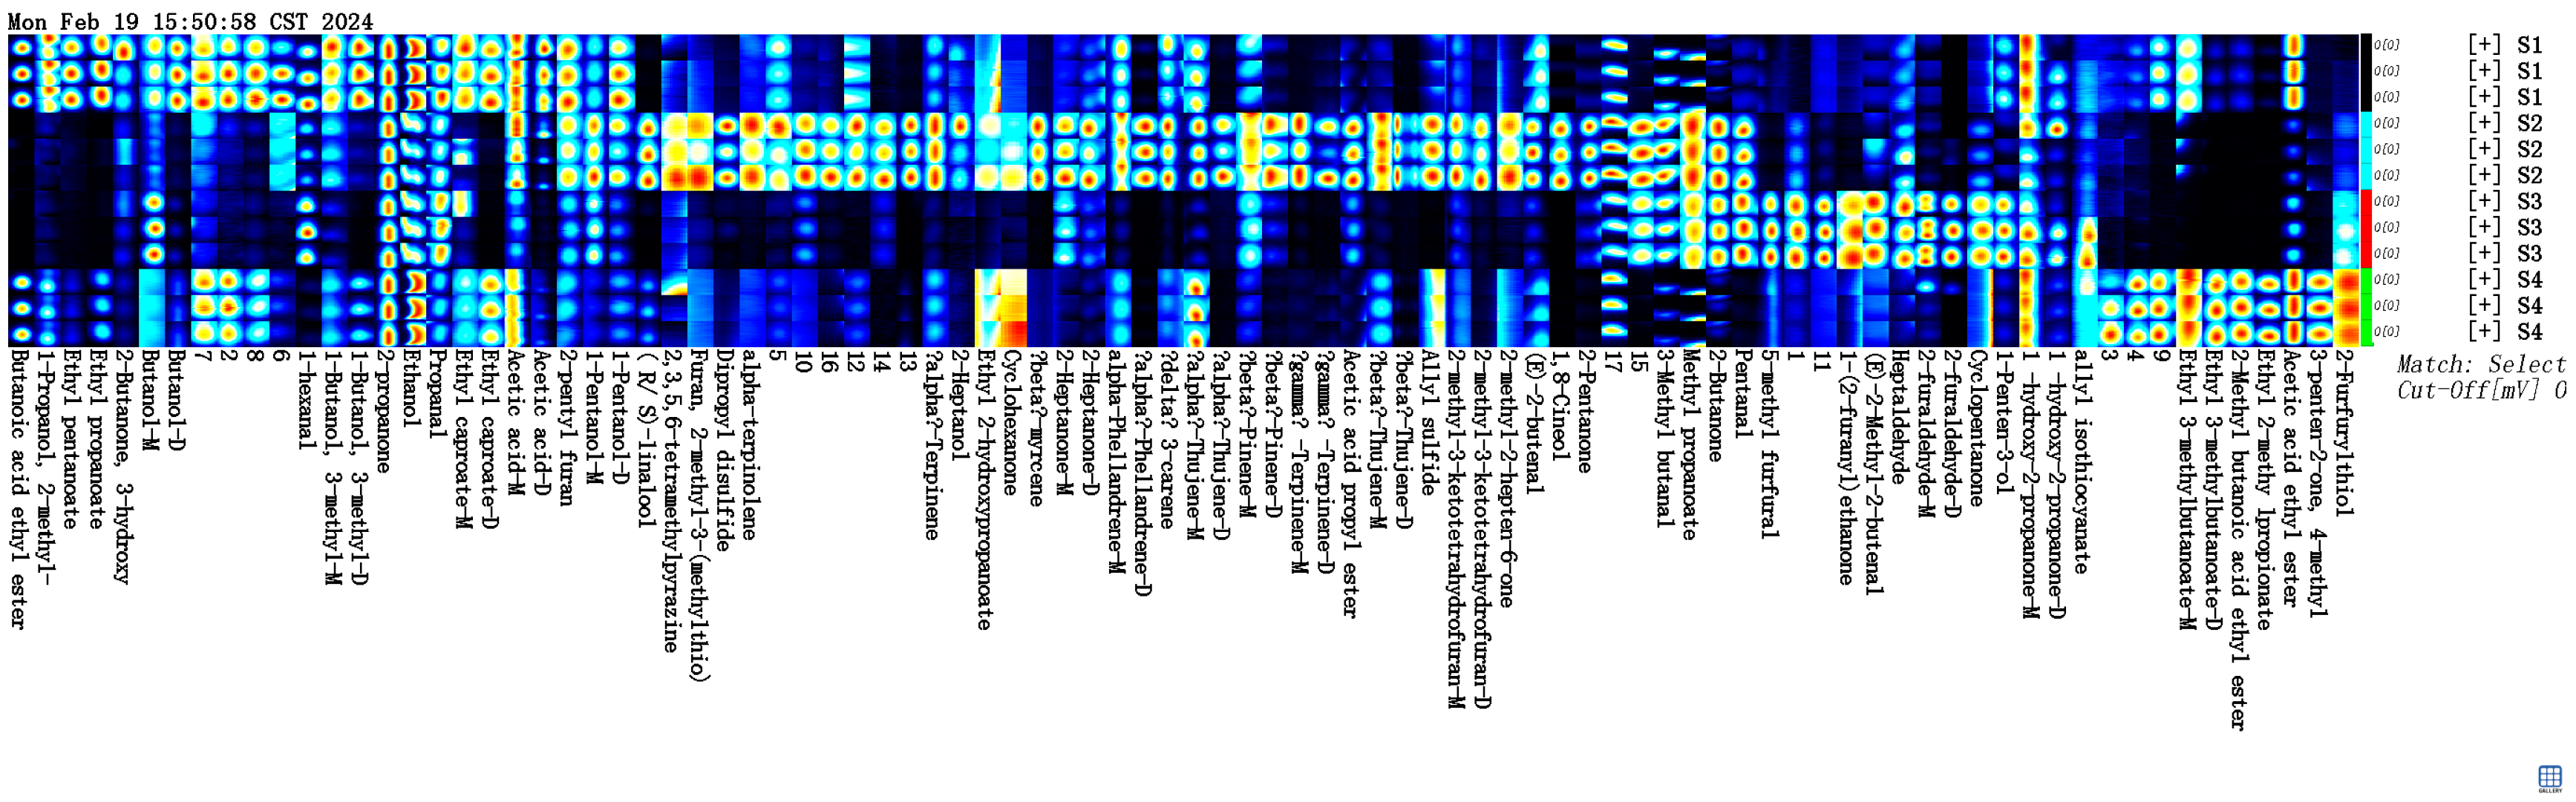
2.3. GC-IMS Analysis
2.3.1. Volatile Flavor Components in Four Types of Sausages
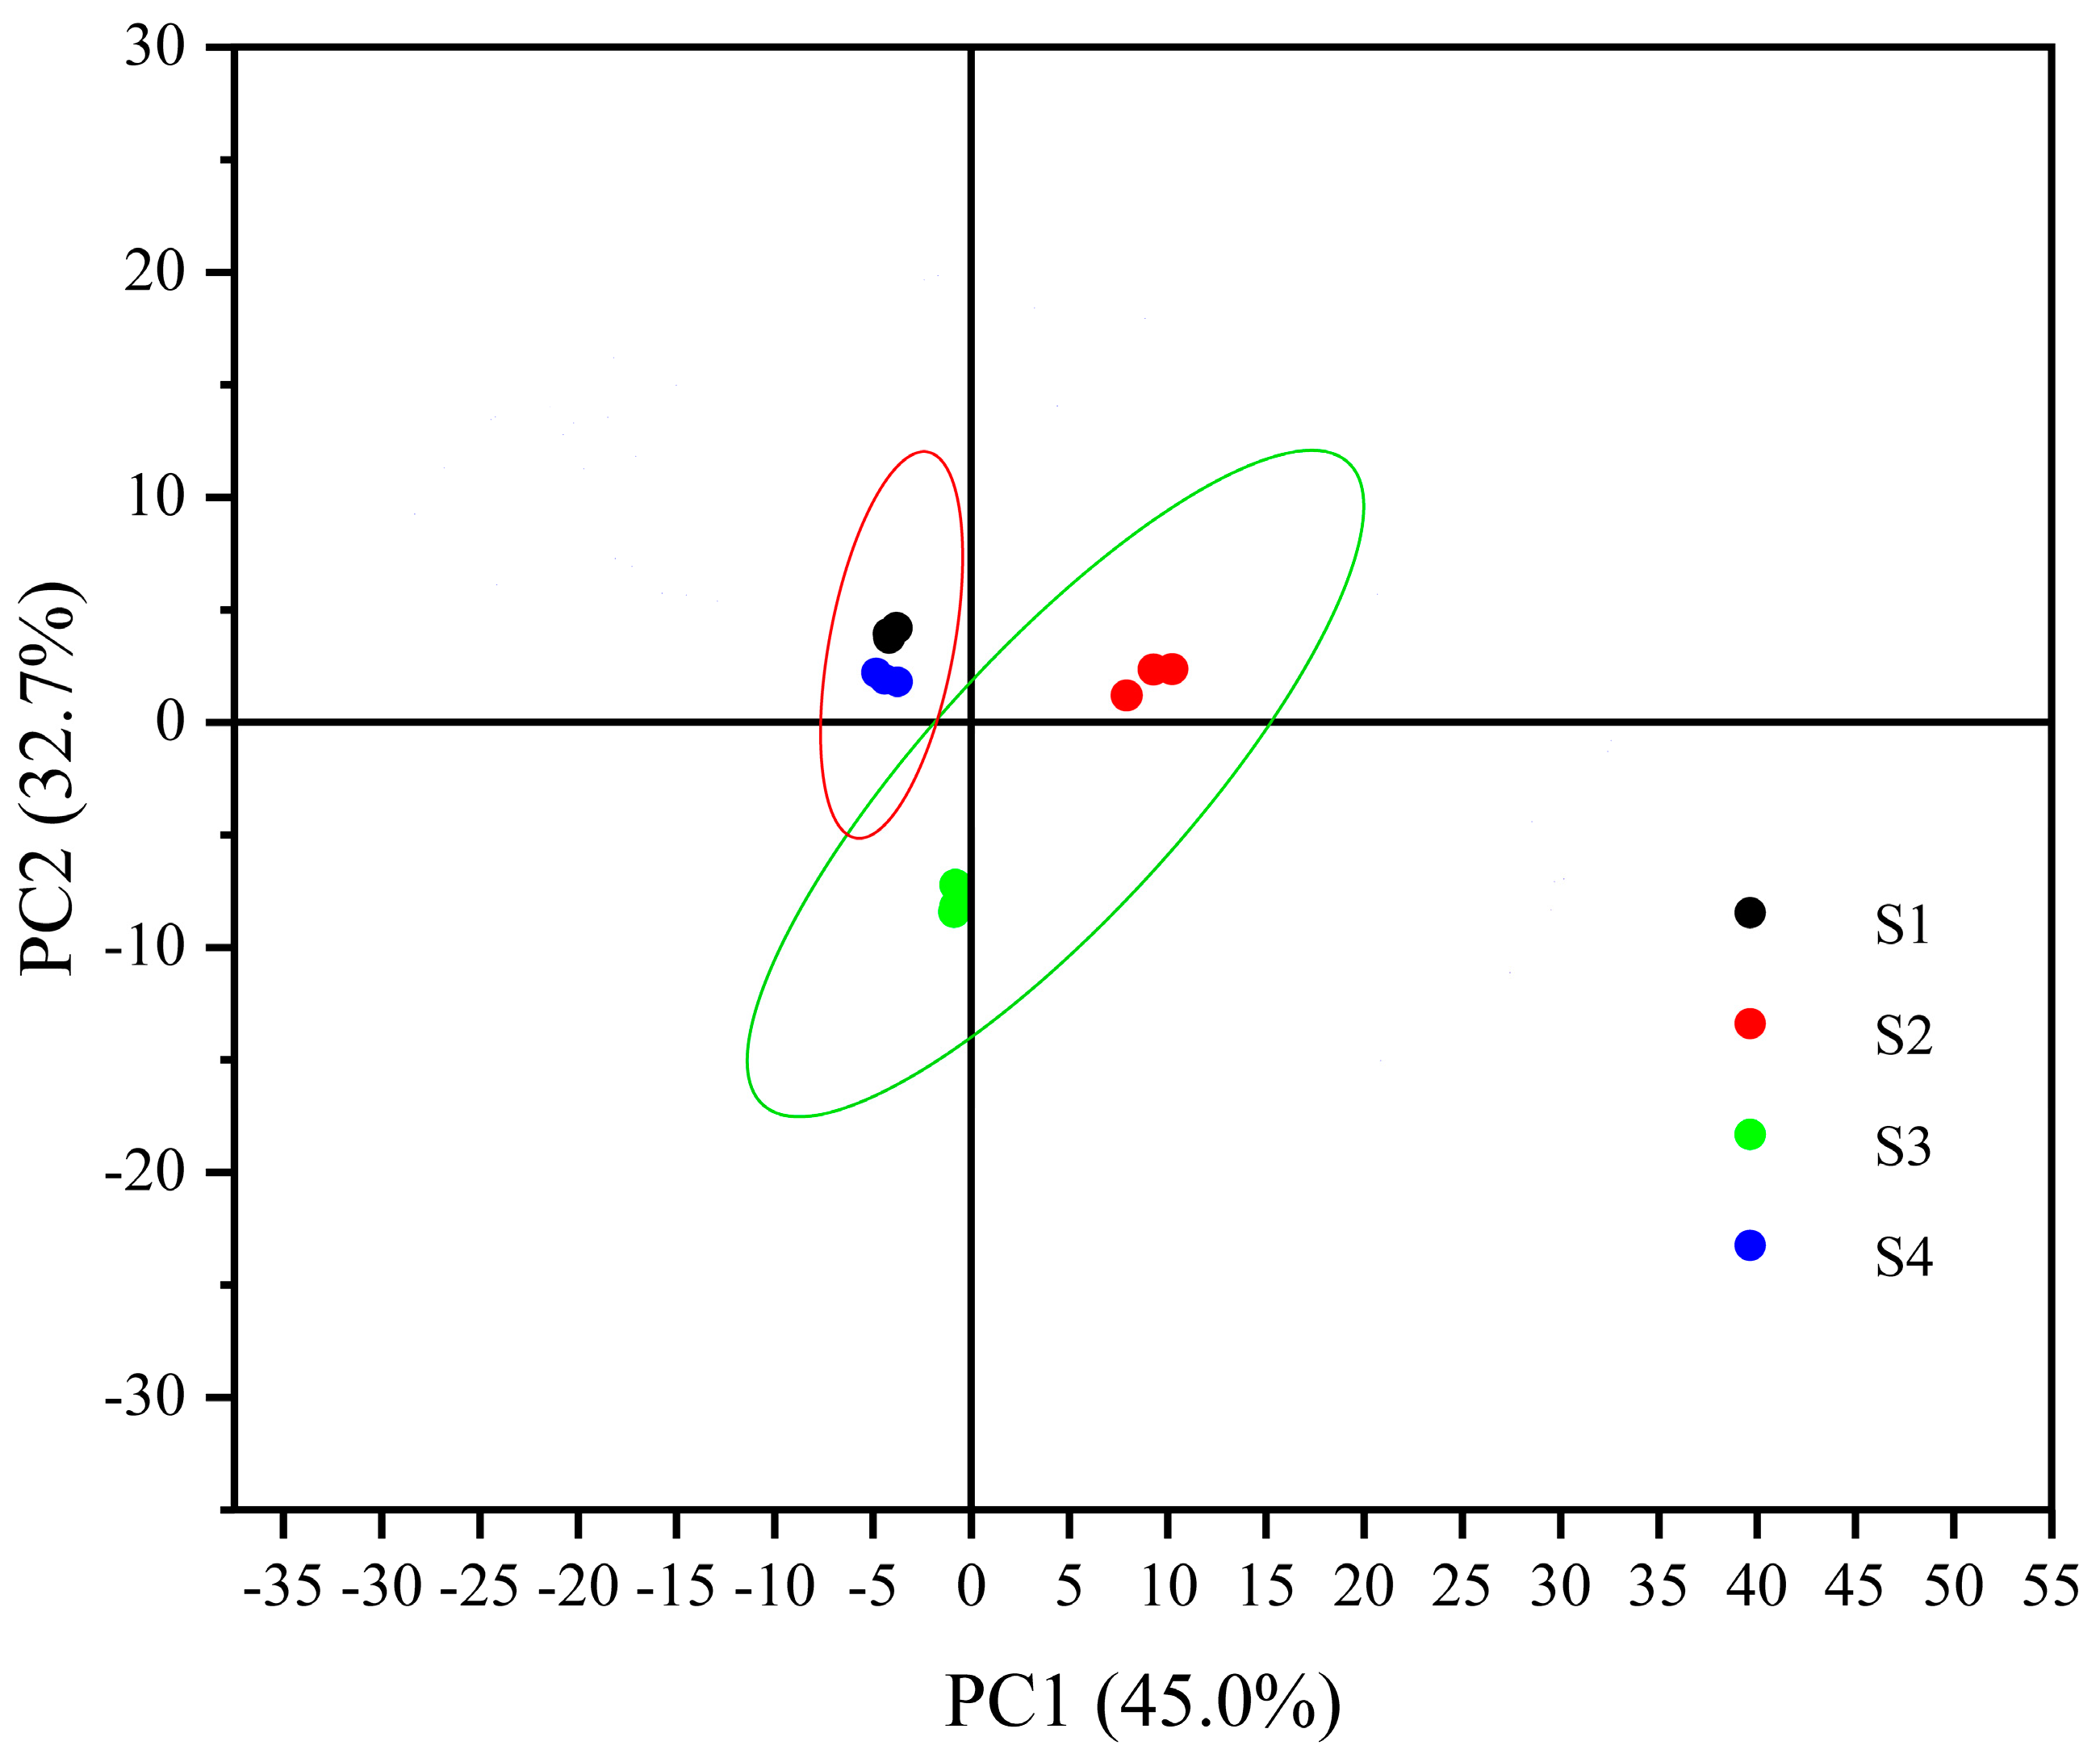
2.3.2. Results of Principal Component Analysis of Volatile Flavor Components in Four Types of Sausages
2.4. Sensory Analysis
3. Materials and Methods
3.1. Materials and Reagents
3.2. Instruments and Equipment
3.3. Experimental Methodology
3.3.1. Measurement of Texture
3.3.2. Measurement of Physical and Chemical Indicators
3.3.3. Measurement of Volatile Components
3.3.4. Sensory Evaluation
3.4. Statistical Analysis
4. Conclusions
Supplementary Materials
Author Contributions
Funding
Institutional Review Board Statement
Informed Consent Statement
Data Availability Statement
Conflicts of Interest
References
- Sirini, N.; Munekata, P.E.S.; Lorenzo, J.M.; Stegmayer, M.Á.; Pateiro, M.; Pérez-álvarez, J.Á.; Sepúlveda, N.; Sosa-Morales, M.E.; Teixeira, A.; Fernández-López, J.; et al. Development of healthier and functional dry fermented sausages: Present and future. Foods 2022, 11, 1128. [Google Scholar] [CrossRef] [PubMed]
- Wang, Z.; Wang, Z.; Ji, L.; Zhang, J.; Zhao, Z.; Zhang, R.; Bai, T.; Hou, B.; Zhang, Y.; Liu, D.; et al. A review: Microbial diversity and function of fermented meat products in china. Front. Microbiol. 2021, 12, 645435. [Google Scholar] [CrossRef] [PubMed]
- Carballo, J. Sausages: Nutrition, safety, processing and quality improvement. Foods 2021, 10, 890. [Google Scholar] [CrossRef] [PubMed]
- Bhuyan, D.; Das, A.; Laskar, S.K.; Bora, D.P.; Tamuli, S.; Hazarika, M. Effect of different smoking methods on the quality of pork sausages. Vet. World 2018, 11, 1712–1719. [Google Scholar] [CrossRef] [PubMed]
- Sangare, M.; Karoui, R. Evaluation and monitoring of the quality of sausages by different analytical techniques over the last five years. Crit. Rev. Food Sci. Nutr. 2023, 63, 8136–8160. [Google Scholar] [CrossRef]
- Zhu, N.; Zhang, S.; Zhao, B.; Wu, Q.; Zhou, H.; Li, S.; Qu, C.; Sun, A.; Qiao, X. Effect of processing on protein degradation and quality of emulsion sausages. Food Biosci. 2020, 37, 100685. [Google Scholar] [CrossRef]
- Poojary, M.M.; Lund, M.N. Chemical stability of proteins in foods: Oxidation and the maillard reaction. Annu. Rev. Food Sci. Technol. 2022, 13, 35–58. [Google Scholar] [CrossRef] [PubMed]
- Li, B.; Xu, Y.; Li, J.; Niu, S.; Wang, C.; Zhang, N.; Yang, M.; Zhou, K.; Chen, S.; He, L.; et al. Effect of oxidized lipids stored under different temperatures on muscle protein oxidation in sichuan-style sausages during ripening. Meat Sci. 2019, 147, 144–154. [Google Scholar] [CrossRef] [PubMed]
- Nawaz, A.; Irshad, S.; Ali Khan, I.; Khalifa, I.; Walayat, N.; Muhammad Aadil, R.; Kumar, M.; Wang, M.; Chen, F.; Cheng, K.; et al. Protein oxidation in muscle-based products: Effects on physicochemical properties, quality concerns, and challenges to food industry. Food Res. Int. 2022, 157, 111322. [Google Scholar] [CrossRef]
- Hu, Y.; Li, Y.; Zhu, J.; Kong, B.; Liu, Q.; Chen, Q. Improving the taste profile of reduced-salt dry sausage by inoculating different lactic acid bacteria. Food Res. Int. 2021, 145, 110391. [Google Scholar] [CrossRef] [PubMed]
- Serikkyzy, M.; Jumabekova, G.; Zheldybayeva, A.; Matibayeva, A.; Omirbay, R.; Balev, D. Improving the organoleptic and structural-chemical properties of semi-smoked sausages. Saudi J. Biol. Sci. 2022, 29, 1510–1514. [Google Scholar] [CrossRef] [PubMed]
- Stajić, S.; Stanišić, N.; Tomasevic, I.; Djekic, I.; Ivanović, N.; Živković, D. Use of linseed oil in improving the quality of chicken frankfurters. J. Food Process. Pres. 2017, 42, e13529. [Google Scholar] [CrossRef]
- Hu, H.; Li, Y.; Zhang, L.; Tu, H.; Wang, X.; Ren, L.; Dai, S.; Wang, L. Use of tremella as fat substitute for the enhancement of physicochemical and sensory profiles of pork sausage. Foods 2021, 10, 2167. [Google Scholar] [CrossRef] [PubMed]
- Wang, S.; Chen, H.; Sun, B. Recent progress in food flavor analysis using gas chromatography-ion mobility spectrometry (GC-IMS). Food Chem. 2020, 315, 126158. [Google Scholar] [CrossRef] [PubMed]
- Saldaña, E.; Merlo, T.C.; Patinho, I.; Rios-Mera, J.D.; Contreras-Castillo, C.J.; Selani, M.M. Use of sensory science for the development of healthier processed meat products: A critical opinion. Curr. Opin. Food Sci. 2021, 40, 13–19. [Google Scholar] [CrossRef]
- Da, D.; Nian, Y.; Zou, B.; Zhao, D.; Zhang, Z.; Li, C. Influence of induction cooking on the flavor of fat cover of braised pork belly. J. Food Sci. 2021, 86, 1997–2010. [Google Scholar] [CrossRef] [PubMed]
- Li, Y.; Li, C.; Li, H.; Lin, X.; Deng, S.; Zhou, G. Physicochemical and fatty acid characteristics of stewed pork as affected by cooking method and time. Int. J. Food Sci. Technol. 2016, 51, 359–369. [Google Scholar] [CrossRef]
- Zhang, J.; Zhang, M.; Chen, K.; Bhandari, B.; Deng, D. Impact of cooking methods on the quality, sensory and flavor compounds of sichuan pepper oleoresin. Food Chem. 2023, 427, 136639. [Google Scholar] [CrossRef] [PubMed]
- Ding, X.; Wang, G.; Zou, Y.; Zhao, Y.; Ge, C.; Liao, G. Evaluation of small molecular metabolites and sensory properties of xuanwei ham salted with partial replacement of nacl by kcl. Meat Sci. 2021, 175, 108465. [Google Scholar] [CrossRef]
- He, Z.; Zhang, Y.; Yang, M.; Zhang, Y.; Cui, Y.; Du, M.; Zhao, D.; Sun, H. Effect of different sweeteners on the quality, fatty acid and volatile flavor compounds of braised pork. Front. Nutr. 2022, 9, 961998. [Google Scholar] [CrossRef]
- Zhang, K.; Lin, Y.; Diao, Z.J.; Zhang, W.H.; Zheng, S.P.; Liang, S.L.; Han, S.Y. Enzymatic process enhances the flavour profile and increases the proportion of esters in citrus essential oils. Chem. Biodivers. 2017, 14, e1700187. [Google Scholar] [CrossRef] [PubMed]
- Chen, Y.; Yao, X.; Sun, J.; Ma, A. Effects of different high temperature-pressure processing times on the sensory quality, nutrition and allergenicity of ready-to-eat clam meat. Food Res. Int. 2024, 185, 114263. [Google Scholar] [CrossRef] [PubMed]
- Fang, Z.; Li, G.; Gu, Y.; Wen, C.; Ye, H.; Ma, J.; Liang, Z.; Yang, L.; Wu, J.; Chen, H. Flavour analysis of different varieties of camellia seed oil and the effect of the refining process on flavour substances. LWT 2022, 170, 114040. [Google Scholar] [CrossRef]
- Shahidi, F.; Hossain, A. Role of lipids in food flavor generation. Molecules 2022, 27, 5014. [Google Scholar] [CrossRef] [PubMed]
- Jiang, H.; Zhang, M.; Ye, J.; Qian, M.; Li, X.; Zhao, W.; Bai, W. HS-SPME-GC-MS and OAV analyses of characteristic volatile flavour compounds in salt-baked drumstick. LWT 2022, 170, 114041. [Google Scholar] [CrossRef]
- Guo, X.; Wang, Y.; Lu, S.; Wang, J.; Fu, H.; Gu, B.; Lyu, B.; Wang, Q. Changes in proteolysis, protein oxidation, flavor, color and texture of dry-cured mutton ham during storage. LWT 2021, 149, 111860. [Google Scholar] [CrossRef]
- Cui, Z.; Wang, Z.; Zheng, M.; Chen, T. Advances in biological production of acetoin: A comprehensive overview. Crit. Rev. Biotechnol. 2022, 42, 1135–1156. [Google Scholar] [CrossRef]
- Xiao, Z.; Lu, J.R. Generation of acetoin and its derivatives in foods. J. Agric. Food Chem. 2014, 62, 6487–6497. [Google Scholar] [CrossRef]
- Cesselin, B.; Henry, C.; Gruss, A.; Gloux, K.; Gaudu, P.; Björkroth, J. Mechanisms of acetoin toxicity and adaptive responses in an acetoin-producing species, lactococcus lactis. Appl. Environ. Microb. 2021, 87, e107921. [Google Scholar] [CrossRef]
- Wang, D.; Deng, L.; Cai, H.; Yang, J.; Bao, L.; Zhu, Y.; Wang, X. Bimetallic PtCu Nanocrystal Sensitization WO3 Hollow Spheres for Highly Efficient 3-Hydroxy-2-butanone Biomarker Detection. ACS Appl. Mater. Interfaces 2020, 12, 18904–18912. [Google Scholar] [CrossRef]
- Shang, A.; Cao, S.; Xu, X.; Gan, R.; Tang, G.; Corke, H.; Mavumengwana, V.; Li, H. Bioactive compounds and biological functions of garlic (Allium sativum L.). Foods 2019, 8, 246. [Google Scholar] [CrossRef]
- Díaz, M.G.; Vega Hissi, E.G.; Andrada, M.F.; Garro Martinez, J.C. Scavenging of hydrogen peroxide by allyl methyl sulfide and diallyl sulfide, two garlic active compounds: A theoretical study. ChemistrySelect 2020, 5, 3234–3242. [Google Scholar] [CrossRef]
- Feng, C.H.; Li, C.; García Martín, J.F.; Malakar, P.K.; Yan, Y.; Liu, Y.W.; Wang, W.; Liu, Y.T.; Yang, Y. Physical properties and volatile composition changes of cooked sausages stuffed in a new casing formulation based in surfactants and lactic acid during long-term storage. J. Food Sci. 2017, 82, 594–604. [Google Scholar] [CrossRef]
- Duma-Kocan, P.; Rudy, M.; Gil, M.; Stanisławczyk, R. The influence of temperature differences in smoking chamber and furnace and smoking time on the quality of medium-ground sausages. Molecules 2020, 25, 5515. [Google Scholar] [CrossRef]
- Yin, X.; Chen, Q.; Liu, Q.; Wang, Y.; Kong, B. Influences of smoking in traditional and industrial conditions on flavour profile of harbin red sausages by comprehensive two-dimensional gas chromatography mass spectrometry. Foods 2021, 10, 1180. [Google Scholar] [CrossRef]
- Sherpa, K.; Priyadarshini, M.B.; Mehta, N.K.; Vaishnav, A.; Singh, N.S.; Pati, B.K. Shelf-stability of kiln- and liquid-smoked inulin-fortified emulsion-typepangasius mince sausage at refrigerated temperature. ACS Omega 2023, 8, 34431–34441. [Google Scholar] [CrossRef]
- Chinese National Standard GH/T 1291-2020[S]; The People’s Republic of China Supply and Marketing Cooperation Industry Standards: Prickly Ash and Its Processed Products—Determination of Total Fagaramide—High Performance Liquid Chromatography. China General Supply and Marketing Cooperation: Beijing, China, 2020. (In Chinese)
- Chinese National Standard GBT21266-2007dz[S]; National Standard of the People’s Republic of China: Determination of Total Capsaicinoid Content Andrepresentation of Pungency Degree in Capsicum and Its Products. Standards Press of China: Beijing, China, 2008. (In Chinese)
- Chinese National Standard GB5009.44-2016[S]; National Standard of the People’s Republic of China: Determination of Chlorides in Foods. Standards Press of China: Beijing, China, 2017. (In Chinese)
- Chinese National Standard GB5009.8-2023[S]; National Standard of the People’s Republic of China: Determination of Fructose, Glucose, Sucrose, Maltose Lactose in Foods. Standards Press of China: Beijing, China, 2014. (In Chinese)
- Chinese National Standard GB5009.6-2016[S]; National Standard of the People’s Republic of China: Determination of Fat in Foods. Standards Press of China: Beijing, China, 2017. (In Chinese)
- Xu, N.; Lai, Y.; Shao, X.; Zeng, X.; Wang, P.; Han, M.; Xu, X. Different analysis of flavors among soft-boiled chicken: Based on gc-ims and plsda. Food Biosci. 2023, 56, 103243. [Google Scholar] [CrossRef]
- Zheng, Z.; Tian, M.; Liao, G.; Chen, G.; Zhong, Y.; Yang, Y.; Wang, G. Evaluation of the effects of compound curing agents on the lipid profiles and volatile flavors in nuodeng ham based on lipidomics and gc-ims analysis. Food Res. Int. 2024, 176, 113810. [Google Scholar] [CrossRef]

| Number of Individuals | Type | S1 | S2 | S3 | S4 |
|---|---|---|---|---|---|
| 12 | Hydrocarbons | 4.66 ± 1.05 b | 24.09 ± 1.6 a | 3.75 ± 1.78 b | 6.58 ± 2.23 b |
| 11 | Alcohols | 21.69 ± 0.22 a | 11.67 ± 0.12 d | 16.92 ± 0.35 c | 18.92 ± 0.25 b |
| 10 | Ketones | 21.89 ± 0.24 d | 28.03 ± 0.2 b | 34.33 ± 0.85 a | 23.9 ± 0.17 c |
| 9 | Aldehydes | 5.88 ± 0.46 bc | 7.67 ± 0.96 b | 31.45 ± 1.31 a | 5.36 ± 1.55 c |
| 12 | Esters | 21.39 ± 0.4 b | 5.43 ± 0.82 d | 6.81 ± 0.78 c | 29.29 ± 0.67 a |
| 1 | Acids | 23.09 ± 0.34 a | 13.42 ± 2.92 b | 6.19 ± 1.04 c | 14.58 ± 1.17 b |
| 10 | Others | 1.81 ± 0.03 c | 10.45 ± 0.87 a | 1.79 ± 0.16 c | 2.84 ± 0.06 b |
| Count | Compound | Type | CAS# | Formula | MW | RI | Rt [s] | S1 | S2 | S3 | S4 |
|---|---|---|---|---|---|---|---|---|---|---|---|
| 1 | Alpha-terpinolene | Hydrocarbons | C586629 | C10H16 | 136.2 | 1276.9 | 570.964 | 0.05 ± 0.01 b | 0.2 ± 0.02 a | 0.02 ± 0 b | 0.03 ± 0 b |
| 2 | Alpha-Terpinene | Hydrocarbons | C99865 | C10H16 | 136.2 | 1191.2 | 427.41 | 0.33 ± 0.06 b | 0.97 ± 0.04 a | 0.19 ± 0.01 c | 0.31 ± 0 b |
| 3 | Alpha-Phellandrene-M | Hydrocarbons | C99832 | C10H16 | 136.2 | 1161.2 | 384.025 | 0.49 ± 0.09 b | 0.83 ± 0.05 a | 0.17 ± 0.01 d | 0.3 ± 0.01 c |
| 4 | Beta-Thujene-M | Hydrocarbons | C28634891 | C10H16 | 136.2 | 1119 | 330.28 | 0.18 ± 0.03 c | 1.36 ± 0.14 a | 0.21 ± 0.01 c | 0.67 ± 0.05 b |
| 5 | Gamma -Terpinene-M | Hydrocarbons | C99854 | C10H16 | 136.2 | 1238.7 | 501.954 | 0.1 ± 0.01 b | 4.3 ± 0.53 a | 0.31 ± 0 b | 0.23 ± 0.01 b |
| 6 | Beta-myrcene | Hydrocarbons | C123353 | C10H16 | 136.2 | 1174.1 | 402.085 | 0.09 ± 0 bc | 1.63 ± 0.04 a | 0.07 ± 0 c | 0.13 ± 0.01 b |
| 7 | Alpha-Phellandrene-D | Hydrocarbons | C99832 | C10H16 | 136.2 | 1159.6 | 381.806 | 0.22 ± 0.06 b | 3.87 ± 0.12 a | 0.08 ± 0 b | 0.12 ± 0.01 b |
| 8 | Delta 3-carene | Hydrocarbons | C13466789 | C10H16 | 136.2 | 1142.4 | 359.143 | 0.48 ± 0.07 b | 0.67 ± 0.04 a | 0.1 ± 0 d | 0.27 ± 0 c |
| 9 | Beta-Thujene-D | Hydrocarbons | C28634891 | C10H16 | 136.2 | 1117.8 | 328.845 | 0.12 ± 0.03 b | 2.21 ± 0.11 a | 0.17 ± 0.01 b | 0.27 ± 0.03 b |
| 10 | Beta-Pinene-M | Hydrocarbons | C127913 | C10H16 | 136.2 | 1104.2 | 313.338 | 0.2 ± 0.02 c | 0.24 ± 0.03 b | 0.36 ± 0 a | 0.11 ± 0.01 d |
| 11 | Alpha-Thujene-M | Hydrocarbons | C2867052 | C10H16 | 136.2 | 1025.1 | 243.986 | 1.71 ± 0.03 b | 1.57 ± 0.1 c | 0.51 ± 0.03 d | 2.27 ± 0.01 a |
| 12 | Alpha-Thujene-D | Hydrocarbons | C2867052 | C10H16 | 136.2 | 1026.3 | 244.899 | 0.05 ± 0.01 b | 0.69 ± 0.16 a | 0.07 ± 0.01 b | 0.04 ± 0 b |
| 13 | Gamma -Terpinene-D | Hydrocarbons | C99854 | C10H16 | 136.2 | 1240.6 | 505.13 | 0.16 ± 0 b | 1.06 ± 0.41 a | 0.13 ± 0.01 b | 0.19 ± 0.01 b |
| 14 | Beta-Pinene-D | Hydrocarbons | C127913 | C10H16 | 136.2 | 1103.3 | 312.283 | 0.14 ± 0.03 c | 1.04 ± 0.08 a | 0.34 ± 0 b | 0.09 ± 0.01 c |
| 15 | 5-methyl furfural | Aldehydes | C620020 | C6H6O2 | 110.1 | 1557.3 | 1092.06 | 0.47 ± 0.02 c | 0.24 ± 0.02 c | 3.88 ± 0.24 a | 1.29 ± 0.09 b |
| 16 | 2-furaldehyde-M | Aldehydes | C98011 | C5H4O2 | 96.1 | 1457.8 | 873.816 | 0.83 ± 0.05 b | 0.58 ± 0.06 b | 7.34 ± 0.48 a | 1.09 ± 0.64 b |
| 17 | 2-furaldehyde-D | Aldehydes | C98011 | C5H4O2 | 96.1 | 1459.8 | 877.84 | 0.1 ± 0.02 b | 0.39 ± 0.33 b | 9.19 ± 0.54 a | 0.45 ± 0.48 b |
| 18 | Heptaldehyde | Aldehydes | C111717 | C7H14O | 114.2 | 1186.6 | 420.523 | 0.22 ± 0.02 bc | 0.3 ± 0.07 b | 1.02 ± 0.08 a | 0.17 ± 0 c |
| 19 | (E)-2-Methyl-2-butenal | Aldehydes | C497030 | C5H8O | 84.1 | 1104.2 | 313.331 | 0.07 ± 0 b | 0.11 ± 0.05 b | 0.55 ± 0.02 a | 0.09 ± 0 b |
| 20 | 1-hexanal | Aldehydes | C66251 | C6H12O | 100.2 | 1089.5 | 298.339 | 1.25 ± 0.22 b | 0.62 ± 0.01 d | 2.08 ± 0.21 a | 0.22 ± 0.01 c |
| 21 | Propanal | Aldehydes | C123386 | C3H6O | 58.1 | 779.5 | 130.377 | 1.3 ± 0.12 b | 1.02 ± 0.05 c | 2.27 ± 0.04 a | 0.86 ± 0.01 d |
| 22 | 3-Methyl butanal | Aldehydes | C590863 | C5H10O | 86.1 | 910.4 | 180.27 | 0.21 ± 0.02 b | 0.62 ± 0.04 a | 0.68 ± 0.05 a | 0.13 ± 0.01 c |
| 23 | Pentanal | Aldehydes | C110623 | C5H10O | 86.1 | 983 | 215.754 | 0.55 ± 0.02 c | 2.07 ± 0.08 b | 3.9 ± 0.05 a | 0.21 ± 0.01 d |
| 24 | (E)-2-butenal | Aldehydes | C123739 | C4H6O | 70.1 | 1050.9 | 264.437 | 0.87 ± 0.02 a | 0.83 ± 0.1 a | 0.36 ± 0.03 c | 0.62 ± 0 b |
| 25 | Linalool | Alcohols | C78706 | C10H18O | 154.3 | 1555.7 | 1087.981 | 0.36 ± 0.07 c | 11.75 ± 0.75 a | 0.62 ± 0.28 c | 4.32 ± 0.29 b |
| 26 | 2-Heptanol | Alcohols | C543497 | C7H16O | 116.2 | 1306.1 | 622.241 | 0.1 ± 0.02 b | 0.18 ± 0.06 a | 0.06 ± 0.01 b | 0.04 ± 0 b |
| 27 | 1-Pentanol-M | Alcohols | C71410 | C5H12O | 88.1 | 1255.8 | 531.728 | 0.72 ± 0.02 c | 1.22 ± 0.09 b | 1.4 ± 0.02 a | 0.43 ± 0.01 d |
| 28 | 1-Pentanol-D | Alcohols | C71410 | C5H12O | 88.1 | 1256.2 | 532.43 | 0.39 ± 0.05 a | 0.29 ± 0.04 b | 0.2 ± 0.01 c | 0.19 ± 0.02 c |
| 29 | 1-Butanol, 3-methyl-M | Alcohols | C123513 | C5H12O | 88.1 | 1211.2 | 457.353 | 1.11 ± 0.1 a | 0.42 ± 0.01 c | 0.36 ± 0.03 c | 0.68 ± 0.01b |
| 30 | 1-Butanol, 3-methyl-D | Alcohols | C123513 | C5H12 O | 88.1 | 1209.4 | 454.547 | 3.96 ± 0.06 a | 0.44 ± 0.02 c | 0.18 ± 0.05 d | 1.82 ± 0.05 b |
| 31 | 1-Penten-3-ol | Alcohols | C616251 | C5H10O | 86.1 | 1163.7 | 387.468 | 0.42 ± 0.03 b | 0.18 ± 0.01 c | 0.99 ± 0.04 a | 0.16 ± 0.01 c |
| 32 | Butanol-M | Alcohols | C71363 | C4H10O | 74.1 | 1149.9 | 368.875 | 0.46 ± 0.05 b | 0.26 ± 0.01 c | 0.99 ± 0.02 a | 0.24 ± 0.01 c |
| 33 | Butanol-D | Alcohols | C71363 | C4H10O | 74.1 | 1149.4 | 368.186 | 1.14 ± 0.05 a | 0.09 ± 0.01 d | 0.21 ± 0 c | 0.45 ± 0.01 b |
| 34 | 1-Propanol, 2-methyl- | Alcohols | C78831 | C4H10O | 74.1 | 1089.7 | 298.482 | 3.27 ± 0.16 a | 0.53 ± 0.08 c | 0.63 ± 0.07 c | 1.91 ± 0.05 b |
| 35 | 2-Furfurylthiol | Alcohols | C98022 | C5H6OS | 114.2 | 1434.7 | 829.928 | 0.01 ± 0 d | 0.02 ± 0 c | 0.07 ± 0 a | 0.05 ± 0.01 b |
| 36 | Ethanol | Alcohols | C64175 | C2H6O | 46.1 | 934.5 | 191.359 | 10.03 ± 0.04 c | 6.67 ± 0.2 d | 11.72 ± 0.18 b | 12.12 ± 0.11 a |
| 37 | 1-hydroxy-2-propanone-M | Ketones | C116096 | C3H6O2 | 74.1 | 1307.3 | 623.866 | 4.55 ± 0.11 a | 2.96 ± 0.56 b | 5.47 ± 0.58 a | 5.08 ± 0.11 a |
| 38 | 1-hydroxy-2-propanone-D | Ketones | C116096 | C3H6O2 | 74.1 | 1305 | 620.698 | 1.01 ± 0.52 a | 0.95 ± 0.8 a | 1.92 ± 0.86 a | 0.71 ± 0.02 a |
| 39 | 2-Butanone, 3-hydroxy | Ketones | C513860 | C4H8O2 | 88.1 | 1288.5 | 593.684 | 1.65 ± 0.62 a | 0.75 ± 0.38 ab | 1.03 ± 0.38 ab | 0.38 ± 0.04 b |
| 40 | 2-methyl-2-hepten-6-one | Ketones | C110930 | C8H14O | 126.2 | 1346.3 | 680.985 | 0.03 ± 0 bc | 0.12 ± 0.01 a | 0.02 ± 0.01 c | 0.04 ± 0 b |
| 41 | Cyclohexanone | Ketones | C108941 | C6H10O | 98.1 | 1287 | 590.714 | 0.01 ± 0 b | 0.04 ± 0.01 a | 0.02 ± 0 b | 0.02 ± 0.01 b |
| 42 | Cyclopentanone | Ketones | C120923 | C5H8O | 84.1 | 1188.1 | 422.686 | 0.07 ± 0.01 c | 0.08 ± 0 c | 0.35 ± 0.02 a | 0.14 ± 0 b |
| 43 | 2-Heptanone-M | Ketones | C110430 | C7H14O | 114.2 | 1182.5 | 414.308 | 0.22 ± 0.01 b | 0.72 ± 0.05 a | 0.78 ± 0.02 a | 0.16 ± 0.01 c |
| 44 | 2-Heptanone-D | Ketones | C110430 | C7H14O | 114.2 | 1183.9 | 416.427 | 0.25 ± 0.02 b | 0.53 ± 0.06 a | 0.29 ± 0.01 b | 0.12 ± 0.01 c |
| 45 | 2-propanone | Ketones | C67641 | C3H6O | 58.1 | 820.9 | 144.417 | 12.71 ± 0.07 c | 10.75 ± 0.46 d | 15.52 ± 0.25 a | 14.13 ± 0.04 b |
| 46 | 2-Pentanone | Ketones | C107879 | C5H10O | 86.1 | 988.3 | 218.614 | 0.44 ± 0.03 c | 2.32 ± 0.1 a | 1.48 ± 0.03 b | 0.2 ± 0.01 d |
| 47 | 2-Butanone | Ketones | C78933 | C4H8O | 72.1 | 898.3 | 174.929 | 0.85 ± 0.02 d | 5.46 ± 0.26 b | 7.19 ± 0.05 a | 1.28 ± 0.02 c |
| 48 | 3-penten-2-one, 4-methyl | Ketones | C141797 | C6H10O | 98.1 | 1138.2 | 353.703 | 0.02 ± 0 c | 0.06 ± 0.01 b | 0.05 ± 0.01 b | 0.61 ± 0.01 a |
| 49 | Ethyl 2-hydroxypropanoate | Esters | C97643 | C5H10O3 | 118.1 | 1321 | 643.29 | 0.08 ± 0.01 a | 0.08 ± 0.02 a | 0.04 ± 0.01 b | 0.09 ± 0 a |
| 50 | Ethyl caproate-M | Esters | C123660 | C8H16O2 | 144.2 | 1235.6 | 496.646 | 1.02 ± 0.08 a | 0.35 ± 0.31 a | 0.74 ± 0.64 a | 0.52 ± 0.01 a |
| 51 | Ethyl caproate-D | Esters | C123660 | C8H16O2 | 144.2 | 1234.7 | 495.242 | 1.35 ± 0.06 a | 0.06 ± 0 b | 0.06 ± 0.01 b | 1.43 ± 0.1 a |
| 52 | Ethyl pentanoate | Esters | C539822 | C7H14O2 | 130.2 | 1136 | 350.97 | 0.73 ± 0.04 a | 0.05 ± 0.01 c | 0.05 ± 0.01 c | 0.21 ± 0.01 b |
| 53 | Ethyl 3-methylbutanoate-D | Esters | C108645 | C7H14O2 | 130.2 | 1069.7 | 280.435 | 0.35 ± 0.03 b | 0.04 ± 0.01 c | 0.04 ± 0 c | 2.72 ± 0.08 a |
| 54 | Ethyl 3-methylbutanoate-M | Esters | C108645 | C7H14O2 | 130.2 | 1070.2 | 280.864 | 0.47 ± 0.01 b | 0.11 ± 0.01 c | 0.02 ± 0 d | 0.76 ± 0.01 a |
| 55 | Butanoic acid ethyl ester | Esters | C105544 | C6H12O2 | 116.2 | 1043.1 | 258.09 | 5.84 ± 0.24 a | 0.19 ± 0.09 b | 0.15 ± 0.04 b | 5.57 ± 0.22 a |
| 56 | 2-Methyl butanoic acid ethyl ester | Esters | C7452791 | C7H14O2 | 130.2 | 1055.1 | 267.973 | 0.16 ± 0.01 b | 0.01 ± 0 c | 0.02 ± 0 c | 1 ± 0.03 a |
| 57 | Ethyl 2-methy lpropionate | Esters | C97621 | C6H12O2 | 116.2 | 968.6 | 208.208 | 0.18 ± 0.01 b | 0.04 ± 0.01 b | 0.07 ± 0 b | 3.44 ± 0.14 a |
| 58 | Ethyl propanoate | Esters | C105373 | C5H10O2 | 102.1 | 958.1 | 202.875 | 2.3 ± 0.08 a | 0.06 ± 0.03 c | 0.06 ± 0.03 c | 1.11 ± 0.08 b |
| 59 | Acetic acid ethyl ester | Esters | C141786 | C4H8O2 | 88.1 | 875.8 | 165.477 | 8.18 ± 0.05 b | 1.23 ± 0.07 d | 3.38 ± 0.04 c | 10.56 ± 0.07 a |
| 60 | Acetic acid propyl ester | Esters | C109604 | C5H10O2 | 102.1 | 980 | 214.14 | 0.44 ± 0.01 c | 1.93 ± 0.1 a | 1.28 ± 0.05 b | 0.36 ± 0.01 c |
| 61 | Methyl propanoate | Esters | C554121 | C4H8O2 | 88.1 | 913.7 | 181.748 | 0.15 ± 0.02 c | 0.55 ± 0.03 b | 0.64 ± 0.03 a | 0.14 ± 0 c |
| 62 | Acetic acid-M | Acids | C64197 | C2H4O2 | 60.1 | 1463.7 | 885.381 | 8.81 ± 0.14 a | 7.45 ± 0.67 b | 4.56 ± 0.65 c | 8.99 ± 0.51 a |
| 63 | Acetic acid-D | Acids | C64197 | C2H4O2 | 60.1 | 1462.3 | 882.662 | 14.19 ± 0.38 a | 4.41 ± 1.56 b | 1.59 ± 0.19 c | 4.96 ± 0.39 b |
| 64 | 2,3,5,6-tetramethylpyrazine | Others | C1124114 | C8H12N2 | 136.2 | 1463.7 | 885.381 | 0.02 ± 0 a | 0.05 ± 0.01 a | 0.04 ± 0.01 a | 0.04 ± 0.03 a |
| 65 | 1-(2-furanyl)ethanone | Others | C1192627 | C6H6O2 | 110.1 | 1493.7 | 946.925 | 0.03 ± 0 c | 0.02 ± 0 c | 0.39 ± 0.02 a | 0.14 ± 0.01 b |
| 66 | Dipropyl disulfide | Others | C629196 | C6H14S2 | 150.3 | 1376.8 | 728.814 | 0.07 ± 0 b | 0.68 ± 0.09 a | 0.1 ± 0.03 b | 0.11 ± 0.02 b |
| 67 | Furan, 2-methyl-3-(methylthio) | Others | C63012975 | C6H8OS | 128.2 | 1354.5 | 693.503 | 0.02 ± 0 c | 0.05 ± 0.01 a | 0.02 ± 0 b | 0.01 ± 0 c |
| 68 | 2-pentyl furan | Others | C3777693 | C9H14O | 138.2 | 1230.4 | 487.946 | 0.36 ± 0.01 a | 0.24 ± 0.01 c | 0.28 ± 0.01 b | 0.21 ± 0.01 d |
| 69 | 2-methyl-3-ketotetrahydrofuran-M | Others | C3188009 | C5H8O2 | 100.1 | 1269.2 | 556.292 | 0.44 ± 0.03 b | 0.96 ± 0.09 a | 0.5 ± 0.02 b | 0.49 ± 0.01 b |
| 70 | 2-methyl-3-ketotetrahydrofuran-D | Others | C3188009 | C5H8O2 | 100.1 | 1269.4 | 556.692 | 0.06 ± 0 b | 0.46 ± 0.08 a | 0.06 ± 0.01 b | 0.07 ± 0 b |
| 71 | Allyl sulfide | Others | C592881 | C6H10S | 114.2 | 1150.5 | 369.559 | 0.4 ± 0.02 b | 1.45 ± 0.09 a | 0.05 ± 0.01 c | 1.41 ± 0.05 a |
| 72 | Allyl isothiocyanate | Others | C57067 | C4H5NS | 99.2 | 1374.6 | 725.258 | 0.07 ± 0.01a | 0.08 ± 0.01 a | 0.24 ± 0.09 a | 0.13 ± 0.01 a |
| 73 | 1,8-Cineol | Others | C470826 | C10H18O | 154.3 | 1202.3 | 443.795 | 0.32 ± 0.01b | 5.22 ± 0.3 a | 0.11 ± 0.01 b | 0.11 ± 0 b |
| Count | Compound | Odor Threshold (μg/kg) | S1 | S2 | S3 | S4 |
|---|---|---|---|---|---|---|
| 1 | Alpha-terpinolene | 41 | 0.000279 | 0.000342 | 0.001094 | 5.36 × 10⁻⁵ |
| 2 | Alpha-Terpinene | 7.9 | 0.010507 | 0.008472 | 0.048965 | 0.002752 |
| 3 | Alpha-Phellandrene-M | 40 | 0.003054 | 0.001424 | 0.008615 | 0.000525 |
| 4 | Beta-Thujene-M | —— | —— | —— | —— | |
| 5 | Gamma-Terpinene-M | 65 | 0.000387 | 0.00455 | 0.009829 | 0.000255 |
| 6 | Beta-myrcene | 1.2 | 0.018072 | 0.093502 | 0.119976 | 0.007849 |
| 7 | Alpha-Phellandrene-D | 40 | 0.0014 | 0.006658 | 0.004177 | 0.000211 |
| 8 | Delta 3-carene | 770 | 0.000156 | 5.99 × 10⁻⁵ | 0.000254 | 2.45 × 10⁻⁵ |
| 9 | Beta-Pinene-M | 60 | 0.00082 | 0.000279 | 0.012379 | 0.000128 |
| 10 | Alpha-Thujene-M | —— | —— | —— | —— | |
| 11 | Gamma -Terpinene-D | 55 | 0.000712 | 0.001323 | 0.004794 | 0.000245 |
| 12 | Beta-Pinene-D | 60 | 0.000578 | 0.001187 | 0.011626 | 0.000111 |
| Hydrocarbons12 | ||||||
| 13 | 5-methyl furfural | 500 | 0.000235 | 3.28 × 10⁻⁵ | 0.015908 | 0.000184 |
| 14 | 2-furaldehyde-M | 3000 | 7.74 × 10⁻⁵ | 2.22 × 10⁻⁵ | 0.011288 | 3.64 × 10⁻⁵ |
| 15 | Heptaldehyde | 2.8 | 0.019812 | 0.007371 | 0.744409 | 0.004278 |
| 16 | (E)-2-Methyl-2-butenal | 4.4 | 0.003907 | 0.001642 | 0.253965 | 0.001391 |
| 17 | 1-hexanal | 4.5 | 0.06935 | 0.009533 | 0.945901 | 0.003513 |
| 18 | Propanal | 15.1 | 0.021486 | 0.00464 | 0.308171 | 0.004037 |
| 19 | 3-Methyl butanal | 1.1 | 0.047273 | 0.038626 | 1.274982 | 0.008453 |
| 20 | Pentanal | 12 | 0.011531 | 0.011834 | 0.665159 | 0.001271 |
| 21 | (E)-2-butenal | 0.3 | 0.722664 | 0.189462 | 2.460309 | 0.145959 |
| Aldehydes 9 | ||||||
| 22 | Linalool | 6 | 0.014953 | 0.13458 | 0.213268 | 0.051098 |
| 23 | 2-Heptanol | 0.1 | 0.262801 | 0.125326 | 1.200566 | 0.031462 |
| 24 | 1-Pentanol-M | 150.2 | 0.001855 | 0.000693 | 0.021836 | 0.000293 |
| 25 | 1-Butanol, 3-methyl-M | 250 | 0.001113 | 0.000114 | 0.002972 | 0.000194 |
| 26 | 1-Butanol, 3-methyl-D | 250 | 0.003968 | 0.00012 | 0.001495 | 0.000519 |
| 27 | 1-Penten-3-ol | 358.1 | 0.000293 | 3.51 × 10⁻⁵ | 0.005681 | 3.2 × 10⁻⁵ |
| 28 | Butanol-M | 459.2 | 0.000253 | 3.93 × 10⁻⁵ | 0.004398 | 3.64 × 10⁻⁵ |
| 29 | Butanol-D | 459.2 | 0.00062 | 1.32 × 10⁻⁵ | 0.000948 | 7 × 10⁻⁵ |
| 30 | 1-Propanol, 2-methyl- | —— | —— | —— | —— | |
| 31 | 2-Furfurylthiol | 0.008 | 0.188131 | 0.141054 | 17.01225 | 0.476383 |
| 32 | Ethanol | 950,000 | 2.64 × 10⁻⁶ | 4.83 × 10⁻⁷ | 2.53 × 10⁻⁵ | 9.06 × 10⁻⁷ |
| Alcohols 11 | ||||||
| 33 | 1 -hydroxy-2-propanone-M | 10,000 | 0.000164 | 3.34 × 10⁻⁵ | 0.00191 | 4.61 × 10⁻⁵ |
| 34 | 2-Butanone, 3-hydroxy | 0.014 | 29.46011 | 3.694953 | 151.1137 | 1.905421 |
| 35 | 2-methyl-2-hepten-6-one | 0.3 | 0.022844 | 0.027201 | 0.141979 | 0.009972 |
| 36 | Cyclohexanone | 5.27 | 0.000263 | 0.000546 | 0.007102 | 0.000231 |
| 37 | Cyclopentanone | 31–1120 | —— | —— | —— | —— |
| 38 | 2-Heptanone-M | 140 | 0.000857 | 0.000614 | 0.015662 | 0.000138 |
| 39 | 2-propanone | 40,000 | 7.96 × 10⁻⁵ | 1.85 × 10⁻⁵ | 0.000795 | 2.51 × 10⁻⁵ |
| 40 | 2-Pentanone | 98 | 0.001131 | 0.00163 | 0.03084 | 0.000145 |
| 41 | 2-Butanone | 35,400.2 | 6.03 × 10⁻⁶ | 1.06 × 10⁻⁵ | 0.000416 | 2.58 × 10⁻⁶ |
| 42 | 3-penten-2-one, 4-methyl | 48 | 0.000112 | 8.18 × 10⁻⁵ | 0.001925 | 0.00091 |
| Ketones 10 | ||||||
| 43 | Ethyl 2-hydroxypropanoate | 8 | 0.00242 | 0.00066 | 0.00922 | 0.000795 |
| 44 | Ethyl caproate-M | 1 | 0.593224 | 0.027999 | 1.63507 | 0.138246 |
| 45 | Ethyl pentanoate | 1.5 | 0.121761 | 0.002385 | 0.062388 | 0.009772 |
| 46 | Ethyl 3-methylbutanoate-D | 0.58 | 0.149325 | 0.004927 | 0.126278 | 0.33356 |
| 47 | Ethyl 3-methylbutanoate-M | 0.58 | 0.203934 | 0.012652 | 0.065263 | 0.092728 |
| 48 | Butanoic acid ethyl ester | 0.053 | 27.56826 | 0.252359 | 5.706915 | 7.471426 |
| 49 | 2-Methyl butanoic acid ethyl ester | 0.968–11.7 | —— | —— | —— | —— |
| 50 | Ethyl 2-methy lpropionate | 0.1 | 0.450194 | 0.029475 | 1.450755 | 2.442442 |
| 51 | Ethyl propanoate | 0.027 | 21.28589 | 0.153615 | 4.698446 | 2.916468 |
| 52 | Acetic acid ethyl ester | 5 | 0.409878 | 0.016886 | 1.384313 | 0.149998 |
| 53 | Acetic acid propyl ester | 2000 | 5.51 × 10⁻⁵ | 6.63 × 10⁻⁵ | 0.001307 | 1.29 × 10⁻⁵ |
| 54 | Methyl propanoate | 100 | 0.000383 | 0.000377 | 0.013011 | 9.62 × 10⁻⁵ |
| Esters 12 | ||||||
| 55 | Acetic acid-M | 22,000 | 0.000262 | 3.71 × 10⁻⁵ | 0.000573 | 4.5 × 10⁻⁵ |
| Acids 1 | ||||||
| 56 | 2,3,5,6-tetramethylpyrazine | 2.5 | 0.002429 | 0.001502 | 0.029068 | 0.001153 |
| 57 | 1-(2-furanyl) ethanone | 10 | 0.00087 | 0.000134 | 0.080027 | 0.000995 |
| 58 | Dipropyl disulfide | 0.13 | 0.131401 | 0.357982 | 1.540802 | 0.061862 |
| 59 | Furan, 2-methyl-3-(methylthio) | 0.2 | 0.01894 | 0.018544 | 0.245471 | 0.005128 |
| 60 | 2-pentyl furan | 6 | 0.015218 | 0.002758 | 0.097303 | 0.002428 |
| 61 | 2-methyl-3-ketotetrahydrofuran-M | 6 | 0.018295 | 0.010998 | 0.169048 | 0.005853 |
| 62 | 2-methyl-3-ketotetrahydrofuran-D | 6 | 0.002664 | 0.005234 | 0.019049 | 0.000824 |
| 63 | Allyl sulfide | 0.001 | 100 | 100 | 100 | 100 |
| 64 | 1,8-Cineol | 15 | 0.005407 | 0.023932 | 0.01449 | 0.000504 |
| 65 | Allyl isothiocyanate | 0.19 | 0.097018 | 0.028778 | 2.588437 | 0.048537 |
| Others 10 |
Disclaimer/Publisher’s Note: The statements, opinions and data contained in all publications are solely those of the individual author(s) and contributor(s) and not of MDPI and/or the editor(s). MDPI and/or the editor(s) disclaim responsibility for any injury to people or property resulting from any ideas, methods, instructions or products referred to in the content. |
© 2024 by the authors. Licensee MDPI, Basel, Switzerland. This article is an open access article distributed under the terms and conditions of the Creative Commons Attribution (CC BY) license (https://creativecommons.org/licenses/by/4.0/).
Share and Cite
Zhao, P.; An, Y.; Dong, Z.; Sun, X.; Zhang, W.; Wang, H.; Yang, B.; Yan, J.; Fang, B.; Ren, F.; et al. Comparative Analysis of Commercially Available Flavor Oil Sausages and Smoked Sausages. Molecules 2024, 29, 3772. https://doi.org/10.3390/molecules29163772
Zhao P, An Y, Dong Z, Sun X, Zhang W, Wang H, Yang B, Yan J, Fang B, Ren F, et al. Comparative Analysis of Commercially Available Flavor Oil Sausages and Smoked Sausages. Molecules. 2024; 29(16):3772. https://doi.org/10.3390/molecules29163772
Chicago/Turabian StyleZhao, Penghui, Yongqiang An, Zijie Dong, Xiaoxue Sun, Wanli Zhang, Heng Wang, Bing Yang, Jing Yan, Bing Fang, Fazheng Ren, and et al. 2024. "Comparative Analysis of Commercially Available Flavor Oil Sausages and Smoked Sausages" Molecules 29, no. 16: 3772. https://doi.org/10.3390/molecules29163772