
A New Wound-Healing Tool Based on Glycyrrhiza glabra Extract-Loaded Ufasomes on Spanish Broom Dressings

 , ,
, ,  , ,
, ,  ,
,  , ,
, , 

Abstract

1. Introduction
2. Results and Discussion
2.1. Chemical Analysis of GG Root Extract
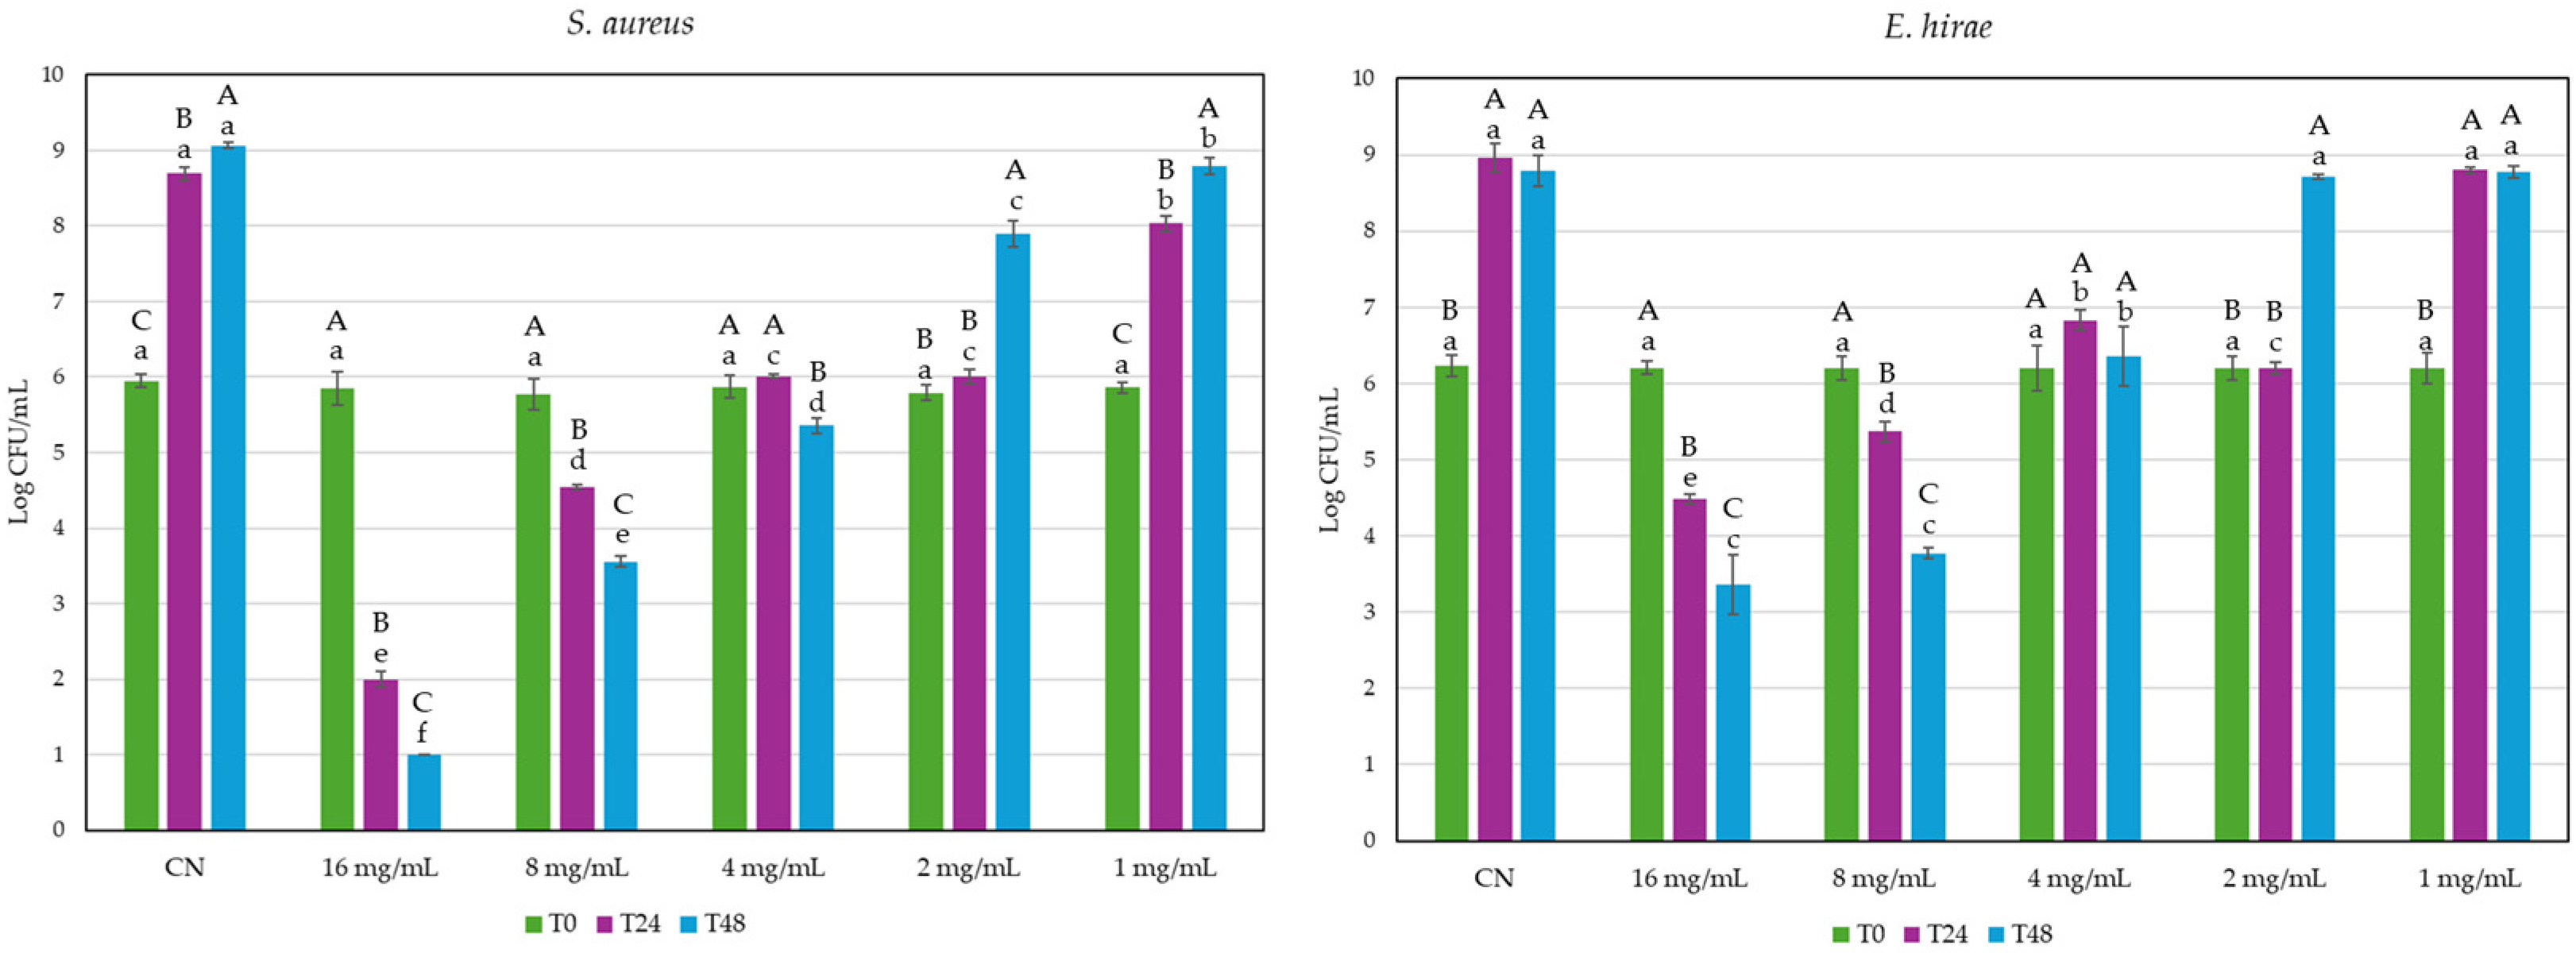
2.2. Antibacterial Activity of GG Root Extract
2.3. Encapsulation of GG Root Extract Into Vesicles and Their Characterization
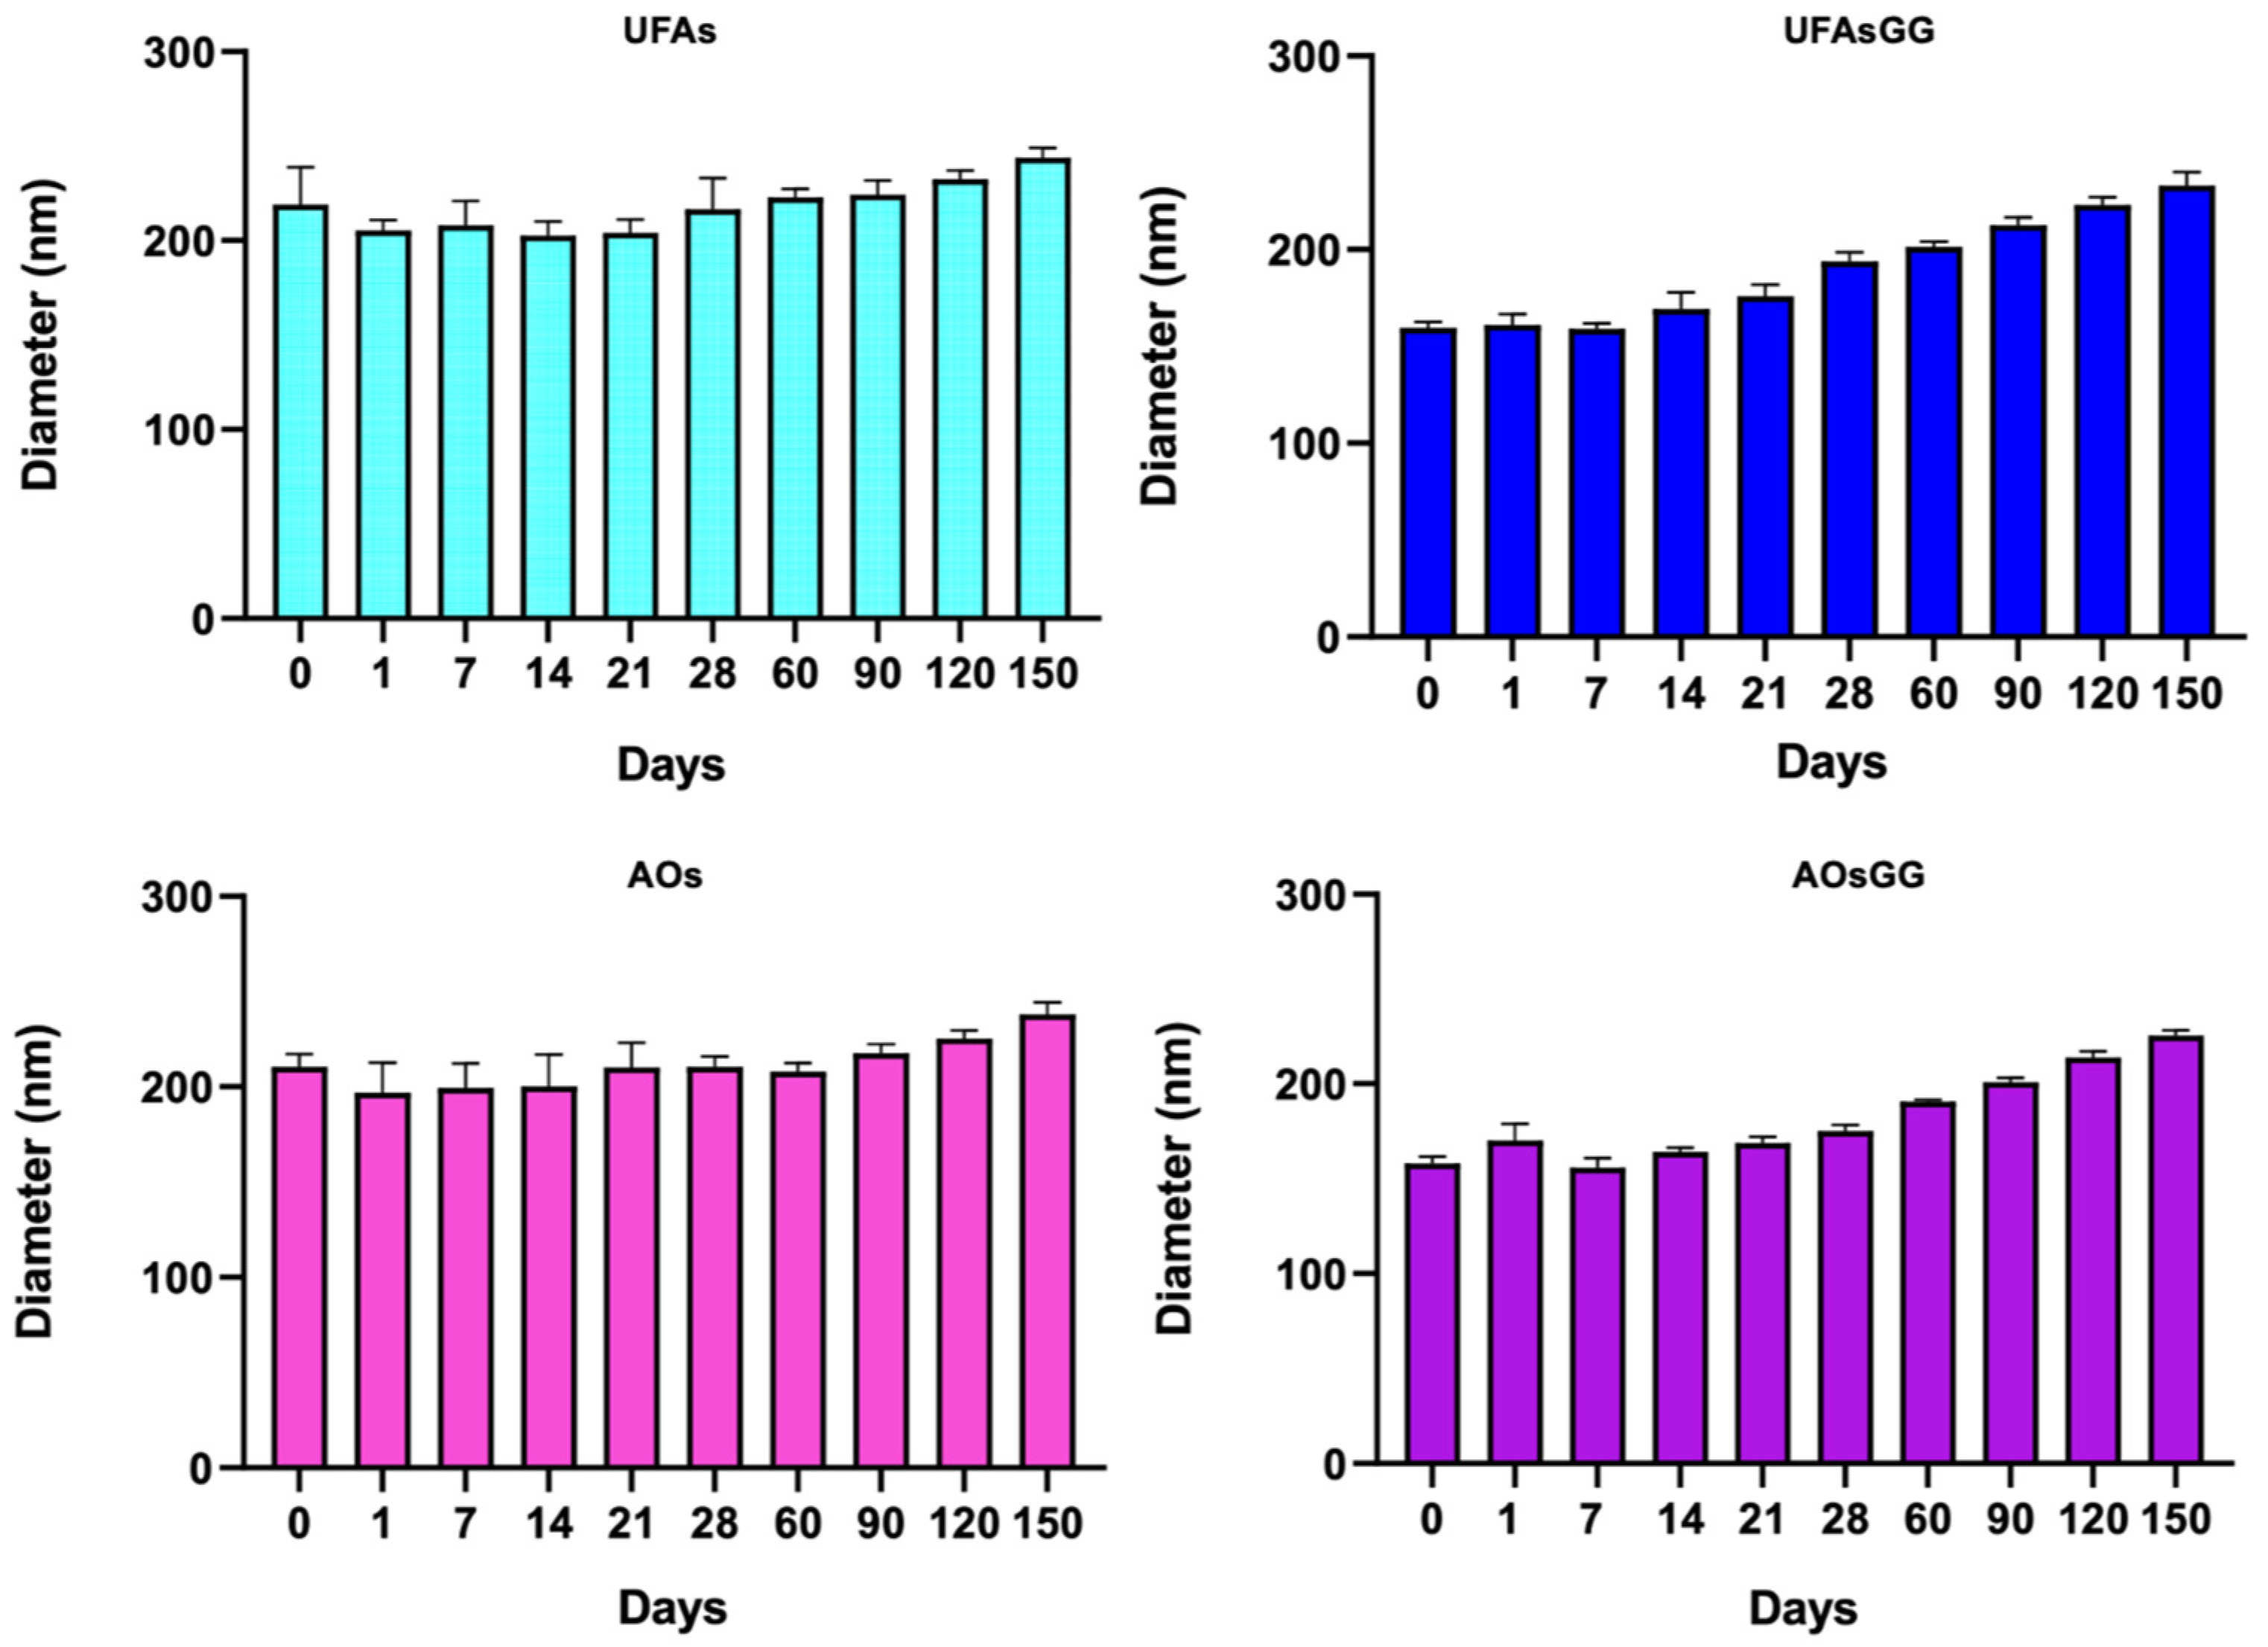
2.4. Stability Studies
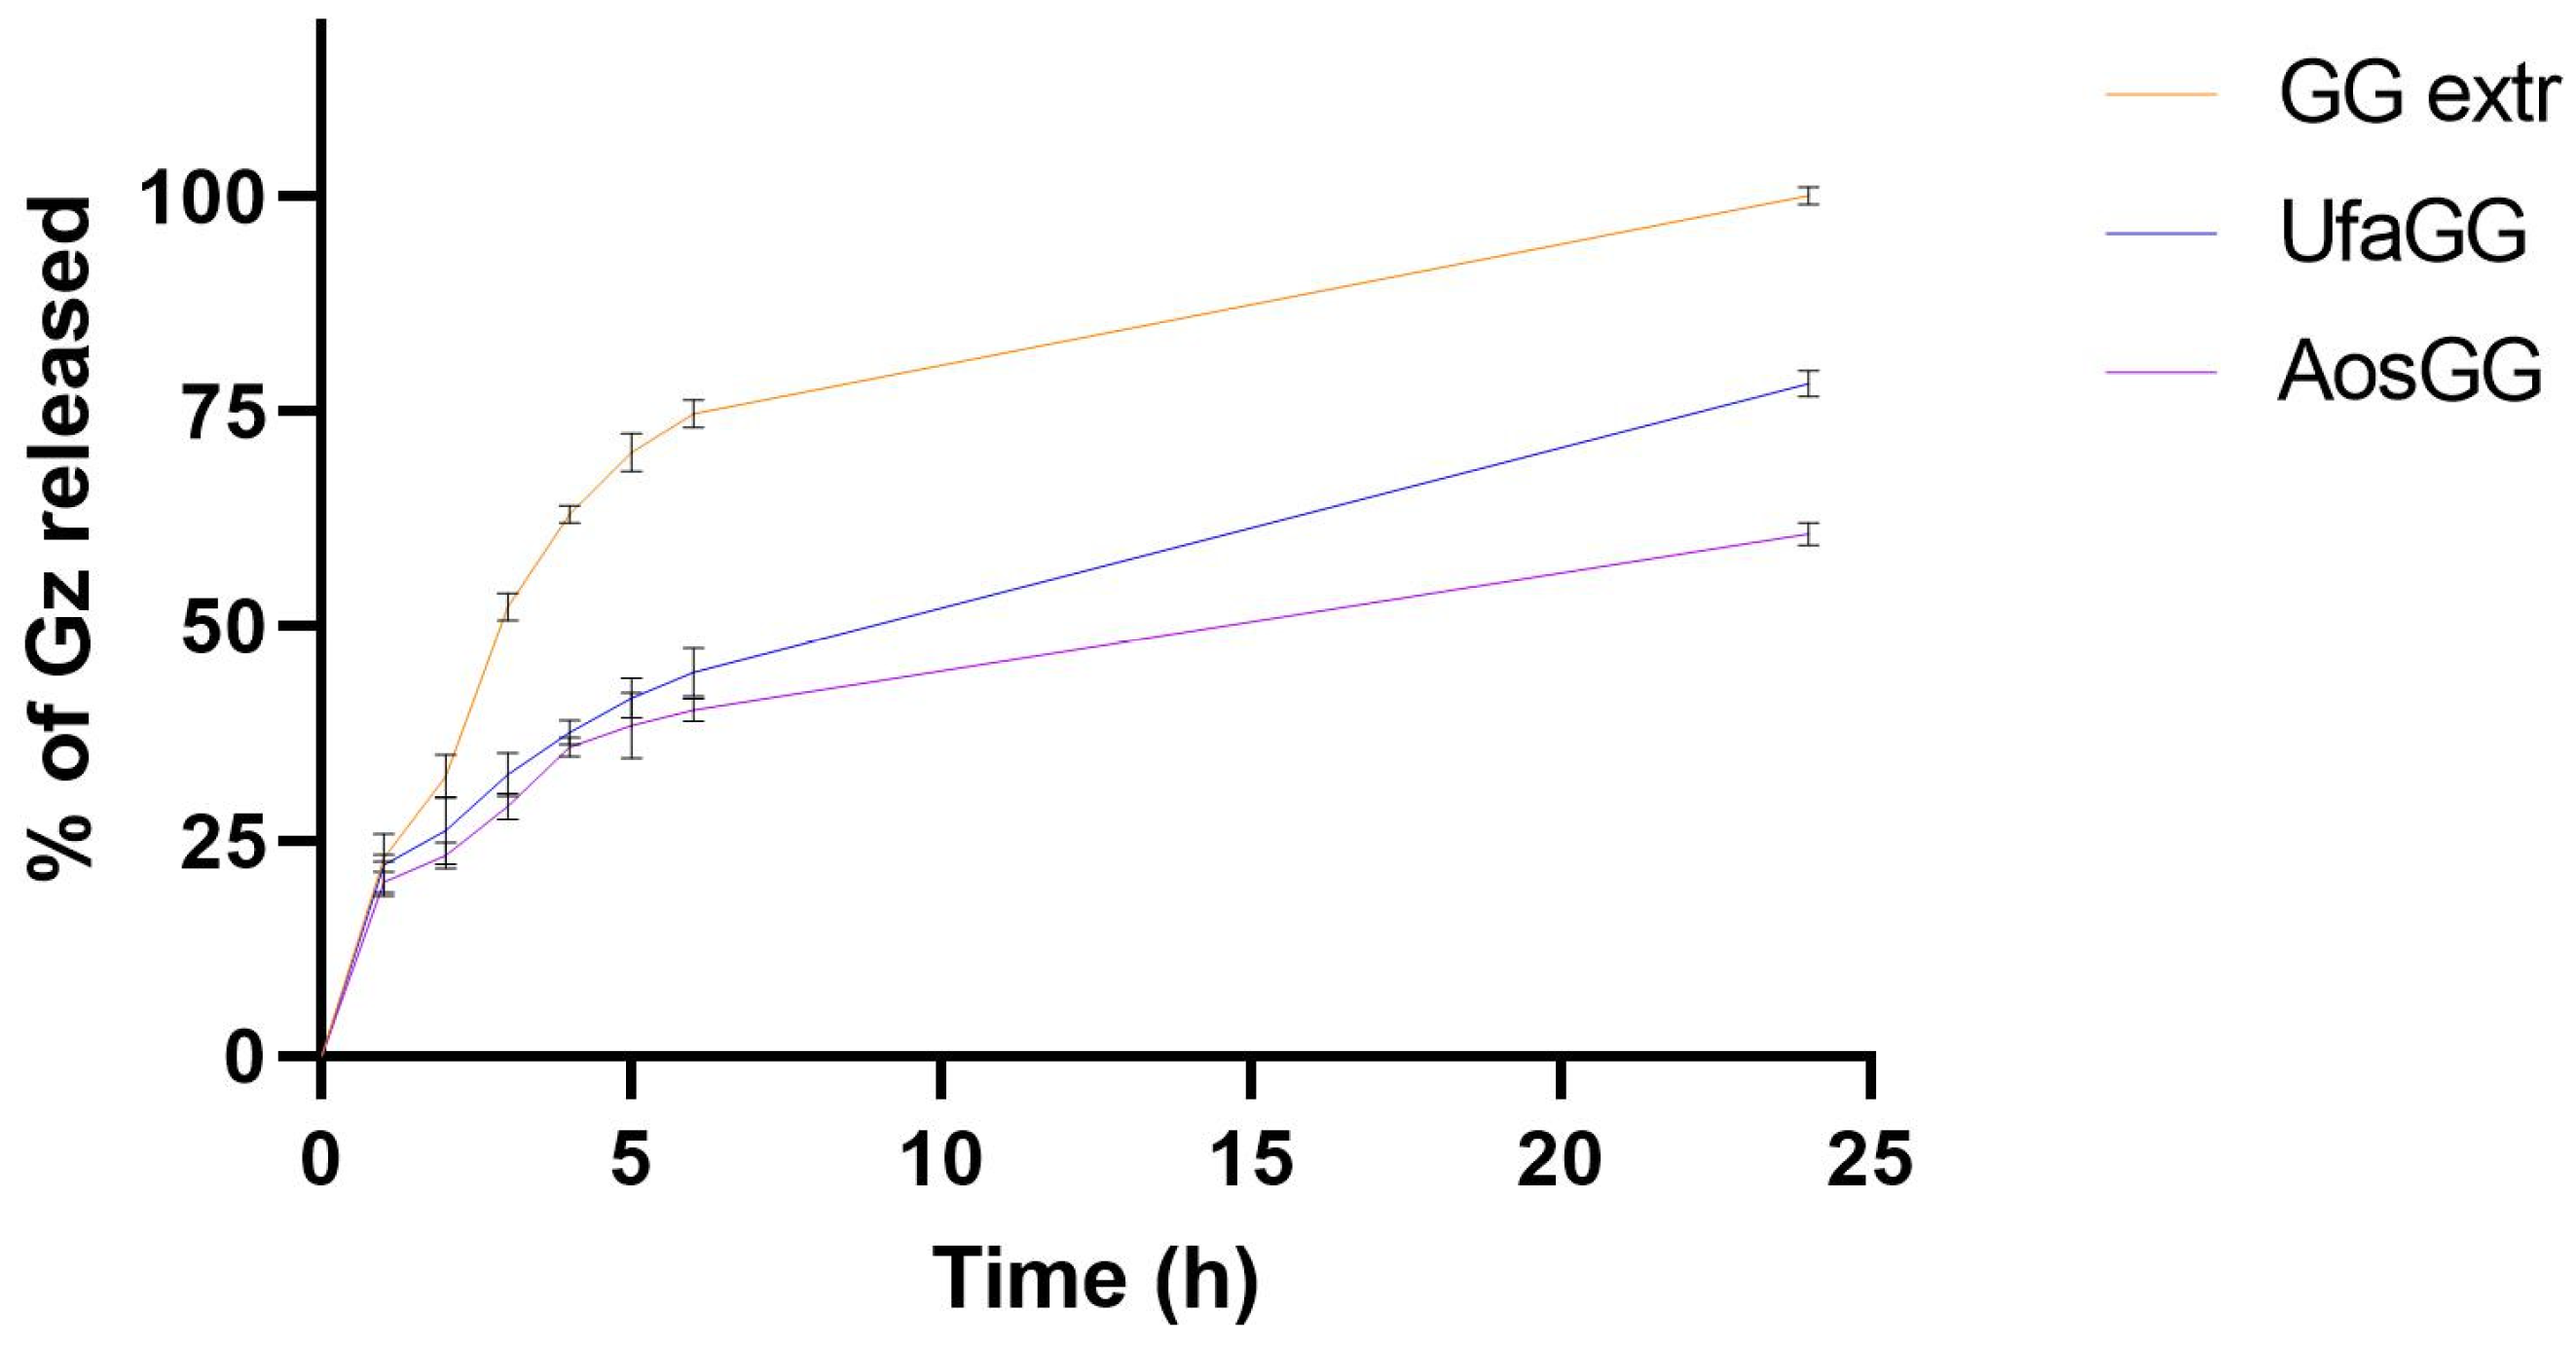
2.5. In Vitro Release Studies
2.6. Cell Viability Studies
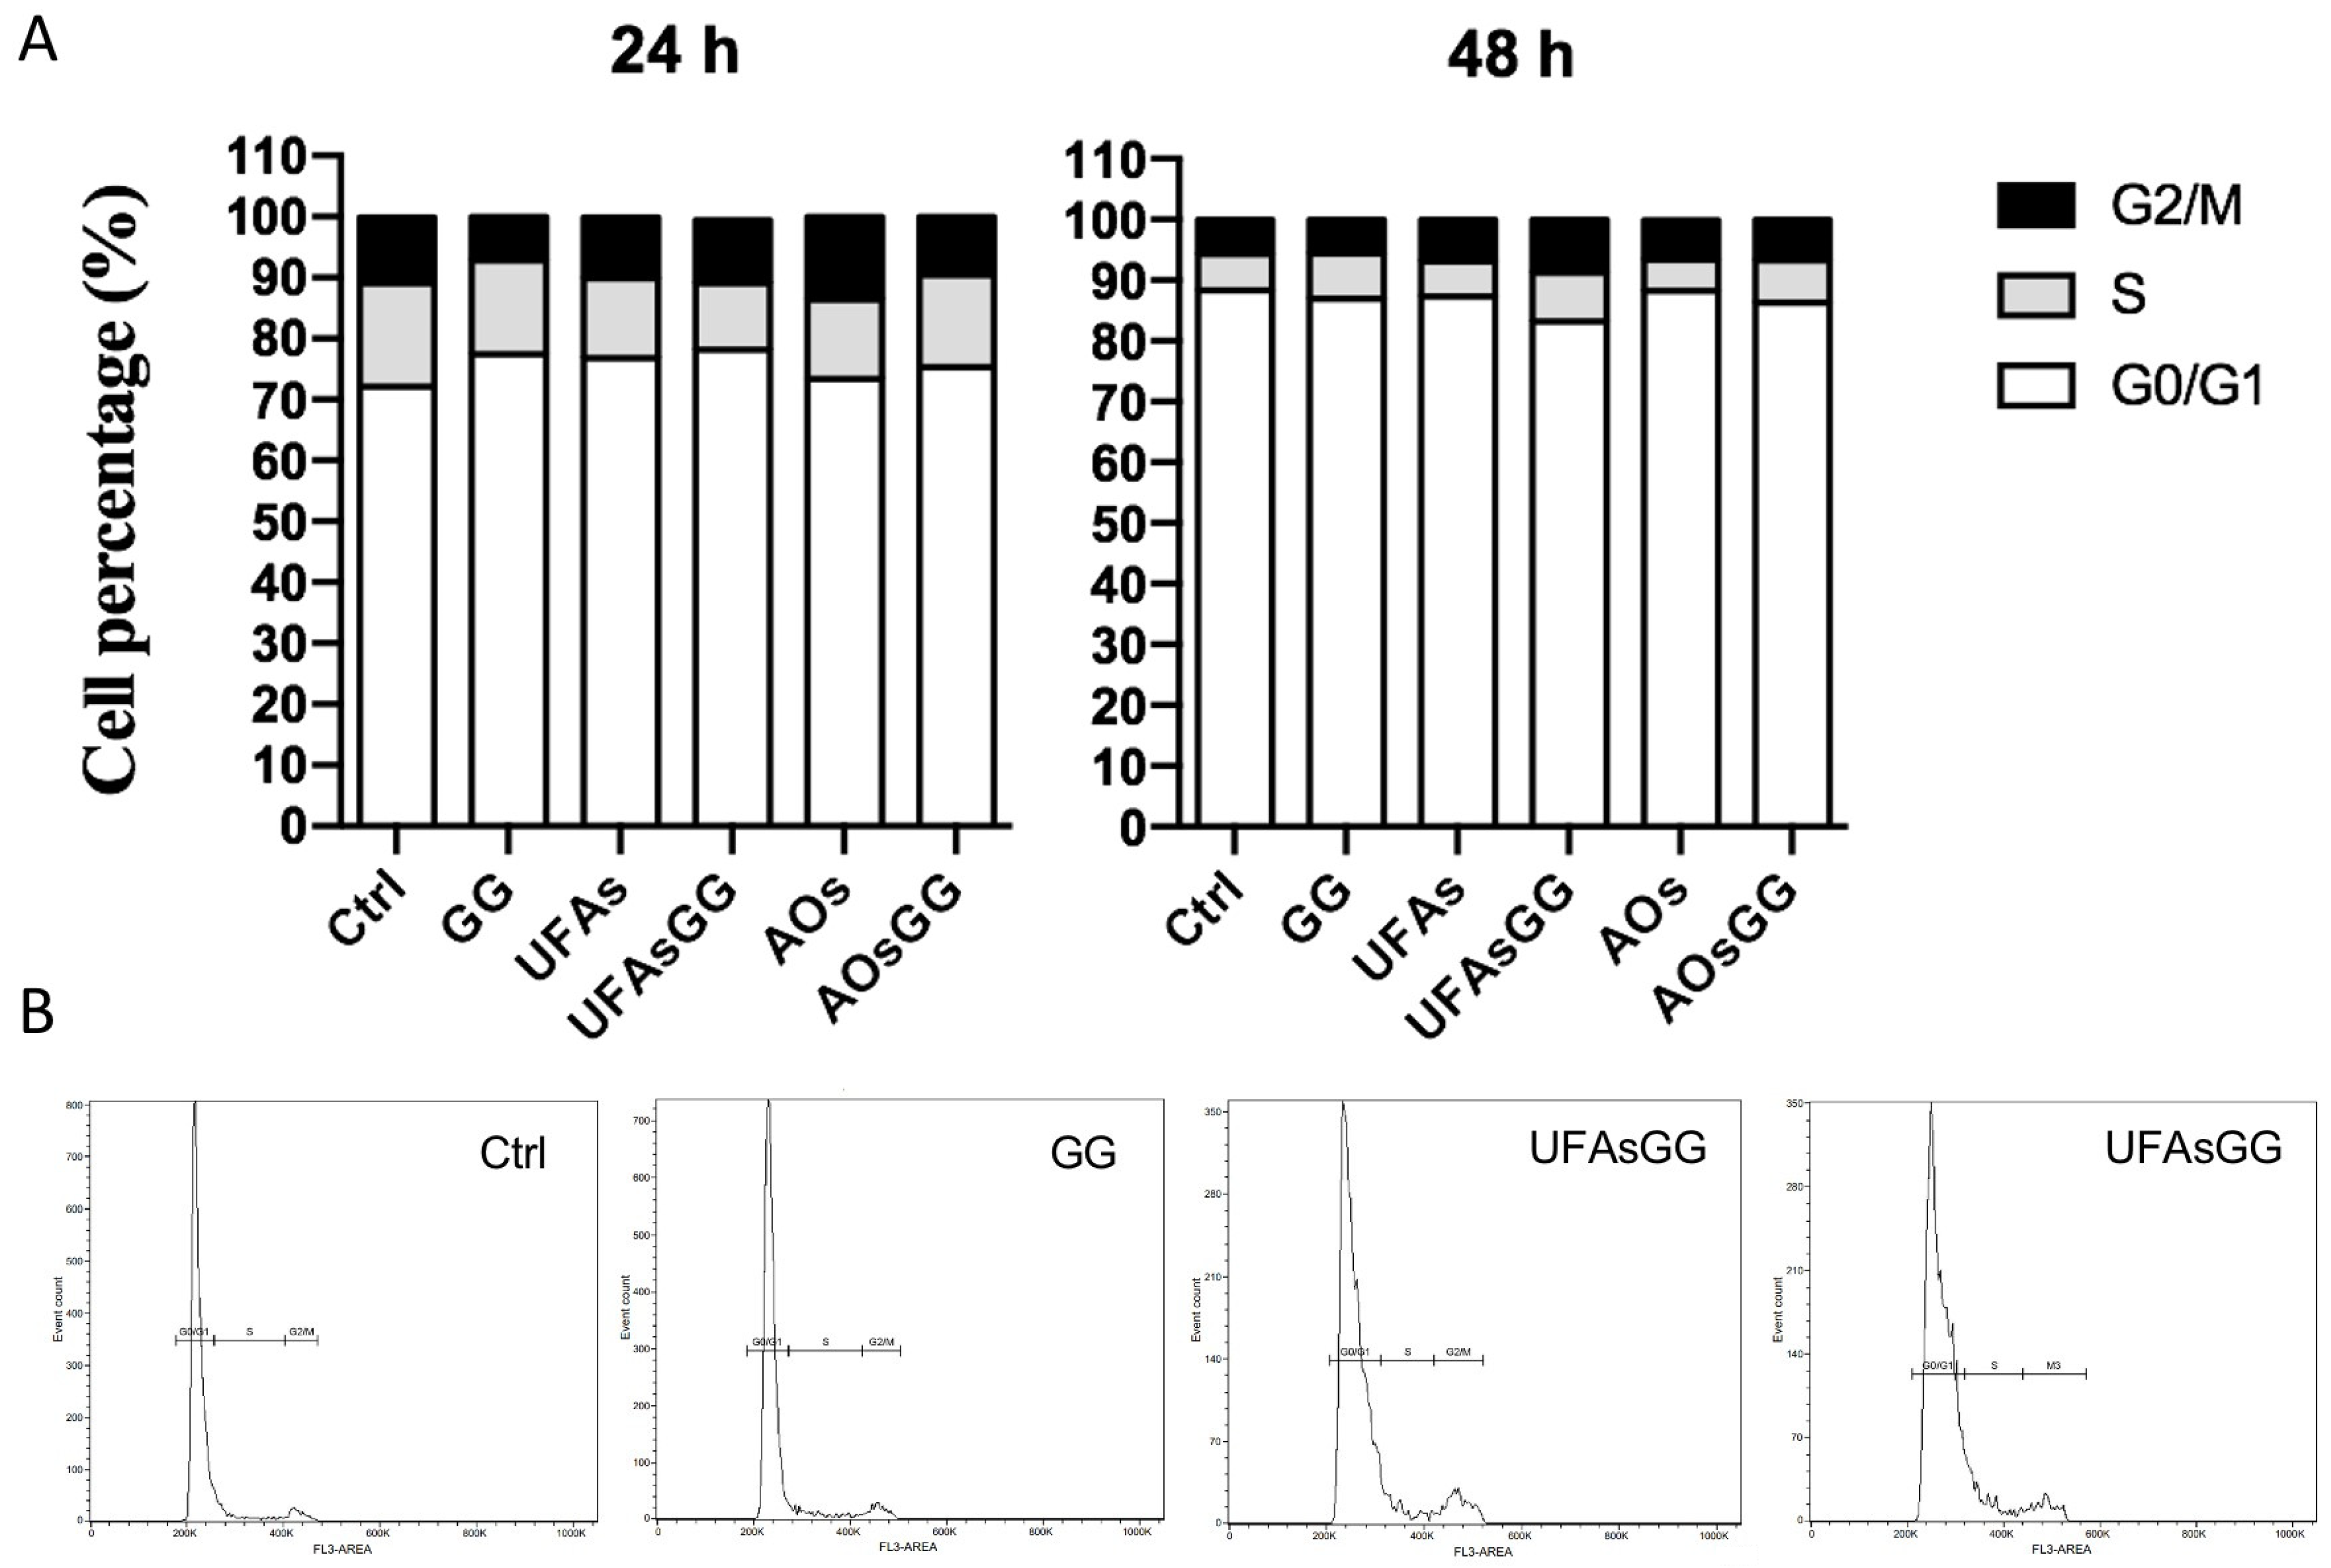
2.7. Cell Cycle Evaluation by Flow Cytometry
2.8. Biosafety
2.9. Intracellular ROS Assay
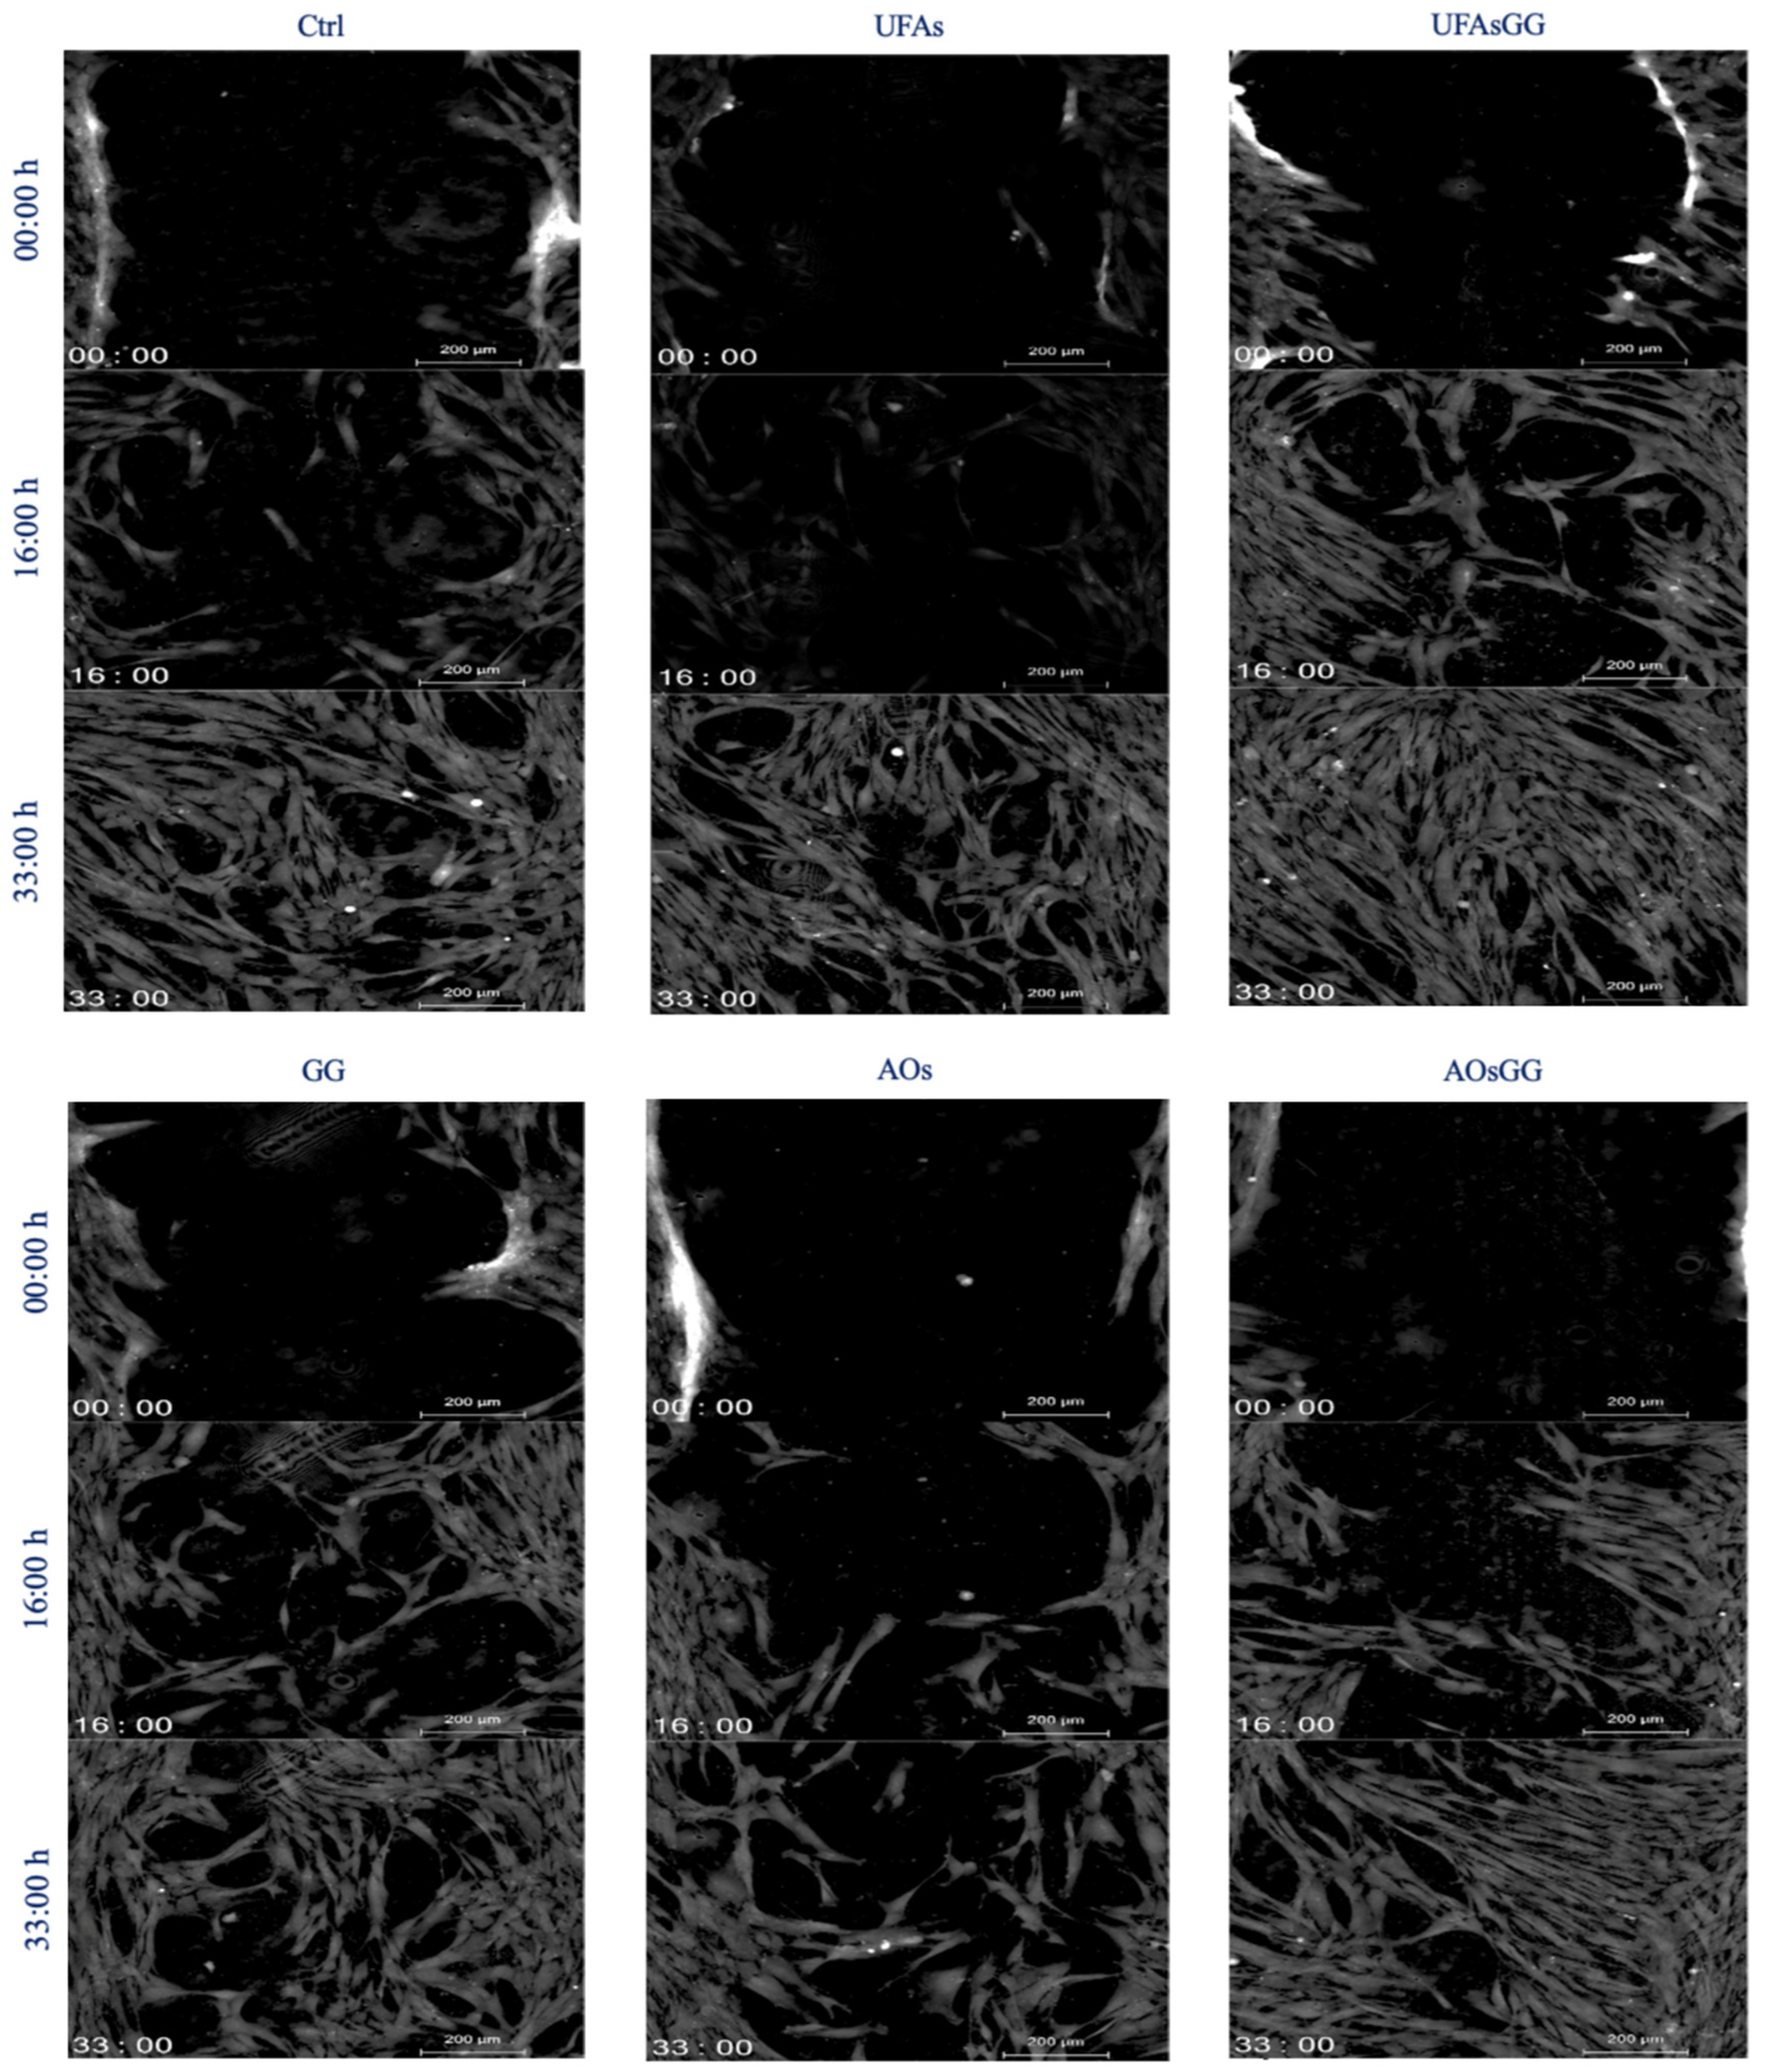
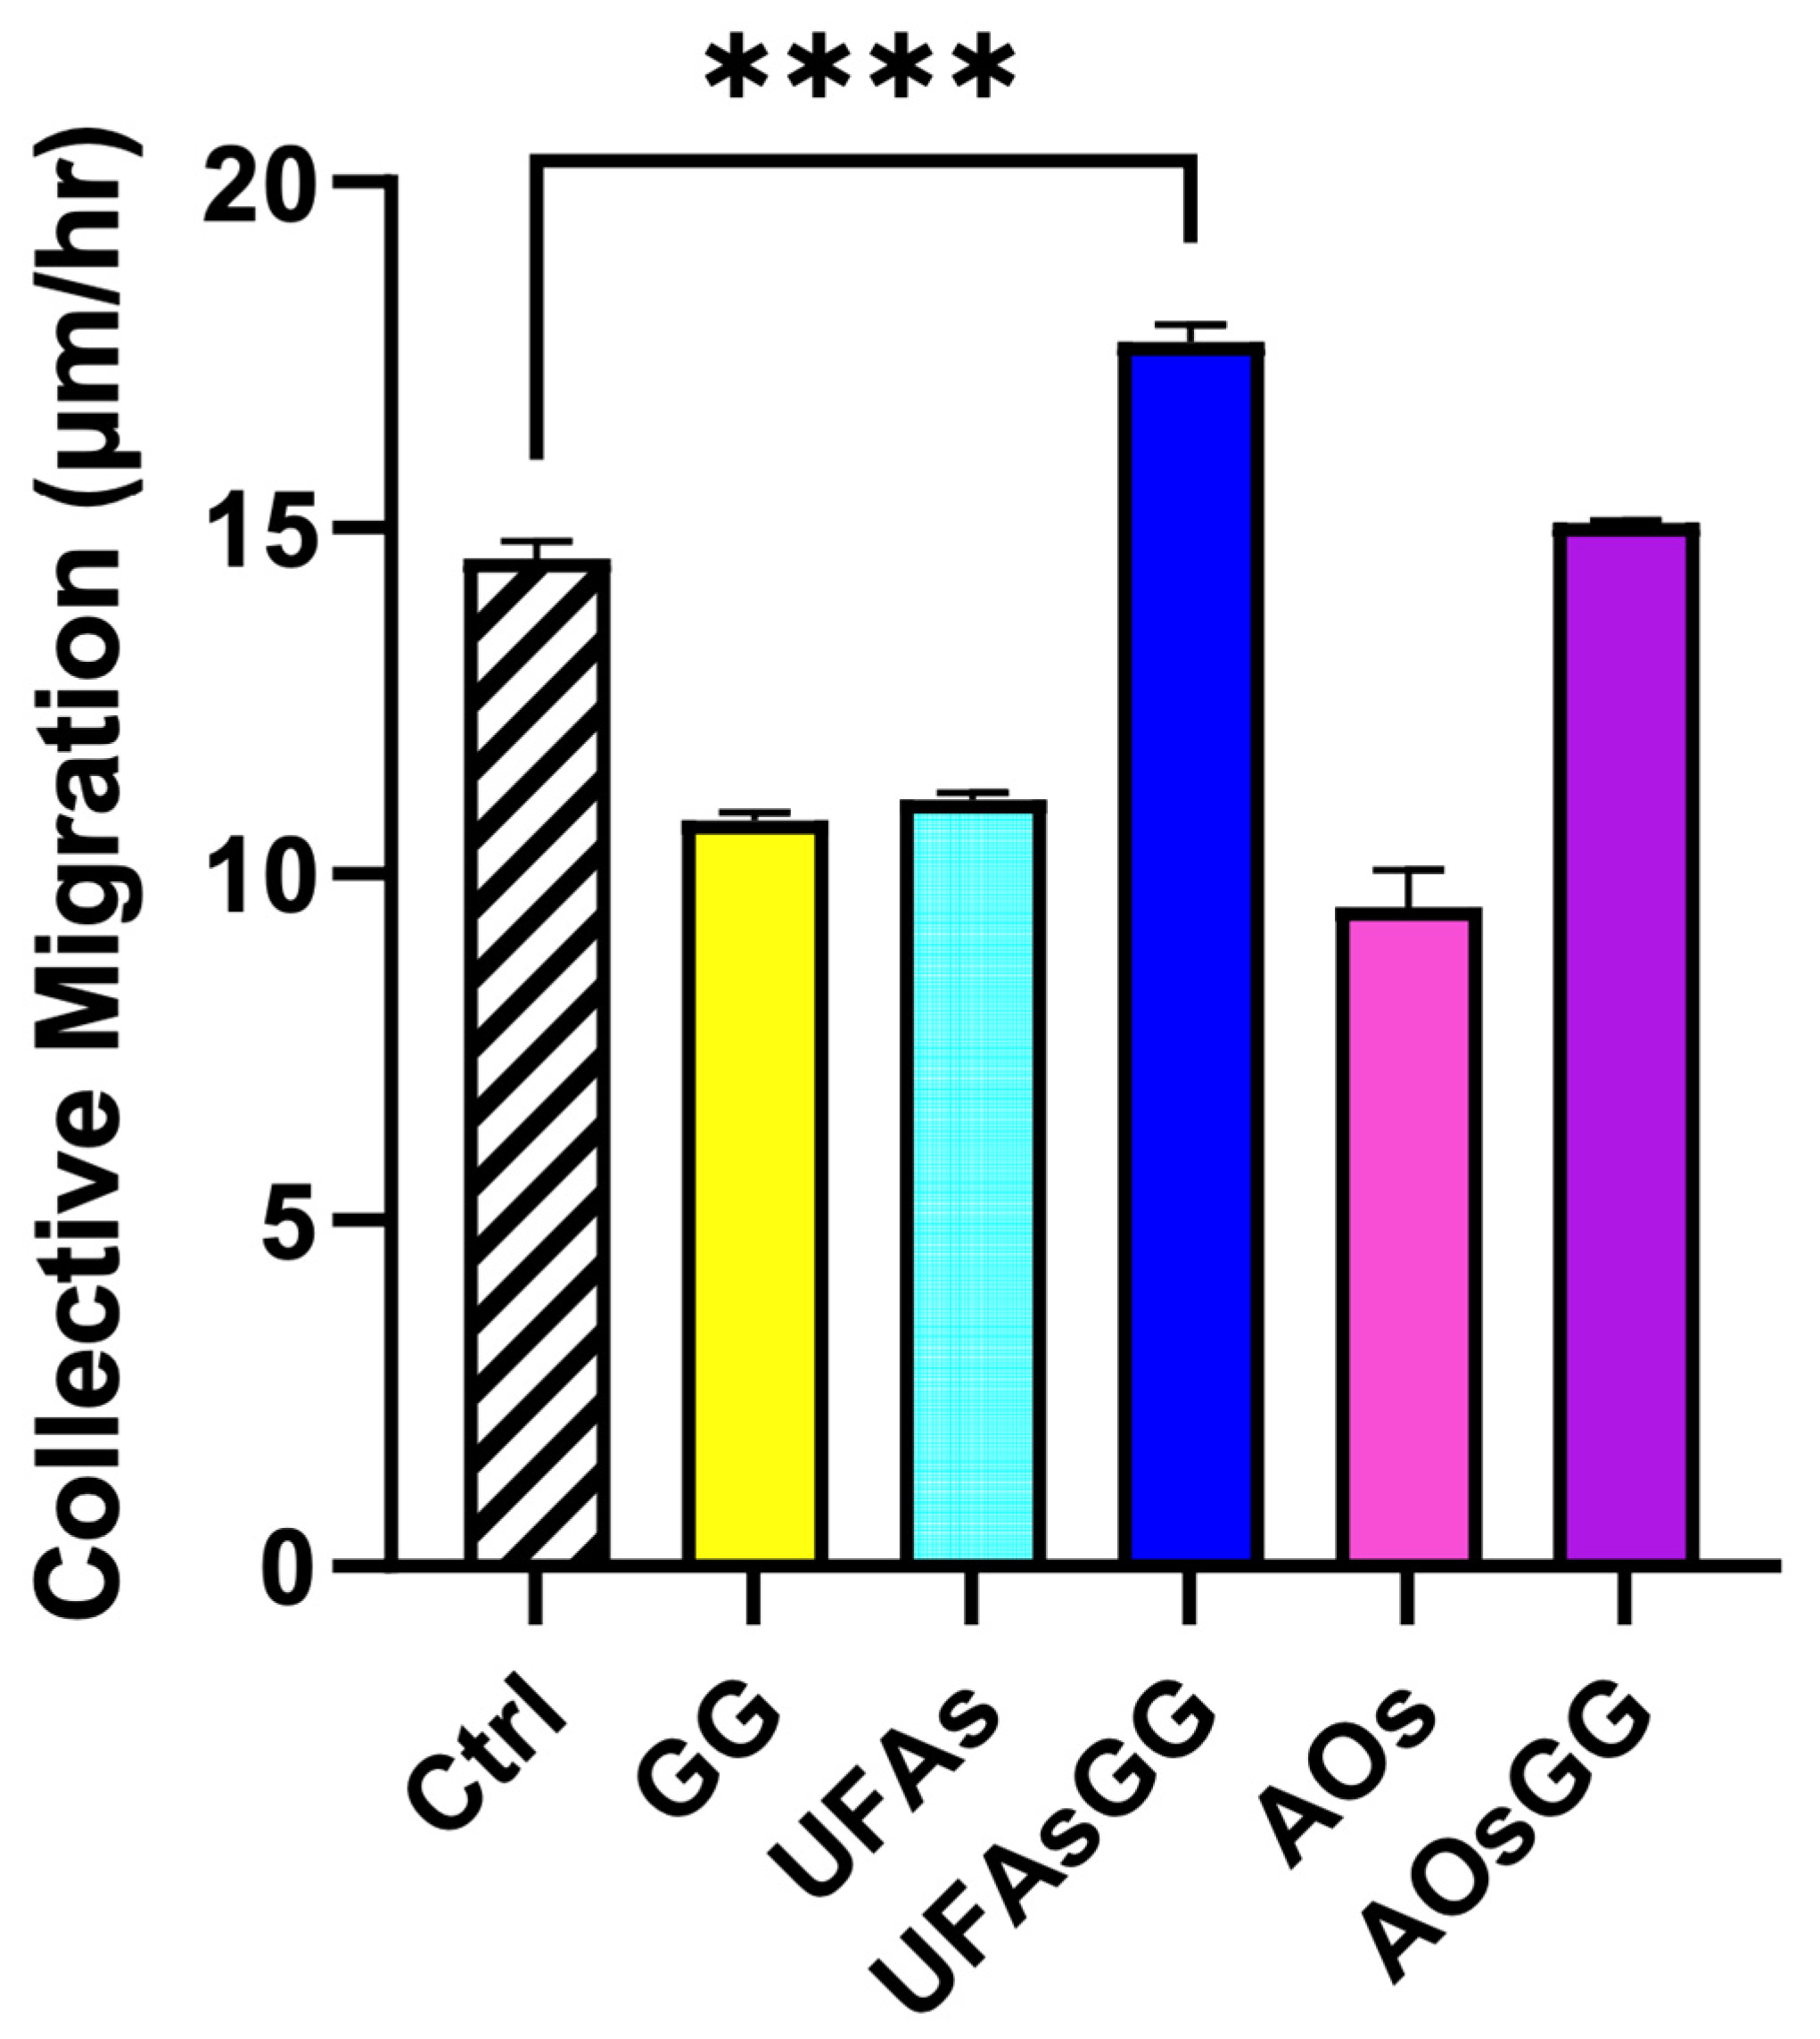
2.10. Wound-Healing Assay
3. Materials and Methods
3.1. Materials
3.2. Preparation of GG Root Extract
3.3. GG Root Extract Phenolic Richness Determined by HPLC
3.4. Total Phenolic Content, Total Flavonoid Content, and Antioxidant Activity
3.5. Antibacterial Activity of GG Root Extract
3.6. Encapsulation of GG Root Extract
3.6.1. Preparation of UFAs
3.6.2. Preparation of AOs
3.6.3. Characterization of Vesicles
Size, PDI, and Zeta Potential Measurement
EE
Stability Studies
3.6.4. In Vitro Release Studies
3.6.5. Cell Viability Studies
3.6.6. Cell Cycle Evaluation by Flow Cytometry
3.6.7. Biosafety
- Hemolysis% = [(Abs sample − Abs negative control)/(Abs positive control − Abs negative control)] × 100
3.6.8. Intracellular ROS Assay
3.7. Preparation of Spanish Broom Wound Dressing
3.7.1. Impregnation of Wound Dressing with Vesicles
3.7.2. Wound Healing Assay
3.8. Statistical Analysis
4. Conclusions
Supplementary Materials
Author Contributions
Funding
Institutional Review Board Statement
Informed Consent Statement
Data Availability Statement
Acknowledgments
Conflicts of Interest
References
- Market Analysis Report, Wound Dressing Market Size, Share & Trends Analysis Report By Product (Traditional Dressing, Advanced Dressing), by Application (Chronic Wounds, Acute Wounds), By End-Use, By Region, And Segment Forecasts, 2024–2030). Report ID: 978-1-68038-558-8. Available online: https://www.grandviewresearch.com/industry-analysis/wound-dressing-market (accessed on 1 June 2024).
- Vitale, S.; Colanero, S.; Placidi, M.; Di Emidio, G.; Tatone, C.; Amicarelli, F.; D’alessandro, A.M. Phytochemistry and Biological Activity of Medicinal Plants in Wound Healing: An Overview of Current Research. Molecules 2022, 27, 3566. [Google Scholar] [CrossRef] [PubMed]
- Hung, C.-F.; Hsiao, C.-Y.; Hsieh, W.-H.; Li, H.-J.; Tsai, Y.-J.; Lin, C.-N.; Chang, H.-H.; Wu, N.-L. 18ß-glycyrrhetinic acid derivative promotes proliferation, migration and aquaporin-3 expression in human dermal fibroblasts. PLoS ONE 2017, 12, e0182981. [Google Scholar] [CrossRef] [PubMed]
- Castangia, I.; Caddeo, C.; Manca, M.L.; Casu, L.; Latorre, A.C.; Díez-Sales, O.; Ruiz-Saurí, A.; Bacchetta, G.; Fadda, A.M.; Manconi, M. Delivery of liquorice extract by liposomes and hyalurosomes to protect the skin against oxidative stress injuries. Carbohydr. Polym. 2015, 134, 657–663. [Google Scholar] [CrossRef] [PubMed]
- Silva, J.; Mesquita, R.; Pinho, E.; Caldas, A.; Oliveira, M.E.C.D.R.; Lopes, C.M.; Lúcio, M.; Soares, G. Incorporation of lipid nanosystems containing omega-3 fatty acids and resveratrol in textile substrates for wound healing and anti-inflammatory applications. SN Appl. Sci. 2019, 1, 1007. [Google Scholar] [CrossRef]
- Sallustio, V.; Chiocchio, I.; Mandrone, M.; Cirrincione, M.; Protti, M.; Farruggia, G.; Abruzzo, A.; Luppi, B.; Bigucci, F.; Mercolini, L.; et al. Extraction, Encapsulation into Lipid Vesicular Systems, and Biological Activity of Rosa canina L. Bioactive Compounds for Dermocosmetic Use. Molecules 2022, 27, 3025. [Google Scholar] [CrossRef] [PubMed]
- Gebicki, J.M.; Hicks, M. Ufasomes are Stable Particles surrounded by Unsaturated Fatty Acid Membranes. Nature 1973, 243, 232–234. [Google Scholar] [CrossRef] [PubMed]
- Abruzzo, A.; Cappadone, C.; Farruggia, G.; Luppi, B.; Bigucci, F.; Cerchiara, T. Glycyrrhetinic Acid Liposomes and Hyalurosomes on Spanish Broom, Flax, and Hemp Dressings to Heal Skin Wounds. Molecules 2020, 25, 2558. [Google Scholar] [CrossRef] [PubMed]
- Grodowska, K.; Parczewski, A. Organic solvents in the pharmaceutical industry. Acta Pol. Pharm. Drug Res. 2010, 67, 3–12. [Google Scholar]
- Lim, T.K. Glycyrrhiza glabra. In Edible Medicinal and Non-Medicinal Plants; Springer: Dordrecht, The Netherlands, 2016; pp. 354–457. [Google Scholar] [CrossRef]
- Sallustio, V.; Rossi, M.; Mandrone, M.; Rossi, F.; Chiocchio, I.; Cerchiara, T.; Longo, E.; Fratini, M.; D‘Amico, L.; Tromba, G.; et al. A promising eco-sustainable wound dressing based on cellulose extracted from Spartium junceum L. and impregnated with Glycyrrhiza glabra L extract: Design, production and biological properties. Int. J. Biol. Macromol. 2024, 272, 132883. [Google Scholar] [CrossRef]
- Anitua, E.; Alonso, R.; Girbau, C.; Aguirre, J.J.; Muruzabal, F.; Orive, G. Antibacterial effect of plasma rich in growth factors (PRGF®-Endoret®) against Staphylococcus aureus and Staphylococcus epidermidis strains. Clin. Exp. Dermatol. 2012, 37, 652–657. [Google Scholar] [CrossRef]
- Shariati, A.; Moradabadi, A.; Azimi, T.; Ghaznavi-Rad, E. Wound healing properties and antimicrobial activity of platelet-derived biomaterials. Sci. Rep. 2020, 10, 1032. [Google Scholar] [CrossRef]
- Jyothi, V.G.S.; Bulusu, R.; Rao, B.V.K.; Pranothi, M.; Banda, S.; Bolla, P.K.; Kommineni, N. Stability characterization for pharmaceutical liposome product development with focus on regulatory considerations: An update. Int. J. Pharm. 2022, 624, 122022. [Google Scholar] [CrossRef] [PubMed]
- Caddeo, C.; Manconi, M.; Fadda, A.M.; Lai, F.; Lampis, S.; Diez-Sales, O.; Sinico, C. Nanocarriers for antioxidant resveratrol: Formulation approach, vesicle self-assembly and stability evaluation. Colloids Surf. B Biointerfaces 2013, 111, 327–332. [Google Scholar] [CrossRef] [PubMed]
- Zielińska, A.; Martins-Gomes, C.A.; Ferreira, N.R.; Silva, A.M.; Nowak, I.; Souto, E.B. Anti-inflammatory and anti-cancer activity of citral: Optimization of citral-loaded solid lipid nanoparticles (SLN) using experimental factorial design and LUMiSizer®. Int. J. Pharm. 2018, 553, 428–440. [Google Scholar] [CrossRef] [PubMed]
- Nalezinková, M. In vitro hemocompatibility testing of medical devices. Thromb. Res. 2020, 195, 146–150. [Google Scholar] [CrossRef] [PubMed]
- Vivcharenko, V.; Wojcik, M.; Palka, K.; Przekora, A. Highly Porous and Superabsorbent Biomaterial Made of Marine-Derived Polysaccharides and Ascorbic Acid as an Optimal Dressing for Exuding Wound Management. Materials 2021, 14, 1211. [Google Scholar] [CrossRef] [PubMed]
- Um, M.; Han, T.-H.; Lee, J.-W. Ultrasound-Assisted Extraction and Antioxidant Activ-ity of Phenolic and Flavonoid Compounds and Ascorbic Acid from Rugosa Rose (Rosa rugosa Thunb.) Fruit. Food Sci. Biotechnol. 2017, 27, 375–382. [Google Scholar] [PubMed]
- Manca, M.L.; Marongiu, F.; Castangia, I.; Catalán-Latorre, A.; Caddeo, C.; Bacchetta, G.; Ennas, G.; Zaru, M.; Fadda, A.M.; Manconi, M. Protective effect of grape extract phospholipid vesicles against oxidative stress skin damages. Ind. Crops Prod. 2016, 83, 561–567. [Google Scholar] [CrossRef]
- Castro Marin, A.; Chinnici, F. Physico-Chemical Features of Sangiovese Wine as Affected by a Post-Fermentative Treatment with Chitosan. Appl. Sci. 2020, 10, 6877. [Google Scholar] [CrossRef]
- Brand-Williams, W.; Cuvelier, M.E.; Berset, C. Use of a free radical method to evaluate antioxidant activity. LWT Food Sci. Technol. 1995, 28, 25–30. [Google Scholar] [CrossRef]
- Nusse, M.; Beisker, W.; Hoffmann, C.; Tarnok, A. flow cytometric analysis of G1- and G2/M-phase subpopulations in mammalian cell nuclei using side scatter and DNA content measurements. Cytometry 1990, 11, 813–821. [Google Scholar] [CrossRef] [PubMed]
- Oparka, M.; Walczak, J.; Malinska, D.; van Oppen, L.M.; Szczepanowska, J.; Koopman, W.J.; Wieckowski, M.R. Quantifying ROS levels using CM-H 2 DCFDA and HyPer. Methods 2016, 109, 3–11. [Google Scholar] [CrossRef] [PubMed]
- Schindelin, J.; Arganda-Carreras, I.; Frise, E.; Kaynig, V.; Longair, M.; Pietzsch, T.; Preibisch, S.; Rueden, C.; Saalfeld, S.; Schmid, B.; et al. Fiji: An open-source platform for biological-image analysis. Nat. Methods 2012, 9, 676–682. [Google Scholar] [CrossRef] [PubMed]


| Size (nm) | PDI | ζ Potential | EE% | |
|---|---|---|---|---|
| Unloaded UFAs | 219.06 ± 19.88 | 0.223 ± 0.028 | −30.24 ± 2.75 | - |
| UFAsGG | 158.96 ± 3.60 | 0.168 ± 0.021 | −30.16 ± 1.37 | 64.91 ± 3.27 |
| Unloaded AOs | 211.02 ± 7.40 | 0.217 ± 0.037 | −26.63 ± 5.16 | - |
| AOsGG | 158.19 ± 3.54 | 0.207 ± 0.039 | −28.65 ± 2.85 | 67.61 ± 5.94 |
Disclaimer/Publisher’s Note: The statements, opinions and data contained in all publications are solely those of the individual author(s) and contributor(s) and not of MDPI and/or the editor(s). MDPI and/or the editor(s) disclaim responsibility for any injury to people or property resulting from any ideas, methods, instructions or products referred to in the content. |
© 2024 by the authors. Licensee MDPI, Basel, Switzerland. This article is an open access article distributed under the terms and conditions of the Creative Commons Attribution (CC BY) license (https://creativecommons.org/licenses/by/4.0/).
Share and Cite
Rossello, S.; Mandrone, M.; Cerchiara, T.; Chiocchio, I.; Rossi, M.; Chinnici, F.; Sallustio, V.; Aponte, M.; Blaiotta, G.; Luppi, B.; et al. A New Wound-Healing Tool Based on Glycyrrhiza glabra Extract-Loaded Ufasomes on Spanish Broom Dressings. Molecules 2024, 29, 3811. https://doi.org/10.3390/molecules29163811
Rossello S, Mandrone M, Cerchiara T, Chiocchio I, Rossi M, Chinnici F, Sallustio V, Aponte M, Blaiotta G, Luppi B, et al. A New Wound-Healing Tool Based on Glycyrrhiza glabra Extract-Loaded Ufasomes on Spanish Broom Dressings. Molecules. 2024; 29(16):3811. https://doi.org/10.3390/molecules29163811
Chicago/Turabian StyleRossello, Simone, Manuela Mandrone, Teresa Cerchiara, Ilaria Chiocchio, Martina Rossi, Fabio Chinnici, Valentina Sallustio, Maria Aponte, Giuseppe Blaiotta, Barbara Luppi, and et al. 2024. "A New Wound-Healing Tool Based on Glycyrrhiza glabra Extract-Loaded Ufasomes on Spanish Broom Dressings" Molecules 29, no. 16: 3811. https://doi.org/10.3390/molecules29163811
APA StyleRossello, S., Mandrone, M., Cerchiara, T., Chiocchio, I., Rossi, M., Chinnici, F., Sallustio, V., Aponte, M., Blaiotta, G., Luppi, B., Abruzzo, A., Bigucci, F., & Cappadone, C. (2024). A New Wound-Healing Tool Based on Glycyrrhiza glabra Extract-Loaded Ufasomes on Spanish Broom Dressings. Molecules, 29(16), 3811. https://doi.org/10.3390/molecules29163811