Article

Tailoring Energy Transfer in Mixed Eu/Tb Metal–Organic Frameworks for Ratiometric Temperature Sensing

1
Jiangsu Key Laboratory of Advanced Catalytic Materials and Technology, Changzhou University, Changzhou 213164, China
2
Xinjiang Key Laboratory for Luminescence Minerals and Optical Functional Materials, School of Physics and Electronic Engineering, Xinjiang Normal University, Urumqi 830054, China
*
Authors to whom correspondence should be addressed.
Molecules 2024, 29(16), 3914; https://doi.org/10.3390/molecules29163914
Submission received: 15 July 2024 / Revised: 7 August 2024 / Accepted: 15 August 2024 / Published: 19 August 2024

Abstract

:
Eu/Tb metal–organic frameworks (Eu/Tb-MOFs), exhibiting Eu3+ and Tb3+ emissions, stand out as some of the most fascinating luminescent thermometers. As the relative thermal sensitivity model is limited to its lack of precision for fitting ratio of Eu3+ and Tb3+ emissions, accurately predicting the sensing performance of Eu/Tb-MOFs remains a significant challenge. Herein, we report a series of luminescent Eu/Tb-MOF thermometers, EuxTb1−xL, with excellent thermal sensitivity around physiological levels, achieved through the tuning energy transfer from ligands to Eu3+ and Tb3+ and between the Ln ions. It was found that the singlet lowest-energy excited state (S1) of the ligand and the higher triplet energy level (Tn) are crucial in the energy transfer processes of ligand→Tb3+ and ligand→Eu3+. This enables EuxTb1−xL to serve as an effective platform for exploring the impact of these energy transfer processes on the temperature-sensing properties of luminescent Eu/Tb-MOF thermometers. The relative thermal sensitivity is comparable to that of dual-center MOF-based luminescent thermometers operating at physiological levels. This study provides valuable insights into the design of new Eu/Tb thermometers and the accurate prediction of their sensing performance.

1. Introduction

Precision temperature sensing is vital in various fields, such as large-area temperature mapping, biology, and chemical reaction monitoring [1,2,3,4,5,6,7,8,9,10]. Lanthanide metal–organic frameworks (Ln-MOFs), crystalline porous materials constructed from lanthanide nodes and organic ligands, have garnered significant interest in luminescence thermometry [11,12,13,14,15,16,17,18]. Among the various Ln-MOF-based luminescent thermometers, Eu/Tb-MOFs [19,20,21,22,23,24,25,26,27,28,29,30,31] are frequently used to determine the temperature based on the ratio between the integrated intensities of the 5D47F5 and 5D07F2 transitions of Tb3+ and Eu3+, respectively. Due to the diverse organic ligands available, many Eu/Tb-MOFs with high relative thermal sensitivity have been reported, functioning across temperature ranges from cryogenic to physiological. Over the past decade, some efforts have been dedicated to fine-tuning the temperature-sensing properties of Eu/Tb-MOFs. However, the observed thermal-responsive luminescence involves complex energy transfer processes between ligands and Tb3+/Eu3+ ions, as well as from Tb3+ to Eu3+. Consequently, a general model with which to precisely predict the temperature-sensing properties of these thermometers has not yet been proposed. As a result, many exceptional Eu/Tb-MOF thermometers are still being discovered serendipitously, and rationalizing their relative thermal sensitivity and operating temperature range remains a significant challenge in the field.
Given that excited-state calculations of Eu/Tb-MOFs are time-consuming, the Mott–Seitz model is frequently employed as a rapid experimental approach to rationalize the thermal quenching of luminescence in these materials [32,33,34]. However, a significant limitation of the Mott–Seitz model is its lack of precision when used to fit the ratio between the integrated intensities of Tb3+ and Eu3+ emissions in Eu/Tb materials. This shortcoming is often attributed to the empirical observation [35,36,37,38,39,40] that Tb3+ emission is influenced by the energy difference (ΔET) between the triplet lowest-energy excited state (T1) of the ligand and the lowest emitting levels of Tb3+. Conversely, the model assumes that the Eu3+ transition is unaffected by temperature variations. Consequently, the integrated intensity ratio is predominantly determined by ΔET. However, this prediction is not consistently observed in practical applications. In addition to T1, higher energy levels of ligands, such as the singlet lowest-energy excited state (S1), may also play a crucial role in the energy transfer processes between the ligand and Tb3+/Eu3+ in certain Eu/Tb-MOFs. Moreover, recent findings indicate that Eu3+ content is another significant structural factor. Therefore, considerable efforts are still needed to explore the contributions of energy transfers between the higher energy levels of ligands and Tb3+/Eu3+, as well as the impact of Eu3+ content on the temperature-sensing performance of Eu/Tb-MOF thermometers.
Herein, we report the investigation of TbL and EuxTb1−xL (x = 0.0001, 0.0005, and 0.001). Aiming to bridge the gap between the composition of Eu/Tb-MOFs and their desired thermometric performance, we examined the temperature-dependent luminescence of TbL and EuxTb1−xL. This study demonstrates that energy transfer likely occurs from S1 and higher triplet energy levels (Tn) of the ligand to Tb3+ or Eu3+ and establishes how to optimize the thermometric performance of EuxTb1−xL by selecting appropriate ligands and adjusting Eu3+ content. The results offer valuable insights for further improvements in the rational design of Eu/Tb-MOF luminescent thermometers, enabling their effective operation across temperature ranges from cryogenic to physiological levels.

2. Results and Discussion

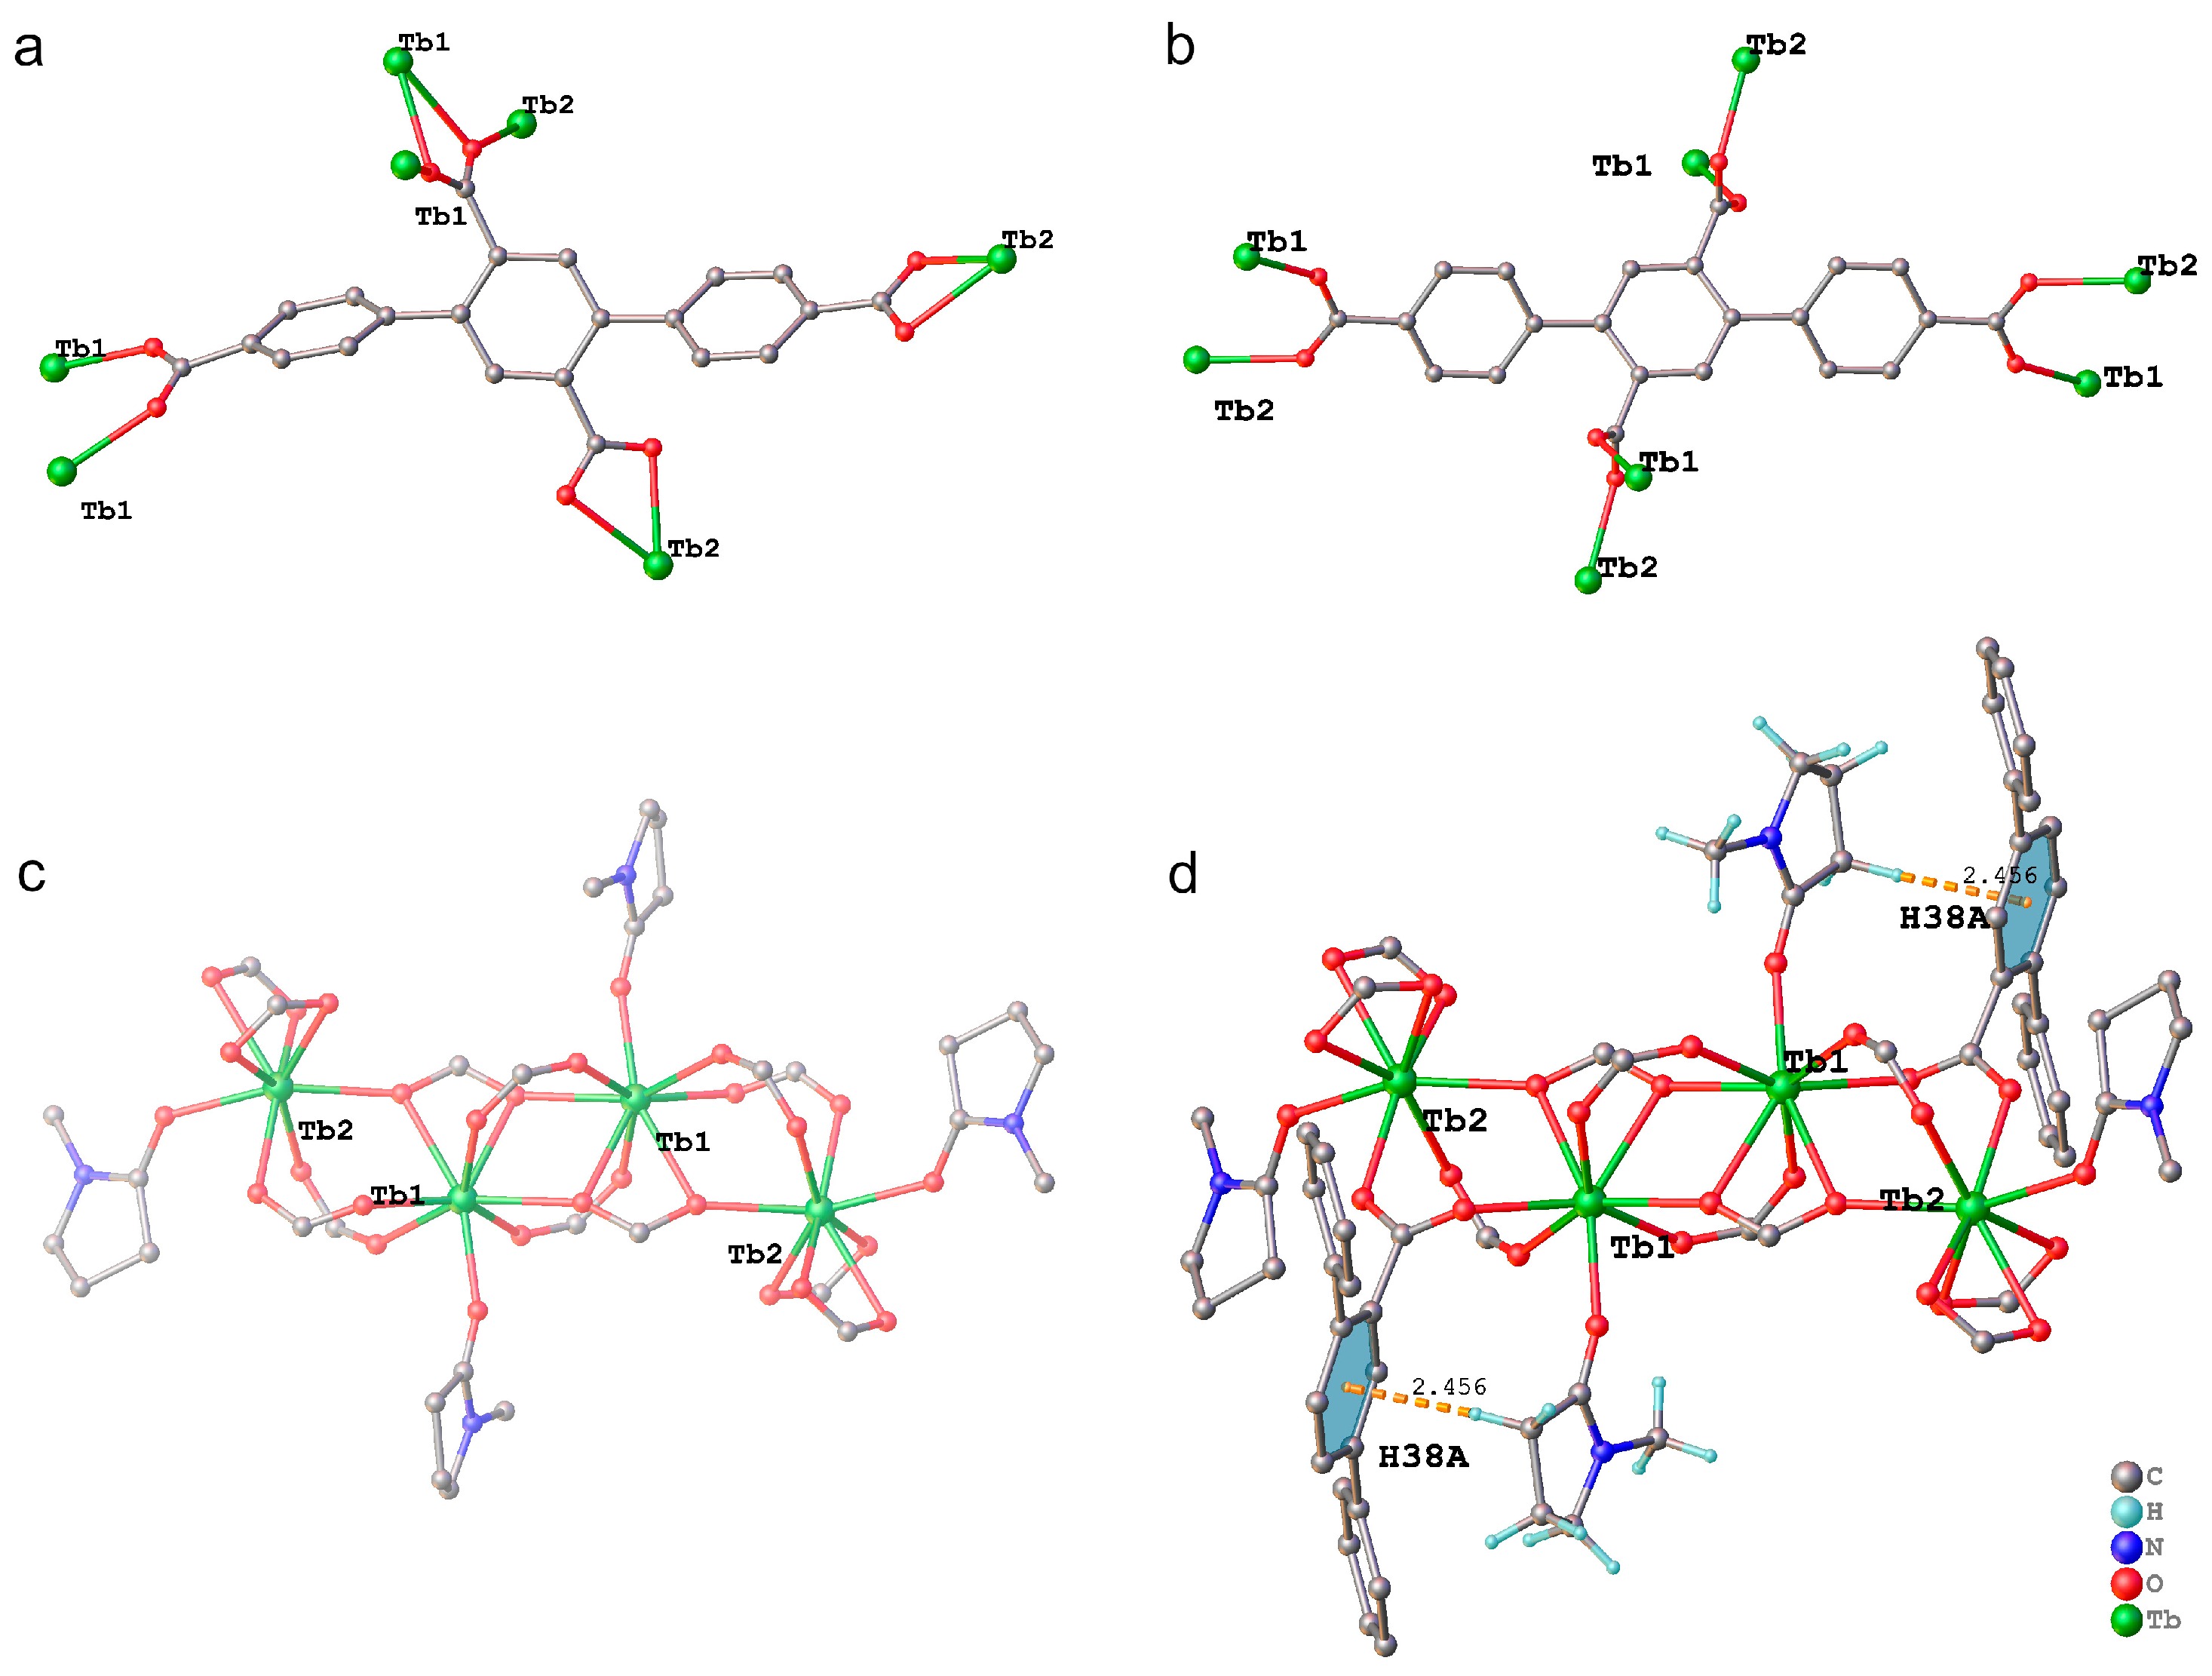
2.1. Structural Properties of TbL and EuxTb1−xL

In recent years, we have reported the structural and luminescence properties of a Tb-MOF and a series of Eu/Tb-MOFs based on a tetracarboxylic acid ([1,1:4,1-terphenyl]-2,4,4,5-tetracarboxylic acid, H4L) [41], referred to as TbL and EuxTb1−xL, respectively. Despite the triplet excited-state energy of H4L (20,661 cm−1) being very close to the 5D4 energy level of Tb3+ (20,500 cm−1), TbL emits bright green light originating from Tb3+ upon UV excitation. For EuxTb1−xL, both the 5D47F5 transition of Tb3+ and the 5D07F2 transition of Eu3+ are observed in the emission spectra. These results make EuxTb1−xL an excellent platform to investigate the effects of S1, Tn, and Eu3+ content on temperature-sensing properties.
TbL and EuxTb1−xL are in soluble in water and common organic solvents such as methanol and ethanol. Figure 1 shows the coordination environment of Tb3+ ions, L4− ligands, and supramolecular interactions within the crystal structure of TbL. The asymmetric unit of TbL includes two crystallographically unique Tb3+ ions (Tb1 and Tb2), two L4− ligands (one of which is on the inversion center), and two coordinated NMP molecules. As shown in Figure 1a,b, there exist μ7 and μ8 coordination modes for the ligand. Two Tb1 and two Tb2 are linked by 12 carboxylates and 4 NMP to form the Tb4(COO)12·4NMP cluster (Figure 1c). Importantly, a C-H···π hydrogen bond with a 2.456 Å H···Cg length (C38-H38A→Cg8) was observed between the ligand on the inversion center and the NMP molecule coordinated with Tb1 (Figure 1d). In contrast, π-π stacking was not observed. This result indicates that Tb3+ emission is sensitized by excited ligand monomers. The structures of TbL and EuxTb1−xL were confirmed by powder X-ray diffraction (PXRD) (Figure S1), thermogravimetric analysis (TGA) (Figure S2), and Fourier transform infrared (FT-IR) spectroscopy (Figure S3). For TbL and EuxTb1−xL, TGA curves were very similar in the temperature range from room temperature to 723 K. At higher temperatures, the TGA curves of two compounds with x = 0.0001 and 0.0005 were different from the other ones. This is probably due to complex phase changes in combustion of the ligand molecules in the temperature range. The characteristic IR absorption bands of amide C=O vibration and sp3 C−H vibration in NMP are observed around 1670 and 2890 cm−1, respectively. The IR spectra difference, near 3500 cm−1, between the compounds resulted from adsorbed water on the surface of particles. These results demonstrate that the samples of TbL and EuxTb1−xL (x = 0.0001, 0.0005, and 0.001) are essentially pure phases.

2.2. Photoluminescence Properties of TbL and EuxTb1−xL

As reported in prior research, the ΔET of TbL is only 161 cm−1, which contradicts the empirical rule. To investigate the excited states of the ligand, we examined the luminescence properties of the ligand. Concentration-dependent 3D photoluminescence (PL) spectra of H4L were recorded at room temperature and identified as ligand monomer emissions. As depicted in Figure 2a–d, the maximum excitation wavelengths of the H4L ligand in solutions shift from 318 nm to 353 nm as the concentrations increase from 10−4 to 10−2 M, while the emission peaks remain at 387 nm. The S1 state of H4L molecules is thus determined to be 27,400 cm−1. For solid H4L, the emission maximum redshifts to 442 nm and the excitation maximum to 392 nm, likely due to molecular packing effects.
Next, phosphorescence spectra of the ligand were recorded at 77 K in the solid state upon excitation from 260 nm to 365 nm (Figure 2e,f). The band at 526 nm was assigned to T1, and the weak band around 420 nm, ~23,800 cm−1, was attributed to the ligand’s Tn state. The energy difference between the Tn state and the emitting level 5D4 is approximately 3300 cm−1, suggesting that the Tn5D4 energy transfer might also contribute to the observed bright TbL emission. Therefore, we speculate that TbL emission may result from S1 and higher triplet energy levels of the ligand. A recent example of S1→Ln3+ energy transfer was reported by Jérôme Long and Luís D. Carlos et al., in which the intramolecular energy transfer rates of [Ln(bpy)2(NO3)3] (bpy—2,2′-bipyridine; Ln—Tb or Eu) [26] were determined. At temperatures above 125 K, the S1→Eu3+ channel dominates the sensitization of the 5D0 level.

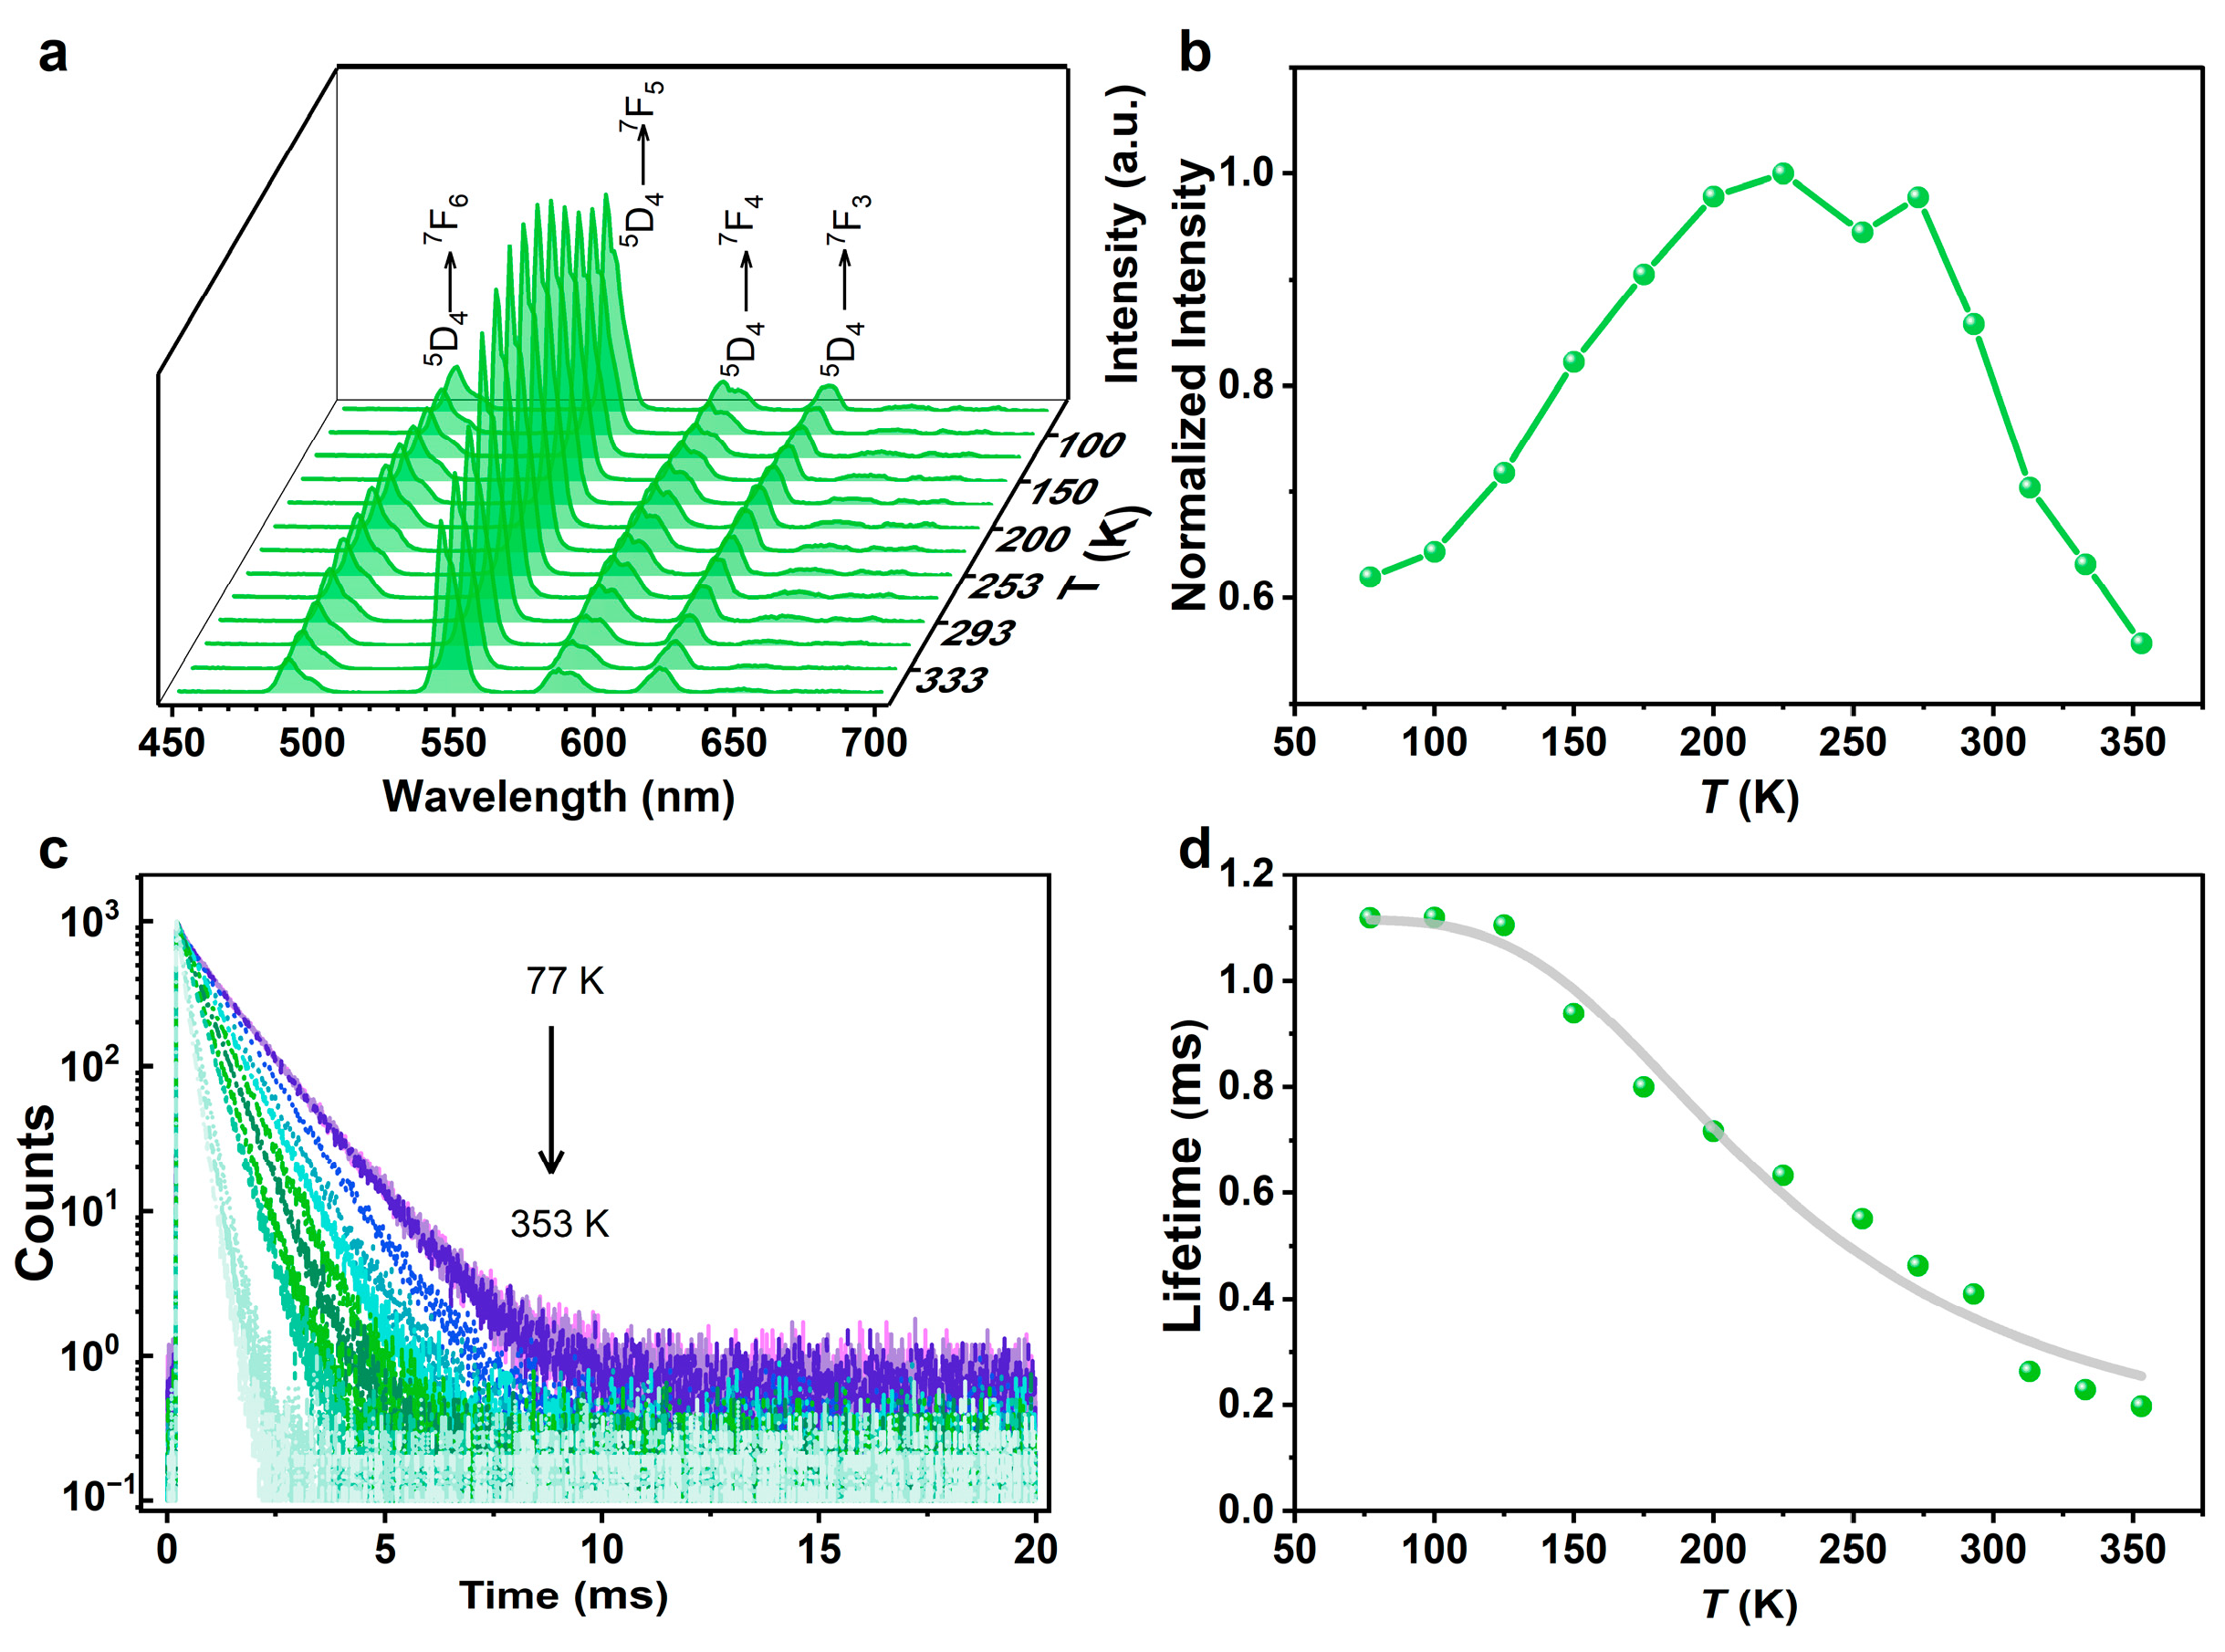
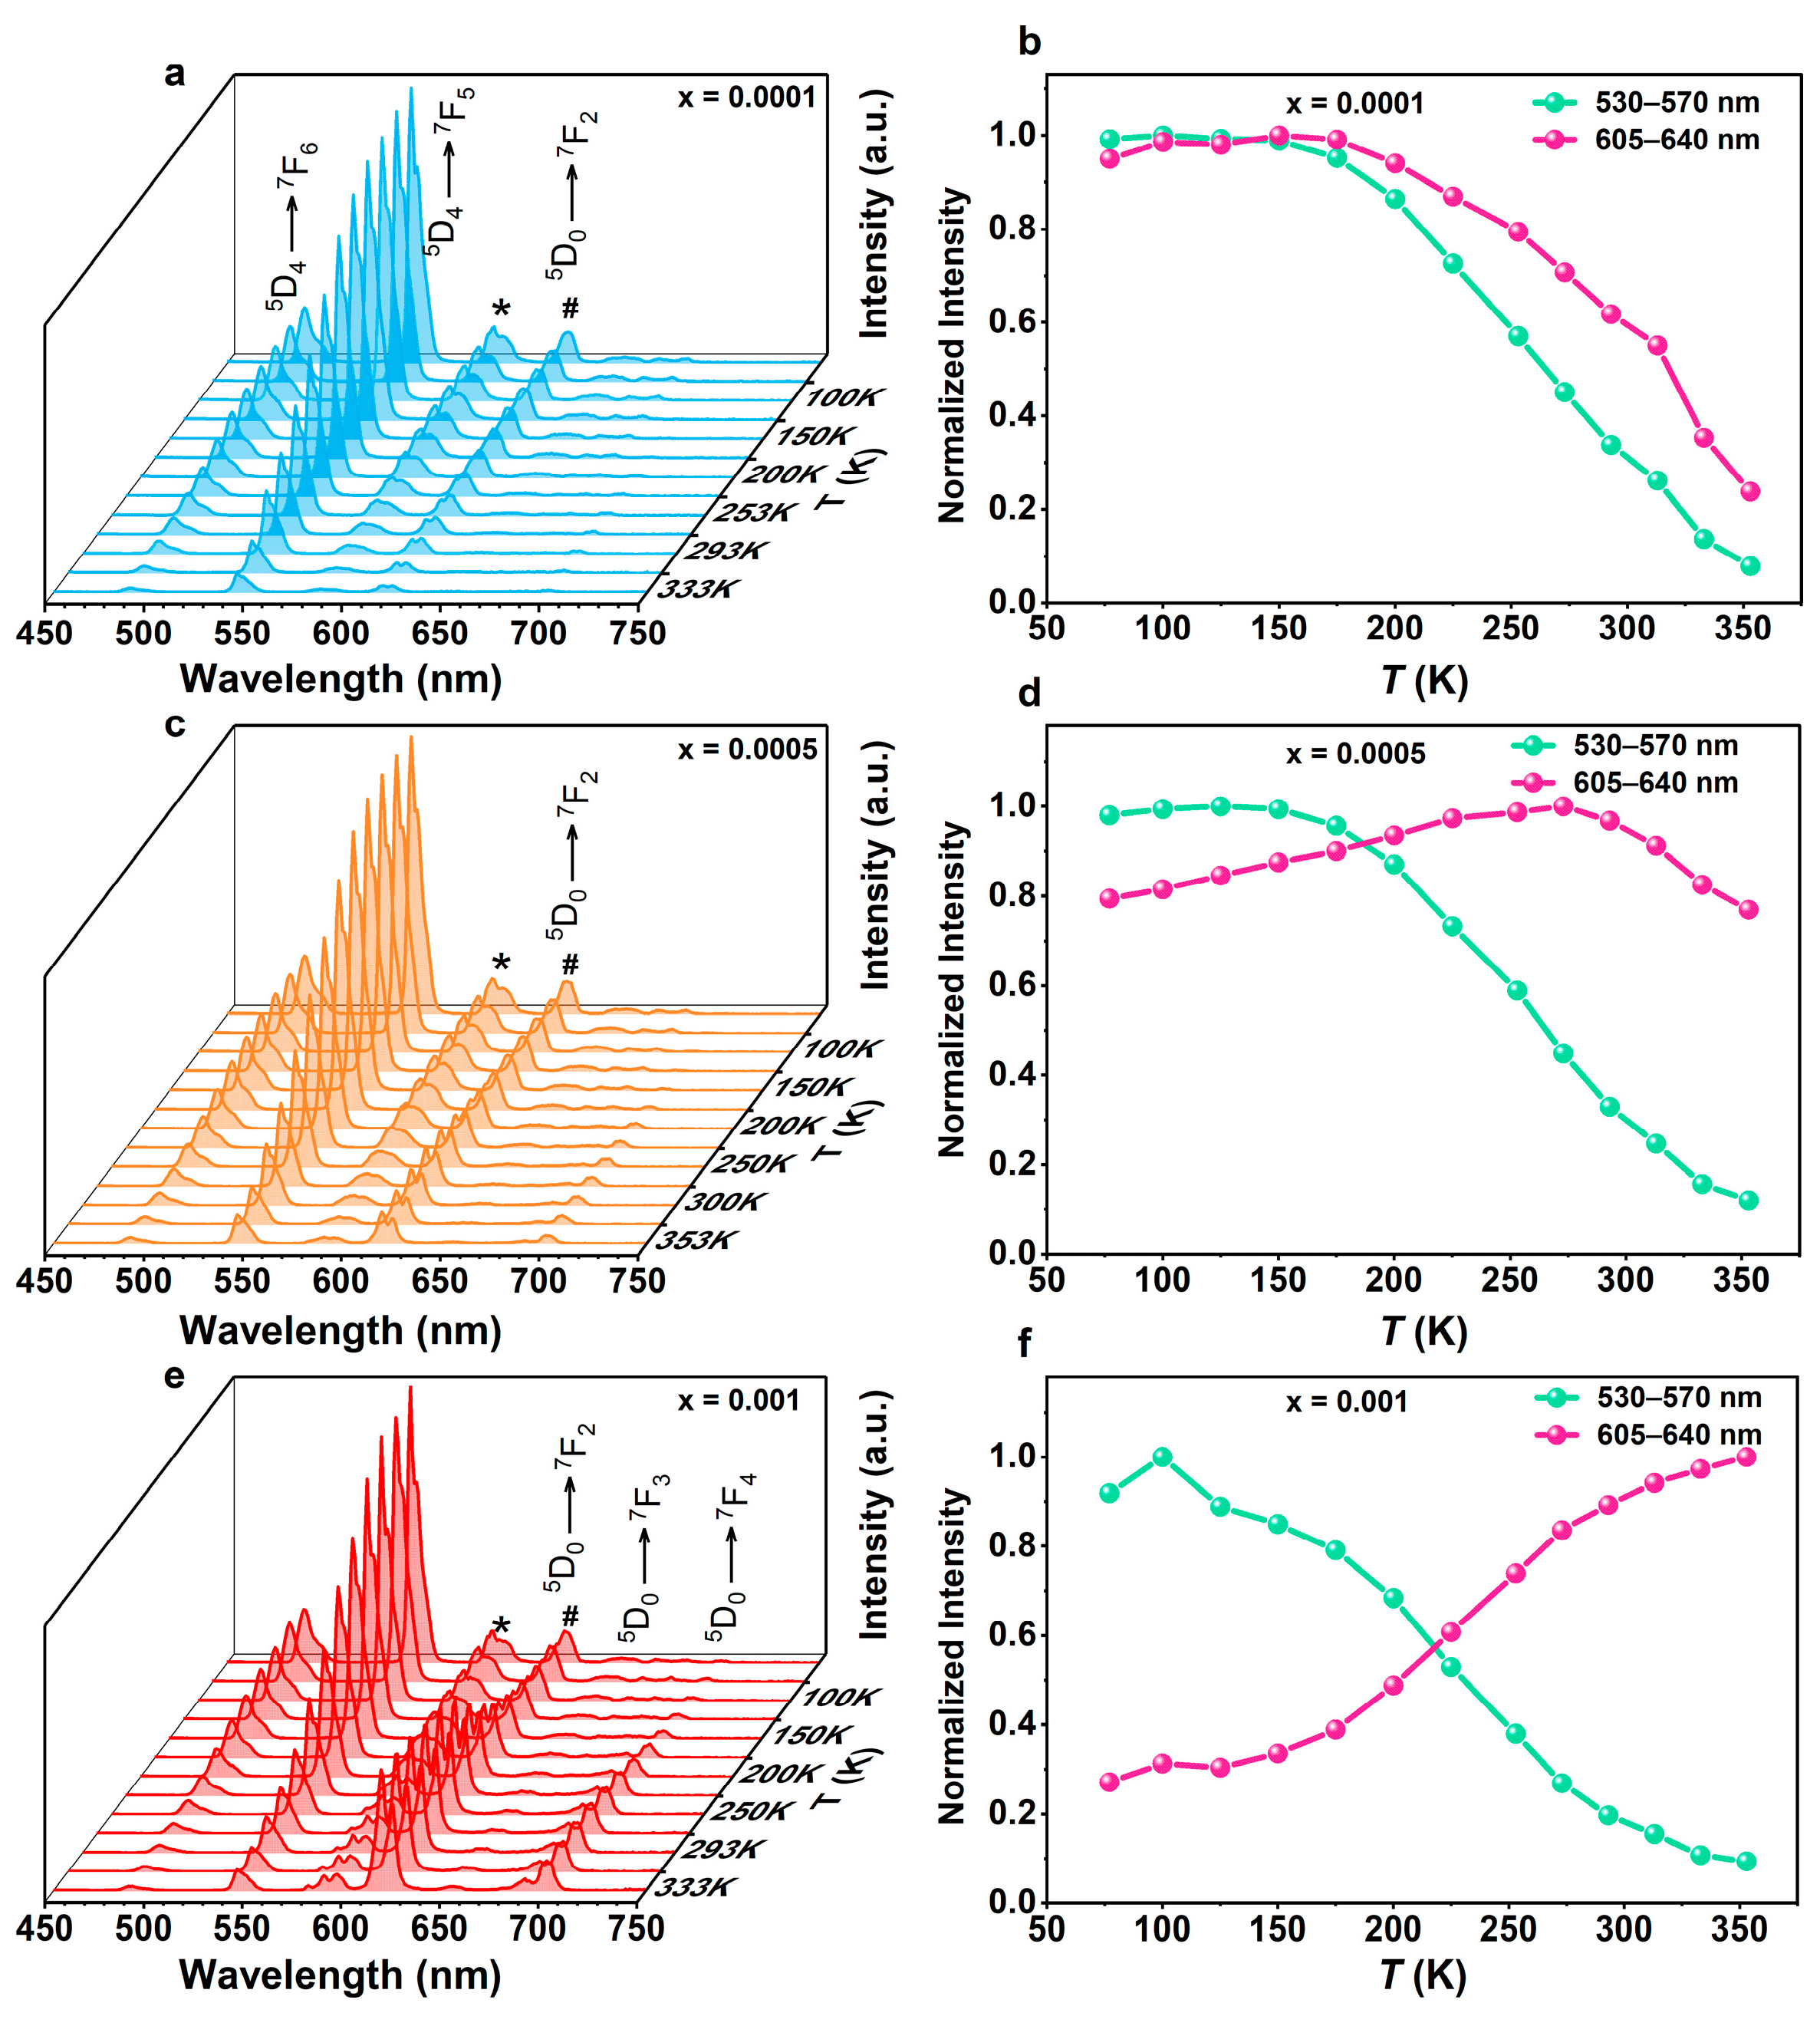
2.3. Temperature-Dependent Photoluminescence Properties of TbL and EuxTb1−xL

To rationalize the energy diagram of this system, we consider the energy transfer from the ligand to Tb3+ and the backward energy transfer from Tb3+ to the ligand in relation to the temperature-dependent 5D4 emissions and lifetime. Upon excitation at 351 nm, TbL shows typical emissions around 488, 542, 583, and 621 nm, corresponding to the 5D47F6–3 transitions (Figure 3a). The relative intensities of the 5D47F5 (ITb) transitions were quantified by integrating the emission spectra between 530 and 570 nm. The ITb exhibited negative thermal quenching in the range of 77–225 K, with a 63% increase, and mild thermal quenching in the range of 22–353 K, with an ≈42% decrease (Figure 3b). The temperature sensitivity of TbL is much lower than that of (Me2NH2)3[Ln3(FDC)4(NO3)4]·4H2O (H2FDC = 9-fluorenone-2,7-dicarboxylic acid) [36], with a prior sample showing low ΔET, suggesting a low backward energy transfer rate for TbL. As the first ΔET-driven single-lanthanide organic framework ratiometric luminescent thermometer, (Me2NH2)3[Ln3(FDC)4(NO3)4]·4H2O showed extreme Eu3+ emission thermal quenching with increasing temperature. This result aligns with the small energy difference (553 cm−1) between the H2FDC triplet excited state (17,794 cm−1) and the 5D0 Eu3+ level (17,241 cm−1), indicating a strong thermally activated ion-to-ligand backward energy transfer. We obtained the activation energies for the nonradiative channels of (Me2NH2)3[Ln3(FDC)4(NO3)4]·4H2O and found that the values match the experimentally observed energy difference, proving that ion-to-ligand backward energy transfer is the dominant pathway for Eu3+ emission thermal quenching. These results suggest that the empirical observations overestimate the contribution of T1 level to energy transfer between ligands and Ln3+ in certain Ln-MOFs.
Figure 3c shows the temperature-dependent 5D4 decay curves of TbL, which can only be accurately represented by biexponential decay functions, possibly due to the presence of two distinct Tb3+ local sites. The determined lifetimes range from 1118 to 198 μs between 77 and 353 K. As it is beyond the scope of the present paper to solve the energy transfer rate and backward energy transfer rate between the S1, Tn, T1, and 5D4 levels, we adopted the empirical Mott–Seitz model here.
τ ( T ) = τ 0 1 + α · e x p ( E k B T )
We used the empirical Mott–Seitz model to fit the temperature-dependent 5D4 lifetimes (Figure 3d) in the 77–353 K range with R2 = 0.98. Here, τ0 represents the lifetimes of the Tb3+ local sites at T = 0 K, α is the ratio between the nonradiative (T = 0 K) and radiative rates, ΔE represents the activation energy for the nonradiative channels of Tb3+, kB is the Boltzmann constant, and T is the absolute temperature. τ0, α, and ΔE are determined to be 1115 μs, 36.8, and ≈500–600 cm−1, respectively. Comparing the energy barrier value extracted from the phosphorescence spectrum (161 cm−1) with that resulting from the Mott–Seitz analysis, we observed a factor of ≈3 between them. This discrepancy might have arisen because of (i) the presence of forward and backward energy transfer between the S1 or higher triplet energy levels of the ligand and Tb3+ in TbL and (ii) the fact that the Mott–Seitz model generally overestimates the energy barrier value.
According to the results, it is reasonable to assume that the S1 and Tn are involved in the luminescence of EuxTb1−xL as much as the T1 state is. Thus, exploring EuxTb1−xL could provide a good platform to construct luminescent thermometers with tunable relative thermal sensitivity and operating temperature ranges and to study the contributions of multiple energy transfers and Eu3+ content to the temperature-sensing performance of Eu/Tb-MOF thermometers. The room temperature photoluminescence (PL) excitation spectra of EuxTb1−xL were monitored at the 5D47F5 (Tb3+) transition (Figure S3a, Supporting Information), and all excitation spectra were dominated by a broad band around 340 nm, attributed to the ligand’s singlet excited state. The emission spectra of EuxTb1−xL (77–353 K) consisted of characteristic 5D47F6–3 transitions of Tb3+ and 5D07F0−4 transitions of Eu3+ (see Figure S3b). The relative intensities of the 5D47F5 (ITb) and 5D07F2 (IEu) transitions were quantified by integrating the emission spectra between 530–570 nm and 605–640 nm, respectively. To determine absolute temperature, ITb serves as the temperature probe while IEu acts as the reference due to their strong PL intensities, thus enabling precise temperature determination.
For the EuxTb1−xL samples, while the Tb3+ emissions followed typical Mott–Seitz model curves across the entire temperature range, the Eu3+ emissions displayed very distinct temperature dependence. For the sample with x = 0.0001 (Figure 4a,b), the Tb3+ and Eu3+ emissions remained relatively constant in the range of 77–175 K, followed by decreases of approximately 92% and 75% up to 353 K, respectively. For the sample with higher Eu3+ content (x = 0.0005), the Tb3+ emissions underwent typical thermal quenching, decreasing by approximately 88% up to 353 K. Meanwhile, the Eu3+ emissions displayed negative thermal quenching in the range of 77–253 K (Figure 4c,d), with an increase of approximately 26% followed by a decrease of approximately 23% up to 353 K. With increasing Eu3+ content (x = 0.001), the Eu3+ emissions showed stronger negative thermal quenching, rising by ≈270% up to 353 K (Figure 4e,f), while the Tb3+ emissions decreased by ≈90% up to 353 K. This indicates that the thermal sensitivity of Eu3+ emissions progressively increases with rising Eu3+ content, making EuxTb1−xL excellent candidates for ratiometric thermometers with tunable thermometric performances.
Here, the ratio of 5D47F5 transition to IEu was used to define the thermometric parameter Δ = ITb/IEu. We note that while ITb corresponds only to the 5D47F5 transition, the IEu integration range includes a small contribution from the Tb3+ 5D07F3 transition. Nevertheless, all the thermometric parameters of the EuxTb1−xL samples were fitted to an empirical sigmoidal Boltzmann function,
= I T b I E u = A 1 A 2 1 + e T T 0 d T + A 2
where I(Tb) is the emission intensity in the wavelength range of 530–570 nm, I(Eu) is the emission intensity in the wavelength range of 605–640 nm, A1 represents the maximum emission intensity and A2 represents the minimum emission intensity, T0 is the temperature at which the emission intensity reaches half of A1, and T is the absolute temperature. The fit results show R2 > 0.999, implying that the thermometer performance was unaffected by the presence of the 5D07F3 transition. This holds true for all the Eu3+ contents studied in this study. Therefore, in the following analysis, we considered the commonly assumed labeling of IEu as being solely due to the 5D07F2 contribution. Figure 5a displays the calibration curves of EuxTb1−xL samples within the temperature range of 77–353 K under 335 nm excitation. The fitting parameters for the EuxTb1−xL compounds are listed in Table 1 and show a nearly constant Δ0 and an increase in T0 as the Eu3+ content increased. By increasing the amount of Eu3+ from x = 0.0001 to 0.001, a shift of 95 K toward lower temperatures was observed in T0.
The relative sensitivity was employed to compare the performance of this model with those of similar thermometers reported in previous studies, defined as
S r = 1 · T
The maximum relative temperature sensitivities of the thermometers were 0.86% K−1 at 333 K, 1.42% K−1 at 293 K, and 2.11% K−1 at 273 K for, respectively, the samples with x from 0.0001 to 0.001 (Figure 5b). Intriguingly, in the physiological range, the relative sensitivities were still above 1.3% K−1 for the sample with x = 0.0005 and 1.5% K−1 for the sample with x = 0.001, while the corresponding temperature uncertainties were estimated from
δ T = 1 S r · δ
yielding the values of 0.08 K for the sample with x = 0.0005 and 0.07 K for the sample with x = 0.001 at 313 K (Figure 5c). This variation in the Sr is partially explained by the increase in the nonradiative decay rate of the Tb3+ 5D47F5 transition (relatively to the radiative one) with the increase in Eu3+ doping.

2.4. Energy Transfer

To rationalize the thermal dependence of the luminescence of the materials, we further analyzed the energy transfer from Tb3+ ions to Eu3+ ions using the sample with x = 0.001 as an example. Generally, the long distances between these ions may result in low rates that cannot compete with the ligand-to-Ln3+ rates, which are orders of magnitude higher. The thermal dependence of the Tb3+ and Eu3+ lifetimes was investigated by monitoring the emission decay curves of the 5D47F5 and 5D07F2 transitions (Figure 5d,e), respectively. All the decay curves are well modeled and show that the 5D0 lifetime remains stable up to 1289 μs at 175 K, slightly decreasing to 1104 μs at 353 K. As the temperature rose from 77 K to 353 K, the 5D4 lifetime progressively decreased from 1239 μs to 127 μs, remaining nearly independent of the Eu3+ doping until T > 175 K (Figure 5f). Notably, a rise time, dependent on the temperature, occurred in the 5D0 emission decay curves in the temperature range from 175 K to 353 K (Figure 5e). This rise time was also observed in [Ln(bpy)2(NO3)3] by Jérôme Long and Luís D. Carlos et al. [26] and was found to be similar to the 5D4 lifetime. This implies that the 5D4 level could support Tb3+-Eu3+ energy transfer within Eu0.001Tb0.999L above 175 K.

3. Materials and Methods

3.1. Materials and Characterization

All chemicals used in this work were commercially available and used without further purification. The X-ray powder diffraction (PXRD) patterns were collected using a D/MAX 2500/PC powder diffractometer (Rigaku, Tokyo, Japan) equipped with a Cu Kα radiation source, covering a 2θ range of 5–50°. The FT-IR spectra of samples embedded in KBr pellets were recorded using a PerkinElmer FT-IR spectrometer. Thermogravimetric analysis (TGA) was conducted on a TG/DTA 6300 thermal gravimetric analyzer (Hitachi, Tokyo, Japan) at a constant rate of 10 K/min. Room temperature luminescence spectra were obtained using an FS5 steady-state transient fluorescence spectrometer with a 150 W CW ozone-free xenon lamp. Temperature-dependent luminescence spectra were collected using an FLS1000 photoluminescence spectrometer (Edinburgh Instruments Ltd., Livingston, UK) with a 300 W CW ozone-free xenon lamp.

3.2. Preparation of [Tb2L1.5(NMP)2]n (TbL)

A solution of H4L was prepared by dissolving H4L (0.2 mmol, 81.2 mg) in 24 mL of N-methyl-2-pyrrolidone (NMP), and a Tb(NO3)3 solution was prepared by dissolving Tb(NO3)3·6H2O (0.4 mmol, 180.5 mg) in 24 mL of H2O. These two solutions were then mixed in a 100 mL Teflon-lined stainless-steel autoclave, followed by the addition of 200 μL of concentrated hydrochloric acid. The mixture was sealed and maintained at 433 K for 3 days. After the autoclave was gradually cooled to room temperature, colorless rhombic crystals of TbL (Yield: 65%) were obtained by filtration after washing with ethanol three times.

3.3. Preparation of EuxTb1−xL (x = 0.0001, 0.0005, and 0.001)

EuxTb1−xL (x = 0.0001, 0.0005, and 0.001) samples were prepared using a method similar to that used for TbL, with the exception that the Tb(NO3)3·6H2O solution was replaced with a mixture of Eu(NO3)3·6H2O (x⋅24 mL) and Tb(NO3)3·6H2O (24(1−x) mL) solutions.

4. Conclusions

This study offers a thorough analysis and explanation of the luminescence mechanisms of TbL and the fine-tuning of the temperature sensitivity of EuxTb1−xL thermometers. Different from the luminescence mechanisms of similar mixed Eu/Tb-MOFs, the S1 and higher triplet energy levels of the ligand are involved in the sensitization of Tb3+ emission. Therefore, the judicious choice of ligand and Eu3+ content makes EuxTb1−xL excellent thermometers, with a relative thermal sensitivity comparable to those of similar mixed Eu/Tb-MOF-based luminescent thermometers operating across a temperature range from cryogenic to physiological. Additionally, the analysis of the luminescence lifetimes of the sample with x = 0.001 provides a clear understanding of the temperature dependence of the luminescence spectra. Furthermore, this approach serves as a platform that can be leveraged to guide the design of new Eu/Tb thermometers based on dual-emissive centers. The results enable lots of neglected similar materials to show luminescent temperature-sensing properties. Notably, since the precise prediction of multiple-energy-level-involved luminescence is complex within mixed Eu/Tb-MOFs, it is still a challenge to design similar materials.

Supplementary Materials

The following supporting information can be downloaded at: https://www.mdpi.com/article/10.3390/molecules29163914/s1, including the data for other structural characterizations, powder XRD patterns, IR spectra, TGA curves and PL spectra. Figure S1: PXRD patterns of TbL and EuxTb1−xL (x = 0.0001, 0.0005, and 0.001). Figure S2: Thermal gravimetric curves of TbL and EuxTb1−xL (x = 0.0001, 0.0005, and 0.001). Figure S3: The IR spectra of TbL and EuxTb1−xL (x = 0.0001, 0.0005, and 0.001). Figure S4: Excitation spectra and emission spectra of EuxTb1−xL (x = 0.0001, 0.0005, and 0.001).

Author Contributions

L.L. conceived the idea and designed the experiments. H.T. and S.C. carried out laboratory research and wrote drafts of the manuscript. Z.Z. and J.Q. participated in data analysis. M.H. afforded major revisions. All authors have read and agreed to the published version of the manuscript.

Funding

This work was financially supported by the Tianchi Talent Foundation of Xinjiang Uygur Autonomous Region, Natural Science Foundation of Xinjiang Uygur Autonomous Region (2022D01B116), and National Natural Science Foundation of China (21905132, 12175024). The Qinglan Project of Jiangsu Province is also acknowledged.

Institutional Review Board Statement

Not applicable.

Informed Consent Statement

Not applicable.

Data Availability Statement

All data generated or analyzed during this study are included in this published article and its Supplementary Information Files.

Acknowledgments

We thank all participants who contributed to this study. We express our sincere appreciation to the reviewers for their constructive comments.

Conflicts of Interest

The authors declare no conflicts of interest.

References

  1. Geitenbeek, R.G.; Nieuwelink, A.; Jacobs, T.S.; Salzmann, B.B.V.; Goetze, J.; Meijerink, A.; Weckhuysen, B.M. In Situ Luminescence Thermometry To Locally Measure Temperature Gradients during Catalytic Reactions. ACS Catal. 2018, 8, 2397–2401. [Google Scholar] [CrossRef] [PubMed]
  2. Sun, J.; Rijckaert, H.; Maegawa, Y.; Inagaki, S.; Van Der Voort, P.; Kaczmarek, A.M. Luminescent Nanorattles Based on Bipyridine Periodic Mesoporous Organosilicas for Simultaneous Thermometry and Catalysis. Chem. Mater. 2022, 34, 3770–3780. [Google Scholar] [CrossRef]
  3. Guo, H.; Raj, J.; Wang, Z.; Zhang, T.; Wang, K.; Lin, L.; Hou, W.; Zhang, J.; Wu, M.; Wu, J.; et al. Synergistic Effects of Amine Functional Groups and Enriched-Atomic-Iron Sites in Carbon Dots for Industrial-Current–Density CO2 Electroreduction. Small 2024, 20, 2311132. [Google Scholar] [CrossRef]
  4. Guo, H.; Zhou, L.; Huang, K.; Li, Y.; Hou, W.; Liao, H.; Lian, C.; Yang, S.; Wu, D.; Lei, Z.; et al. Nitrogen-Rich Carbon Dot-Mediated N→π* Electronic Transition in Carbon Nitride for Superior Photocatalytic Hydrogen Peroxide Production. Adv. Funct. Mater. 2024, 2402650. [Google Scholar] [CrossRef]
  5. Jiang, X.; Dong, Z.; Miao, X.; Wang, K.; Yao, F.; Gao, Z.; Mi, B.; Yi, Y.; Yang, G.; Qian, Y. Fabrication of Flexible High-Temperature Film Thermometers and Heat-Resistant OLEDs Using Novel Hot Exciton Organic Fluorophores. Adv. Funct. Mater. 2022, 32, 2205697. [Google Scholar] [CrossRef]
  6. Maturi, F.E.; Brites, C.D.S.; Silva, R.R.; Nigoghossian, K.; Wilson, D.; Ferreira, R.A.S.; Ribeiro, S.J.L.; Carlos, L.D. Sustainable Smart Tags with Two-Step Verification for Anticounterfeiting Triggered by the Photothermal Response of Upconverting Nanoparticles. Adv. Photon. Res. 2022, 3, 2100227. [Google Scholar] [CrossRef]
  7. Xu, Y.; Hou, W.; Huang, K.; Guo, H.; Wang, Z.; Lian, C.; Zhang, J.; Wu, D.; Lei, Z.; Liu, Z.; et al. Engineering Built-In Electric Field Microenvironment of CQDs/g-C3N4 Heterojunction for Efficient Photocatalytic CO2 Reduction. Adv. Sci. 2024, 11, 2403607. [Google Scholar] [CrossRef]
  8. Zhang, H.; Guo, H.; Li, D.; Zhang, Y.; Zhang, S.; Kang, W.; Liu, C.; Le, W.; Wang, L.; Li, D.; et al. Halogen Doped Graphene Quantum Dots Modulate TDP-43 Phase Separation and Aggregation in the Nucleus. Nat. Commun. 2024, 15, 2980. [Google Scholar] [CrossRef] [PubMed]
  9. Guo, H.; Lu, Y.; Lei, Z.; Bao, H.; Zhang, M.; Wang, Z.; Guan, C.; Tang, B.; Liu, Z.; Wang, L. Machine learning-guided realization of full-color high-quantum-yield carbon quantum dots. Nat. Commun. 2024, 15, 4843. [Google Scholar] [CrossRef]
  10. Zheng, M.; Li, L.; Tian, D.; Zhang, Z.; Zhou, W.; He, M. Tailoring Dye Emissions within Metal-Organic Frameworks for Tunable Luminescence and Ratiometric Temperature Sensing. ACS Appl. Mater. Interfaces 2023, 15, 23479–23488. [Google Scholar] [CrossRef]
  11. McLaurin, E.J.; Bradshaw, L.R.; Gamelin, D.R. Dual-Emitting Nanoscale Temperature Sensors. Chem. Mater. 2013, 25, 1283–1292. [Google Scholar] [CrossRef]
  12. Brites, C.D.S.; Millán, A.; Carlos, L.D. Lanthanides in Luminescent Thermometry. In Handbook on the Physics and Chemistry of Rare Earths; Elsevier: Amsterdam, The Netherlands, 2016; Volume 49, pp. 339–427. ISBN 978-0-444-63699-7. [Google Scholar]
  13. Dramićanin, M.D. Trends in Luminescence Thermometry. J. Appl. Phys. 2020, 128, 040902. [Google Scholar] [CrossRef]
  14. Zhou, J.; del Rosal, B.; Jaque, D.; Uchiyama, S.; Jin, D. Advances and Challenges for Fluorescence Nanothermometry. Nat. Methods 2020, 17, 967–980. [Google Scholar] [CrossRef] [PubMed]
  15. Ramalho, J.F.C.B.; Carneiro Neto, A.N.; Carlos, L.D.; André, P.S.; Ferreira, R.A.S. Chapter 324—Lanthanides for the New Generation of Optical Sensing and Internet of Things. In Handbook on the Physics and Chemistry of Rare Earths; Bünzli, J.-C.G., Pecharsky, V.K., Eds.; Including Actinides; Elsevier: Amsterdam, The Netherlands, 2022; Volume 61, pp. 31–128. [Google Scholar]
  16. Chen, D.; Haldar, R.; Wöll, C. Stacking Lanthanide-MOF Thin Films to Yield Highly Sensitive Optical Thermometers. ACS Appl. Mater. Interfaces 2023, 15, 19665–19671. [Google Scholar] [CrossRef] [PubMed]
  17. Hang, M.; Cheng, Y.; Wang, Y.; Li, H.; Zheng, M.; He, M.; Chen, Q.; Zhang, Z. Rational synthesis of isomorphic rare earth metal-organic framework materials for simultaneous adsorption and photocatalytic degradation of organic dyes in water. CrystEngComm 2022, 24, 552–559. [Google Scholar] [CrossRef]
  18. Li, T.; Chen, Y.; Cheng, Y.; Zheng, M.; Qian, J.; He, M.; Chen, Q.; Zhang, Z. Synthesis of rare earth MOF/CZS materials derived from aromatic tetracarboxylic acids and photocatalytic hydrogen production. Int. J. Hydrog. Energy 2024, 65, 225–235. [Google Scholar] [CrossRef]
  19. Cui, Y.; Xu, H.; Yue, Y.; Guo, Z.; Yu, J.; Chen, Z.; Gao, J.; Yang, Y.; Qian, G.; Chen, B. A Luminescent Mixed-Lanthanide Metal–Organic Framework Thermometer. J. Am. Chem. Soc. 2012, 134, 3979–3982. [Google Scholar] [CrossRef] [PubMed]
  20. Zhou, Y.; Yan, B.; Lei, F. Postsynthetic Lanthanide Functionalization of Nanosized Metal–Organic Frameworks for Highly Sensitive Ratiometric Luminescent Thermometry. Chem. Commun. 2014, 50, 15235–15238. [Google Scholar] [CrossRef]
  21. Wang, Z.; Ananias, D.; Carné-Sánchez, A.; Brites, C.D.S.; Imaz, I.; Maspoch, D.; Rocha, J.; Carlos, L.D. Lanthanide-Organic Framework Nanothermometers Prepared by Spray-Drying. Adv. Funct. Mater. 2015, 25, 2824–2830. [Google Scholar] [CrossRef]
  22. Ananias, D.; Brites, C.D.S.; Carlos, L.D.; Rocha, J. Cryogenic Nanothermometer Based on the MIL-103(Tb,Eu) Metal–Organic Framework. Eur. J. Inorg. Chem. 2016, 2016, 1967–1971. [Google Scholar] [CrossRef]
  23. Zhao, D.; Yue, D.; Zhang, L.; Jiang, K.; Qian, G. Cryogenic Luminescent Tb/Eu-MOF Thermometer Based on a Fluorine-Modified Tetracarboxylate Ligand. Inorg. Chem. 2018, 57, 12596–12602. [Google Scholar] [CrossRef]
  24. Ramalho, J.F.C.B.; Correia, S.F.H.; Fu, L.; António, L.L.F.; Brites, C.D.S.; André, P.S.; Ferreira, R.A.S.; Carlos, L.D. Luminescence Thermometry on the Route of the Mobile-Based Internet of Things (IoT): How Smart QR Codes Make It Real. Adv. Sci. 2019, 6, 1900950. [Google Scholar] [CrossRef]
  25. Feng, T.; Ye, Y.; Liu, X.; Cui, H.; Li, Z.; Zhang, Y.; Liang, B.; Li, H.; Chen, B. A Robust Mixed-Lanthanide PolyMOF Membrane for Ratiometric Temperature Sensing. Angew. Chem. Int. Ed. 2020, 59, 21752–21757. [Google Scholar] [CrossRef]
  26. Carneiro Neto, A.N.; Mamontova, E.; Botas, A.M.P.; Brites, C.D.S.; Ferreira, R.A.S.; Rouquette, J.; Guari, Y.; Larionova, J.; Long, J.; Carlos, L.D. Rationalizing the Thermal Response of Dual-Center Molecular Thermometers: The Example of an Eu/Tb Coordination Complex. Adv. Opt. Mater. 2022, 10, 2101870. [Google Scholar] [CrossRef]
  27. Chen, H.; Chen, L.; Lin, L.; Long, L.; Zheng, L. Doped Luminescent Lanthanide Coordination Polymers Exhibiting Both White-Light Emission and Thermal Sensitivity. Inorg. Chem. 2021, 60, 6986–6990. [Google Scholar] [CrossRef]
  28. Zhao, D.; Yue, D.; Jiang, K.; Zhang, L.; Li, C.; Qian, G. Isostructural Tb3+/Eu3+ Co-Doped Metal–Organic Framework Based on Pyridine-Containing Dicarboxylate Ligands for Ratiometric Luminescence Temperature Sensing. Inorg. Chem. 2019, 58, 2637–2644. [Google Scholar] [CrossRef]
  29. Liu, J.; Han, X.; Lu, Y.; Wang, S.; Zhao, D.; Li, C. Isostructural Single- And Dual-Lanthanide Metal–Organic Frameworks Based On Substituent-Group-Modifying Tetracarboxylate Ligands for Ratiometric Temperature Sensing. Inorg. Chem. 2021, 60, 4133–4143. [Google Scholar] [CrossRef]
  30. Miao, W.; Liu, B.; Li, H.; Zheng, S.; Jiao, H.; Xu, L. Fluorescent Eu3+/Tb3+ Metal–Organic Frameworks for Ratiometric Temperature Sensing Regulated by Ligand Energy. Inorg. Chem. 2022, 61, 14322–14332. [Google Scholar] [CrossRef]
  31. Ye, M.; Zhang, M.; Xu, Q.; Long, L.; Zheng, L. A Doped Lanthanide-Based Coordination Polymer Exhibiting High Relative Sensitivity to Ratiometric Luminescent Thermometers at 440 K. Inorg. Chem. 2023, 62, 18009–18013. [Google Scholar] [CrossRef]
  32. Xia, T.; Cao, W.; Guan, L.; Zhang, J.; Jiang, F.; Yu, L.; Wan, Y. Three Isostructural Hexanuclear Lanthanide–Organic Frameworks for Sensitive Luminescence Temperature Sensing over a Wide Range. Dalton Trans. 2022, 51, 5426–5433. [Google Scholar] [CrossRef]
  33. Liu, X.; Liu, W.; Yang, X.; Kou, Y.; Chen, W.; Liu, W. Construction of a Series of Ln-MOF Luminescent Sensors Based on a Functional “V” Shaped Ligand. Dalton Trans. 2022, 51, 12549–12557. [Google Scholar] [CrossRef]
  34. Kanzariya, D.B.; Chaudhary, M.Y.; Pal, T.K. Engineering of Metal–Organic Frameworks (MOFs) for Thermometry. Dalton Trans. 2023, 52, 7383–7404. [Google Scholar] [CrossRef] [PubMed]
  35. Feng, J.; Yan, X.; Ji, Z.; Liu, T.; Cao, R. Fabrication of Lanthanide-Functionalized Hydrogen-Bonded Organic Framework Films for Ratiometric Temperature Sensing by Electrophoretic Deposition. ACS Appl. Mater. Interfaces 2020, 12, 29854–29860. [Google Scholar] [CrossRef] [PubMed]
  36. Li, L.; Zhu, Y.; Zhou, X.; Brites, C.D.S.; Ananias, D.; Lin, Z.; Paz, F.A.A.; Rocha, J.; Huang, W.; Carlos, L.D. Visible-Light Excited Luminescent Thermometer Based on Single Lanthanide Organic Frameworks. Adv. Funct. Mater. 2016, 26, 8677–8684. [Google Scholar] [CrossRef]
  37. Shen, X.; Yan, B. Polymer Hybrid Thin Films Based on Rare Earth Ion-Functionalized MOF: Photoluminescence Tuning and Sensing as a Thermometer. Dalton Trans. 2015, 44, 1875–1881. [Google Scholar] [CrossRef]
  38. Cui, Y.; Song, R.; Yu, J.; Liu, M.; Wang, Z.; Wu, C.; Yang, Y.; Wang, Z.; Chen, B.; Qian, G. Dual-Emitting MOF⊃Dye Composite for Ratiometric Temperature Sensing. Adv. Mater. 2015, 27, 1420–1425. [Google Scholar] [CrossRef] [PubMed]
  39. Feng, J.; Liu, T.; Shi, J.; Gao, S.; Cao, R. Dual-Emitting UiO-66(Zr&Eu) Metal–Organic Framework Films for Ratiometric Temperature Sensing. ACS Appl. Mater. Interfaces 2018, 10, 20854–20861. [Google Scholar]
  40. Ananias, D.; Firmino, A.D.G.; Mendes, R.F.; Paz, F.A.A.; Nolasco, M.; Carlos, L.D.; Rocha, J. Excimer Formation in a Terbium Metal–Organic Framework Assists Luminescence Thermometry. Chem. Mater. 2017, 29, 9547–9554. [Google Scholar] [CrossRef]
  41. Li, L.; Cheng, J.; Liu, Z.; Song, L.; You, Y.; Zhou, X.; Huang, W. Ratiometric Luminescent Sensor of Picric Acid Based on the Dual-Emission Mixed-Lanthanide Coordination Polymer. ACS Appl. Mater. Interfaces 2018, 10, 44109–44115. [Google Scholar] [CrossRef]
Figure 1. Views of (a) μ7 and (b) μ8 coordination modes of ligand. (c) View of Tb4(COO)12·4NMP cluster. (d) C-H···π hydrogen bond within crystal structure of TbL.
Molecules 29 03914 g001
Figure 2. Three-dimensional PL spectra of (a) 10−4 M, (b) 10−3 M, and (c) 10−2 M H4L solutions and (d) H4L in solid state. Phosphorescence spectra of H4L (e) in solid state at 77 K and (f) in range of 380–460 nm.
Molecules 29 03914 g002
Figure 3. (a) Temperature-dependent PL spectra and (b) integrated intensities of 5D47F5 transition of TbL. (c) Temperature-dependent 5D4 decay curves. (d) Experimental temperature-dependent 5D4 lifetime values (green scatters) and the fitted curve (grey line, R2 = 0.98) of TbL.
Molecules 29 03914 g003
Figure 4. (a) Temperature-dependent PL spectra and (b) integrated areas of ITb and IEu of EuxTb1−xL (x = 0.0001) upon excitation at 345 nm. (c) Temperature-dependent PL spectra and (d) integrated areas of ITb and IEu of EuxTb1−xL (x = 0.0005) upon excitation at 345 nm. (e) Temperature-dependent PL spectra and (f) integrated areas of ITb and IEu of EuxTb1−xL (x = 0.001) upon excitation at 345 nm. Asterisk represents the overlap between Eu3+ 5D07F2 and Tb3+ 5D47F3 transitions, and pound sign represents that between Eu3+ 5D07F0,1 and Tb3+ 5D47F4 transitions.
Molecules 29 03914 g004
Figure 5. (a) Thermometric parameters, (b) relative thermal sensitivities, and (c) temperature uncertainties of EuxTb1−xL samples within the temperature range of 77–353 K. Temperature-dependent PL decay curves of (d) Tb3+ and (e) Eu3+ and (f) temperature-dependent PL lifetimes for the sample with x = 0.001 in the 77–353 K range.
Molecules 29 03914 g005
Table 1. Fitting results of Δ (T) to Equation (2).
ItemsA1A2T0R2
Eu0.0001Tb0.9999L6.701.20278.000.9990
Eu0.005Tb0.999 L6.800.42240.000.9993
Eu0.001Tb0.999L6.400.10183.000.9997
Disclaimer/Publisher’s Note: The statements, opinions and data contained in all publications are solely those of the individual author(s) and contributor(s) and not of MDPI and/or the editor(s). MDPI and/or the editor(s) disclaim responsibility for any injury to people or property resulting from any ideas, methods, instructions or products referred to in the content.

