Maize Grain Metabolite Profiling by NMR: Effects of Growing Year, Variety, and Cropping System

 , , , , and
Abstract
:1. Introduction
2. Results
2.1. Water-Soluble Metabolites
2.1.1. The Identification and NMR Spectral Assignment
2.1.2. Metabolite Content
2.2. Liposoluble Metabolites
2.2.1. The Identification and Spectral Assignment
2.2.2. Metabolite Content
2.3. Effect of Variety, Cropping System, and Growing Year on Metabolite Profile
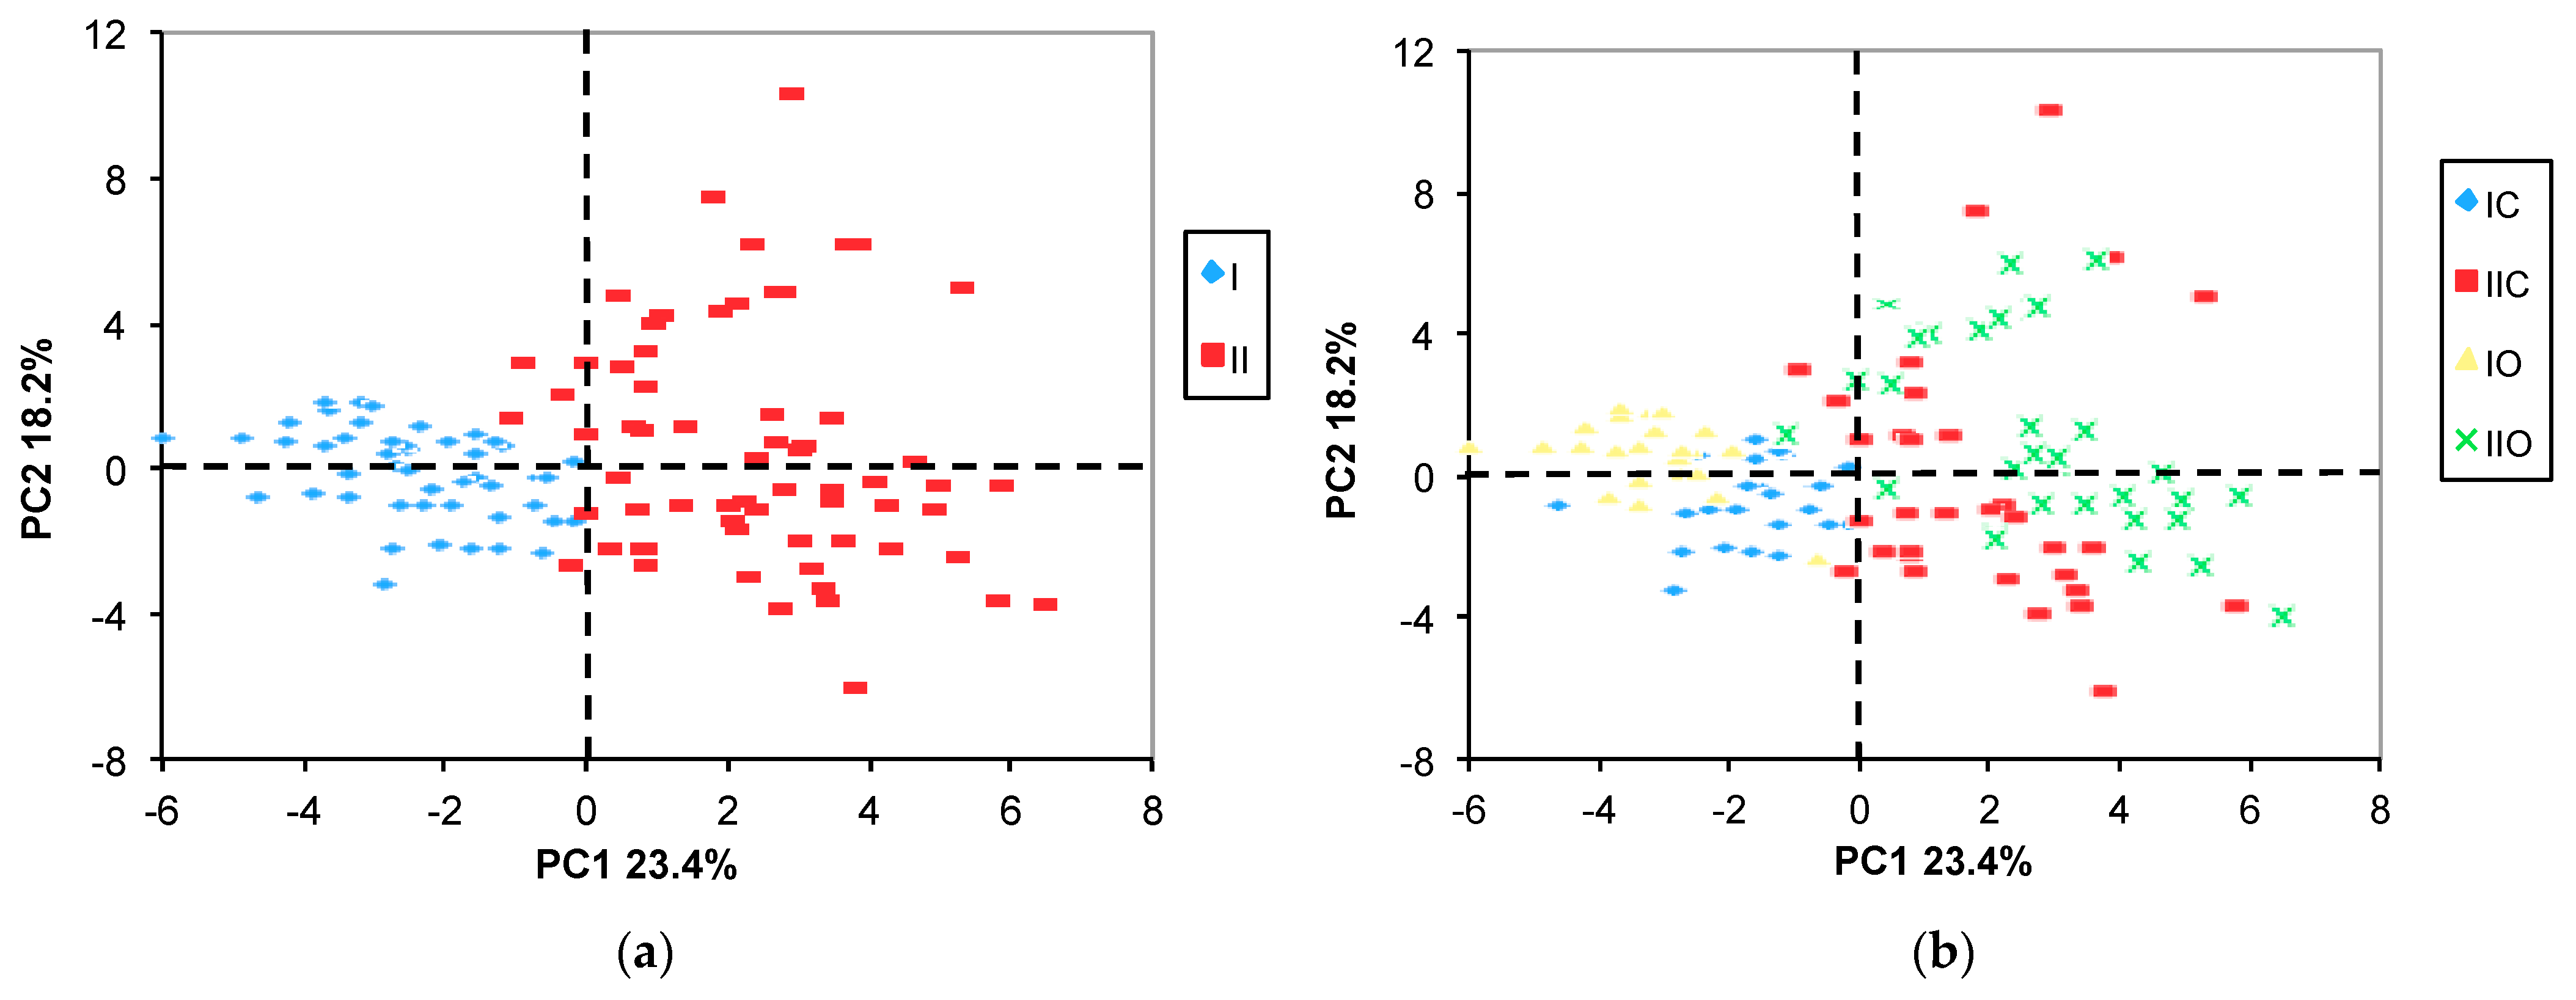
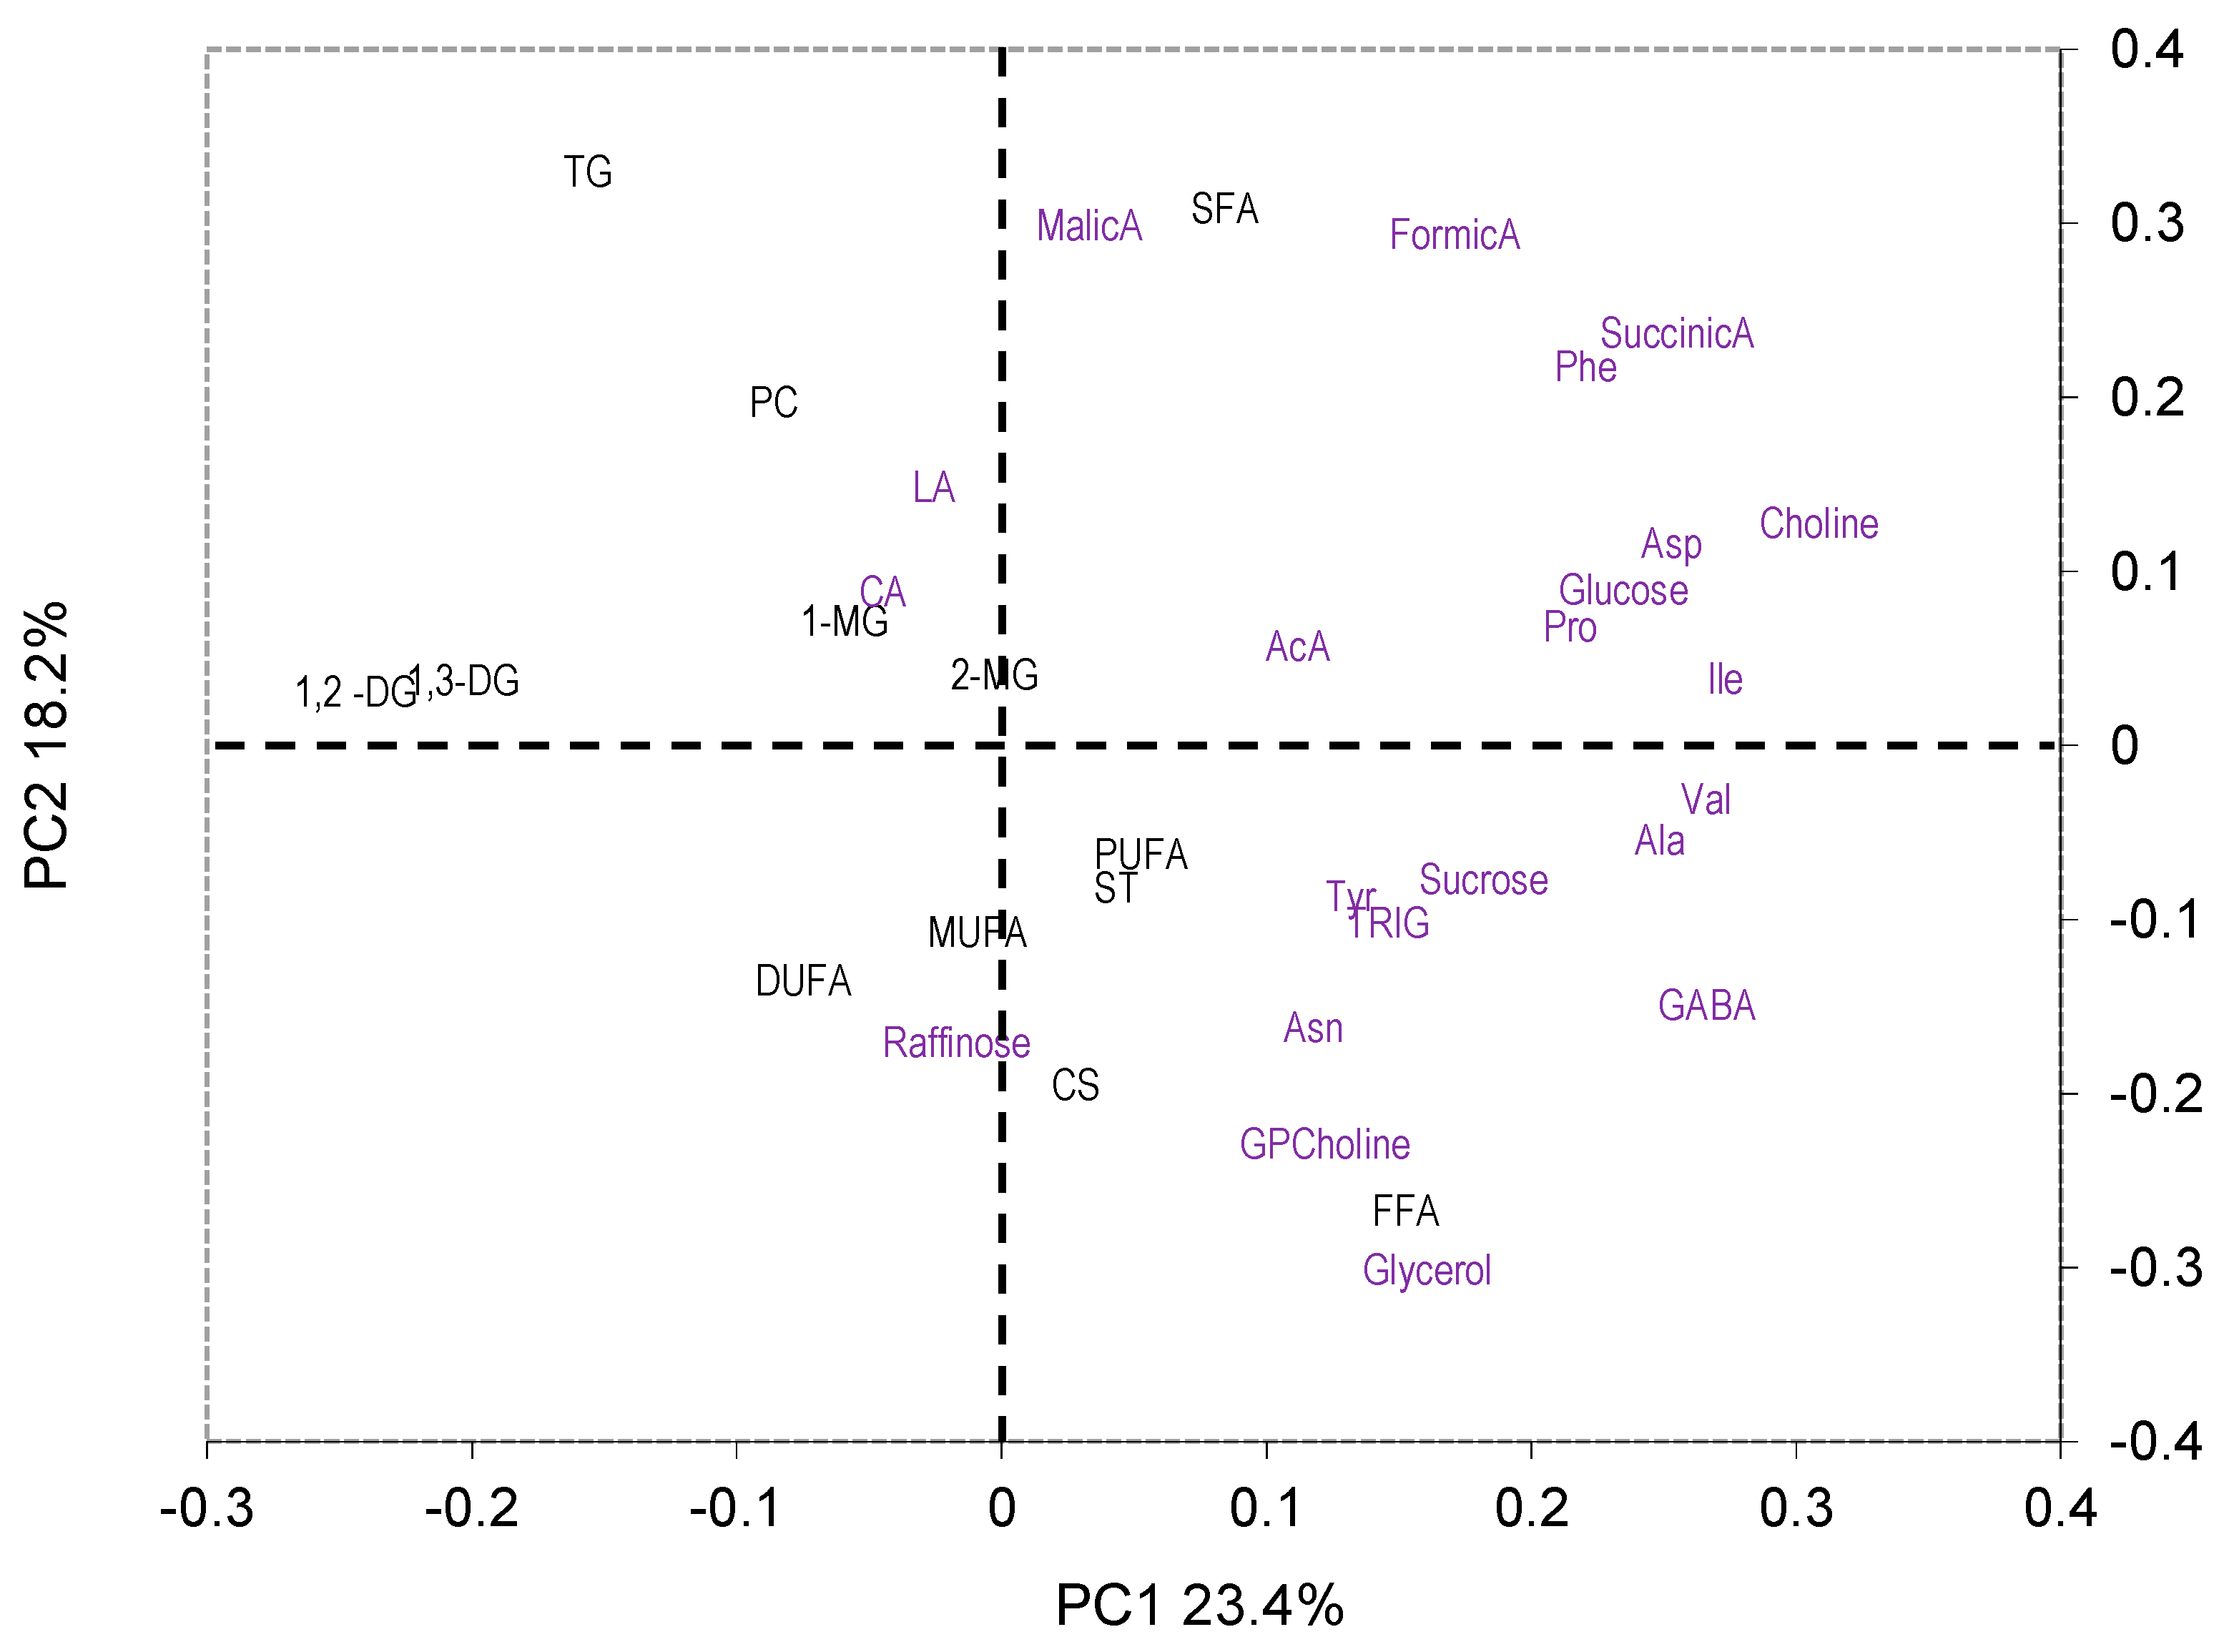
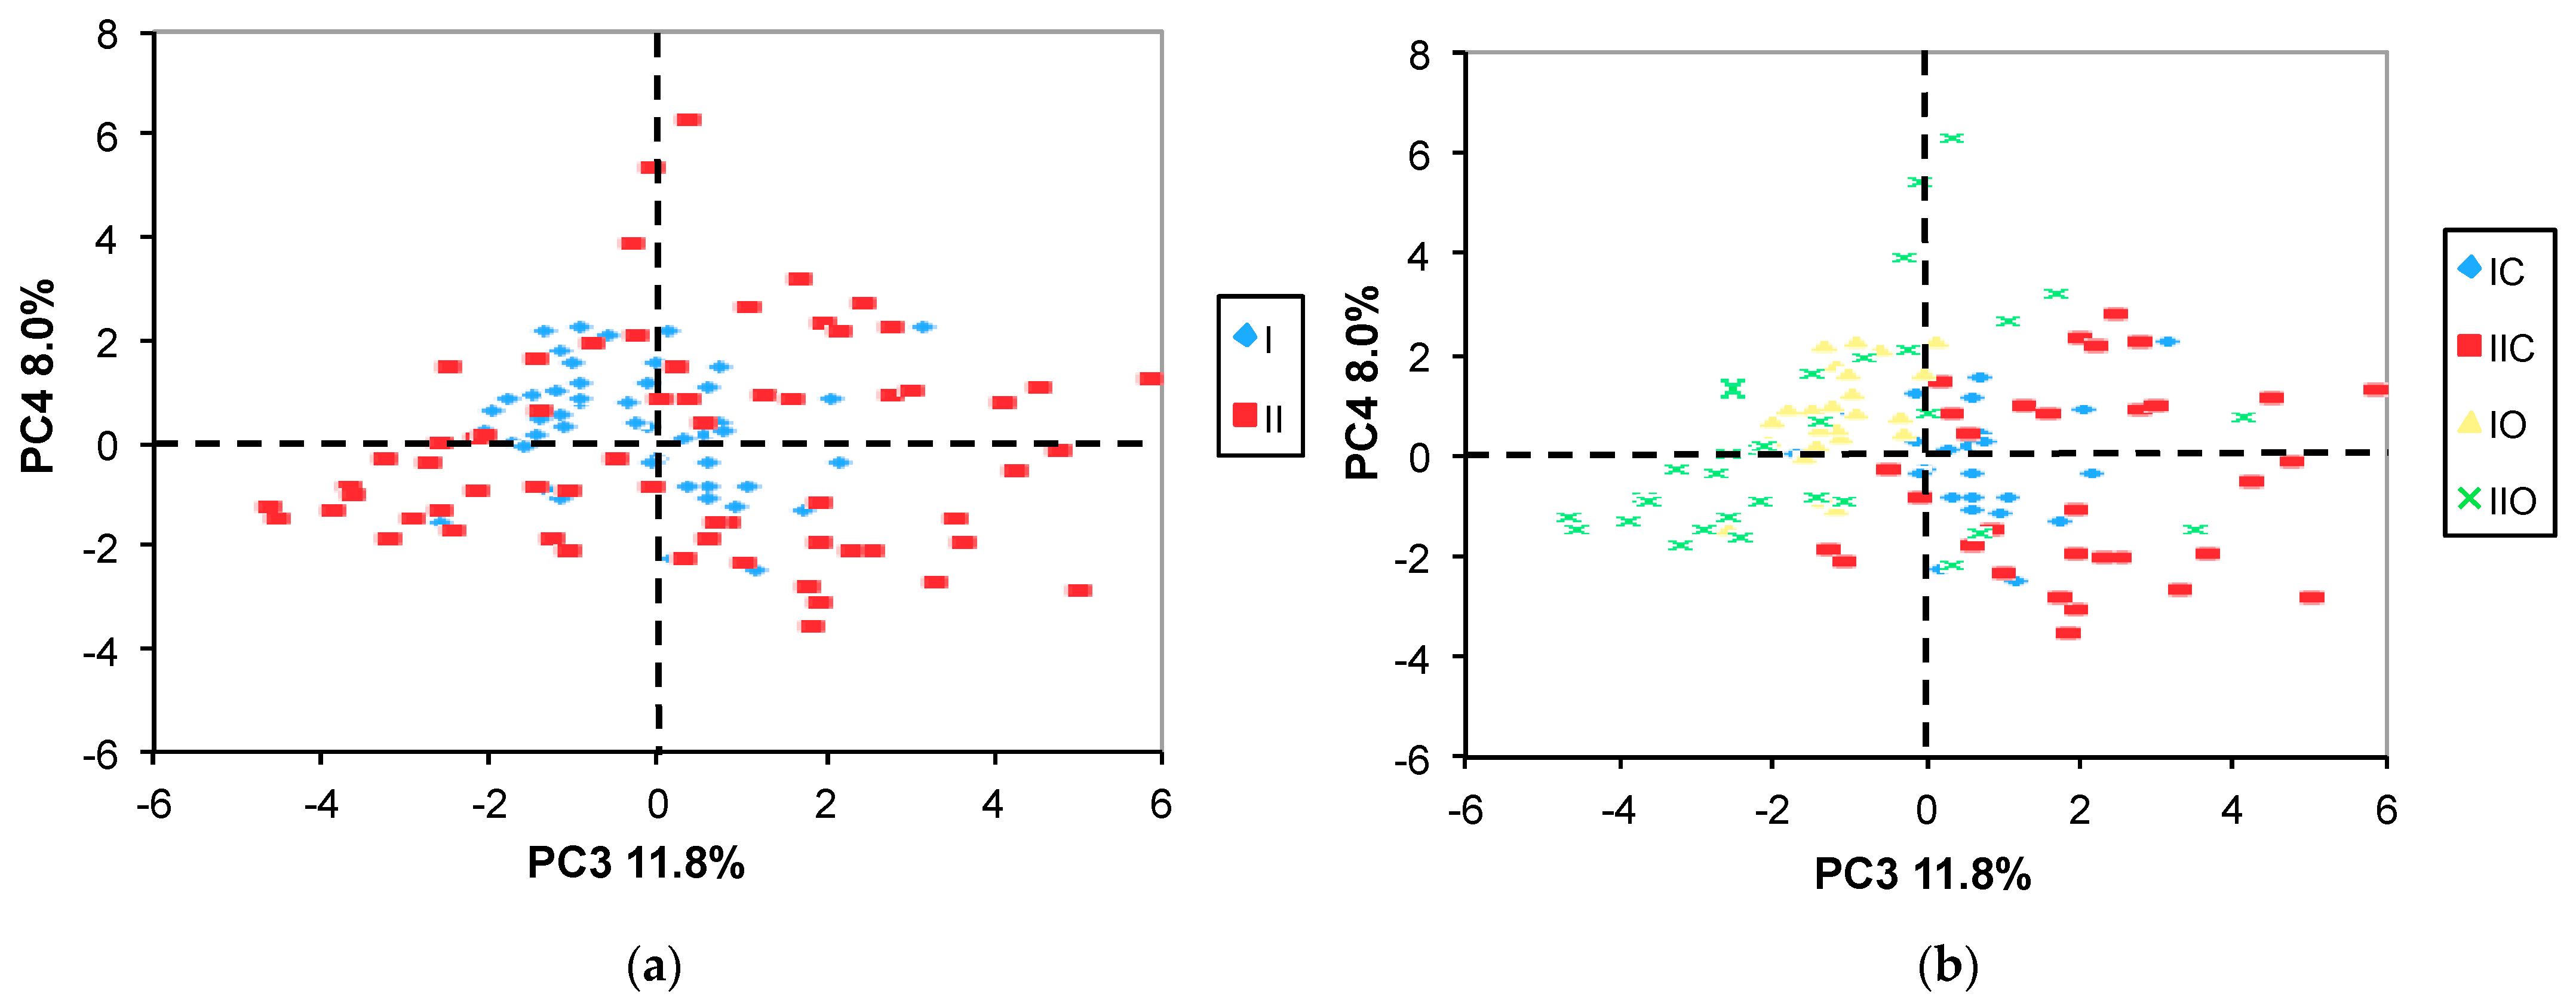
2.3.1. PCA
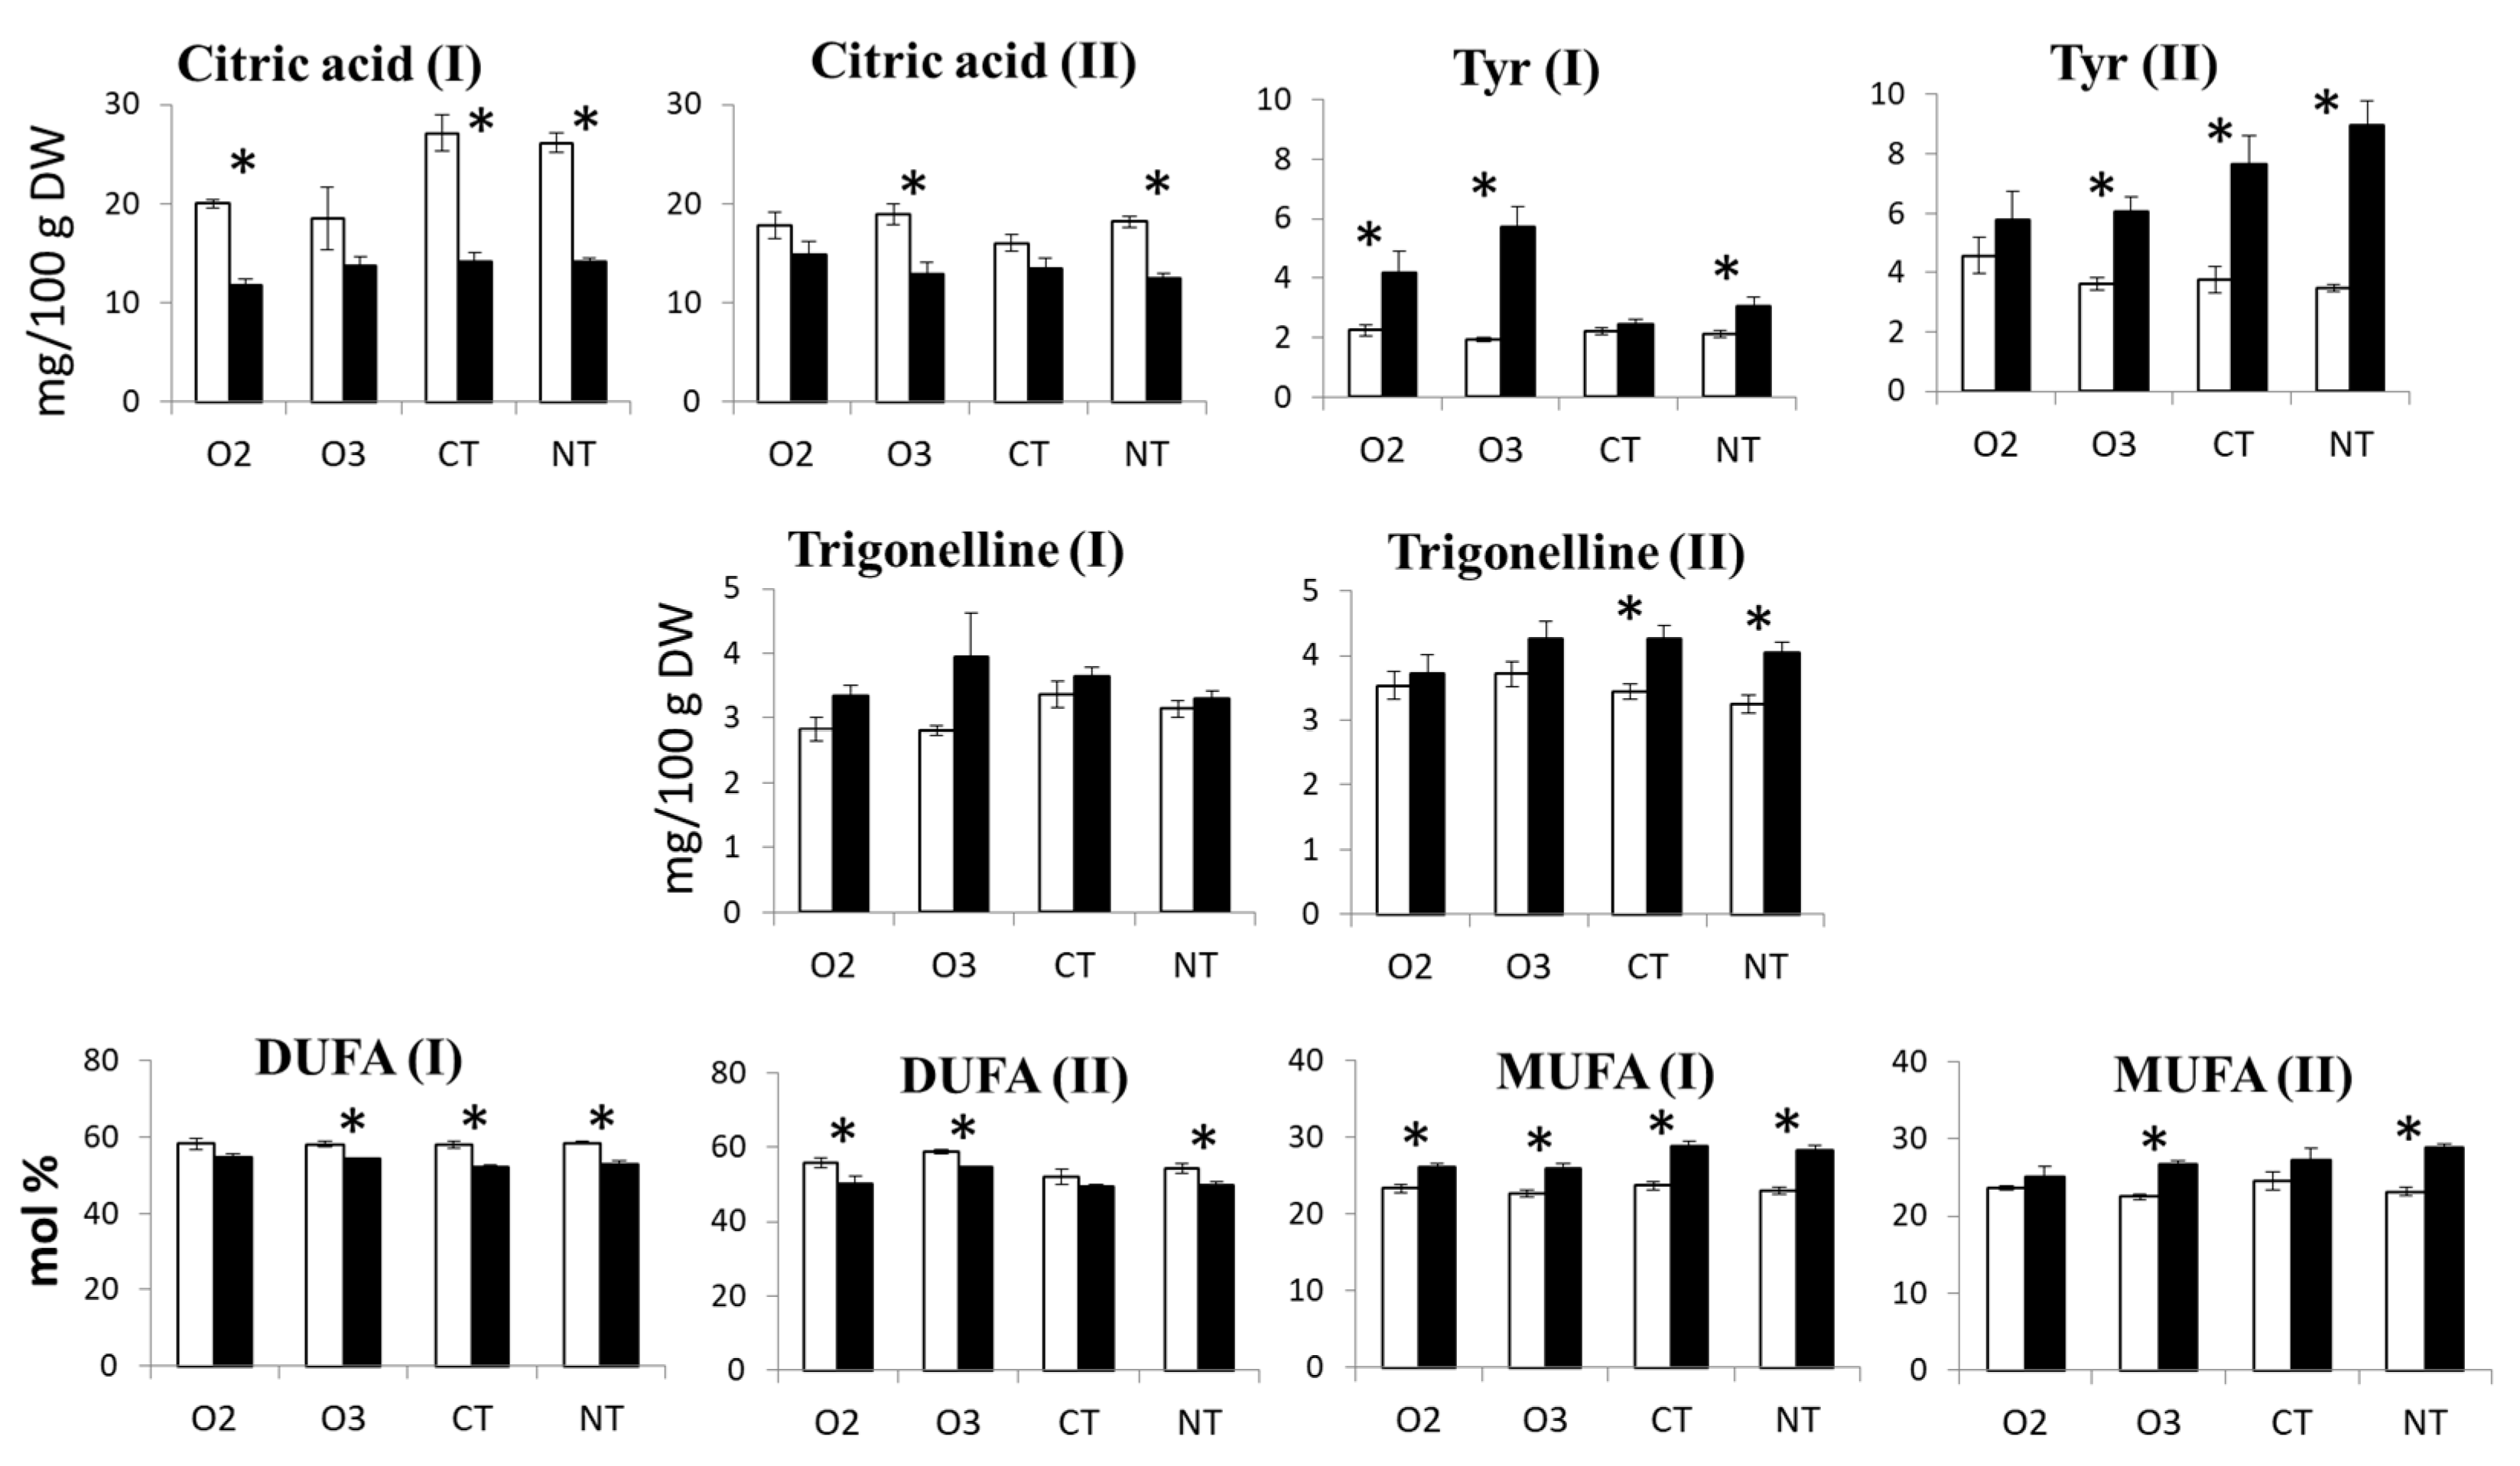
2.3.2. ANOVA
3. Discussion
3.1. Metabolite Profile
3.1.1. Amino Acids
3.1.2. Sugars
3.1.3. Organic Acids
3.1.4. Fatty Acids/Lipids
3.1.5. Miscellaneous Metabolites
3.2. Effect of Variety, Cropping System, and Growing Year on Metabolite Profile
- The most significant component of the explainable variance was the random effect due to the naturally occurring year-related impact;
- Among the fixed factors (the variety and the cropping system), the maize variety was the most significant factor contributing to the overall variability;
- The effect of the cropping system was overwhelmed by the random effect of the growing year;
- A substantial proportion of the total variance was unexplained.
4. Materials and Methods
4.1. Maize Grain Samples
4.2. Sample Preparation
4.2.1. Extraction Procedure
4.2.2. NMR Sample Preparation
4.3. NMR Spectra Acquisition and Processing
4.4. Quantitative NMR Analysis
4.4.1. Hydroalcoholic Extracts
4.4.2. Chloroform Extracts
4.5. Statistical Analyses
Supplementary Materials
Author Contributions
Funding
Institutional Review Board Statement
Informed Consent Statement
Data Availability Statement
Conflicts of Interest
References
- Sandhu, K.S.; Singh, N.; Malhi, N.S. Some properties of corn grains and their flours I: Physicochemical, functional and chapati-making properties of flours. Food Chem. 2007, 101, 938–946. [Google Scholar] [CrossRef]
- Krivanek, A.F.; De Groote, H.; Gunaratna, N.S.; Diallo, A.O.; Friesen, D.K. Breeding and disseminating quality protein maize (QPM) for Africa. Afr. J. Biotechnol. 2007, 6, 312–324. [Google Scholar]
- Nuss, E.T.; Tanumihardjo, S.A. Maize: A paramount staple crop in the context of global nutrition. Compr. Rev. Food Sci. Food Saf. 2010, 9, 417–436. [Google Scholar] [CrossRef]
- Goredema-Matongera, N.; Ndhlela, T.; Magorokosho, C.; Kamutando, C.N.; van Biljon, A.; Labuschagne, M. Multinutrient biofortification of maize (Zea mays L.) in Africa: Current status, opportunities and limitations. Nutrients 2021, 13, 1039. [Google Scholar] [CrossRef]
- Harrigan, G.G.; Stork, L.G.; Riordan, S.G.; Reynolds, T.L.; Ridley, W.P.; Masucci, J.D.; Macisaac, S.; Halls, S.C.; Orth, R.; Smith, R.G.; et al. Impact of genetics and environment on nutritional and metabolite components of maize grain. J. Agric. Food Chem. 2007, 55, 6177–6185. [Google Scholar] [CrossRef] [PubMed]
- Berardo, N.; Mazzinelli, G.; Valoti, P.; Lagana, P.; Redaelli, R. Characterization of maize germplasm for the chemical composition of the grain. J. Agric. Food Chem. 2009, 57, 2378–2384. [Google Scholar] [CrossRef] [PubMed]
- Szulc, P.; Podkówka, Z.; Bocianowski, J.; Krauklis, D.; Wilczewska, W. Chemical composition and nutritional value of maize grains from cultivars of different breeding and seed companies. J. Res. Appl. Agric. Eng. 2018, 63, 203–208. [Google Scholar]
- Fang, H.; Fu, X.; Wang, Y.; Xu, J.; Feng, H.; Li, W.; Xu, J.; Jittham, O.; Zhang, X.; Zhang, L.; et al. Genetic basis of kernel nutritional traits during maize domestication and improvement. Plant J. 2019, 101, 278–292. [Google Scholar] [CrossRef]
- Barutçular, C.; Dizlek, H.; El-Sabagh, A.; Sahin, T.; Elsabagh, M.; Islam, M.S. Nutritional quality of maize in response to drought stress during grain-filling stages in Mediterranean climate condition. J. Exp. Biol. Agric. Sci. 2016, 4, 644–652. [Google Scholar] [CrossRef]
- Ahmad, A.; Liu, Y.; Ge, Q. Assessing environmental thresholds in relation to plant structure and nutritional value for improved maize calendar ensuring food security. Sci. Total Environ. 2022, 834, 155120. [Google Scholar] [CrossRef]
- Mason, S.C.; D’croz-Mason, N.E. Agronomic practices influence maize grain quality. J. Crop Prod. 2002, 5, 75–91. [Google Scholar] [CrossRef]
- Manzeke, G.M.; Mapfumo, P.; Mtambanengwe, F.; Chikowo, R.; Tendayi, T.; Cakmak, I. Soil fertility management effects on maize productivity and grain zinc content in smallholder farming systems of Zimbabwe. Plant Soil 2012, 361, 57–69. [Google Scholar] [CrossRef]
- Gwirtz, J.A.; Garcia-Casal, M.N. Processing maize flour and corn meal food products. Ann. N. Y. Acad. Sci. 2014, 1312, 66–75. [Google Scholar] [CrossRef] [PubMed]
- Suri, D.J.; Tanumihardjo, S.A. Effects of different processing methods on the micronutrient and phytochemical contents of maize: From A to Z. Compr. Rev. Food Sci. Food Saf. 2016, 15, 912–926. [Google Scholar] [CrossRef] [PubMed]
- Prasanna, B.M.; Palacios-Rojas, N.; Hossain, F.; Muthusamy, V.; Menkir, A.; Dhliwayo, T.; Ndhlela, T.; Vicente, F.S.; Nair, S.K.; Vivek, B.S.; et al. Molecular breeding for nutritionally enriched maize: Status and prospects. Front. Genet. 2020, 10, 1392. [Google Scholar] [CrossRef] [PubMed]
- Maqbool, M.A.; Beshir Issa, A.; Khokhar, E.S. Quality protein maize (QPM): Importance, genetics, timeline of different events, breeding strategies and varietal adoption. Plant Breed. 2021, 140, 375–399. [Google Scholar] [CrossRef]
- Hartings, H.; Fracassetti, M.; Motto, M. Genetic enhancement of grain quality-related traits in maize. In Transgenic Plants—Advances and Limitations, 1st ed.; Ozden Ҫifti, Y., Ed.; InTech Open: Rijeka, UK, 2012; pp. 191–218. [Google Scholar]
- Guo, X.; Duan, X.; Wu, Y.; Cheng, J.; Zhang, J.; Zhang, H.; Li, B. Genetic engineering of maize (Zea mays L.) with improved grain nutrients. J. Agric. Food Chem. 2018, 66, 1670–1677. [Google Scholar] [CrossRef]
- Fiehn, O. Combining genomics, metabolome analysis, and biochemical modelling to understand metabolic networks. Comp. Funct. Genom. 2001, 2, 155–168. [Google Scholar] [CrossRef]
- Medeiros, D.B.; Brotman, Y.; Fernie, A.R. The utility of metabolomics as a tool to inform maize biology. Plant Commun. 2021, 2, 100187. [Google Scholar] [CrossRef]
- Mannina, L.; Sobolev, A.P.; Viel, S. Liquid state 1H high field NMR in food analysis. Prog. Nucl. Magn. Reson. Spectrosc. 2012, 66, 1–39. [Google Scholar] [CrossRef]
- Mattoo, A.K.; Cavigelli, M.A.; Mišić, D.M.; Gašić, U.; Maksimović, V.M.; Kramer, M.; Kaur, B.; Matekalo, D.; Nestorović Živković, J.; Roberts, D.P. Maize metabolomics in relation to cropping system and growing year. Front. Sustain. Food Syst. 2023, 7, 1130089. [Google Scholar] [CrossRef]
- Cavigelli, M.A.; Teasdale, J.R.; Conklin, A. Long-term agronomic performance of organic and conventional field crops in the mid-Atlantic region. Agron. J. 2008, 100, 785–794. [Google Scholar] [CrossRef]
- Piccioni, F.; Capitani, D.; Zolla, L.; Mannina, L. NMR metabolic profiling of transgenic maize with the Cry1A(b) gene. J. Agric. Food Chem. 2009, 57, 6041–6049. [Google Scholar] [CrossRef] [PubMed]
- Alberdi-Cedeño, J.; Ibargoitia, M.L.; Guillén, M.D. Effect of the enrichment of corn oil with alpha- or gamma-tocopherol on its in vitro digestion studied by 1H NMR and SPME-GC/MS. Formation of hydroperoxy-, hydroxy-, keto-dienes and keto-E-epoxy-E-monoenes in the more alpha-tocopherol enriched samples. Antioxidants 2020, 9, 246. [Google Scholar] [CrossRef] [PubMed]
- Nieva-Echevarría, B.; Goicoechea, E.; Manzanos, M.J.; Guillén, M.D. A method based on 1H NMR spectral data useful to evaluate the hydrolysis level in complex lipid mixtures. Food Res. Int. 2014, 66, 379–387. [Google Scholar] [CrossRef]
- Beadle, J.B.; Just, D.E.; Morgan, R.E.; Reiners, R.A. Composition of corn oil. J. Am. Oil Chem. Soc. 1965, 42, 90–95. [Google Scholar] [CrossRef]
- Venkatesh, T.V.; Chassy, A.W.; Fiehn, O.; Flint-Garcia, S.; Zeng, Q.; Skogerson, K.; Harrigan, G.G. Metabolomic assessment of key maize resources: GC-MS and NMR profiling of grain from B73 hybrids of the Nested Association Mapping (NAM) founders and of geographically diverse landraces. J. Agric. Food Chem. 2016, 64, 2162–2172. [Google Scholar] [CrossRef]
- Raymond, M.J.; Smirnoff, N. Proline metabolism and transport in maize seedlings at low water potential. Ann. Bot. 2002, 89, 813–823. [Google Scholar] [CrossRef]
- Phillips, K.M.; Ruggio, D.M.; Toivo, J.I.; Swank, M.A.; Simpkins, A.H. Free and esterified sterol composition of edible oils and fats. J. Food Compos. Anal. 2002, 15, 123–142. [Google Scholar] [CrossRef]
- Yancey, P.H. Organic osmolytes as compatible, metabolic and counteracting cytoprotectants in high osmolarity and other stresses. J. Exp. Biol. 2005, 208, 2819–2830. [Google Scholar] [CrossRef]
- Röhlig, R.M.; Engel, K.H. Influence of the input system (conventional vs. organic farming) on metabolite profiles of maize (Zea mays) kernels. J. Agric. Food Chem. 2010, 58, 3022–3030. [Google Scholar] [CrossRef] [PubMed]
- Röhlig, R.M.; Eder, J.; Engel, K.H. Metabolite profiling of maize grain: Differentiation due to genetics and environment. Metabolomics 2009, 5, 459–477. [Google Scholar] [CrossRef]
- Teasdale, J.R.; Cavigelli, M.A. Meteorological fluctuations define longterm crop yield patterns in conventional and organic production systems. Sci. Rep. 2017, 7, 688. [Google Scholar] [CrossRef] [PubMed]


| Compound | Assignment | 1H, (ppm) | Multiplicity: JH-H [Hz] |
|---|---|---|---|
| Organic acids | |||
| Acetic acid | CH3 | 1.92 | s |
| Citric acid | α,γ-CH | 2.54 | d [15.1] |
| Formic acid | CH | 8.46 | s |
| Lactic acid | β-CH3 | 1.33 | d [6.9] |
| Malic acid | CH2 | 2.37 | dd [15.4; 10.0] |
| Succinic acid | CH2 | 2.41 | s |
| Carbohydrates | |||
| α-Glucose | CH-1 | 5.24 | d [3.7] |
| β-Glucose | CH-1 | 4.66 | d [8.0] |
| Raffinose | CH-1 | 5.00 | d [3.7] |
| Sucrose | CH-4′ | 4.06 | t [8.6] |
| Amino acids | |||
| Alanine (Ala) | β-CH3 | 1.49 | d [7.3] |
| Asparagine (Asn) | β,β′-CH2 | 2.89 | dd [16.9; 7.3] |
| Aspartic acid (Asp) | β,β′-CH2 | 2.82 | dd [17.4; 3.8] |
| γ-aminobutyrate (GABA) | α-CH2 | 2.30 | t [7.5] |
| Isoleucine (Ile) | γ′-CH3 | 1.01 | d [7.0] |
| Phenylalanine (Phe) | CH-3,5 (ring) | 7.43 | t [7.4] |
| Proline (Pro) | γ-CH2 | 2.00 | m |
| Tyrosine (Tyr) | CH-2,6 (ring) | 7.20 | d [8.4] |
| Valine (Val) | γ′-CH3 | 1.05 | d [7.0] |
| Miscellaneous metabolites | |||
| Choline | N(CH3)3 | 3.21 | s |
| Glycerophosphorylcholine | N(CH3)3 | 3.23 | s |
| Glycerol | CH2 | 3.64 | dd [11.7; 4.3] |
| Trigonelline | CH | 8.85 | s |
| Metabolite | Mean | Maximum | Minimum | Max/Min |
|---|---|---|---|---|
| Organic acids | ||||
| Acetic acid | 3.81 | 6.72 | 1.98 | 3.4 |
| Citric acid | 16.69 | 33.76 | 5.62 | 6.0 |
| Formic acid | 2.31 | 7.63 | 1.07 | 7.1 |
| Lactic acid | 1.40 | 3.13 | 0.45 | 6.9 |
| Malic acid | 4.91 | 13.69 | 0.09 | 152.0 |
| Succinic acid | 2.20 | 5.75 | 0.53 | 10.9 |
| Carbohydrates | ||||
| Glucose | 53.53 | 165.35 | 13.22 | 12.5 |
| Raffinose | 153.83 | 249.74 | 88.90 | 2.8 |
| Sucrose | 1641.96 | 2119.21 | 1256.28 | 1.7 |
| Amino acids | ||||
| Ala | 6.24 | 9.06 | 2.88 | 3.1 |
| Asn | 20.96 | 32.51 | 10.04 | 3.2 |
| Asp | 10.59 | 16.77 | 2.28 | 7.4 |
| GABA | 1.46 | 3.20 | 0.45 | 7.1 |
| Ile | 0.53 | 1.56 | 0.20 | 7.9 |
| Phe | 1.59 | 3.83 | 0.56 | 6.9 |
| Pro | 35.22 | 70.66 | 7.04 | 10.0 |
| Tyr | 4.41 | 12.06 | 1.69 | 7.2 |
| Val | 1.42 | 2.66 | 0.73 | 3.6 |
| Miscellaneous metabolites | ||||
| Choline | 6.71 | 12.17 | 2.96 | 4.1 |
| Glycerophosphorylcholine | 12.35 | 29.30 | 6.82 | 4.3 |
| Glycerol | 99.92 | 273.71 | 16.55 | 16.5 |
| Trigonelline | 3.57 | 7.17 | 2.38 | 3.0 |
| Compound | Assignment 1 | Integral Label | 1H, (ppm) | Multiplicity: JH-H [Hz] |
|---|---|---|---|---|
| Campesterol + β-Sitosterol (CS) | CH3 | I1 | 0.68 | s |
| Stigmasterol (ST) | CH3 | I2 | 0.70 | s |
| Linolenic acid | CH3 | I3 | 0.98 | t |
| All unsaturated fatty acids | CH2-CH=CH | I4 | 2.05–2.01 | m |
| Esterified fatty acids (EFA) | CH2-COOR | I5 | 2.31 | m |
| Free fatty acids (FFA) | CH2-COOH | I6 | 2.35 | t |
| Di- and triunsaturated fatty acids | CH=CH-CH2-CH=CH | I7 | 2.81–2.77 | t |
| Phosphatidylcholine (PC) | N(CH3)3 | I8 | 3.29–3.26 | s |
| 1-Monoacylglyceride (1-MG) | 3-CH2OH | I9 | 3.60 | dd [11.5; 5.8] |
| 2-Monoacylglyceride (2-MG) | 1,3-CH2OH | I10 | 3.84 | d [4.6] |
| 1,3-Diacylglyceride (1,3-DG) | 1,3-CH2OR | I11 | 4.18 | m |
| 1,2-Diacylglyceride (1,2-DG) | 1-CH2OR | I12 | 4.24 | dd [12.0; 5.7] |
| Triacylglyceride (TG) | 1,3-CH2OR | I13 | 4.29 | dd [12.0; 4.3] |
| Metabolite 1 | Mean | Maximum | Minimum | Max/Min |
|---|---|---|---|---|
| CS | 1.20 | 1.40 | 1.03 | 1.4 |
| ST | 0.05 | 0.08 | 0.04 | 2.1 |
| PUFA | 0.54 | 0.72 | 0.25 | 2.8 |
| DUFA | 54.26 | 62.54 | 37.31 | 1.7 |
| MUFA | 25.25 | 31.37 | 15.95 | 2.0 |
| SFA | 19.95 | 32.01 | 13.35 | 2.4 |
| FFA | 46.09 | 78.88 | 26.46 | 3.0 |
| PC | 1.43 | 2.03 | 0.50 | 4.0 |
| 1-MG | 2.52 | 5.41 | 0.81 | 6.7 |
| 2-MG | 0.10 | 0.24 | 0.03 | 7.2 |
| 1,3-DG | 3.40 | 5.00 | 1.91 | 2.6 |
| 1,2-DG | 1.31 | 1.92 | 0.74 | 2.6 |
| TG | 52.17 | 75.92 | 17.50 | 4.3 |
| Metabolite | Y | V | S | YxV | YxS | VxS | YxVxS |
|---|---|---|---|---|---|---|---|
| Acetic acid | * | ||||||
| Citric acid | *** | *** | *** | *** | * | ||
| Formic acid | *** | ** | * | ||||
| Lactic acid | * | ||||||
| Malic acid | *** | ** | * | ** | |||
| Succinic acid | *** | * | * | ||||
| Glucose | *** | *** | * | *** | ** | ||
| Raffinose | *** | *** | |||||
| Sucrose | *** | *** | *** | * | *** | ||
| Ala | *** | ** | * | ||||
| Asn | *** | * | * | ||||
| Asp | *** | *** | * | ||||
| GABA | *** | *** | *** | ||||
| Ile | *** | *** | * | ||||
| Phe | *** | *** | * | ||||
| Pro | *** | * | *** | *** | *** | ||
| Tyr | *** | *** | * | ** | *** | ||
| Val | *** | ** | *** | ** | |||
| Choline | *** | * | ** | ||||
| GPCholine | * | ** | |||||
| Glycerol | ** | ** | *** | ||||
| Trigonelline | *** | *** | |||||
| CS | *** | *** | |||||
| ST | * | ** | |||||
| PUFA | * | ** | |||||
| DUFA | *** | *** | ** | * | |||
| MUFA | *** | ** | * | ||||
| SFA | *** | * | |||||
| FFA | ** | *** | * | ||||
| PC | * | * | ** | ||||
| 1-MG | |||||||
| 2-MG | |||||||
| 1,3-DG | *** | ||||||
| 1,2-DG | *** | ** | |||||
| TG | *** | *** | *** |
Disclaimer/Publisher’s Note: The statements, opinions and data contained in all publications are solely those of the individual author(s) and contributor(s) and not of MDPI and/or the editor(s). MDPI and/or the editor(s) disclaim responsibility for any injury to people or property resulting from any ideas, methods, instructions or products referred to in the content. |
© 2024 by the authors. Licensee MDPI, Basel, Switzerland. This article is an open access article distributed under the terms and conditions of the Creative Commons Attribution (CC BY) license (https://creativecommons.org/licenses/by/4.0/).
Share and Cite
Sobolev, A.P.; Acciaro, E.; Milutinović, M.; Božunović, J.; Aničić, N.; Mišić, D.; Mattoo, A.K. Maize Grain Metabolite Profiling by NMR: Effects of Growing Year, Variety, and Cropping System. Molecules 2024, 29, 4097. https://doi.org/10.3390/molecules29174097
Sobolev AP, Acciaro E, Milutinović M, Božunović J, Aničić N, Mišić D, Mattoo AK. Maize Grain Metabolite Profiling by NMR: Effects of Growing Year, Variety, and Cropping System. Molecules. 2024; 29(17):4097. https://doi.org/10.3390/molecules29174097
Chicago/Turabian StyleSobolev, Anatoly Petrovich, Erica Acciaro, Milica Milutinović, Jelena Božunović, Neda Aničić, Danijela Mišić, and Autar K. Mattoo. 2024. "Maize Grain Metabolite Profiling by NMR: Effects of Growing Year, Variety, and Cropping System" Molecules 29, no. 17: 4097. https://doi.org/10.3390/molecules29174097